Abstract
Defining the cellular response to pharmacological agents is critical for understanding the mechanism of action of small molecule perturbagens. Here, we developed a 96-well-plate-based high-throughput screening infrastructure for quantitative proteomics and profiled 875 compounds in a human cancer cell line with near-comprehensive proteome coverage. Examining the 24-h proteome changes revealed ligand-induced changes in protein expression and uncovered rules by which compounds regulate their protein targets while identifying putative dihydrofolate reductase and tankyrase inhibitors. We used protein–protein and compound–compound correlation networks to uncover mechanisms of action for several compounds, including the adrenergic receptor antagonist JP1302, which we show disrupts the FACT complex and degrades histone H1. By profiling many compounds with overlapping targets covering a broad chemical space, we linked compound structure to mechanisms of action and highlighted off-target polypharmacology for molecules within the library.
Small molecule modulators affect their target proteins through several mechanisms. Deconvoluting the mechanisms of action (MOA) for these biologically active molecules can lead to better therapeutic interventions. Though targeted approaches can assess the effects of specific compounds on selected signaling pathways and cellular processes, systems-level profiling is required to define MOA for drugs and tool compounds. Thus far, large-scale characterization of drug MOA has employed mostly RNA quantification via relatively high-throughput, low-cost sequencing technologies. For example, the Connectivity Map (CMAP) project developed the L1000 RNA-sequencing platform to quantify the 978 most descriptive transcripts1. The CMAP database contains around 30,000 small molecule perturbagens profiled in several cell lines, providing a rich resource for discovery of compound MOA. However, most United States Food and Drug Administration (FDA)-approved drugs target proteins, and the steady-state correlation among RNA and protein levels is limited at best2–4, suggesting that protein-level changes will provide the most proximal—and relevant—readout of compound action.
Recently several high-throughput mass spectrometry (MS) methods to characterize compound MOA have been employed to enhance our understanding of chemical perturbagen-induced changes in protein expression. These include targeted quantification of selected phosphorylation events and histone modifications5,6 and untargeted approaches to survey proteome remodeling7,8. Proteome-wide drug screening efforts have not yet achieved comprehensive proteome depth, often due to single-shot approaches that increase the throughput of label-free experiments9. Whereas this increased throughput comes at the expense of proteome depth10,11, multiplexing of compound-treated proteomes using isobaric labeling can offset this12,13. However, no isobaric-labeling-based high-throughput, low-input proteomics platform exists, limiting most existing resources of protein-level changes to relatively few compounds. Indeed, no existing resources of small-molecule-induced changes in protein expression have screened more than 80 compounds.
Here we quantify ‘proteome fingerprints’ depicting proteome-wide effects of 875 small molecule perturbagens as a resource for MOA deconvolution and compound repurposing, including a companion website for data exploration (gygi.med.harvard.edu/DeepCoverMOA). The 875 compounds screened herein include modulators of half the targetable proteome, thus revealing those portions of the HCT116 proteome most responsive to chemical perturbagens. This resource, spanning a library tenfold larger than previously achieved, highlights how deep proteome profiling uncovers previously unappreciated nuance in how the proteome responds to pharmacological agents. We provide the largest resource for evaluating the frequency and specificity of ligand-induced changes in target protein regulation, demonstrating that 15% of compounds modulate their target protein’s abundance. We used the depth of our screen to appreciate polypharmacology of the FDA-approved poly (ADP-ribose) polymerase (PARP) inhibitor talazoparib, revealing off-target proteins with high confidence. We show that many widely used tool compounds and clinically relevant small molecule inhibitors have myriad unanticipated proteome-level effects. Analysis of these unexpectedly active compounds uncovered a family of structurally related small molecules, including PAC-1, currently in clinical trials, whose activity is driven by iron chelation. Finally, we highlight the activity of JP1302—an adrenergic receptor antagonist that inhibits transcription through several mechanisms including degradation of linker histone H1. This resource will inform drug discovery and reveal fundamental, recurring patterns of protein coexpression following pharmacological perturbation.
Results
A platform for comprehensive proteome analysis of drug MOA
Our overarching goals were to understand how modulators of different classes of proteins affect proteome remodeling, to draw conclusions about the activities of distinct chemical scaffolds and to appreciate the effects of understudied compounds. Achieving these goals necessitated the use of a large screening library that covered a broad chemical space and included redundancies in the annotated targets. Though proteomics has traditionally been ill-suited to large-scale work, recent developments, including sample multiplexing, have begun to make higher-throughput proteomics feasible. Building upon previous cell line work4,14,15, we miniaturized our tandem mass tag (TMT) workflow to allow integration with 96-well-plate-based small-molecule screening infrastructure. Small molecules (875) were transferred in biological triplicate to HCT116 cells growing at less than 50% confluence in 96-well plates. Cells were incubated with screening compound (10 μM), dimethylsulfoxide (DMSO) or a positive control compound for 24 h before lysis, tryptic digestion and labeling with TMT11-plex sample multiplexing reagents. One replicate plate was used to screen for toxic compounds, which were removed and replaced with additional replicates of the positive control compound (Extended Data Fig. 1). Toxic compounds were rescreened at lower concentrations and included in separate 11-plex experiments. Among 875 library members, 754 (86%) were screened in biological duplicate, all using real-time-search-mediated synchronous precursor selection– MS3 (SPS–MS3) quantitation to maximize accuracy while maintaining depth of proteome coverage16–19. In 172 separate 11-plex experiments—totaling 2,176 LC-MS runs and around 4,400 hours of instrument time—more than 11 million high-quality peptide quantification events were acquired. With over 800 proteome profiles acquired in duplicate, this is the largest isobaric labeling study to date and represents, to our knowledge, the first deployment of isobaric-labeling-enabled proteome profiling in the context of 96-well-plate-based cellular screening.
The screening library ultimately selected for this work is comprised of 875 small molecules that, when all known targets are included, target 914 proteins that constitute approximately half of the targetable proteome20 (Fig. 1 and Extended Data Fig. 1b). The library includes compounds across all stages of clinical development, ranging from highly cited FDA-approved drugs to largely undescribed chemical tools (Fig. 1b and Extended Data Fig. 1a). Nearly 700 compounds share primary or secondary targets with other library members, allowing for interpretation of both target-induced proteome fingerprints and off-target polypharmacology (Extended Data Fig. 1c). Further discussion of these initial considerations are included in Supplementary Note 1.
Fig. 1 |. A 96-well-plate-based platform for comprehensive proteome analysis of drug MOA.
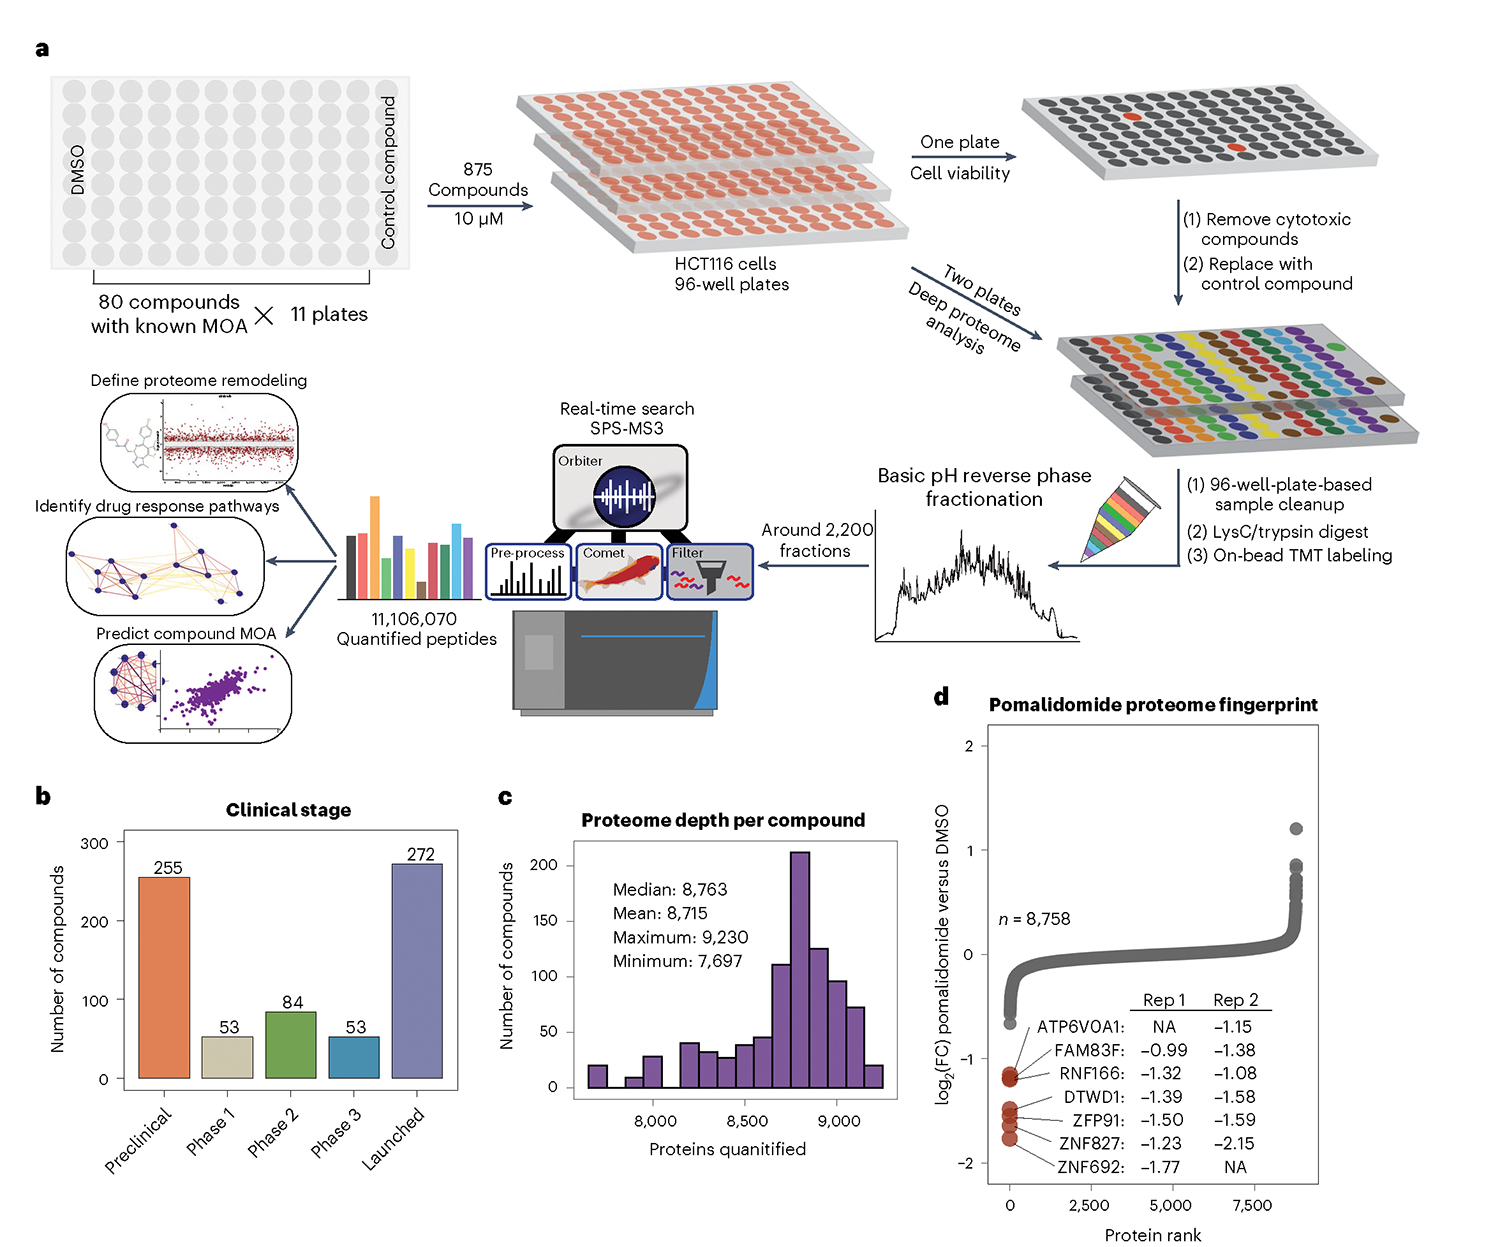
a, Overview of screening scheme, starting with HCT116 cells growing in 96-well plates. Deep proteome analysis in duplicate is performed using TMT sample multiplexing after 24-h treatments. b, Clinical stage of compounds from the MOA library at time of annotation. c, Proteome depth for each of the 875 compounds in the dataset. d, Representative proteome fingerprint for the molecular glue pomalidomide showing replicate measurements for downregulated proteins—displayed as log2(FC) (pomalidomide versus DMSO).
With this workflow, we achieved deep proteome coverage, quantifying a median of 8,863 proteins per compound out of 9,960 observed proteins (89% coverage per compound; Fig. 1c). Data completeness was excellent, with around 8,900 proteins quantified in at least half of the library (438 compounds; Extended Data Fig. 1j). Protein quantification across biological replicates was reproducible, with just 1% of 5.5 million replicate protein-compound measurement pairs differing by more than a log2(fold change (FC)) of 0.5 (compound versus DMSO) (Extended Data Fig. 1f). The control compound, which dramatically rewires the proteome, was included 55 times across the dataset, or approximately once in every three TMT groups. The median coefficient of variation (%CV) for protein measurements was 8.8% across all 55 replicates of the control compound, and 6.8% after merging two biological replicates (Extended Data Fig. 1i). The median Pearson correlation (r) for biological replicates of the control compound was 0.87, with no obvious outliers after averaging two replicates. These results highlight both the reproducibility of these measurements and the benefit of including and averaging protein measurements from biological replicates (Extended Data Fig. 1g–i).
Each proteome profile encodes specific protein-level changes that follow each compound treatment. For the thalidomide-derived immunomodulatory drug (IMiD), pomalidomide, we see direct evidence of its known mechanism of action, in which it degrades several proteins by forming a ternary complex with CRBN21. While the transcription factors IKZF1 and IKZF3 that mediate the therapeutic effects of IMiDs in multiple myeloma22 are not expressed in HCT116 cells, several other known neosubstrates23,24, including several transcription factors, were downregulated with minimal variance between replicates (Fig. 1d).
The proteome is dynamically regulated by small molecules
Each compound interacts with one or more protein targets and induces proteome-level changes via common and perturbagen-specific modulations of cellular processes that reflect its MOA. These perturbagen-induced abundance changes vary in magnitude from protein to protein. Thus, regulation events were defined by two criteria: (1) a twofold change versus DMSO or (2) a five standard deviation change of protein expression relative to the mean change for that protein across all compounds. Leveraging the large number of compounds screened allowed us to appreciate proteins with varying response magnitudes and to identify situations where small FCs are noteworthy. We found that even low-magnitude regulation events are reproducible, with small molecules from the same class inducing nearly identical FC magnitudes (Extended Data Fig. 2a,b).
Using these criteria, we determined that over half the quantifiable proteome varied by at least twofold with one or more compounds, while 98% of proteins quantified showed a change in abundance of five standard deviations by one or more compounds (Fig. 2a). In addition, over 4,000 proteins were highly (greater than twofold) downregulated by at least one compound, revealing many potential ligand-induced degradation events. Overall, we uncovered 141,786 regulation events, less than 2% of the 7.63 million protein measurements in the dataset (Fig. 2b).
Fig. 2 |. Most of the proteome is accessible to regulation by small molecules.
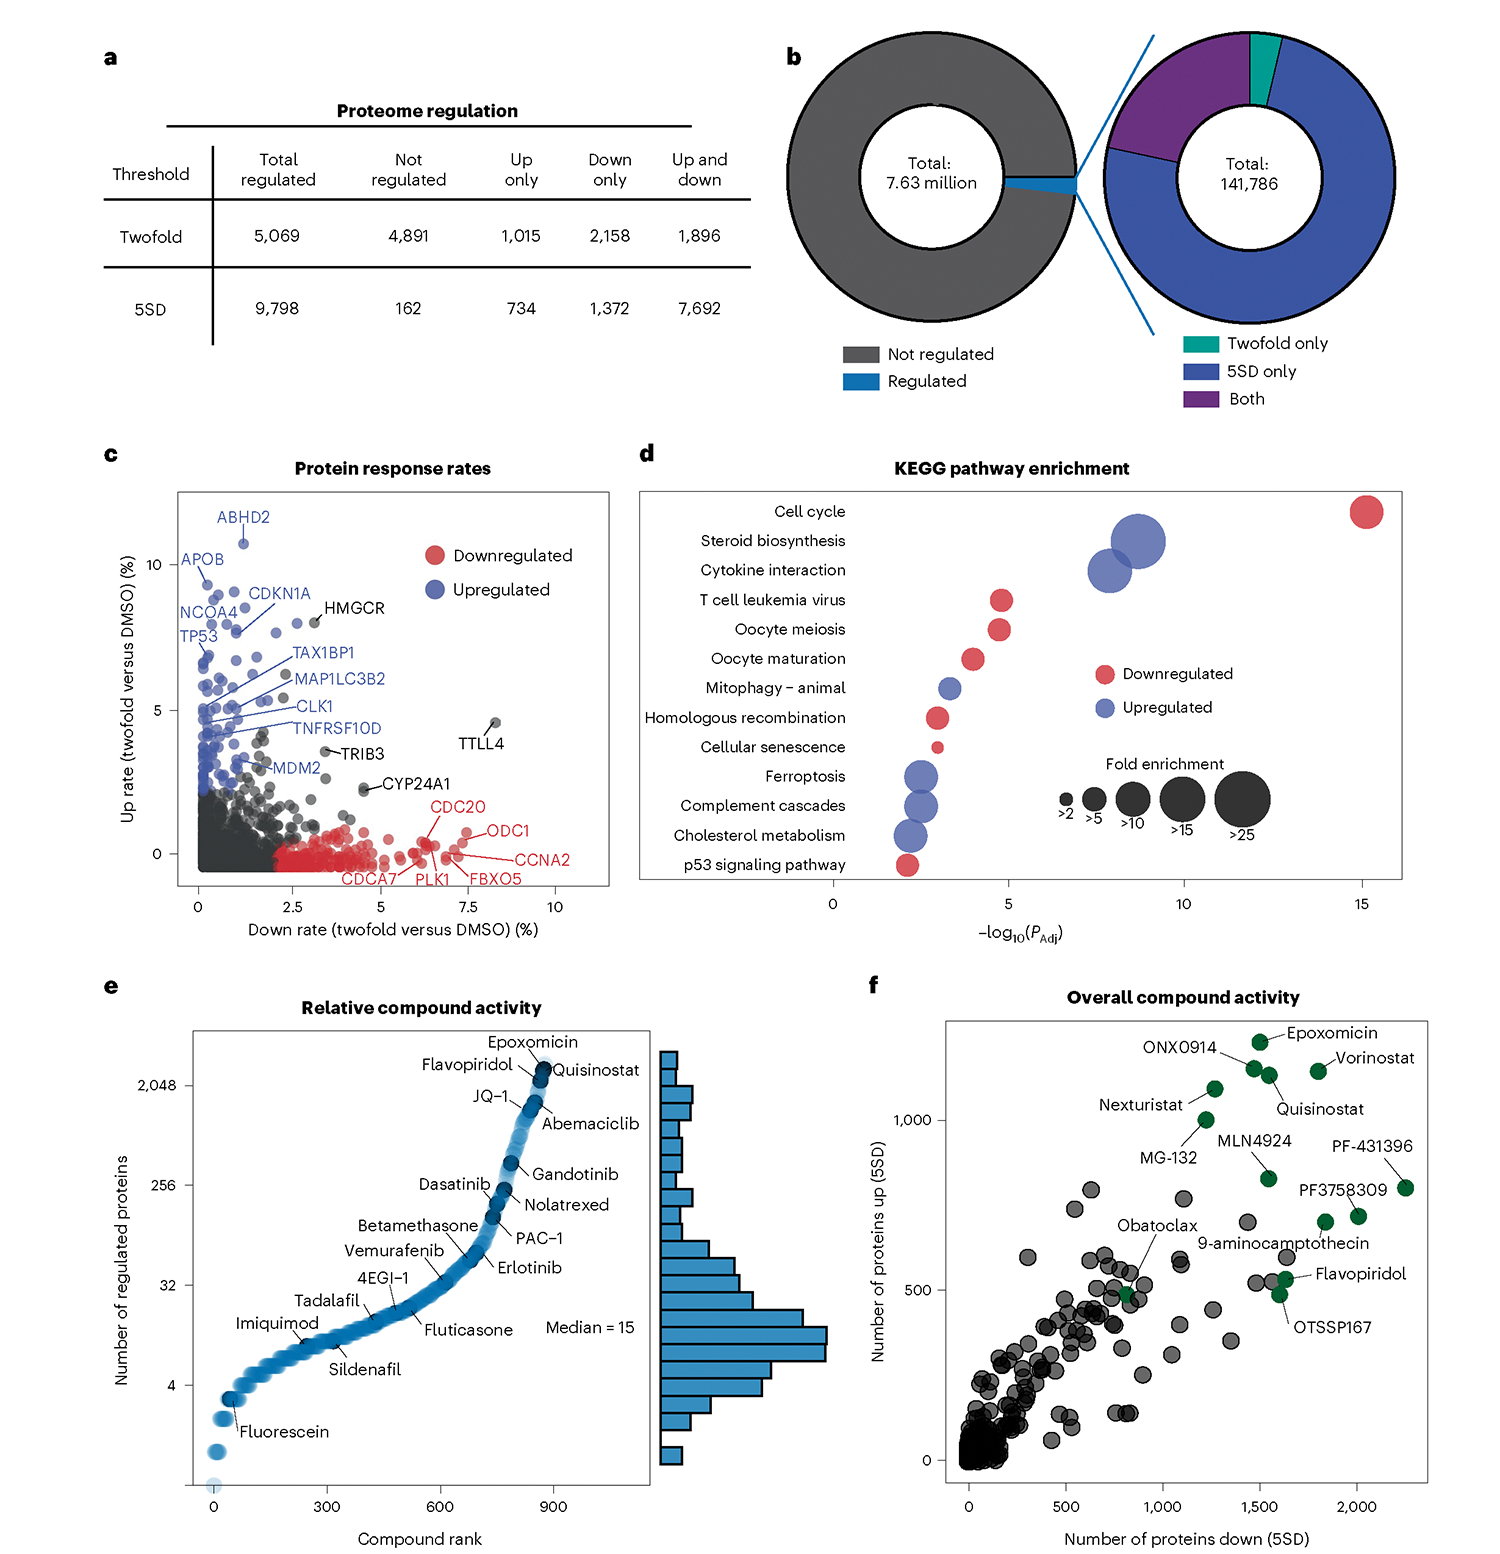
a, Statistics for protein-level regulation using two significance thresholds: 5SD and twofold change (compound versus DMSO). Regulated proteins were perturbed by one or more compounds in the dataset. b, Breakdown of all regulated events by a 5SD change, a twofold change or both. Around 1.9% of all 7.6 million protein measurements were regulated events. c, Rate at which proteins increased by twofold (n = 97) versus decreased (n = 213) by twofold. Only proteins quantified in at least half of compounds are shown (n = 8,860). Change rate is calculated by taking the number of compounds affecting expression by twofold and dividing by the number of compounds where the protein was quantified. d, KEGG pathway enrichment analysis from c. e, Compound-level waterfall plot highlighting the number of regulated proteins (by 5SD and/or twofold change) for each compound. f, Activity of each compound measured by the number of proteins decreased (x axis) and increased (y axis) by 5SD 24 h after treatment.
We then identified proteins that respond to perturbagen treatment with unusual frequency and are often associated with common drug resistance or stress coping pathways. We found a striking propensity for frequently responding proteins to change in only one direction (Fig. 2c and Extended Data Fig. 2d). Preferentially upregulated proteins were enriched with members of the steroid biosynthesis, cytokine–cytokine receptor interaction, mitophagy and ferroptosis pathways, suggesting that HCT116 cells overcome exogenous stressors through upregulation of autophagy and sterol metabolism. Likewise, downregulated proteins were enriched with proteins from several cell-cycle-related pathways, including p53 signaling, suggesting that these cells often respond to perturbagen-induced stress via cell cycle arrest (Fig. 2d).
We next ranked compounds based on the number of proteins each regulated, finding that the median compound altered expression of 15 proteins. The most active compounds regulate up to 25% of the observable proteome and include inhibitors of important cellular processes such as proteasomal degradation, transcription and histone acetylation. Many compounds induced a balance of up- and downregulated proteins, unexpectedly including proteasome inhibitors MG132, ONX0914 and epoxomicin. However, ranking compound activity instead by the number of proteins with large (greater than twofold) changes revealed proteome responses better aligned with expectations, with proteasome inhibitors largely inducing protein upregulation and transcription inhibitors inducing protein downregulation (Extended Data Fig. 2d). Although their numbers and directionality sometimes defied expectations, small-magnitude protein regulation events are nevertheless consistent between biological replicates and among compounds of the same class, supporting their use for interpretation of compound activity (Extended Data Fig. 2b).
Regulation of target proteins informs compound MOA
Ligand-induced changes in protein expression have come to the forefront of drug discovery with the emergence of molecular glues and PROTAC degraders as promising classes of therapeutics. Conversely, pharmacologic upregulation of a target protein may drive drug resistance25 through relief or suppression of negative and positive feedback loops26,27. Despite the therapeutic importance of small-molecule-induced changes in target protein expression, the phenomenon remains poorly understood, though several studies have attempted to address this by mining RNA expression datasets28,29. A recent proteome-wide drug perturbation study suggests that around 25% of drugs and tool compounds regulate expression of their target protein, though the library studied was skewed towards highly active compounds targeting proteins in commonly perturbed pathways9.
We identified approximately half of the annotated primary targets for the 875 compounds in our dataset and 90% of target proteins were quantified in the 11-plex containing the compound of interest (Fig. 3a and Extended Data Fig. 3b). For this analysis we also included one additional secondary target for each compound, where applicable, yielding 541 compound-target pairs. We found that 15% of compounds regulate the expression of their target proteins (Fig. 3b and Extended Data Fig. 3a) by a median of around 1.56-fold, with upregulation occurring more frequently than downregulation (Extended Data Fig. 3e). Even small-magnitude regulation events (FC less than twofold, greater than five standard deviations (5SD)) were reproducible across overlapping classes of compounds (Extended Data Fig. 3f).
Fig. 3 |. Regulation of target proteins by small molecules informs compound MOA.
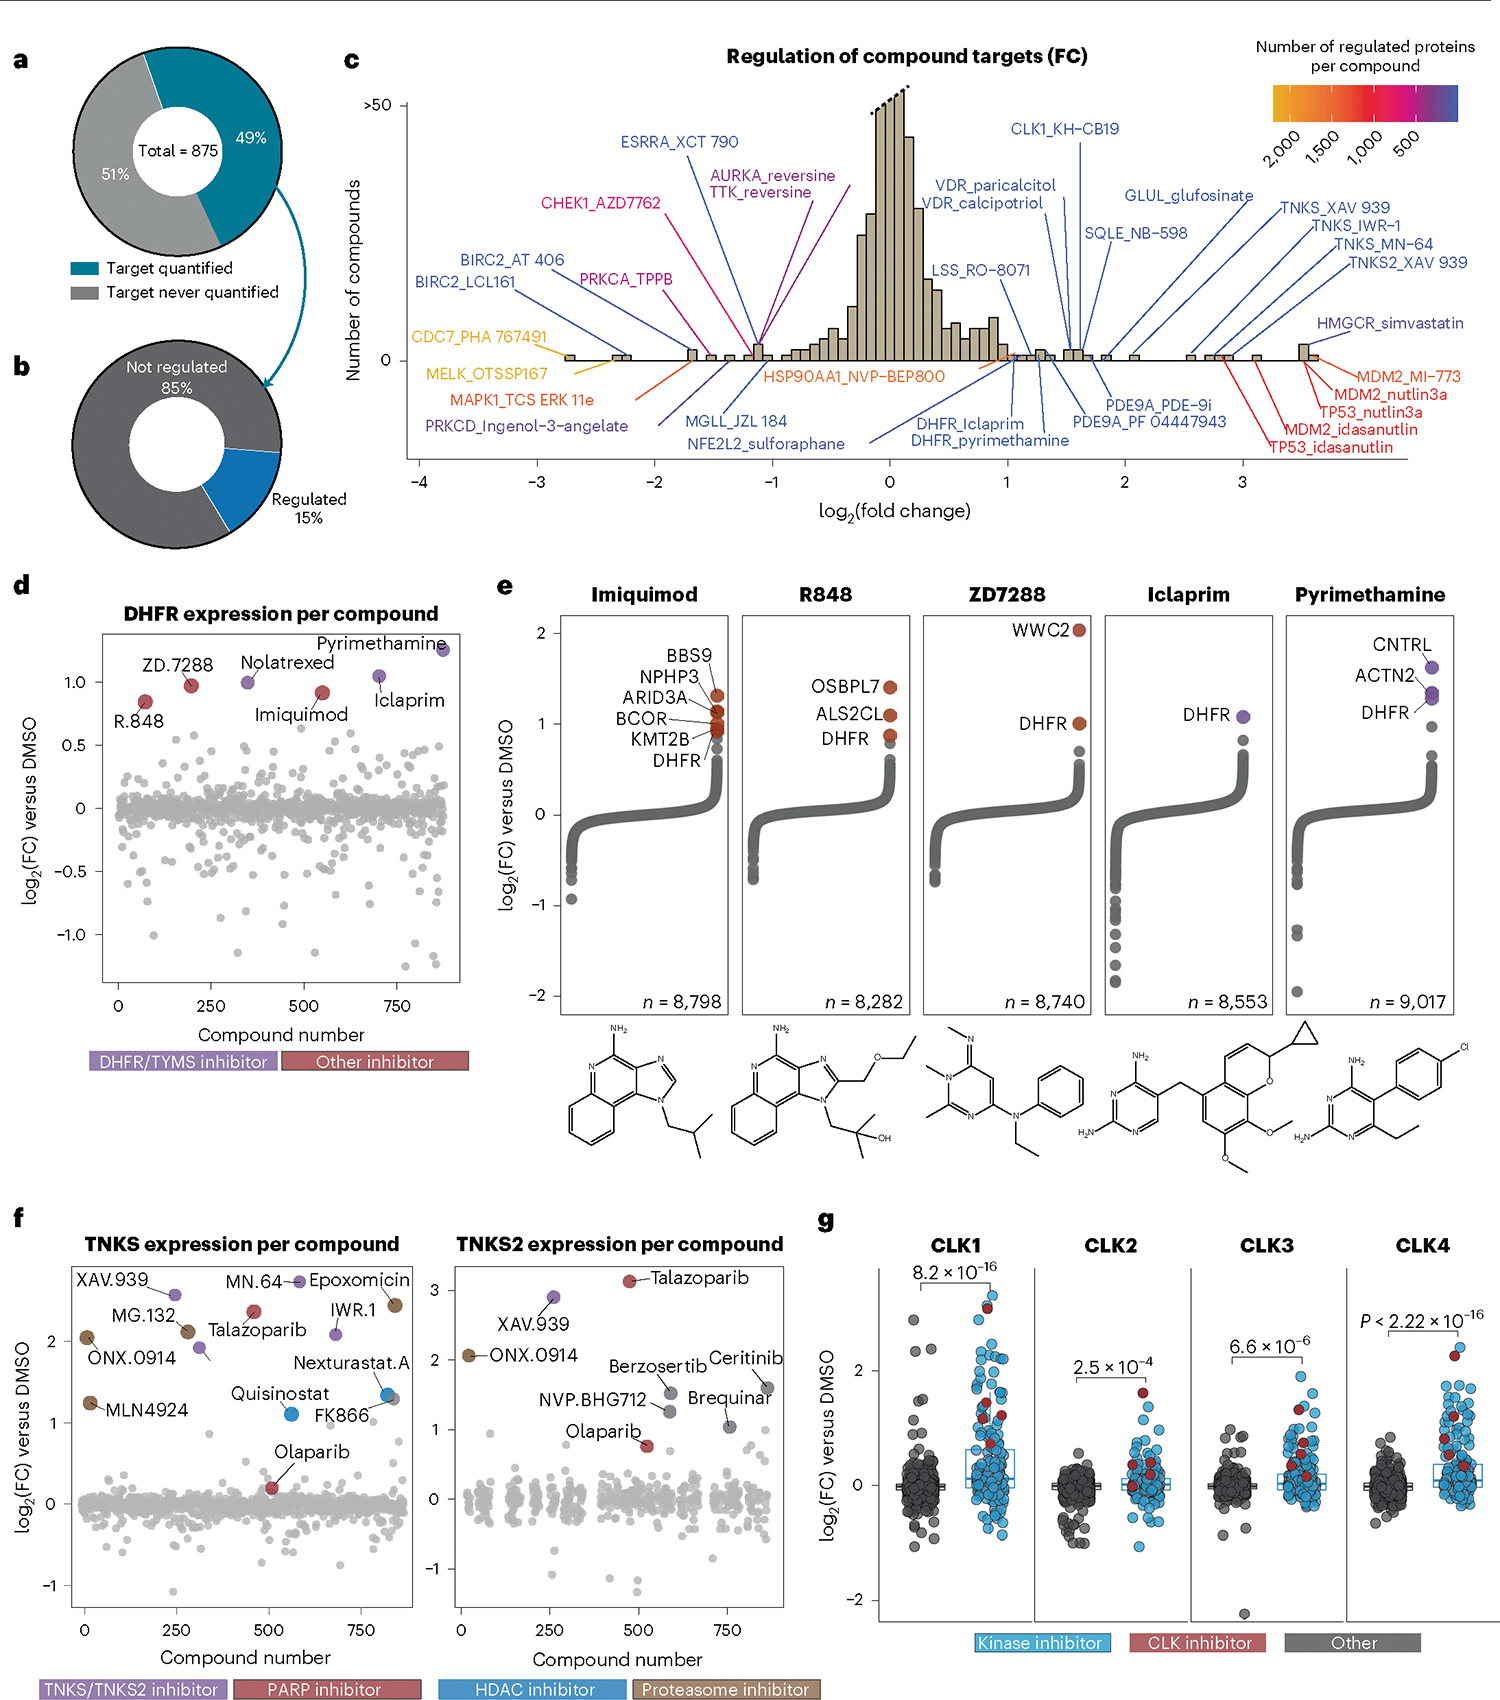
a, Proportion of primary targets identified in this dataset. b, Proportion of primary and first secondary, if applicable, targets regulated by 5SD or twofold, n = 541. c, Histogram of compounds that regulate their target protein (primary and one secondary target) by twofold versus DMSO. Annotations are ‘TargetGene_CmpdName,’. d, Expression of DHFR for all 875 compounds. Those that increase DHFR expression are highlighted. e, Protein expression of all quantified proteins for compounds highlighted in d. f, Expression of TNKS/TNKS2 for all compounds, colored by inhibitor class. g, CLK1, CLK2, CLK3 and CLK4 expression across the dataset. Reported P values were generated from unpaired, two-sided Wilcoxon test. For CLK1, n = 875; CLK2, n = 857; CLK3, n = 875; CLK4, n = 808. The center line represents the median, the upper and lower bounds of the box indicate the interquartile range (IQR, the range between the 25th and 75th percentiles) and whiskers extend to the highest and lowest values within 1.5 times the IQR.
Ligand-induced changes in protein expression were often observed for highly active compounds that regulate many other proteins in addition to their target(s) (Fig. 3c and Extended Data Fig. 3d). This suggests that many regulation events are indirect consequences of perturbing important cellular processes, not necessarily arising directly from ligand–target engagement. When several compounds targeted the same proteins, similar changes in target protein abundance were often observed. For instance, BRD4 inhibitors JQ-1, CPI-203 and birabresib, HSP90 inhibitors radicolol and NVP-BEP800, and nutlin-based MDM2 inhibitors regulated their targets to near identical levels, suggesting mechanism-specific regulation thresholds (Fig. 3c and Supplementary Fig. 3g,j). BRD4 abundance also increased upon treatment with PLK1 inhibitors BI-2536 and volasertib, probably reflecting shared PLK1 and BRD4-inhibitor-driven phenotypes30.
Though target protein expression was usually modulated by compounds inducing extensive proteome remodeling, some target proteins were regulated by compounds with narrower proteome-level effects, suggesting specific ligand-induced regulation or localized feedback. These specific changes in target protein abundance occurred with BIRC2, DHFR, VDR, PDE9A and TNKS inhibitors, among others (Fig. 3c). Regulation of these proteins was largely restricted to compounds directly targeting them, identifying these proteins as promising subjects for future MOA deconvolution (Extended Data Fig. 3j).
Leveraging reproducible compound-induced upregulation, we identified three compounds that upregulate DHFR with magnitude and specificity equivalent to iclaprim and pyrimethamine—both known DHFR inhibitors used clinically (Fig. 3d,e). These putative DHFR inhibitors—the imidazoquinoline-based TLR7 activators imiquimod, R848 (resiquimod) and the HCN channel blocker ZD7288—are structurally similar to diaminopyrimidine-containing DHFR inhibitors31. Antifolates such as methotrexate and nolatrexed are known to upregulate DHFR7,8 and served as positive controls (Extended Data Fig. 3h).
TNKS1/2 inhibitors reproducibly induced large FCs of PARP tankyrase-1/2 (TNKS and TNKS2), two related ADP ribosylases that influence several pathways including WNT signaling32. These proteins were also upregulated by proteasome and histone deacetylase (HDAC) inhibitors, as well as the PARP inhibitor talazoparib (Fig. 3f). While substantial crossover in cellular responses to PARP and TNKS inhibition is not surprising due to homology between their ribosylation domains, the other PARP inhibitor in the dataset, Olaparib, did not regulate TNKS or TNKS2. Moreover, the angiomotin family of proteins (AMOT, AMOTL1 and AMOTL2), which are regulated by TNKS through direct interaction and signal TNKS inhibition33, showed increased expression in cells treated with the three TNKS inhibitors and talazoparib, but not with olaparib treatment. These findings imply that, at 10 μM, talazoparib, but not olaparib, has off-target activity against TNKS/TNKS2, supporting previously reported in vitro half maximal inhibitory concentration (IC50) values of these compounds against a panel ADP ribosylases34.
Finally, we noticed frequent upregulation of dual specificity kinase CLK1 (Fig. 2c and Extended Data Fig. 2d). The entire family of CLK kinases is generally upregulated in cells treated with kinase inhibitors, including potent CLK inhibitors KH-CB-19 and mL167 (Fig. 3g). Among CLK kinases, CLK1 and CLK4 are most readily upregulated despite having relatively long halflives15. Experiments such as kinase enrichment beads, thermal stability assays, affinity pulldowns and crosslinking assays will aid in the understanding of direct versus indirect binding of these compounds to the CLK family of kinases.
MOA drives the organization of compound communities
We next used the entire proteome fingerprint database to generate MOA similarity networks by correlating proteome profiles for all possible compound pairs. After filtering the network to include only edges connecting compounds whose proteome-level effects correlated at a 0.1% false discovery rate (FDR)35, we formed a compound–compound correlation network containing 2,543 out of 382,375 possible edges (Fig. 4a). Of 875 compounds, 295 had at least one significant correlation to another compound, where the correlations were calculated with a median of 8,315 common proteins between each pair of compounds (Extended Data Fig. 4a). From this network, we identified interconnected communities comprised of compounds with overlapping targets whose association reflects shared biology (Fig. 4b–h and Extended Data Fig. 4b). For example, one community grouped MDM2 and CDK4/6 inhibitors (Fig. 4b), probably because both classes induce G1 arrest36–38. CDK4/6 inhibitors palbociclib and ribociclib were present in this community, but not the more promiscuous abemaciclib39, which correlates poorly with palbociclib (Extended Data Fig. 4c,d). Pairwise correlation plots highlight that the nutlin-based MDM2 inhibitors idasanutlin and nutlin3a are influenced by the p53 transcriptional program (Fig. 4c).
Fig. 4 |. Mechanism of action drives compound community organization.
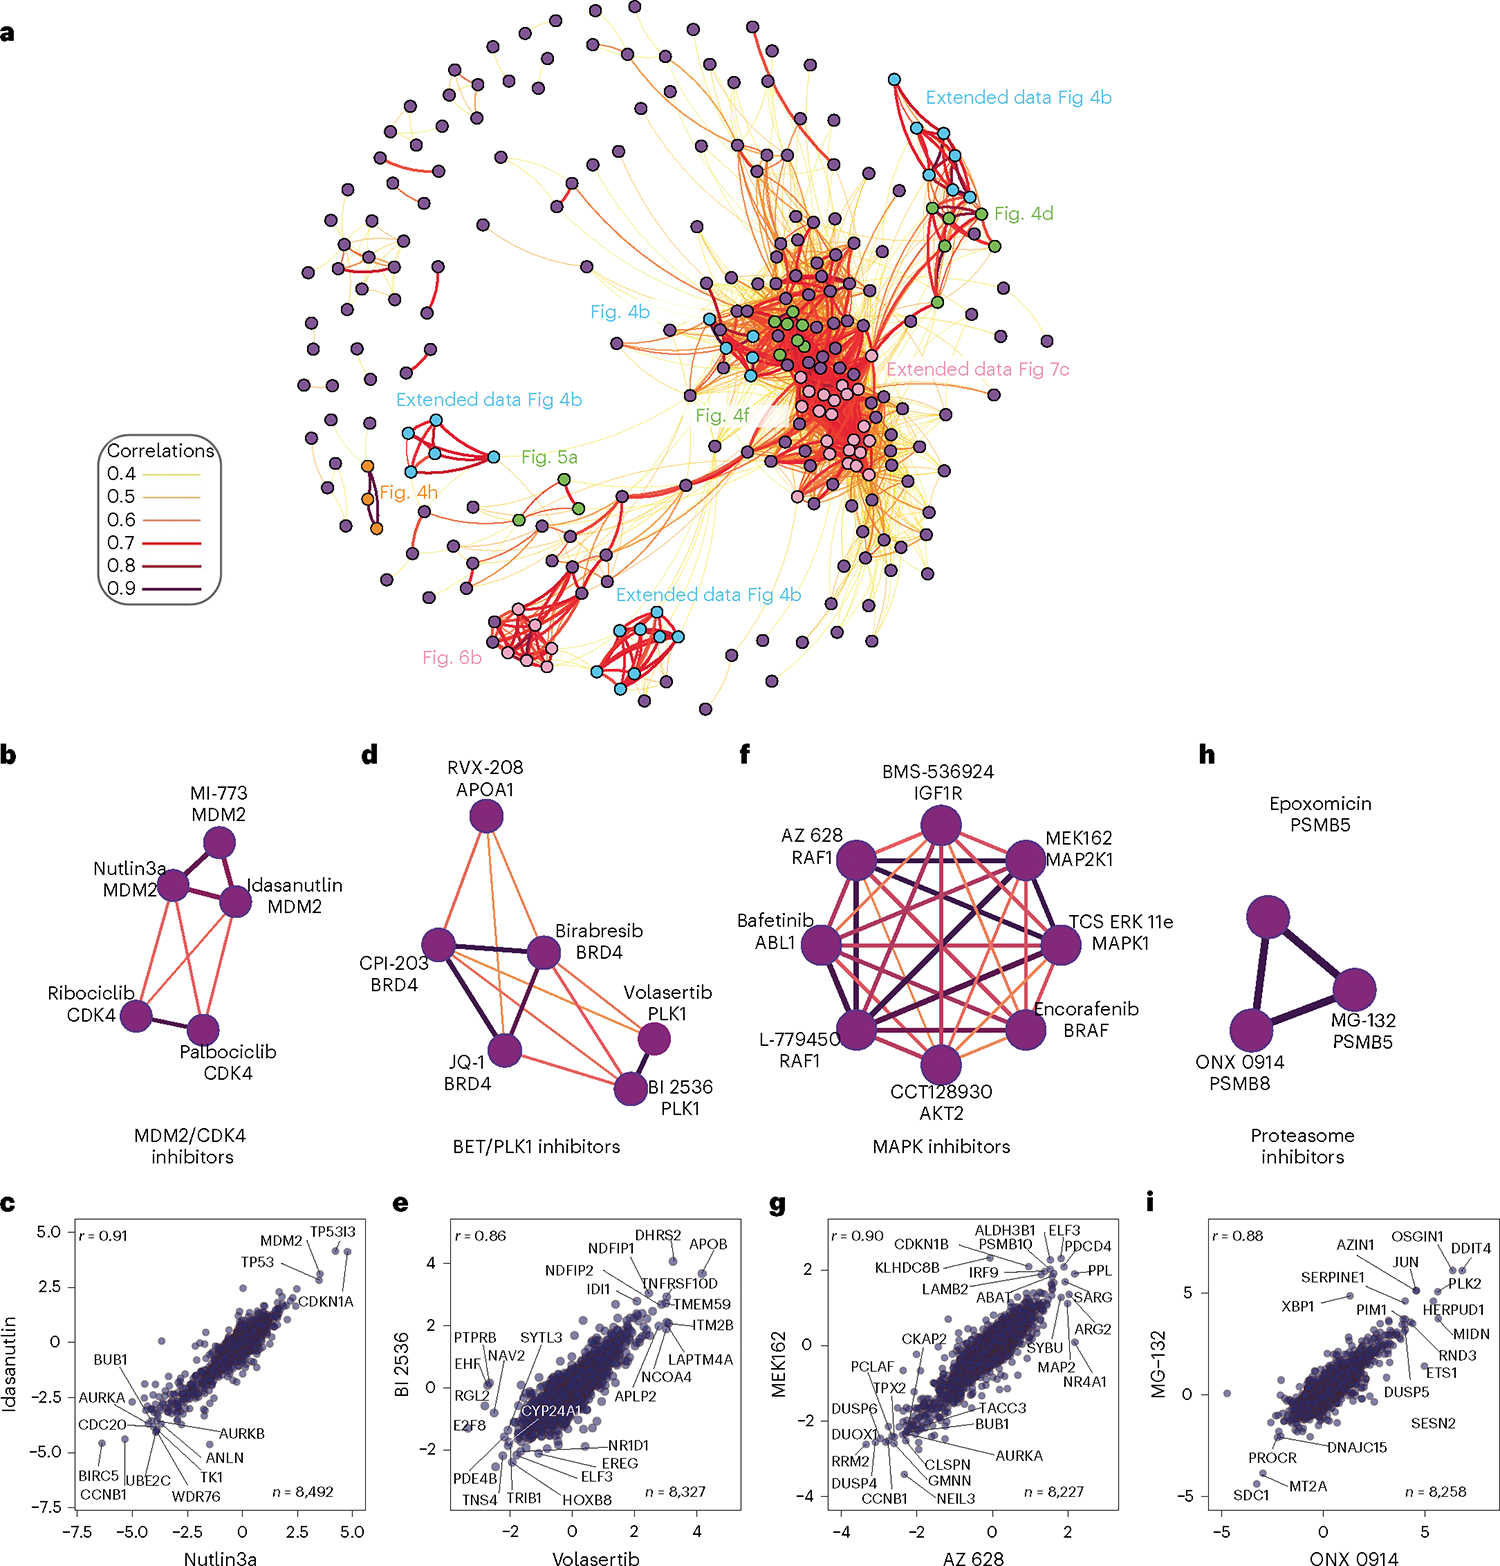
a, Community plot built from a compound–compound correlation matrix. b, Subcommunity of MDM2 and CDK4/6 inhibitors. All subcommunities are filtered to only include edges with r > 0.6. c, Pairwise correlation plot of the MDM2 inhibitors Idasanutlin and Nutlin3a. d, Subcommunity of BRD4 and PLK1 inhibitors. e, Pairwise correlation plot of the PLK1 inhibitors BI-2536 and volasertib. f, Subcommunity of compounds correlated to the RAF inhibitor L-779450 containing many inhibitors of the MAP kinase family. g, Pairwise correlation plot of the MAP kinase pathway inhibitors MEK126 and AZ628. h, Subcommunity of proteasome inhibitors. i, Pairwise correlation plot of MG132 and ONX0914—two strongly correlated proteasome inhibitors. For all pairwise correlation plots (c, d, g, i), all x and y axes are represented as log2(FC) (compound versus DMSO) with Pearson (r) reported.
We also found overlap among the proteomes of cells treated with the PLK1 inhibitors volasertib and BI-2536 (Fig. 4e) and the bromodomain and extraterminal (BET) inhibitors birabresib, CPI-203 and JQ-1, which inhibit BRD4 through interaction with both bromodomains (BD1 and BD2)40 (Fig. 4d). Strongly associated with this community was RVX-208—a BD2-selective BET inhibitor41 currently in clinical trials for treatment of cardiovascular disease42. While this community reflects strong overlap between PLK1 and BRD4-inhibitor treated proteomes (Extended Data Fig. 4f), the slight difference in RVX-208 MOA is apparent. Several MAPK inhibitors formed a tight community, with MEK inhibitor MEK162 and RAF inhibitor AZ628 the most highly correlated among this group (Fig. 4f,g). Finally, we noted a cluster of the three proteasome inhibitors from the library (Fig. 4h); pairwise correlation plots demonstrated that these inhibitors inhibit proteasomal degradation equivalently (Fig. 4i). These findings support network-level analysis of compound–compound correlation for deconvolution of compound MOA.
Protein–protein correlations reveal drug response pathways
We next generated a protein–protein correlation network, hypothesizing that proteins with shared functions would be coregulated by compounds with overlapping targets. Thus, we correlated relative expression profiles for all possible protein pairs and filtered the resulting Pearson correlation matrix to a 1% FDR35. The final network (Fig. 5a) contained 2,388 nodes (24% of all quantified proteins) and 35,936 edges (0.07% of 49,500,000 possible protein pairs).
Fig. 5 |. Protein–protein correlations highlight relationships between drug response pathways.
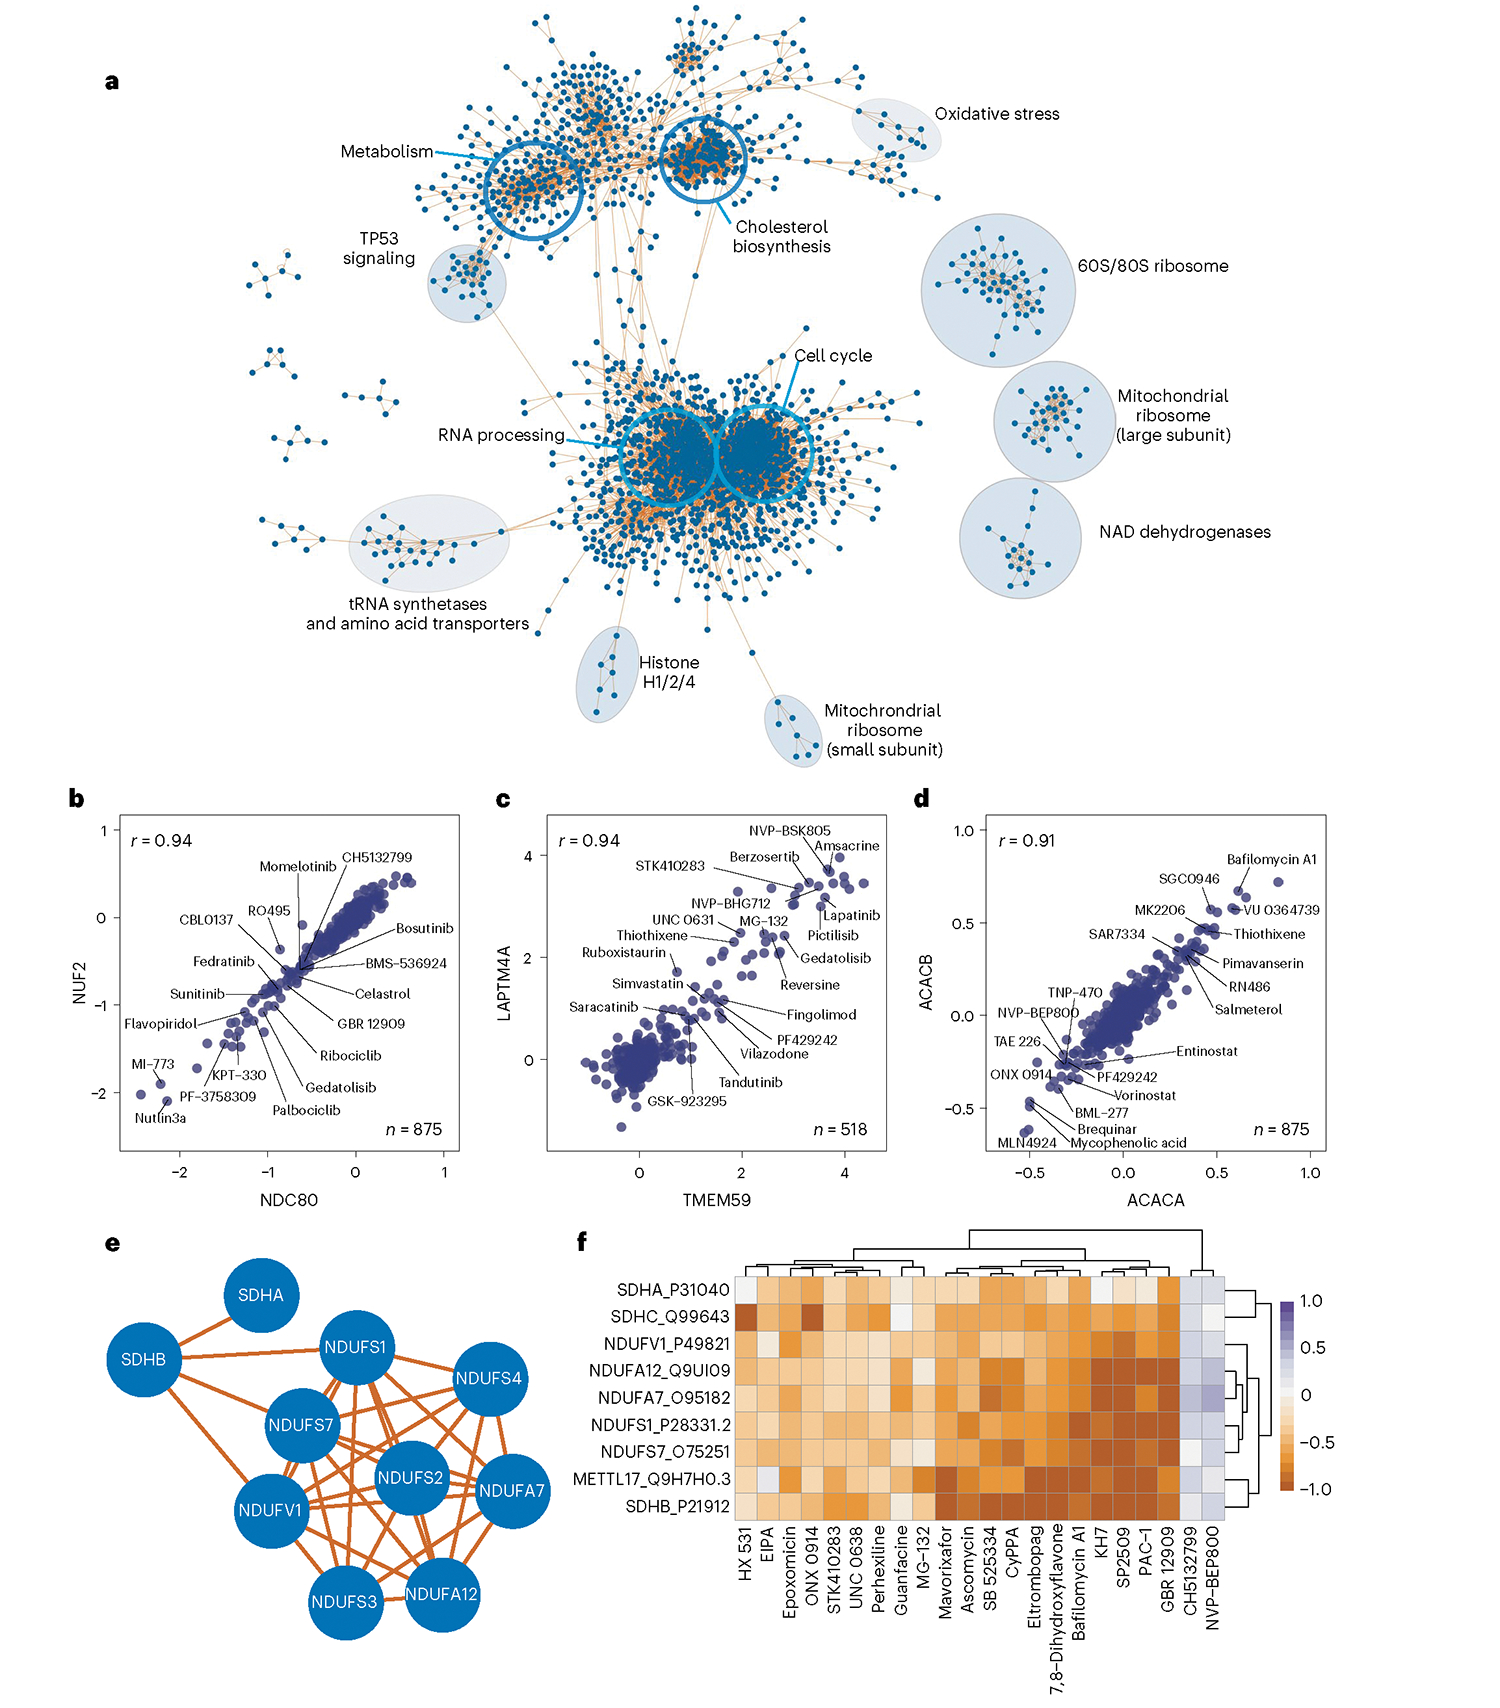
a, Community network of protein–protein correlations. Only positive correlations and communities larger than five members are included in this network. Open blue circles denote enriched GO molecular function GO categories for the proteins within the circle. Filled circles are annotated manually based on the composition of the proteins within the circle. b–d, Pairwise correlation plot of: b, kinetochore proteins NUF2 and NDC80, c, lysosomal protein LAPTM4A and autophagy regulator TMEM59, d, acetyl CoA carboxylase 1 (ACACA) and 2 (ACACB), with select compounds highlighted that affect the expression of each pair of proteins. All x and y axes are represented as log2(FC) (compound versus DMSO). Each point represents one compound. e, Subcommunity of correlated proteins, including several NAD and succinate dehydrogenases. f, Heatmap of protein expression for each protein in e for all compounds that increase or decrease their expression by a median log2(FC) of greater than 0.5 or less than −0.5.
Clustering of this protein–protein correlation network revealed protein communities organized by cellular function, as large clusters were enriched with proteins from cell cycle, RNA processing, metabolism and cholesterol biosynthesis molecular function ontologies. Extracting stronger protein correlations within these communities revealed organization of proteins into known complexes, including the kinetochore, whose subunits NDC80-NUF2 had the highest protein-level correlation in the dataset (Fig. 5b). Another community includes numerous cholesterol biosynthesis proteins alongside several highly correlated autophagy proteins, including TMEM59, which promotes LC3 activation through interaction with ATG16L1 (ref. 43). TMEM59 expression is associated strongly with that of lysosomal protein LAPTM4A—an association driven by known autophagy modulators bafilomycin A1, reversine, gedatolisib, lapatinib, amsacrine and pictilisib, among others44–46. These findings suggest further investigation into the role of LAPTM4A in autophagy.
Within the larger network we identified communities enriched with p53 signaling proteins, NAD dehydrogenases (NDUFs), tRNA synthetases and amino acid transporters, and oxidative stress proteins. Ribosomal proteins subdivided into two distinct communities corresponding to 80S and mitochondrial ribosomes, suggesting that these complexes are regulated independently by small molecules. Finally, correlation network analysis reveals functional associations even for proteins with small FC values relative to DMSO. For example, acetyl-CoA carboxylase 1 and 2 (ACACA and ACACB) correlate strongly, though neither protein achieves twofold regulation with any compound (Fig. 5d).
Pairwise plots for correlated proteins can highlight compounds that drive regulation of two highly related proteins. However, we can also define families of compounds that coregulate distinct protein communities. For example, correlated regulation of several NDUF and succinate dehydrogenase (SDHA) proteins is driven by around 20 compounds (Fig. 5e,f). Similarly, a community of oxidation-sensing proteins including heme oxygenase 1 (HMOX1) and thioredoxin reductase 1 (TXNRD1) correlates with cytochrome p450 monoxoygenase CYP4F11 due to effects of several nitro-containing compounds including 4-nitropiazthiole and PD-160170 (Extended Data Fig. 5c,d). These analyses highlight the power of this resource to define new members of known biological processes, and to identify the drugs and tool compounds that drive pathways and processes of interest.
Perturbagen-induced proteome fingerprints reveal drug mechanisms
A comprehensive proteome fingerprint does not exist for most drugs and tool compounds, making this dataset a rich resource for finding new and off-target mechanisms for library compounds. As such, we mined the compound–compound correlation network for communities containing molecules with unrelated targets. We observed three correlated compounds with no known overlapping targets: SP2506, PAC-1 and KH7, which are annotated as inhibitors of LSD1, CASP7 and ADCY10, respectively. Despite targeting different enzyme classes, the three compounds showed highly correlated proteome fingerprints in both the primary screen (Extended Data Fig. 6a) and with repurchased compounds (Extended Data Fig. 6b). As aroylhydrazones, these three compounds share a motif known to chelate metal cations like Fe(II)47,48. Indeed, proteins from iron-sulfur-binding molecular function ontologies were enriched among those downregulated by these chemically similar compounds. The strongly correlated proteome responses we observed in response to each structurally similar perturbagen suggest a common mechanism driven by iron sequestration, affecting the function of iron binding proteins and enzymes. This complements previous findings that question the target and accepted MOA of PAC-1 (refs. 49,50), which is in phase III clinical trials.
While compounds with overlapping targets and MOAs typically elicit similar protein-level responses and thus show high correlation (Fig. 4), we also find compounds whose proteome-level effects are inconsistent despite ostensibly targeting the same proteins. We focused on a clear-cut example of off-target biology by investigating two BTK inhibitors: FDA-approved ibrutinib and a potent, preclinical compound RN486 (refs. 51,52). Since HCT116 cells do not express BTK, ibrutinib induced few proteome changes, as expected. However, RN486 caused dramatic proteome remodeling, suggesting a non-BTK off-target (Extended Data Fig. 6d). Proteins upregulated by RN486 treatment were enriched for mitophagy, steroid biosynthesis and cytokine signaling Kyoto Encyclopedia of Genes and Genomes (KEGG) pathways53, while the lysosome was overrepresented among downregulated proteins (Extended Data Fig. 6e). Upregulation of autophagy markers coupled with a decrease in lysosomal proteins reveals dysregulation of autophagy as the main phenotype in RN486-treated cells, which is a common mechanism of many kinase inhibitors (Extended Data Fig. 7c).
Experiments using kinase affinity beads coupled to MS failed to uncover any kinases targeted by RN486 that would explain this unexpected activity (Extended Data Fig. 6f), suggesting that a nonkinase off-target mediates the effects of RN486. We then used the in-cell proteome integral solubility alteration assay (PISA), which uses ligand-induced changes in protein thermal stability to infer protein binding of a compound of interest54,55. While ibrutinib treatment altered the thermal stability of several kinases, putative targets of RN486 included many endoplasmic reticulum (ER) and mitochondrial proteins, including TEX264, a receptor that mediates ER-autophagy56,57 (Extended Data Fig. 6g). Further analysis of these targets is necessary to identify the mechanism by which RN486 affects the proteome.
JP1302 inhibits transcription
To test the utility of this dataset for MOA deconvolution, we separated compounds by target expression and identified several highly active compounds that target proteins not detected in HCT116 cells (Fig. 6a). Among these is JP1302, a poorly characterized compound based on a 9-aminoacridine scaffold, which is annotated as an alpha-adrenergic receptor antagonist58. Though ADRA2C is not detectable in HCT116 cells, JP1302 treatment induced a proteome fingerprint that correlates with several RNA transcription inhibitors (Fig. 6b). These correlated compounds include ATP-competitive CDK9 inhibitors flavopiridol, AZD5438 and PHA767491, which inhibit transcription elongation, in part, through downregulation of RNA polymerase II (Pol II) phosphorylation59. In this community, the compound correlated most strongly to JP1302 is the carbazole-derived CBL0137, which inhibits the FACT complex—a heterodimer of SSRP1 and SUPT16H that regulates RNA-transcription-associated nucleosomal DNA uncoiling and recovery60. In contrast, the closest structural analog to JP1302 among screened compounds is another 9-aminoacridine, the topoisomerase poison amsacrine, which has little correlation with JP1302.
Fig. 6 |. JP1302 blocks transcription through disruption of the FACT complex and histone H1.
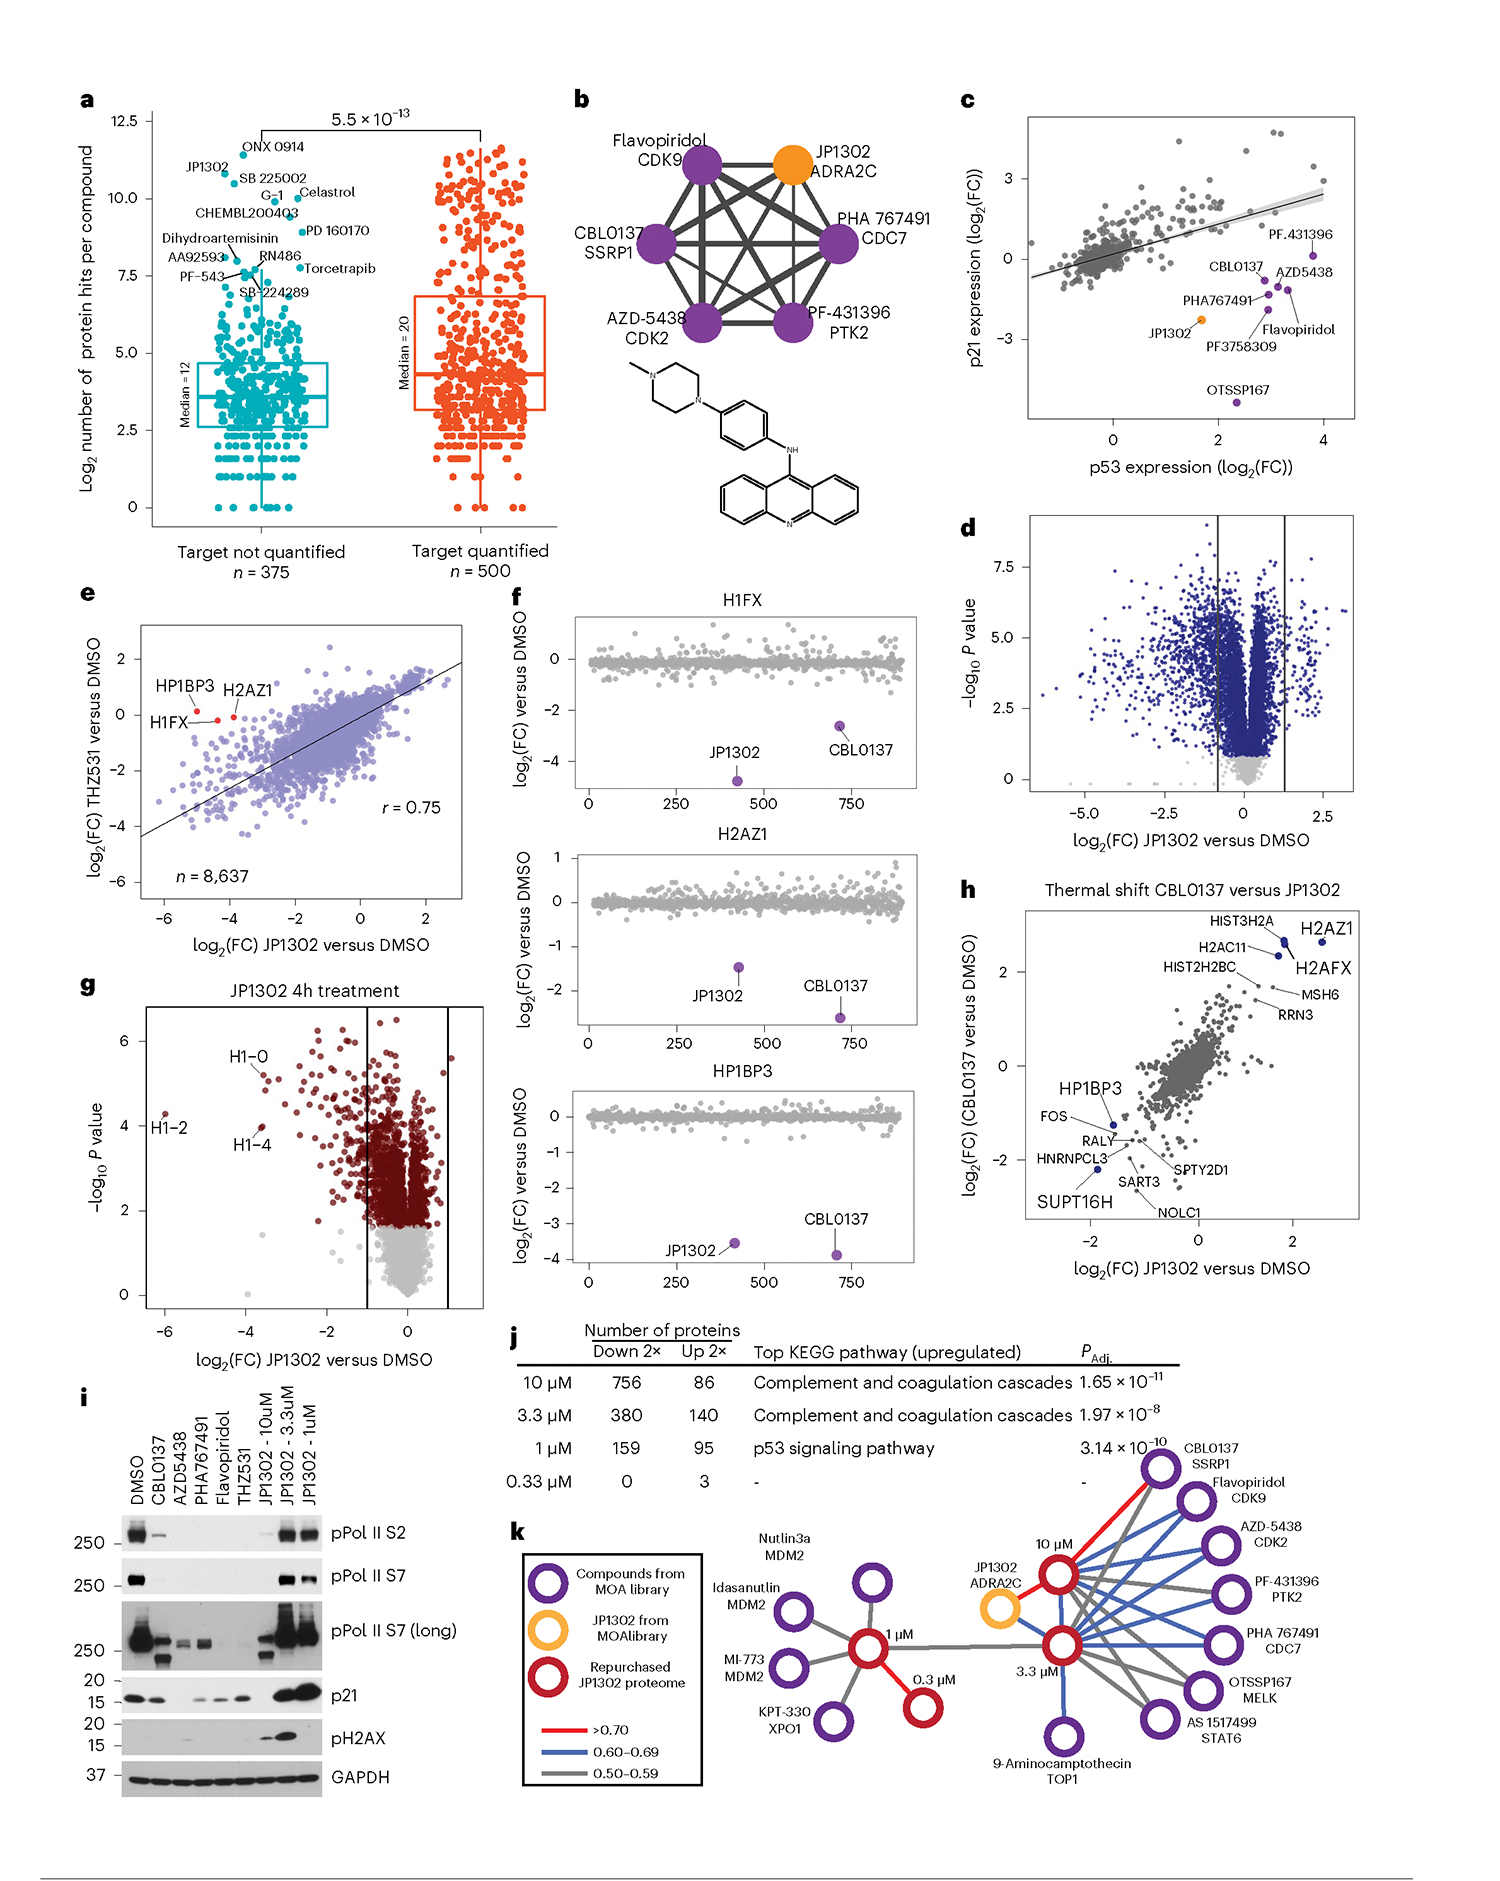
a, Number of regulated events for each compound in this dataset, based on whether a target was identified. All 2,485 annotated targets were used. The P value is from unpaired, Wilcoxon test (n = 875). The center line represents the median, the upper and lower bounds of the box indicate the IQR (range between the 25th and 75th percentiles) and whiskers extend to the highest and lowest values within 1.5 times the IQR. b, Compound–compound community plot and structure of JP1302. Edge thickness denotes the degree of correlation (r = 0.6 to 0.8). c, Protein-level regression of p53 and p21 for all compounds in the dataset. Shading along the regression line represents the 95% confidence interval. d, Volcano plot of JP1302-treated (10 μM, 24 h) cells using repurchased compound. e, Correlation of proteome fingerprints from JP1302-treated (10 μM) cells versus THZ531-treated (1 μM) cells. f, Expression of proteins highlighted in e across the MOA dataset. g, Volcano plot of protein expression from HCT116 cells treated with JP1302 (10 μM, 4 h). h, Correlation of ligand-induced changes in proteome thermal stability for CBL0137 and JP1302-treated HCT116 cells. i, Western blot of various RNA pol II and DNA damage markers in HCT116 cells treated for 20 h with indicated compounds. Treatment concentration is 10 μM or 1 μM (THZ531) unless indicated. j, Table showing the number of up- and downregulated proteins (by twofold versus DMSO) in cells treated with the indicated concentrations of JP1302. KEGG pathways enriched from the list of proteins upregulated by twofold is shown for each concentration. Enriched pathways and their adjusted (using Benjamini–Hochberg) P values (PAdj.) were calculated using the enrichKEGG R package. k, Compound–compound community plot generated from the larger MOA dataset after including the JP1302 dose-dependent proteome fingerprints (red nodes). All JP1302 nodes and all network edges higher than 0.5 (Pearson r) are shown. P values in d and g are calculated as described in Methods. Measurements with Q > 0.05 are light gray.
We next applied protein–protein correlation analysis to further define the mechanism of this group of inhibitors. We hypothesized that, in a TP53 wild-type cell line like HCT116, p53 protein levels should correlate positively with known targets such as CDKN1A (p21) and MDM2. While this assumption usually held true, we identified several compounds that caused p53 expression to increase while MDM2/p21 expression decreased or remained unchanged (Fig. 6c and Extended Data Fig. 8a). Most compounds that break the expected trend are transcription inhibitors, including those highly correlated to JP1302. This analysis further suggests that JP1302 may inhibit RNA transcription.
To further characterize the MOA of this compound, we compared the proteome changes of repurchased JP1302 with those induced by THZ513—a specific inhibitor of transcriptional kinases CDK12 and CDK13. THZ513 treatment immediately arrests RNA transcription, universally decreasing protein expression61. Though both compounds similarly downregulated protein expression (Fig. 6d and Extended Data Fig. 8b), several downregulated proteins were unique to JP1302 treatment (Fig. 6e). Three of these, the histone subunits H2AZ1, HP1BP3 and H1FX, are resistant to pharmacological perturbation, though they were uniquely downregulated by JP1302 and CBL0137 (Fig. 6f). Hypothesizing that both compounds inhibit the FACT complex, which associates with linker histones to mediate nucleosome assembly, we sought to gauge the effects of JP1302 treatment on histone proteins in short treatments. Indeed, time-resolved analysis of proteome changes in JP1302-treated cells shows rapid degradation of H1 linker histones (Fig. 6g and Extended Data Fig. 8c).
To discern how JP1302 downregulates protein expression and degrades histone H1, we again used in-cell PISA, and included a matched, whole proteome experiment to account for any changes in protein expression during the 30-min incubation. While we observed no effect following treatment with the CDK9/12/13 inhibitor flavopiridol, both JP1302 and CBL0137 alter the thermal stability of many RNA transcription proteins, with FACT complex subunit SUPT16H most affected (Fig. 6h and Extended Data Fig. 8d). Despite strong shifts in thermal stability, the expression did not change for these proteins after 30 min (Extended Data Fig. 8e). These findings implicate JP1302 as a new chemical tool for studying FACT complex inhibition and linker histone degradation.
Finally, we assessed the potency of JP1302 as a FACT complex inhibitor by assessing Pol II phosphorylation and p21 expression at several concentrations. Treatment with 10 μM JP1302 inhibited Pol II phosphorylation and p21 expression comparably with CBL0137, THZ531 and three other CDK9 inhibitors (Fig. 6i and Extended Data Fig. 8f). However, lower concentrations of JP1302 had no effect on Pol II phosphorylation and induced an increase in p21 expression and H2AX phosphorylation—a marker of DNA damage62. To further elucidate the MOA of JP1302 across concentrations, we examined dose-dependent proteome remodeling and found that the relative numbers of proteins up- and downregulated upon treatment diverged as JP1302 concentrations decreased, suggesting concentration-dependent differences in pathway activation. (Fig. 6j and Extended Data Fig. 8g). Indeed, the p53 signaling KEGG pathway was enriched among upregulated proteins following 1 μM JP1302 treatment, explaining the observed increase in p21.
We then inserted the proteome fingerprints acquired from each concentration into the compound–compound correlation network (Fig. 6k). In line with the KEGG pathway prediction, cells treated with 1 μM JP1302 aligned most closely with nutlin-based MDM2 inhibitors that activate p53, while higher concentrations clustered with the same compounds observed previously. However, despite this distinction between concentrations, p53 knockout only marginally affected the capacity of JP1302 to inhibit cell proliferation, while rendering the MDM2 inhibitor MI773 nearly inactive, affirming a p53-independent mechanism for this compound (Extended Data Fig. 8h). Thus, JP1302 dynamically affects cell signaling, with DNA damage driving p53 activity at low concentrations while higher concentrations lead to FACT complex disruption and inhibition of RNA transcription.
Further analysis of compound dose dependence showed a low incidence of divergent MOAs across concentrations (Extended Data Fig. 9 and Supplementary Note 3). In sum, these data highlight the many ways in which our proteome fingerprint resource can be used to pinpoint distinct MOAs for unknown compounds.
Discussion
Cellular exposure to drugs and tool compounds often induces proteome remodeling where compounds with similar MOAs have similar proteome changes. Library-scale characterization of these changes using comprehensive profiling methods provides mechanistic annotation of compound action for use in future drug discovery efforts. Though proteomics approaches are vital to MOA deconvolution and target identification63, proteome-scale annotation of compound action is not performed routinely. Here, we defined a roadmap for how library-scale annotation of small-molecule fingerprints can be used in drug discovery.
First, we demonstrate how this dataset can reveal the mechanisms by which chemical perturbagens induce proteome remodeling. We described MOAs for several compounds, including several drugs used in the clinic, showing that this dataset may facilitate MOA elucidation and drug repurposing. This resource may also uncover polypharmacology by revealing off-target protein engagements via specific protein expression biomarkers that correspond to discrete compound classes. Our findings indicate that routine quantification of proteome-level changes induced by promising screening hits and preclinical candidates would increase the efficiency of drug discovery by revealing the MOA of a compound during early stages of development. This increase in efficiency, coupled with the potential to repurpose drugs with known safety profiles, would positively influence the growing cost of bringing drugs to market64.
Second, we identified compounds that regulate expression of over 9,000 proteins in HCT116 cells. Further examination of these regulation events may uncover new ligand-induced degradation events and reveal uncharacterized feedback loops. In addition, a path for ‘off label’ tool compound usage becomes available, where these small molecules can be used to modulate expression of specific proteins/processes/pathways of interest, sometimes in contradiction of their original purpose.
Finally, our database of chemical-induced protein fingerprints reveals fundamental and recurring patterns of protein coexpression that occur in response to perturbation. Through ‘guilt by association’, our protein coregulation network can link poorly characterized proteins with specific biological processes. Additionally, these protein coregulation events can be compared against protein interactions identified in the BioPlex network, which includes AP-MS experiments for over 5,500 proteins in the same HCT116 cell line65. Additional analyses of compounds that ‘break’ the correlation between coregulated proteins will further reveal pathway-level regulation by small molecules.
We have provided a companion website for the community to explore the dataset, including an option to query user data and a test case with previously published data (gygi.med.harvard.edu/DeepCoverMOA and Supplementary Note 4).
Online content
Any methods, additional references, Nature Portfolio reporting summaries, source data, extended data, supplementary information, acknowledgements, peer review information; details of author contributions and competing interests; and statements of data and code availability are available at https://doi.org/10.1038/s41587-022-01539-0.
Methods
Screening library
The 875 compounds were part of a MOA library provided by the Harvard Medical School-Longwood screening facility (https://iccb.med.harvard.edu/iccb-longwood-mechanism-action-library-10mm). Annotation of protein targets was performed in collaboration with Novartis Institutes for BioMedical Research, with support from HMS Library of Integrated Network-based Cellular Signatures (LINCS). Clinical stage annotations were obtained from the CLUE platform (https://clue.io/) curated by the Broad Institute. The compound library was arrayed by the ICCB-Longwood screening facility in rows of ten compounds and was used as provided with each row (plus one DMSO) comprising a TMT 11-plex.
Screening conditions
HCT116 cells were dispensed into tissue-culture treated 96-well plates at a density of 30,000 cells per well in a volume of 300 μl using a Multidrop Combi Reagent Dispenser (Thermo). After 18 h cells were around 50% confluent, and compounds (10 mM stock in DMSO) were transferred (300 nl) using a Seiko pin transfer robot to a final concentration of 10 μM (0.1% DMSO). All transfers were performed in triplicate: two clear 96-well plates for proteome analysis, and one white-bottom 96-well plate for measuring cell viability. After treatment, cells were incubated for 24 h at 37 °C before washing with PBS (5 × 200 μl per well) using a 12-pin aspirating wand and a Multidrop Combi Dispenser. After the final wash, all PBS was aspirated, clear cell culture plates were covered with plate tape and stored at −80 °C until processed, while white plates were processed for cell viability screening.
Rescreening of cytotoxic compounds
After completion of the screen, compounds removed due to cytotoxicity (less than 50% viability) were cherry picked from screening stocks and HCT116 cells were retreated (1 μM, 24 h) in 96-well plates using a D300 digital dispenser. Washing and viability measurements were repeated as described above. From the original 880 compound library, 33 compounds were too toxic at 10 μM. Of these, 28 were included in the final dataset at a concentration of 1 μM. Five compounds were still too toxic at the lower concentrations and were not included, leaving a final dataset with 875 compounds.
Sample workup of whole proteomes
Lysis buffer (30 μl) containing 8 M urea, 0.1% SDS, 200 mM 3-[4-(2-hydroxyethyl)piperazin-1-yl]propane-1-sulfonic acid (EPPS) pH 8.5, 5 mM tris(2-carboxyethyl)phosphine (TCEP) and protease inhibitors was added to each well before incubating at room temperature (30 min, shaking). To this, alkylation buffer (30 μl) containing 200 mM EPPS pH 8.5, 10 mM iodoacetamide and benzonase (1.6 U μl−1) was added before incubating in the dark (30 min at room temperature). Iodoacetamide was quenched with dithiothreitol (DTT) (15 mM, 10 min) before transferring cell lysate to a 96-well PCR plate. Single-pot SP3 was used to facilitate protein isolation66–68. In brief, 2 μl of each bead type was added to each well before adding neat ethanol (65 μl) and shaking (10 min). PCR plates were placed on a 96-well magnet (2 min) and supernatant was aspirated. Beads were washed with 80% ethanol (3 × 125 μl) by resuspending/vortexing. Beads were resuspended in digest buffer (45 μl) containing 200 mM EPPS pH 8.5 and LysC (10 ng μl−1), then incubated overnight at 37 °C with constant agitation, before adding trypsin (400 ng) for an additional 6 hr at 37 °C. Acetonitrile (15 μl) was added to the eluted peptides, still in the presence of the beads, followed by TMT 11-plex reagents and the mixture was incubated at room temperature for 1 h. The reaction was quenched with 0.5% hydroxylamine, before pooling all beads and eluates into a single 2 ml tube and placing it on a magnetic rack. Supernatant was collected, then the beads were washed with 5 % acetonitrile/1% formic acid (1 ml) and the resulting supernatant was pooled with the initial elution.
PISA assay
HCT116 cells were suspended in normal growth medium with each compound at the indicated concentration or vehicle (DMSO). Cells were allowed to incubate in suspension for 30 min at 37 °C. After 30 min, an equal volume of each suspension was transferred to ten PCR tubes and heated across a temperature gradient from around 48 to 58 °C (48.3, 48.9, 49.8, 50.9, 52.1, 53.4, 54.7, 55.8, 56.8, 57.5 °C) for 3 min in a Mastercycler Pro.S thermal cycler (Eppendorf). After heating, the cells were allowed to rest for 5 min at room temperature. An equal volume of cell suspension was taken from each PCR tube and pooled into a single sample. The cells in each pooled sample were pelleted (300g for 3 min) and the treatment media was removed by aspiration. The cells were washed once with ice-cold PBS. Washed cell pellets were resuspended in 150 μl ice-cold lysis buffer (1× PBS pH 7.4, 0.5% NP-40, 1.5 mM MgCl2, 1 μl ml−1 benzonase and protease inhibitor cocktail) and incubated for 10 min at 4 °C. Lysates were centrifuged at 21,000g for 90 min. An equal volume of soluble lysate from each sample (corresponding to around 15 μg of protein) was collected and diluted with an equal volume of prep buffer (400 mM EPPS pH 8.5, 0.5% SDS) to achieve a final concentration of 200 mM EPPS pH 8.5 and 0.25% SDS. Proteins were reduced with TCEP (5 mM, 30 min) before alkylating cysteines with iodoacetamide (10 mM, 30 min). Proteins were extracted using the SP3 method described above before digestion with LysC/trypsin and labeling with TMT 16-plex reagents.
Offline fractionation of whole proteomes and PISA samples
The pooled, multiplexed samples were desalted using a 50 mg SepPak solid phase extraction cartridge. The desalted peptides were fractionated with basic pH reversed-phase (bRP) HPLC (250 mm × 2.1 mm, 3.5 μm Zorbax 300 A Extended-C18 column), collected in a 96-well plate, and concatenated down to 24 superfractions69. Nonadjacent superfractions (12 of 24 for each TMT plex) were evaporated and desalted using Oasis 96-well μElution plates before LC-MS/MS.
Kinase enrichment using kinase affinity beads
Cell pellets of HCT116, K562 and 293T cells were lysed with kinase enrichment buffer (20 mM HEPES pH 7.4, 150 mM NaCl, 1 mM MgCl2, 0.8% Triton X-100, protease and phosphatase inhibitor cocktails) by pipetting up and down 20 times with a P-1000 pipette. The lysate was mixed (1:1:1 ratio) and aliquoted into 16 tubes (1 mg each) before adding compounds (20 μM) or DMSO (0.1%) and rotating at 4 °C (15 min). Pre-washed (3 × 1 ml, kinase enrichment buffer) kinase affinity beads were added to each tube (40 μl original slurry) and rotated at 4 °C (45 min). Proteins were eluted off the resin by incubating with 2% SDS in 200 mM EPPS pH 8.5 at 37 °C (15 min), before reducing with TCEP (5 mM, 30 min), then alkylating cysteines with iodoacetamide (10 mM, 30 min). Proteins were extracted using the SP3 method described above. Following LysC/trypsin digest and TMT labeling, samples were pooled then desalted with 50 mg SepPak solid phase extraction columns. Eluted peptides were resuspended in bRP buffer A (10 mM ammonium bicarbonate, 5% acetonitrile) and loaded onto a pre-equilibrated StageTip packed with 16 wafers of C18 material. After washing with bRP buffer A, peptides were eluted in three ‘bumps’ containing 15%, 25% and 70% acetonitrile (ACN) with 10 mM ammonium bicarbonate.
MS analysis of whole proteomes
Data were collected on an Orbitrap Fusion, Lumos or Eclipse mass spectrometer coupled to a Proxeon EASY nLC 1000 or 1200 LC pump. Labeled peptides were resuspended in 5% ACN/5% formic acid separated on an inhouse pulled C18 column (30 cm, 2.6 μm Accucore, 100 μm ID) using a 90, 120 or 180-min linear gradient; 120-min gradients were used for most runs, but this was adjusted based on instrument performance. MS1 precursor scans were acquired in the orbitrap at 120 K resolution, 1 × 10⁵ automatic gain control (AGC) target with a maximum of 50 ms injection time. Data dependent, ‘top 10’ MS2 scans were acquired in the ion trap with collisional induced dissociation (CID) fragmentation. While setting varied from instrument to instrument and with instrument performance, generally the following was used for MS2 scans: normalized collision energy (NCE) 35%, 1.5 × 10⁴–4 × 10⁴ AGC target, maximum injection time 35–50 ms, isolation window 0.5–0.7 Da. Orbiter, an online real-time search algorithm, was used to trigger MS3 quantification scans17. MS3 scans were acquired in the orbitrap using varying settings based on instrument performance: 50,000 resolution, AGC of 2 × 10⁵–5 × 10⁵, injection time of 150–200 ms, higher energy C-trap dissociation (HCD) collision energy of 65%. Protein-level closeout was typically set to two peptides per protein per fraction17.
Order of preparation of MS analysis for MOA library
Cellular treatments for replicate plates were performed simultaneously (same day), while biological replicate 11-plex experiments were prepared injected on the mass spectrometer many months apart. The first replicate of all compounds was injected over the course of around 6 months. Several months later, the second replicates were then injected.
MS analysis of kinase enrichment experiments
Data were collected on an Orbitrap Lumos or Eclipse mass spectrometer as described in MS analysis of—whole proteomes, with some small changes; 180 min gradients were used for each bRP ‘bump’ and Orbiter was used to trigger MS3 quantification scans using a protein-level closeout of five peptides per protein across all three fractions.
MS analysis of PISA samples
Data were collected on an Eclipse mass spectrometer equipped with a high-field asymmetric-waveform ion mobility spectrometry (FAIMS) Pro device70, coupled to a Proxeon EASY nLC 1200 LC pump. Labeled peptides were resuspended in 5% ACN/5% formic acid separated on an inhouse pulled C18 column (30 cm, 2.6 μm Accucore, 100 μm ID) a 90 min linear gradient. FAIMS inner and outer electrodes were set to 100 °C, with transport gas preset to 4.7 l min−1. Three FAIMS compensation voltages (CVs) (−40 V, −60 V and −80 V) were used during acquisition. MS1 precursor scans were acquired in the orbitrap at 120 K resolution, 1 × 10⁵ AGC target with a maximum of 50 ms injection time. Cycle time was set at 1 s for each CV. MS2 scans were performed in the Orbitrap with HCD fragmentation (isolation window 0.5 Da; 50,000 resolution; NCE 36%; maximum injection time 250 ms; AGC 1.5 × 10⁵).
MS data analysis
Raw files were converted to mzXML using msconvert and monoisotopic peaks were reassigned using Monocle71. Searches were performed using the Comet72 search algorithm against the human Uniprot database (download v.02/2020), appended with reverse protein sequences and common contaminants. Searches were completed with the following parameters: 50 ppm precursor tolerance, fragment ion tolerance of 0.9 Da (low resolution MS2) or 0.03 Da (high-resolution MS2), static modifications of TMT (+229.163 Da) or TMTpro (+304.2071 Da) on lysine and peptide N-termini, and carbamidomethylation of cysteine residues (+57.021 Da), while oxidation of methionine residues (+15.995 Da) was set as a variable modification, and two missed cleavages were allowed. Peptide spectrum matches were first filtered to a peptide FDR of 1%73. Peptide spectrum matches were filtered separately for each run using linear discriminant analysis74. For each protein across all runs within an experiment (2,176 runs for MOA dataset, 12 runs for separate whole proteomes and PISA experiments), the posterior probabilities reported by the linear discriminant analysis model for each peptide were multiplied to give a protein-level probability estimate. Using the Picked FDR method75, proteins were filtered to the target 1% FDR level, again using the target–decoy approach to model false positives73.
For reporter ion quantification, a 0.003 Da window around each reporter ion m/z was scanned and the most intense m/z was used. Reporter ion intensities were adjusted to correct for impurities during synthesis of different TMT reagents according to the manufacturer’s specifications. The impurity adjustments were updated for each new batch of TMT used. An isolation purity of at least 0.7 in the MS1 isolation window was used for samples analyzed with high-resolution MS2, but not when real-time searching (Orbiter) was used. Peptides were filtered to require a total summed signal-to-noise of more than 100 (11-plex) or more than 160 (16-plex) across all reporter ions. To account for unequal loading within each 11-/16-plex experiment, protein quantitative values were normalized (column normalization) so that the sum of the signal for all protein in each channel within each 11-/16-plex experiment was equal. For each protein within each 11-/16-plex experiment, the sum signal-to-noise was scaled to sum to 100, allowing comparisons across TMT plexes.
Dataset Normalization
Scaled sum signal-to-noise values were converted to FC versus DMSO by dividing by the 126 (DMSO) channel within each 11-plex experiment. These FC values were log2 transformed then median normalized at the plex level by subtracting the median log2(FC) value for each protein within each plex from each log2(FC) value. No imputation was performed. A protein–protein correlation matrix was then generated and all proteins with expression highly correlated (r > 0.5) to bovine albumin were considered contaminants and removed. Reverse proteins and known contaminants were also removed, along with TTLL4, PIP, KTM2B and AZGP1, which were poorly behaved across the 172 TMT groups.
To identify any bad replicate experiments, log2(FC) values for the individual replicates of each compound were overlaid as histograms. If differences in global activity were observed, the replicate with more, larger protein-level changes was removed from the dataset. Log2(FC) values for proteins found in both biological replicates, where applicable, were averaged. The final dataset contains 875 compounds, 754 of which were screened in biological duplicate.
A detailed analysis of our normalization scheme can be found in Supplementary Note 2.
General bioinformatics analyses
All general bioinformatics analyses were performed using R, including data normalization and plotting. Plots were made using ggplot2, ggpubr, pheatmap and ggrepel. Graphics for the protein–protein correlation network were generated in Cytoscape76 and those for the compound–compound correlation network were generated in Mathematica and Cytoscape. For all analyses requiring pathway-level or gene ontology (GO) enrichment, we used the clusterProfiler package in R, after converting gene names to ENTREZ ID using the org.Hs.eg. db R package from BioConductor. The enrichKEGG function was used for pathway-level KEGG mapping with a P value cutoff of 0.01. For GO enrichment analysis, we used enrichGO with molecular function (‘mf’) ontologies and a P value cutoff of 0.01. For each analysis, the background list of gene names most appropriate for that analysis was used; typically this was the list of gene names for all 9,960 proteins identified in HCT116 cells.
Correlation networks
The compound–compound and protein–protein correlation matrixes were constructed using the rcorr function from the Hmisc package with the ‘Pearson’ option. For the protein–protein correlation network, correlations using fewer than 200 datapoints (200 compounds) were subsequently removed. FDRs were estimated using the fdrtool35 package with the ‘pct0’ cutoff method, and edges were filtered to an estimated 1% FDR. The protein–protein correlation network was annotated in two ways. First, smaller clusters were investigated individually, and clearly defined clusters were annotated manually. Second, larger clusters were grouped and the nodes for each network were subjected to GO analysis (described above), using all possible nodes as a background.
Statistics and reproducibility
All follow-up experiments after the initial screen used repurchased compounds. For whole proteome, PISA and kinobead experiments, each condition was repeated in biological triplicate or quadruplicate. Experiments analyzed by Western blot were repeated in biological Phosphatase inhibitors Pierce duplicate on separate days.
Data analysis of whole proteomes, PISA and kinobeads
For these experiments, protein quantification tables containing normalized TMT abundance ratios were imported into Perseus77 before channels (columns) were assigned to treatment groups and data were log2 transformed. P values for each protein within each treatment group were calculated relative to DMSO using a two-sample Student’s t-test. FDRs were estimated using the permutation-based method with 250 randomizations.
Preparation of kinase affinity beads
NHS-ester resin (3 ml slurry) was washed with dimethylformamide (2 × 2.5 ml) and DMSO (2 × 2.5 ml) before adding a solution (1 ml in DMSO) of CZC8004 (5 μmol), VI16832 (5 μmol), PP58 (5 μmol), bisindolylmaleimide-x (2.5 μmol) and N,N-diisopropylethylamine (50 μmol). The slurry was then incubated at room temperature (18 h) with agitation before quenching unreacted NHS-esters by spiking in hydroxylamine to a final concentration of 1%. The resin was then washed with dimethylformamide (2 × 2.5 ml), DMSO (2 × 2.5 ml) and 80% ethanol (2 × 2.5 ml) and stored as a 50% slurry in 80% ethanol.
Proliferation and viability assay
Assessment of relative cell viability was performed using the Cell Titer Glo assay (Promega). For measuring compound toxicity screen from the 875 compound screen, after the final PBS wash, all PBS was aspirated and fresh PBS (100 μl) was added to each well. Cell Titer Glo reagent (100 μl) was then added before plates were incubated at room temperature, with shaking, for 30 min. Luminescence was measured using an Envision plate reader, and cell viability was calculated relative to the average luminescence of DMSO-treated wells. For 16-point EC50 curves, HCT116 cells (wild-type or TP53KO) were plated in white, cell-culture-treated, 96-well plates at a density of 2,000 cells per well (in 250 μl). At 18 h after plating cells, compounds were added using an HP D300 digital dispenser. Each concentration on the 16-point curve was repeated in triplicate. Cells were incubated with compound for 72 h (37 °C) before luminescence was measured (as above) and half maximal effective concentration (EC50) concentrations were calculated with a nonlinear regression using Graphpad Prism.
Cell culture
HCT116 and 293T cells were grown in DMEM with 10% FBS. K562 cells were grown in RPMI1640 supplemented with 10% FBS. HCT116 TP53KO and HCT116 nontarget control cells, a kind gift from J. Mancias, were grown in DMEM with 10% FBS. All cell lines routinely tested negative for Mycoplasma.
Materials
| Reagent | Vendor |
|---|---|
| HCT116 cells | ATCC, catalog no. CCL247 |
| K562 cells | ATCC, catalog no. CCL243 |
| 293T cells | ATCC, catalog no. CRL3216 |
| TP53 KO cells | Mancias Lab |
| Control KO cells | Mancias Lab |
| DMEM | Corning |
| RPMI | Invitrogen |
| FBS | Hyclone |
| Reagent | Vendor |
| Benzonase | SCBT |
| Protease inhibitors | Pierce |
| Phosphatase inhibitors | Pierce |
| SP3 beads | Cytiva |
| LysC | FujiFilm |
| Trypsin | Promega |
| SepPak – 50mg | Waters |
| TMT11-plex | ThermoFisher |
| TMT18-plex | ThermoFisher |
| Oasis stagetip plates | Waters |
| Accucore | Thermo |
| NHS-ester resin | Sigma |
| Cell titer glo reagent | Promega |
| Mycoplasma Kit | SouthernBiotech |
| Equipment | |
| Fusion | ThermoFisher |
| Lumos | ThermoFisher |
| Eclipse | ThermoFisher |
| FAIMS Pro | ThermoFisher |
| Easy nLC-1000 | ThermoFisher |
| Easy nLC-1200 | ThermoFisher |
| D300 | HP |
| Multidrop Combi Reagent Dispenser | ThermoFisher |
| 96-well pin array | Seiko/Custom |
| Fractionation Column | Agilent |
| Antibodies | |
| pRB (S2) | Cell Signaling, catalog no. 13499S, 1:1,000 |
| pRB (S5) | Cell Signaling, catalog no. 13523S, 1:1,000 |
| pRB(S7) | Cell Signaling, catalog no. 13780S, 1:1,000 |
| pH2AX (S139) | Cell Signaling, catalog no. 9718, 1:1,000 |
| GAPDH-HRP | Cell Signaling, catalog no. 8884S, 1:20,000 |
| P21 | Cell Signaling, catalog no. 2947, 1:1,000 |
| Software | |
| R | v.3.6.2 |
| rcorr | v.0.4.2 |
| Dplyr | v.1.0.7 |
| Tidyr | v.1.0.0 |
| Reshape2 | v.1.4.3 |
| GO.db | v.3.10.0 |
| Enrichplot | v.1.6.1 |
| Tibble | v.3.1.2 |
| ggrepel | v.0.8.2 |
| Pheatmap | v.1.0.12 |
| fdrtool | v.1.0.12 |
| ggplot2 | v.3.3.5 |
| ggally | v.2.1.2 |
| Reagent | Vendor |
| org.Hs.db | v.3.10.0 |
| Rcolorbrewer | v.1.1 |
| Mathematics | v.11.2 |
| Graphpad prism | v.7.0 |
| Cytoscape | v.3.8.1 |
| Msconvert | v.1.1 |
| Monocle | v.1.1 |
| Comet | v.1.0 |
| Small molecule inhibitors | |
| CZC8004 | MedChemExpress |
| VI16832 | MedChemExpress |
| PP58 | MedChemExpress |
| Bisindoiyimaieimide-x | MedChemExpress |
| JP1302 | Tocris |
| Ibrutinib | Cayman |
| RN486 | Cayman |
| SP2509 | Selleckchem |
| KH7 | Selleckchem |
| PAC-1 | SeUeckchem |
Extended Data
Extended Data Fig. 1 |. Details on the MOA library and measurement reproducibility.
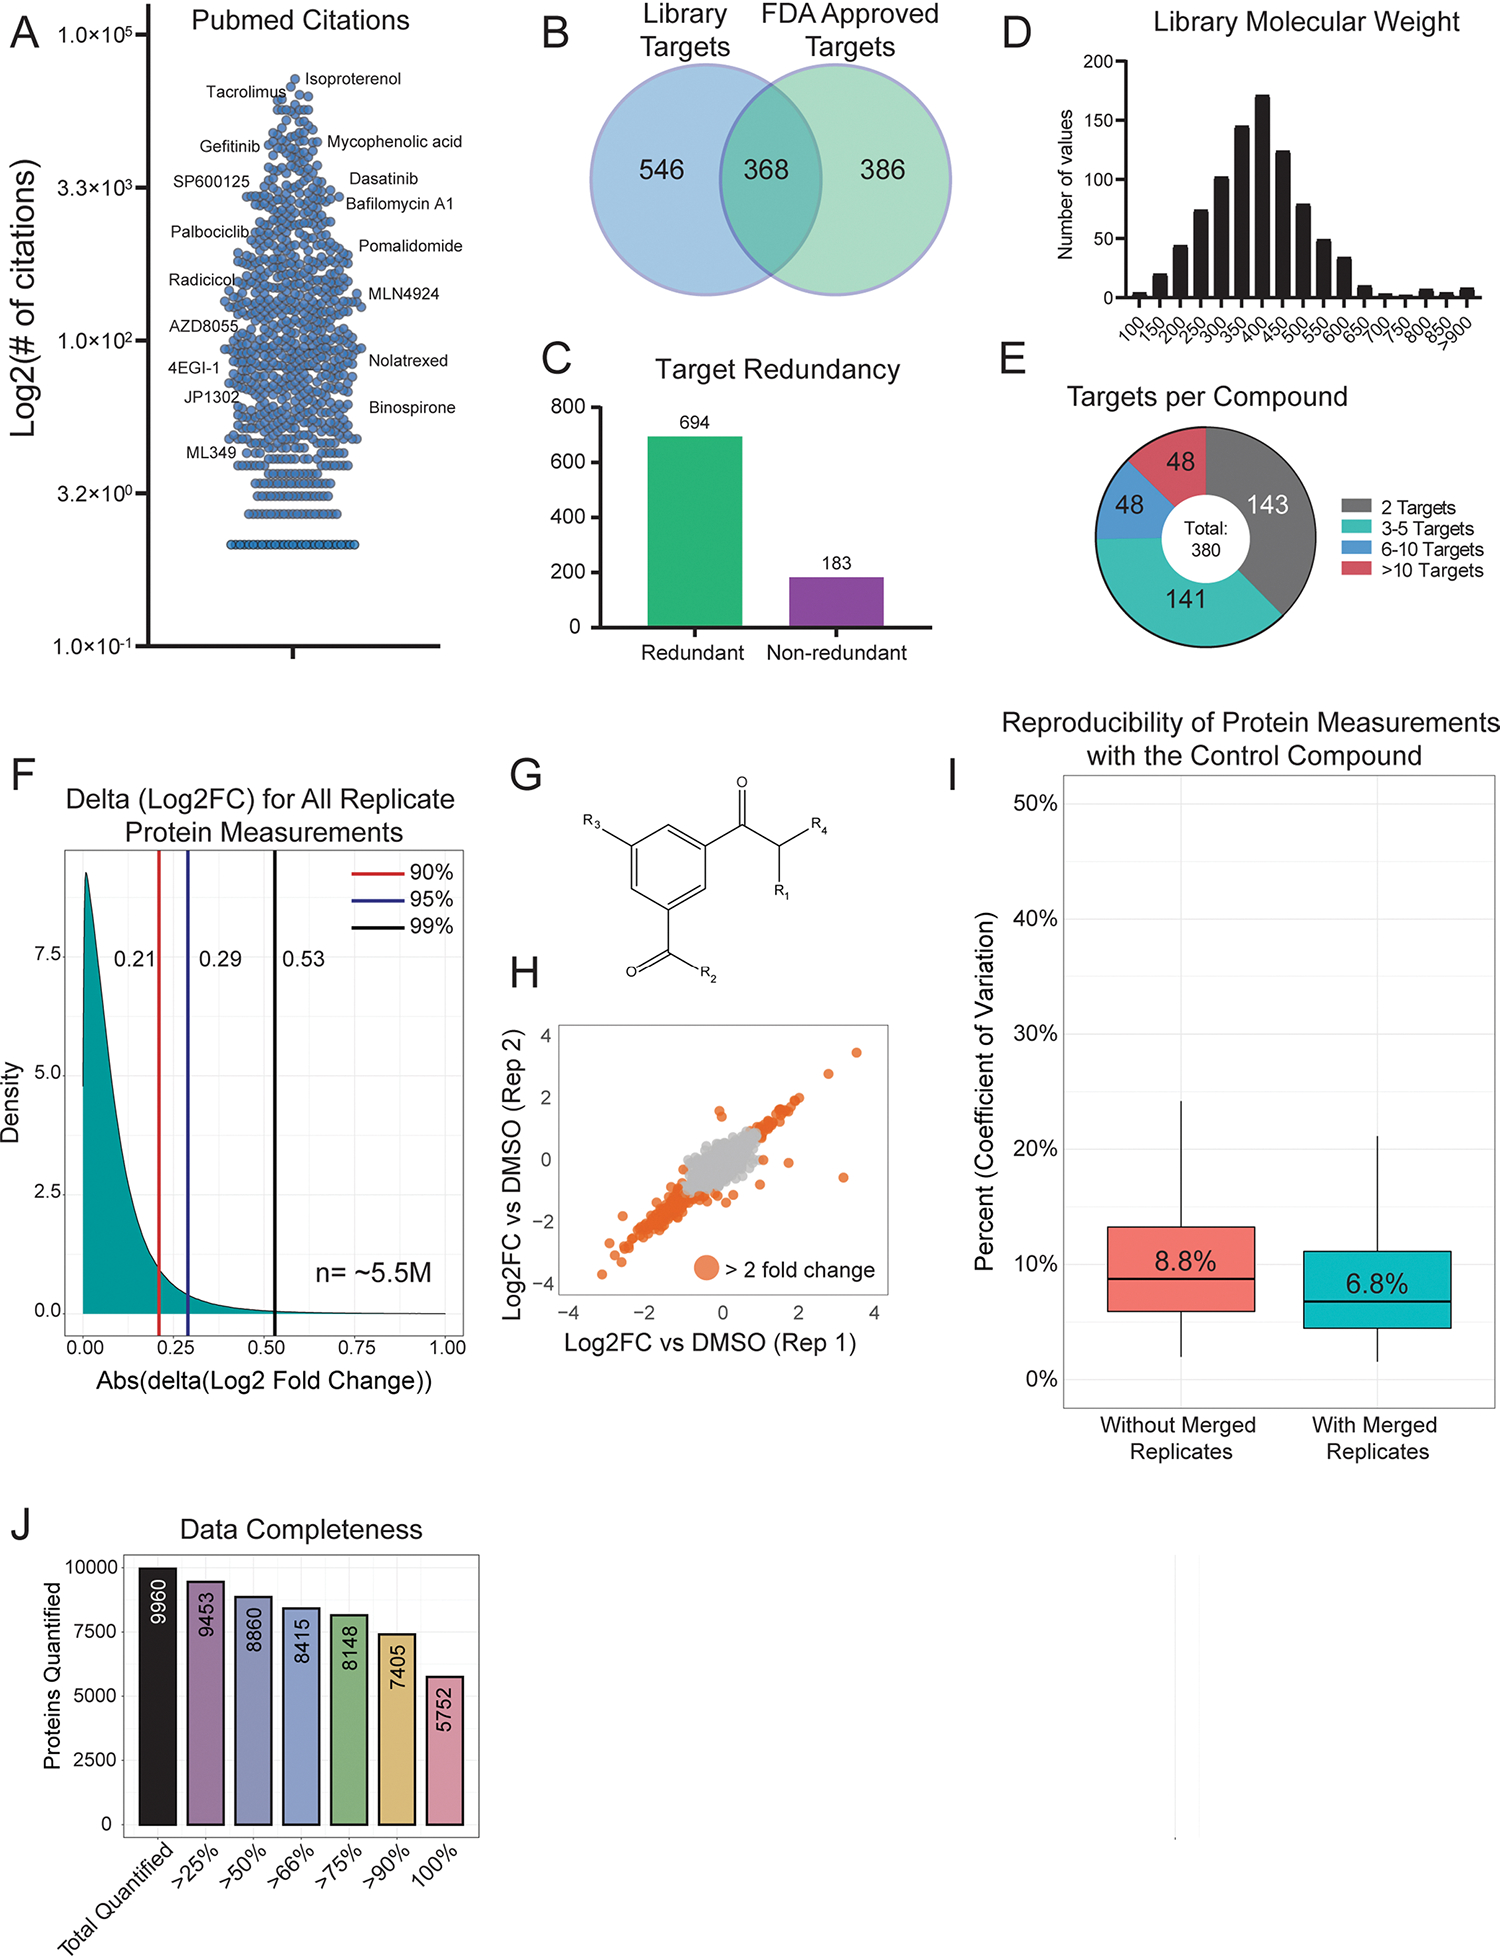
(a) Number of PubMed citations per library compound, with select examples shown. (b) Overlap of all annotated targets from the MOA library and all targets with an FDA approved drug. The list of FDA approved drug targets was acquired from The Human Protein Atlas (proteinatlas.org) (c) Target redundancy for compounds in the library. 694 compounds are annotated to target a protein that is also targeted by another compound. 183 compounds target proteins that are unique among the library. All annotated targets were considered. (d) Distribution of compound molecular weight across the MOA library. (e) A breakdown of the number of annotated targets per compound. 495 compounds have one annotated target. (f) Distribution of the absolute difference between replicate protein measurements. The difference between Log2 fold change (compound versus DMSO) measurements was compared for the same protein treated with the same compound. The ~5.5 million Log2FC differences between biological replicate 1 and biological replicate 2 represents ~11 million total protein measurements. (g) Basic structure of the control compound included 55 times across all 170 TMT groups. (h) Representative plot comparing the Log2 FC values for two replicates of the control compound. The median Pearson correlation (r) for two replicates of the control compound was 0.87, which is the correlation of the two replicates shown. (i) Percent coefficient of variation (CV) protein level fold-change measurements across all 55 biological replicates (red). After merging/averaging two biological replicates (coming from the same 96-well plate position, as is the case for other compound replicates), the Percent CV was recalculated (blue). The center line represents the median, the upper and lower bounds of the box indicate the interquartile range (IQR, the range between the 25th and 75th percentiles), and whiskers extend to the highest and lowest values within 1.5 times the IQR. (j) Bar graph showing dataset completeness. For example, 8,860 proteins were quantified in at least half (438) of the compound treatments.
Extended Data Fig. 2 |. Illustration of five standard deviations as a suitable threshold for regulated events.
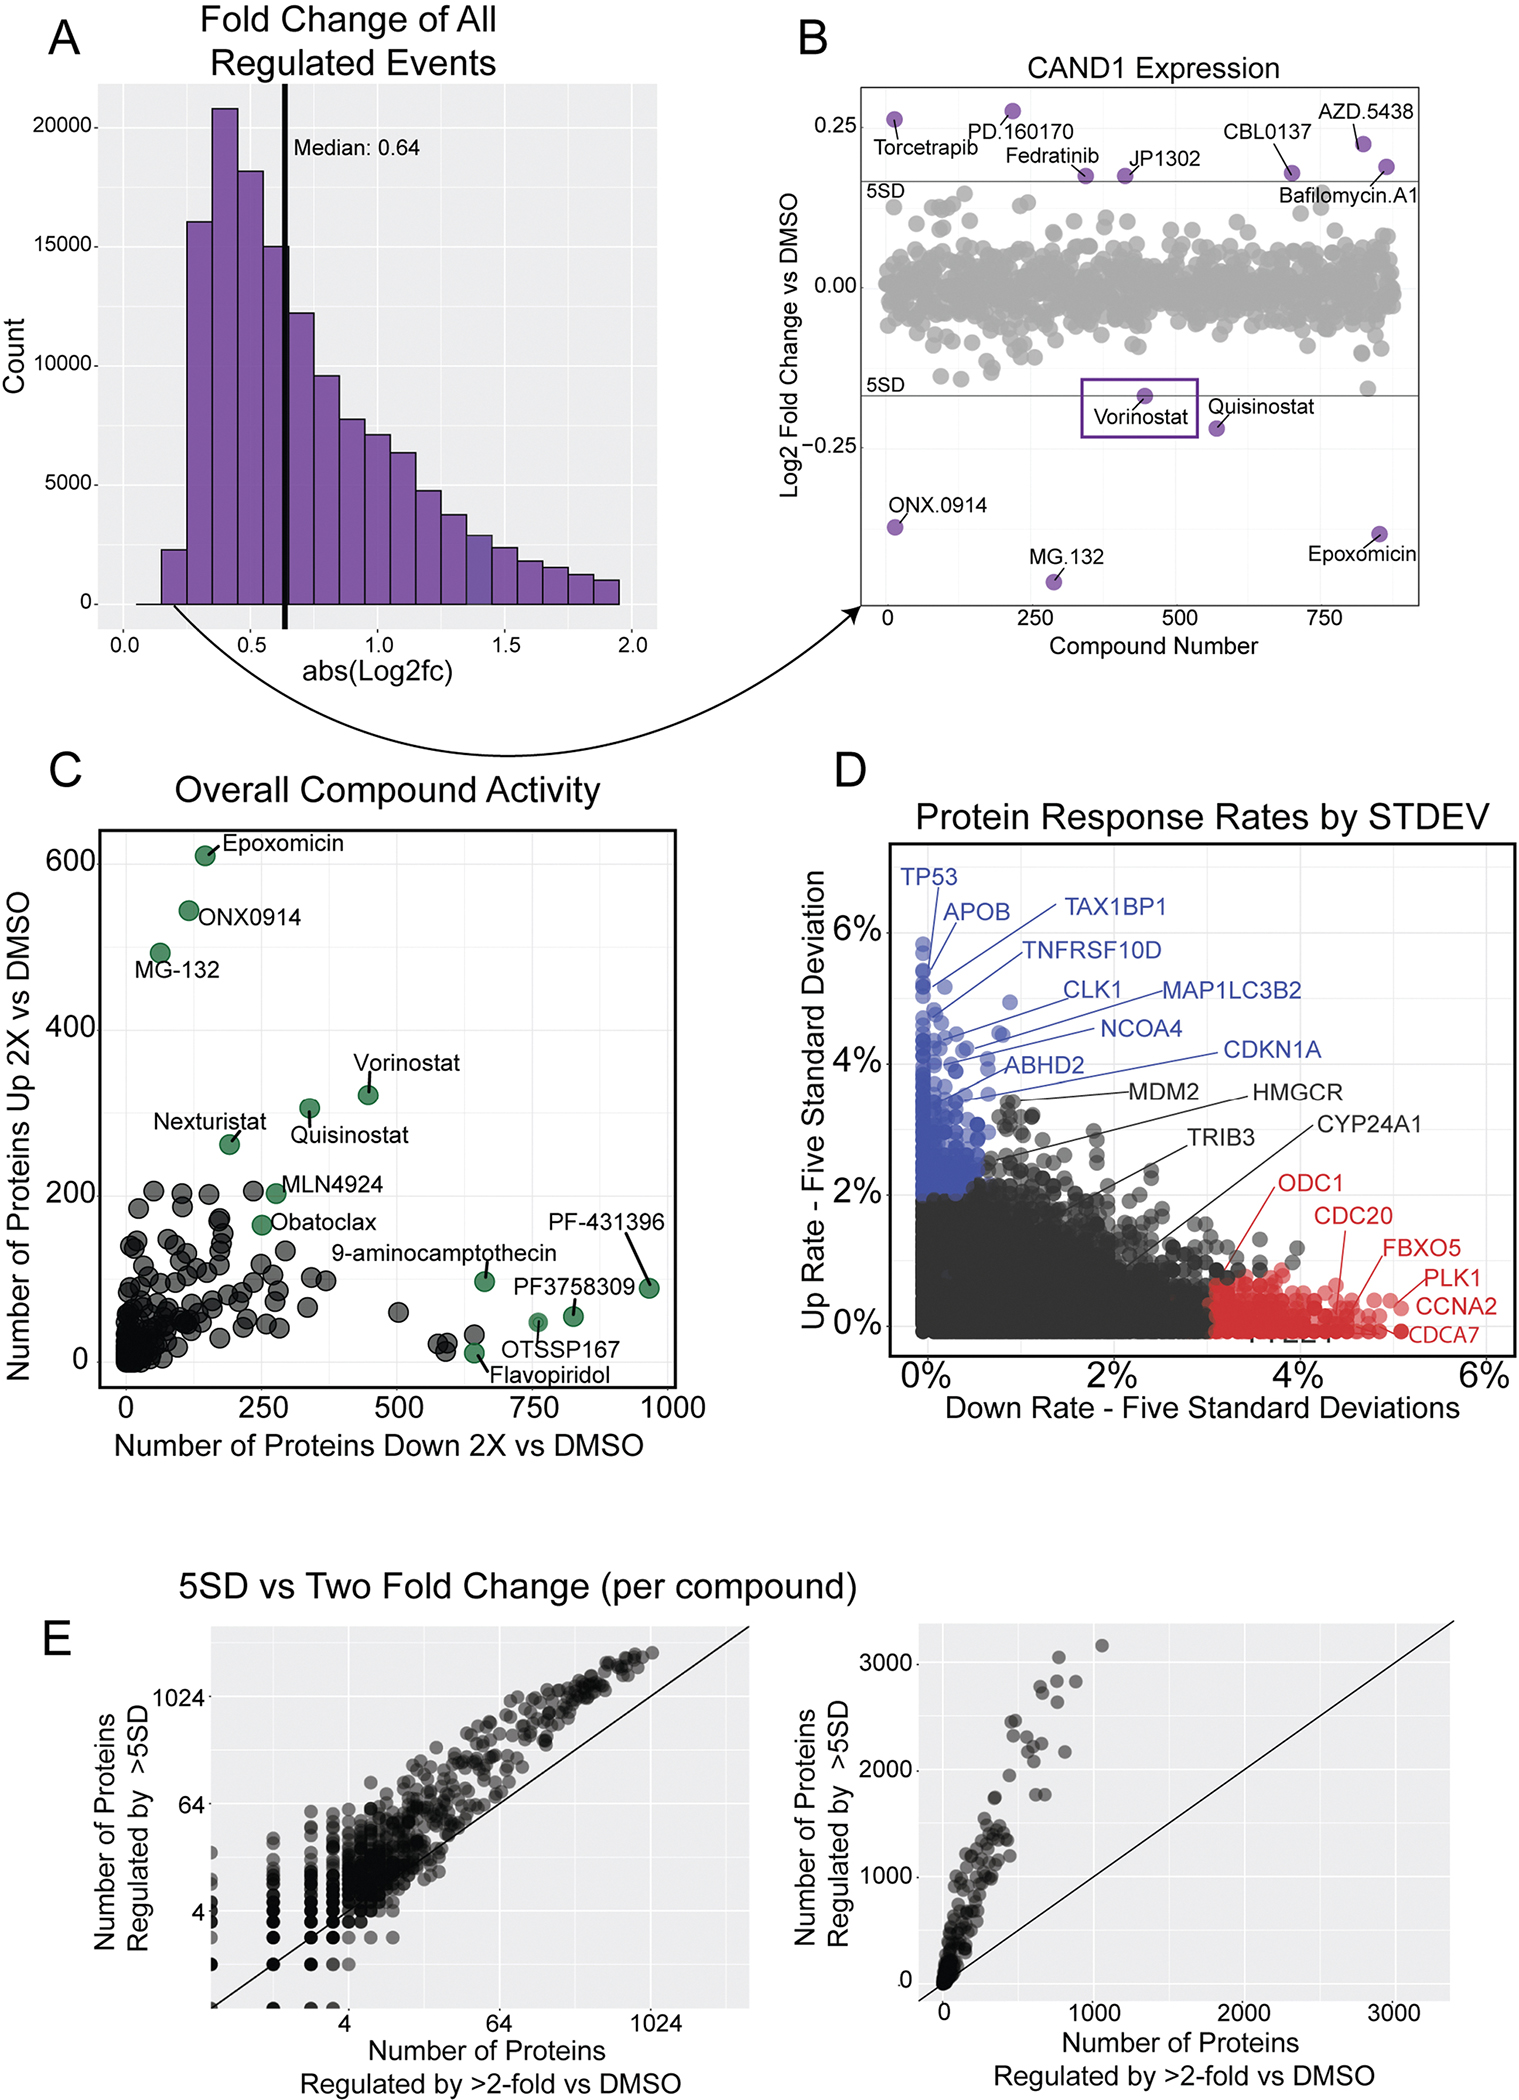
(a) Histogram of absolute value Log2 fold change for all regulated events (5 standard deviations or two fold change–n = 141,786). The histogram is truncated at abs(L2FC) = 2 for clarity. (b) Scatterplot of CAND1 expression, highlighting the regulation event with the lowest fold change in the dataset (n = 875 compounds). Vorinostat and Quisinostat (both HDAC inhibitors) regulated CAND1 to similar levels. The three proteasome inhibitors in the dataset, ONX0914, MG132, and Epoxomicin, all downregulate CAND1. (c) The activity of each compound measured by the number of proteins decreased (x-axis) and increased (y-axis) by two-fold versus DMSO. Compare to Fig. 2f, which is the same graph using a five standard deviation cutoff. (d) Rate at which proteins increase versus decrease by five standard deviations. Proteins that mostly increase with small molecule treatments are in blue, those that mostly decrease in red. Only those proteins quantified in more than half of compound are shown (n = 8,860). Change rate is calculated by taking the number of compounds affecting expression by five standard deviations and dividing by the compounds where the protein was quantified. Compare to Fig. 2c, which is the same graph using two-fold versus DMSO cutoff. (e) Illustration of the two different regulation cutoff thresholds for each compound in the dataset. The number of proteins regulated by 5 standard deviations (y-axis) versus the number of proteins changed by two-fold versus DMSO (x-axis). Log scale (left) and linear (right). The line represents y = x. The slope of the scatterplot = ~3.
Extended Data Fig. 3 |. Regulation of target proteins informs on compound MOA.
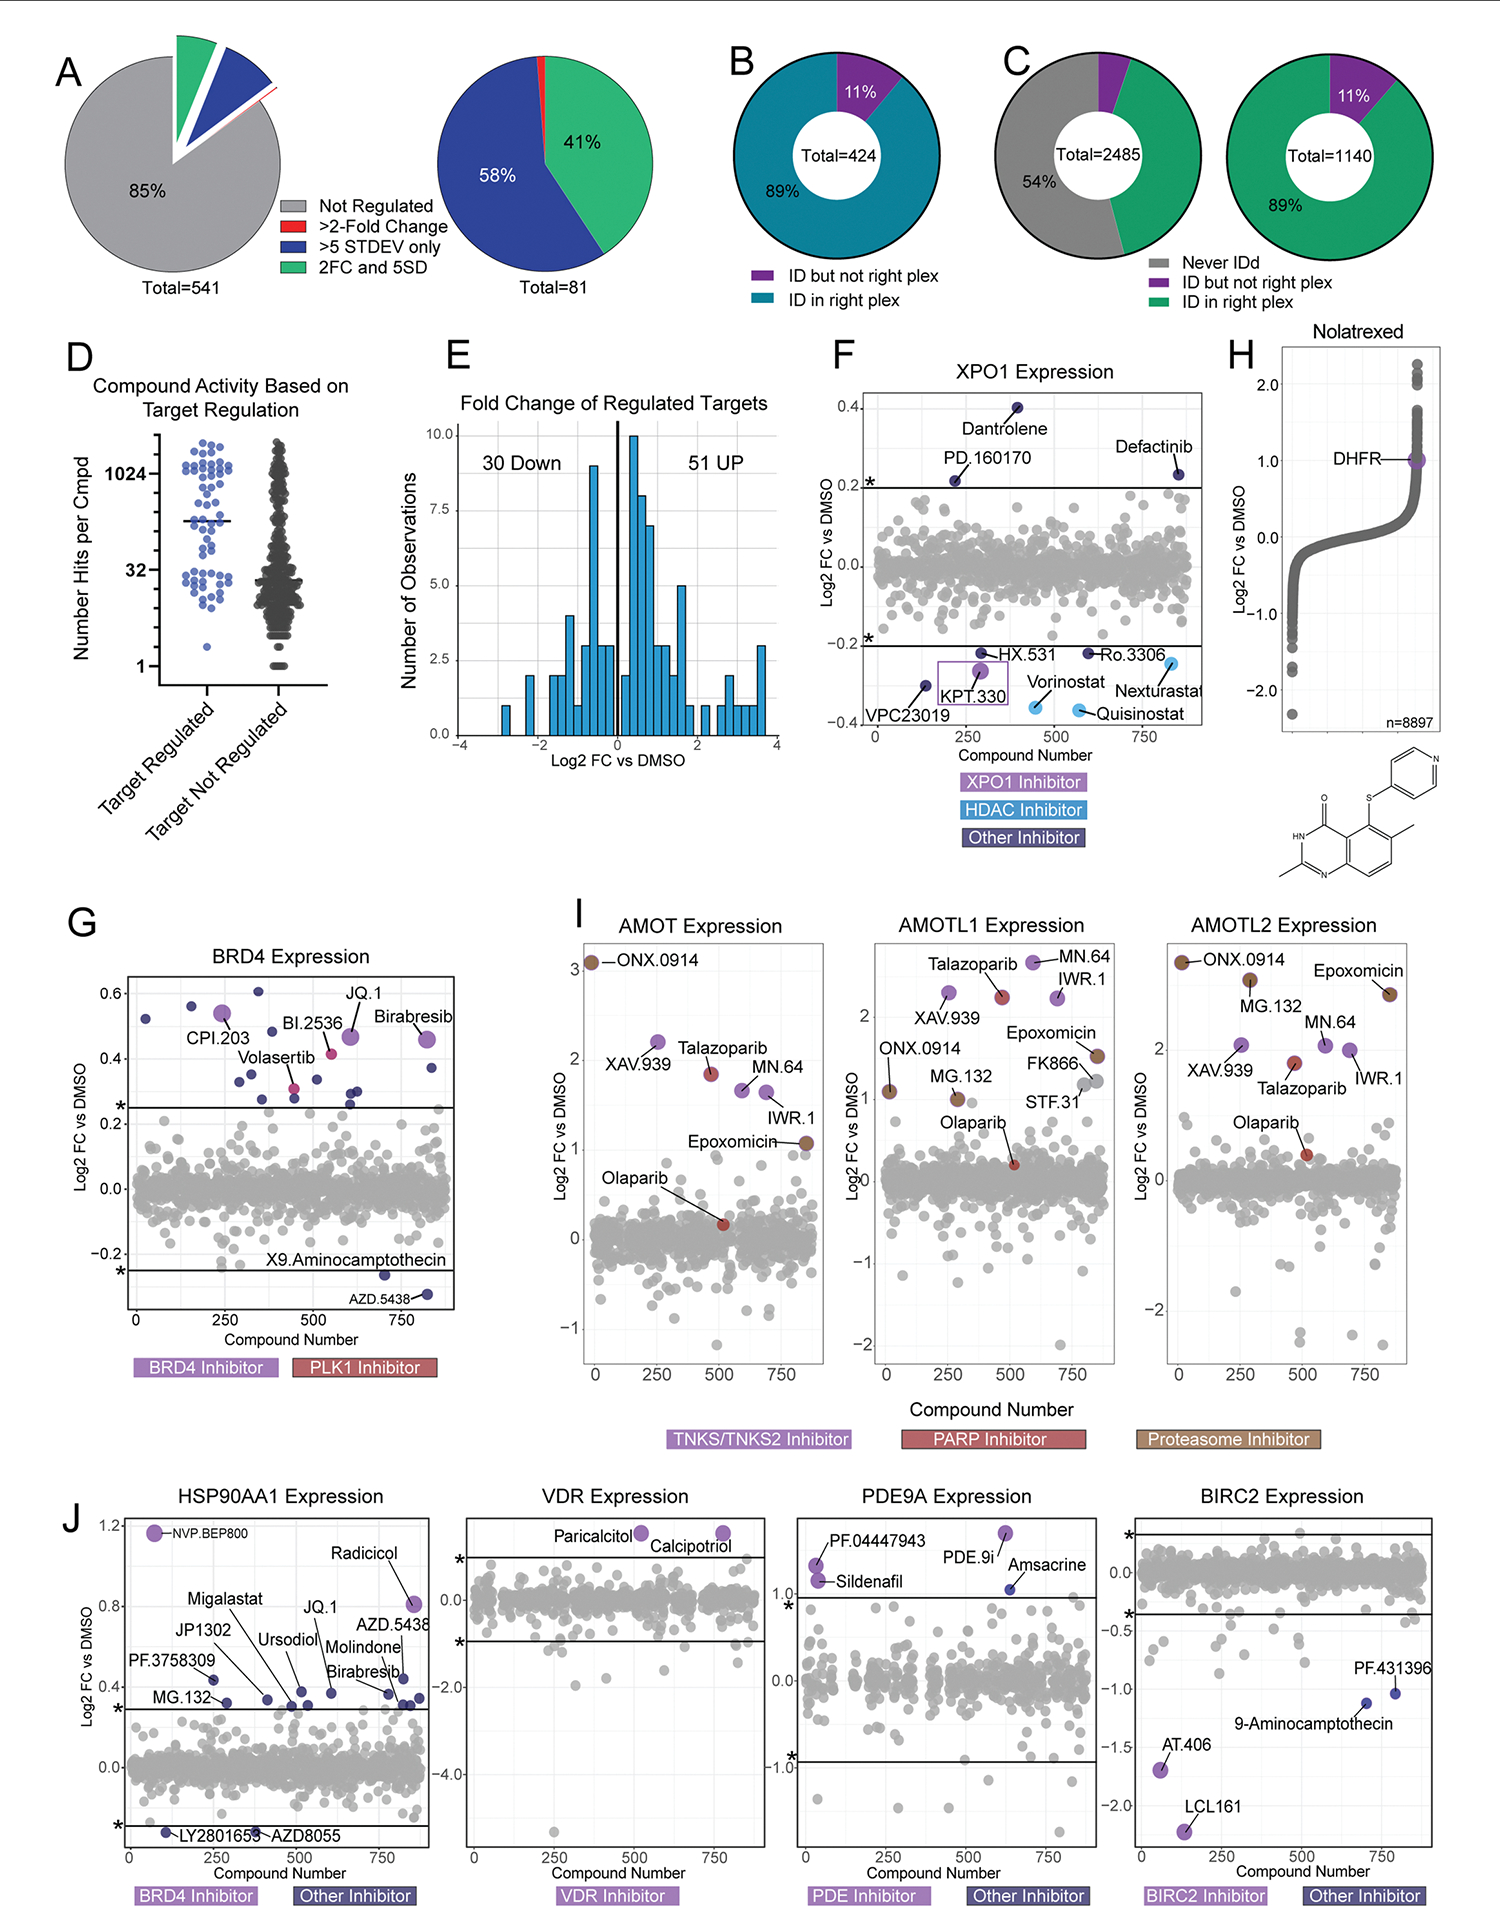
(a) The 541 compound-target pairs analyzed, broken down by the two different regulation thresholds. Those in green and red are highlighted/annotated in Fig. 3c. (b) Proportion of primary targets that were identified, broken down by whether they were quantified in the TMT group that contained the compound. For a fraction of the target-compound pairs (<11%), the target was expressed in HCT116 cells, but it was not quantified in the TMT plex containing the compound. (c) Proportion of all 2,485 annotated targets quantified in the dataset (d) Number of regulated events per compound, separated by those that regulate their target (blue) and those that do not (black). (e) Histogram of Log2 fold change (compound versus DMSO) for all compound-target regulation events. The number of upregulation and downregulation events is indicated. (f) The compound-target regulation event with the smallest fold change is highlighted in purple. The 5 SD threshold is marked with an asterisk. Three HDAC inhibitors also regulate XPO1 expression to similar levels, suggesting a five standard deviation cutoff captures reproducible biology. (g) BRD4 expression across the dataset, with BRD4 inhibitors (purple) and PLK1 inhibitors (red) annotated. This is a low-fold change regulation event, highly reproducible across several compounds of the same class. (h) Protein expression (Log2 fold change) of all quantified proteins for the TYMS inhibitor nolatrexed, (highlighted in Fig. 3d) with DHFR labeled. Compound structure is shown below. (i) Related to Fig. 3f: Expression of the angiomotin family of proteins (AMOT, AMOTL1, and AMOTL2) across the MOA dataset. TNKS inhibitors (purple), PARP inhibitors (red) and proteasome inhibitors (brown) are highlighted. ( j) Expression of several proteins regulated by at least two compounds that target them. In each case the 5 SD threshold is marked with an asterisk.
Extended Data Fig. 4 |. Compounds with a similar MOA are strongly correlated.
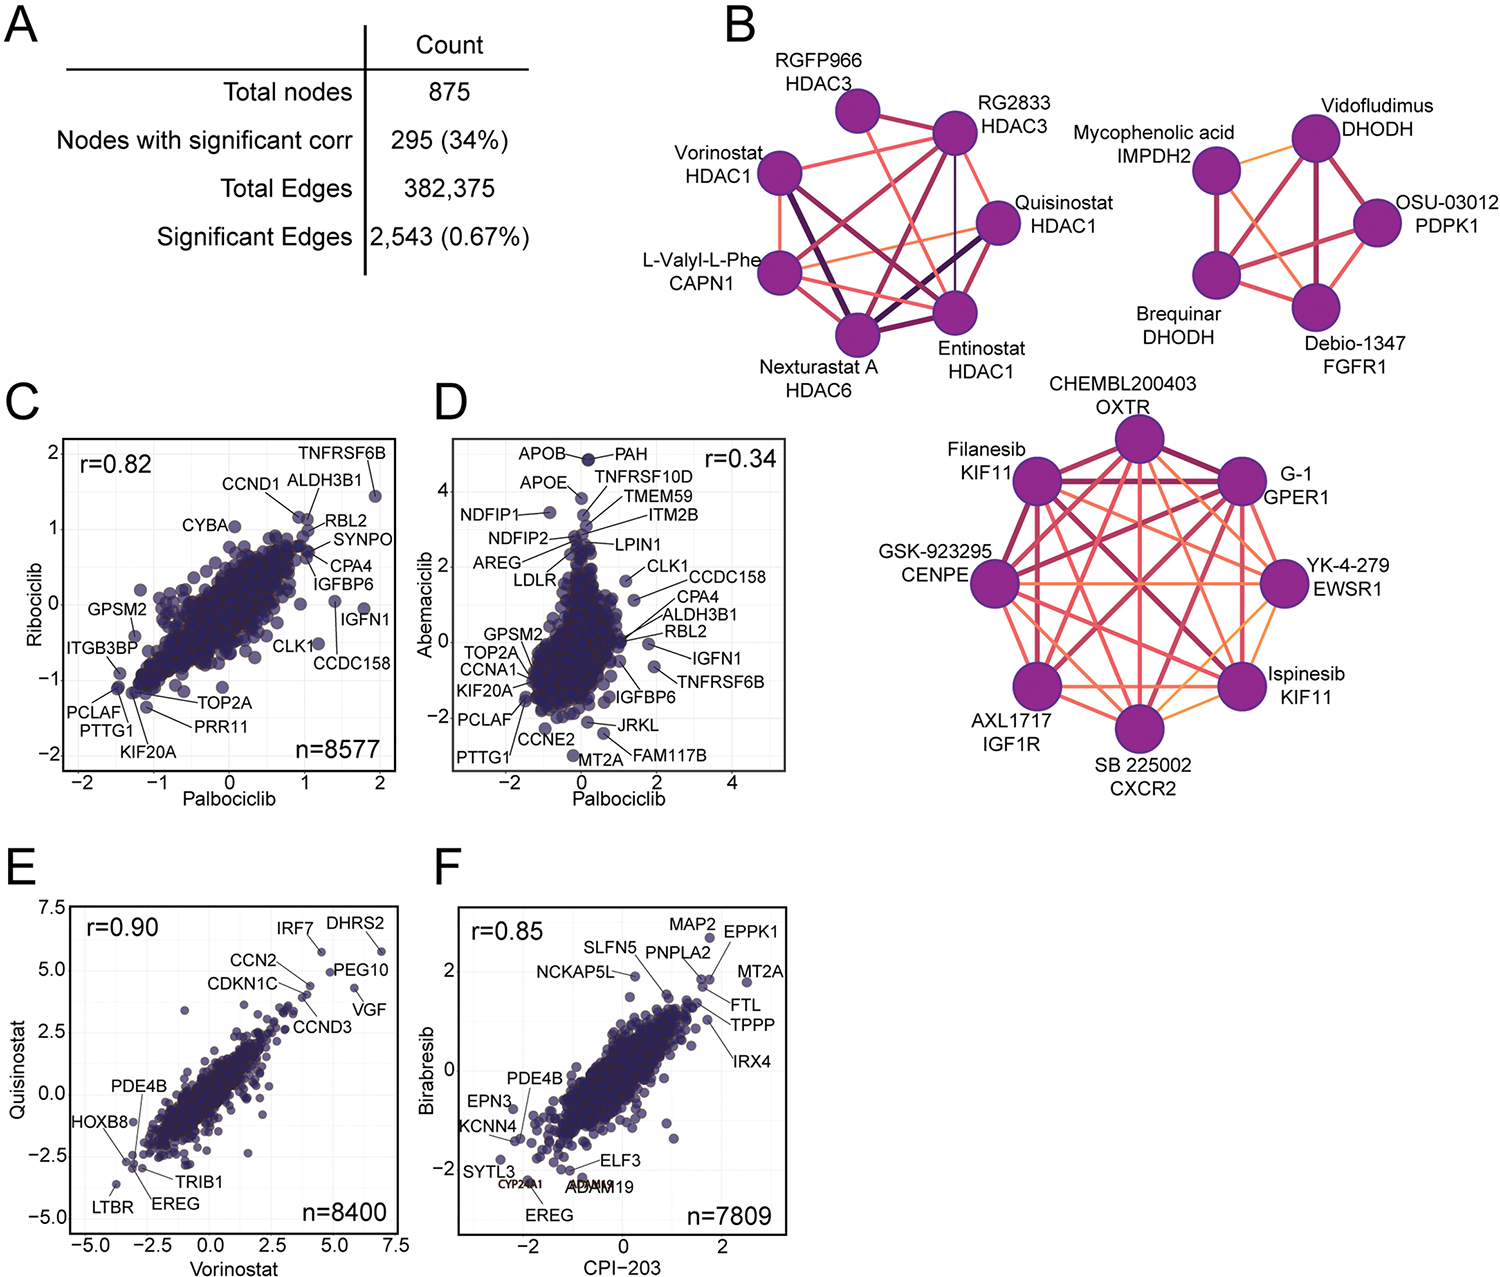
(a) A table highlighting the number of nodes and edges in the overall network from Fig. 4a, after filtering to a FDR of 0.1%. The percentage of nodes and edges included in the network out of the total possible is shown in parentheses. (b) Several subcommunities highlighted from the larger compound-compound correlation network, including a cluster of HDAC inhibitors. All subnetworks are filtered to only include edges with a Pearson r > 0.60. (c-f) Pairwise correlation plots of (c) the CDK4/6 inhibitors palbociclib and ribociclib, (d) the CDK4/6 inhibitors palbociclib and abemaciclib, (e) the HDAC inhibitors quisinostat and vorinostat, and (f) the BRD4 inhibitors birabresib and CPI-203. All x- and y-axes are represented as Log2 fold change (compound versus DMSO).
Extended Data Fig. 5 |. Proteins with similar functions are correlated across the dataset.
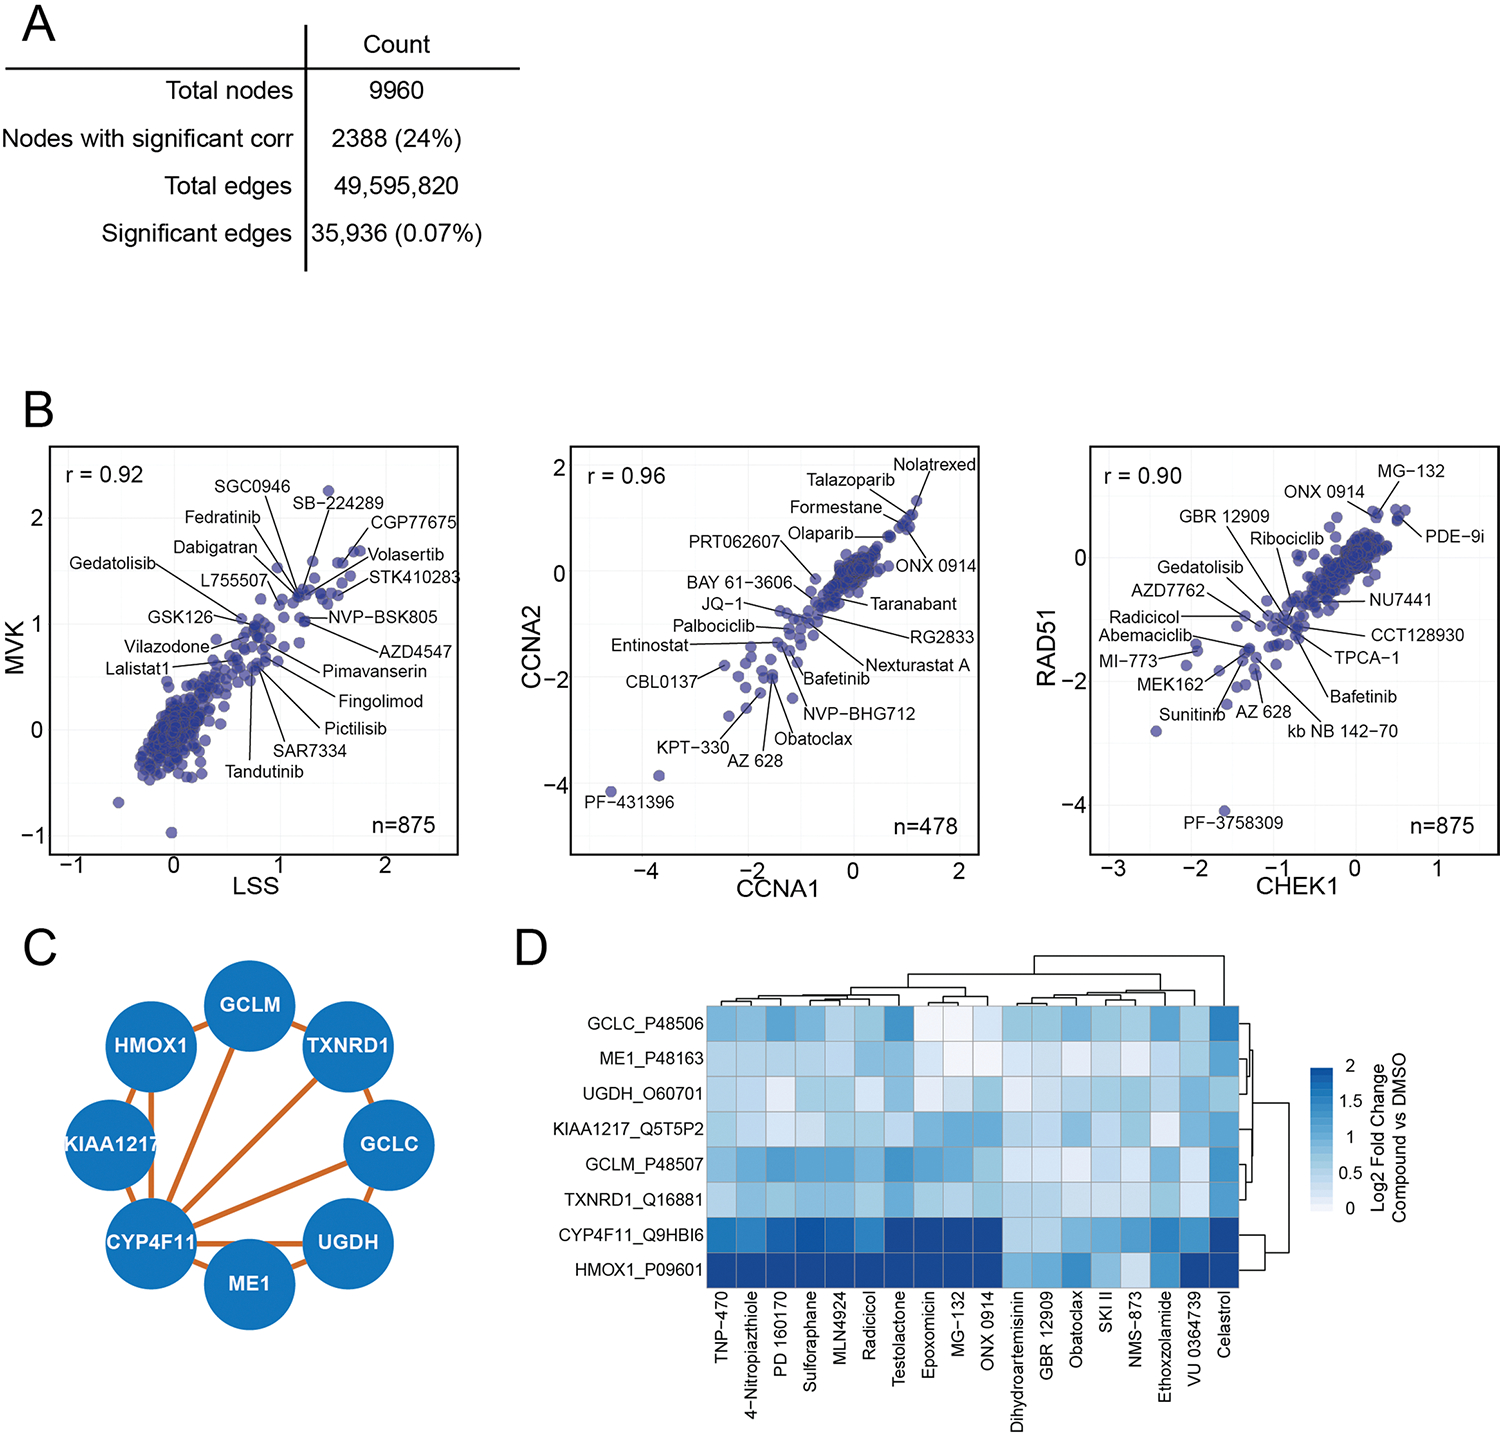
(a) A table highlighting the number of nodes and edges in the overall network from Fig. 5a, after filtering to a FDR less than 5%. The percentage of nodes and edges included in the network out of the total possible is shown in parentheses. (b) Correlation plots for select pairs of strongly correlated proteins. All x- and y-axes are represented as Log2 fold change versus DMSO. Each point represents one compound. Plots include: 1) mevalonate kinase (MVK) versus lanosterol synthase (LSS), two proteins essential for cholesterol biosynthesis; 2) cyclin A1 (CCNA1) and cyclin A2 (CCNA2); 3) DNA damage proteins RAD51 and CHEK1. (c) A subcommunity of proteins (from Fig. 5a) correlated to cytochrome P450 monooxygenase, including redox sensors HMOX and TXNRD1. (d) A heatmap of protein expression for each of the proteins from (c) for all compounds that increase their expression by a median Log2 fold change of >0.6.
Extended Data Fig. 6 |. Novel activities and compound mechanisms can be inferred through compound-level correlation networks.
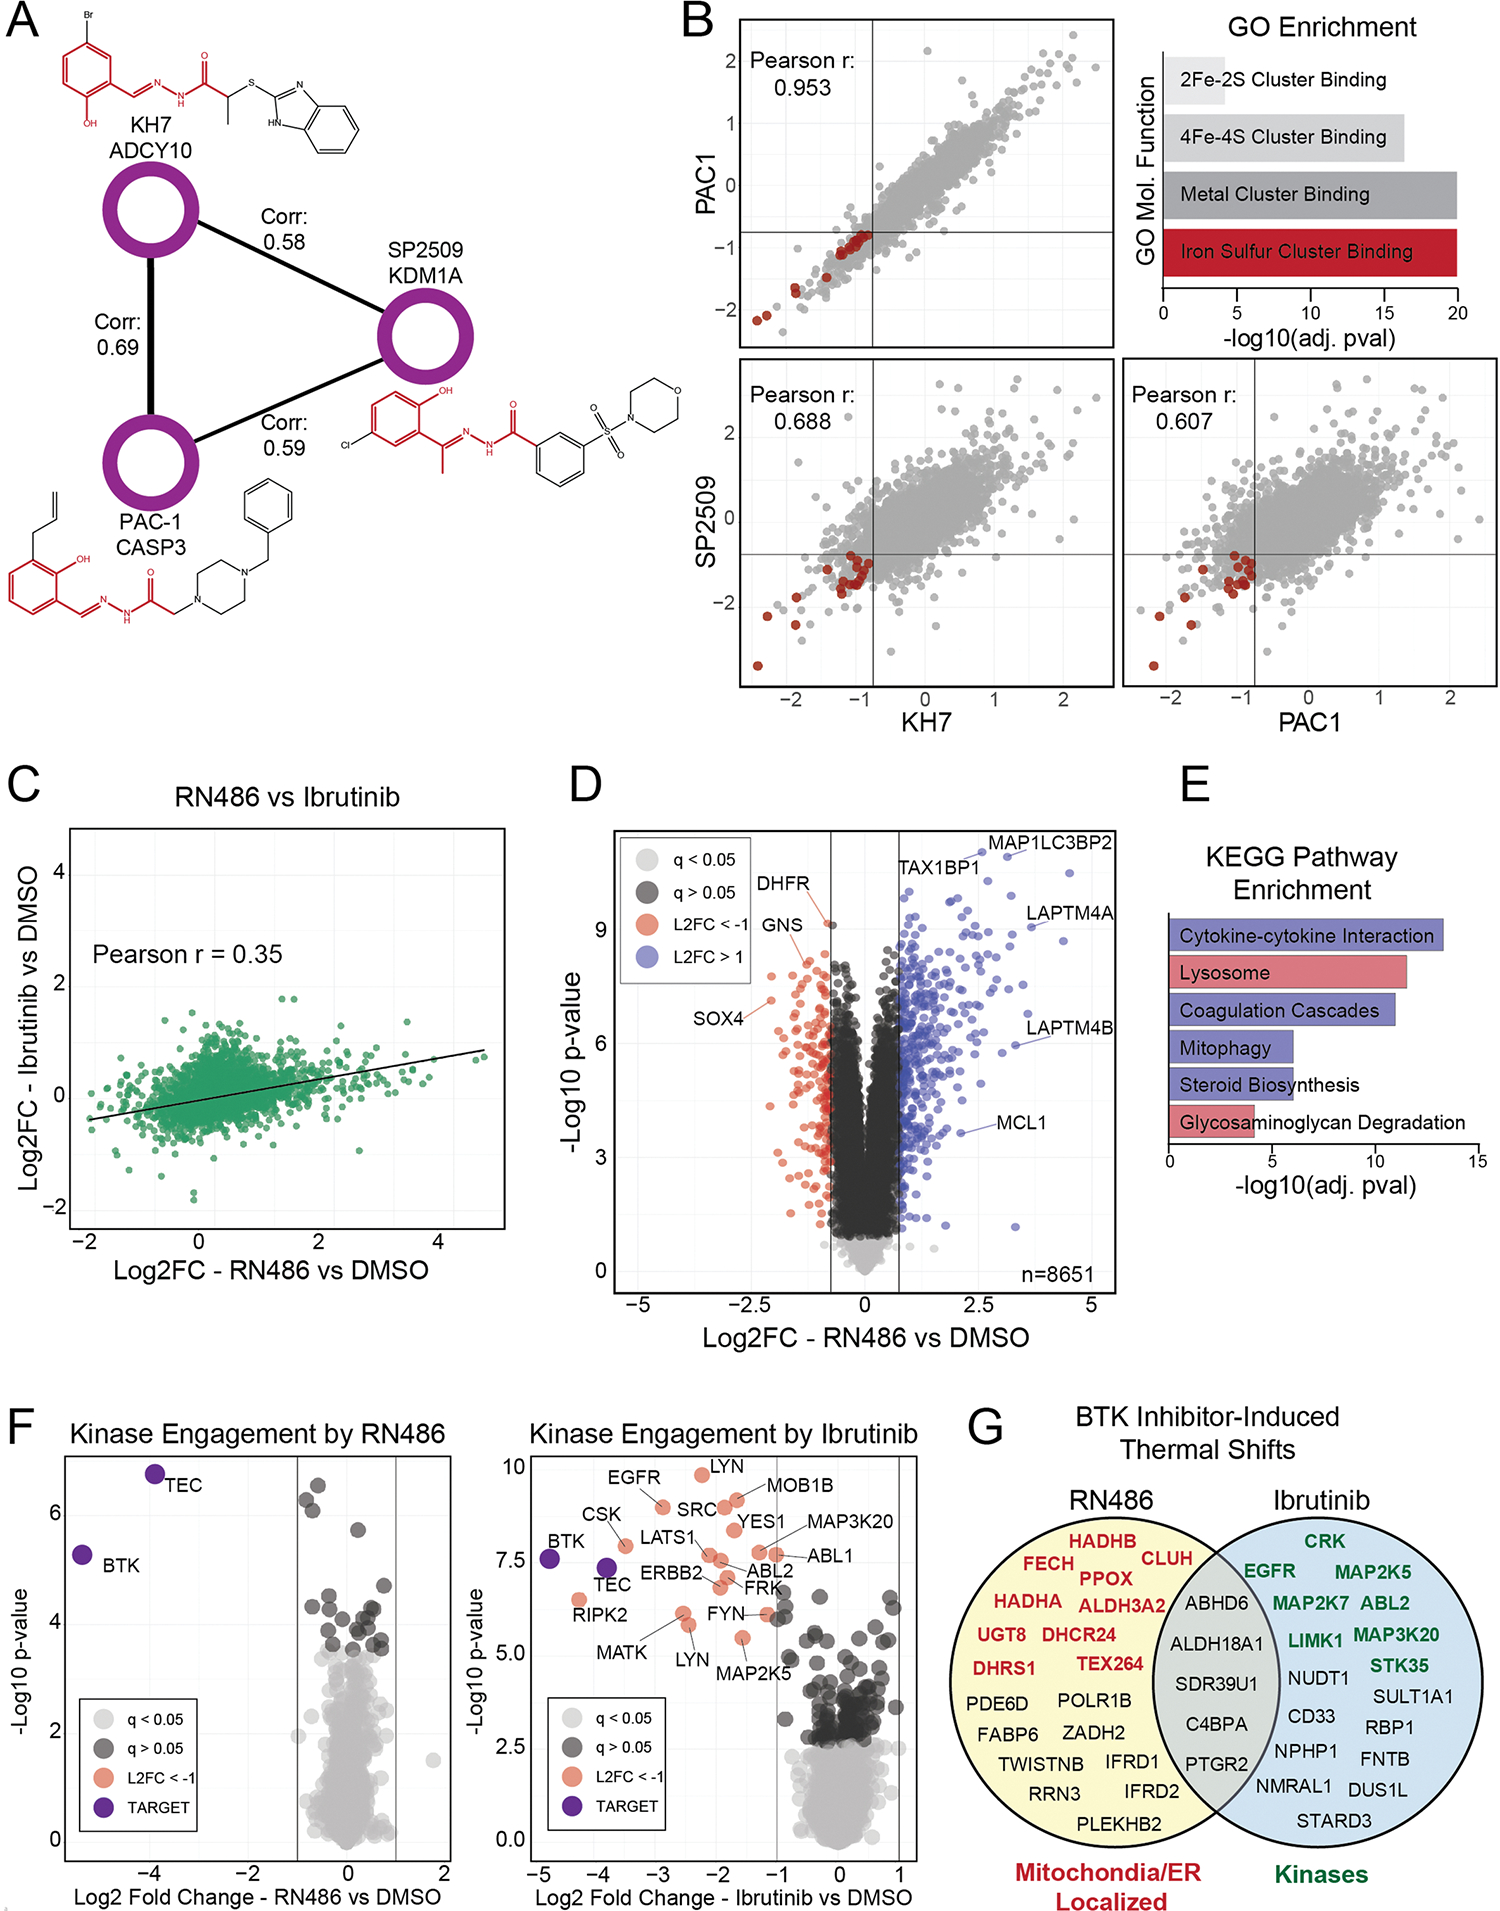
(a) An isolated community of three compounds with different targets and high correlation. Names, targets, and structures for each compound are shown. An aroylhydrazone group, common in all three compounds, is highlighted in red. (b) Correlation plots of the indicated compounds; repurchased and rescreened. All axes are Log2 fold change (compound versus DMSO). Lines are drawn at x = −0.75 and y = −0.75. GO enrichment of proteins decreased by ≥60% by all three compounds. Proteins from the ‘iron-sulfur cluster binding’ molecular function category are highlighted on the scatterplot in red. Enriched GO functions and their adjusted (using Benjamini-Hochberg) p-values were calculated using the enrichGO R package. (c) Correlation plot of repurchased RN486 (a noncovalent BTK inhibitor) and Ibrutinib (a covalent BTK inhibitor). (d) Volcano plot highlighting significantly up (blue) and down (red) regulated proteins in RN486 treated cells. ‘L2FC’ = Log2 fold change (RN486 vs DMSO) (e) KEGG pathway enrichment of up (blue bars) and down (red bars) regulated proteins in RN486 treated cells. Proteins used for KEGG pathway enrichment are color coded from (d). Enriched pathways and their adjusted (using Benjamini-Hochberg) p-values were calculated using the enrichKEGG R package. (f) Volcano plots of proteins competed off a kinase affinity enrichment medium (kinobeads) by RN486 (left) and Ibrutinib (right). A mixed lysate was used for this experiment, as BTK is not expressed in HCT116 cells. Compounds were tested at 10 μM, and all proteins with a two-fold or greater decrease in association with the enrichment matrix are labeled. BTK and TEC, the targets of these compounds, are highlighted in purple. ‘L2FC’ = Log2 fold change (treated vs DMSO) (g) Putative off targets of RN486 and Ibrutinib revealed by the proteome integral solubility alteration assay (PISA—a form of a thermal shift assay), performed in live HCT116 cells. Indicated proteins were significantly (5% FDR) stabilized or destabilized by treatment with one or both of the compounds (10 μM–30 min). All proteins with a Log2 fold change of >±0.25 are shown. Proteins localized to the mitochondria and/or endoplasmic reticulum are highlighted in red; kinases are highlighted in green. P-values in panels (d and f) were calculated for each protein within each treatment group relative to DMSO using a two-sided student’s t-test. False discovery rates (q-values) were estimated using the permutation-based method with 250 randomizations.
Extended Data Fig. 7 |. Novel activities and compound mechanisms can be inferred through compound-level correlation networks.
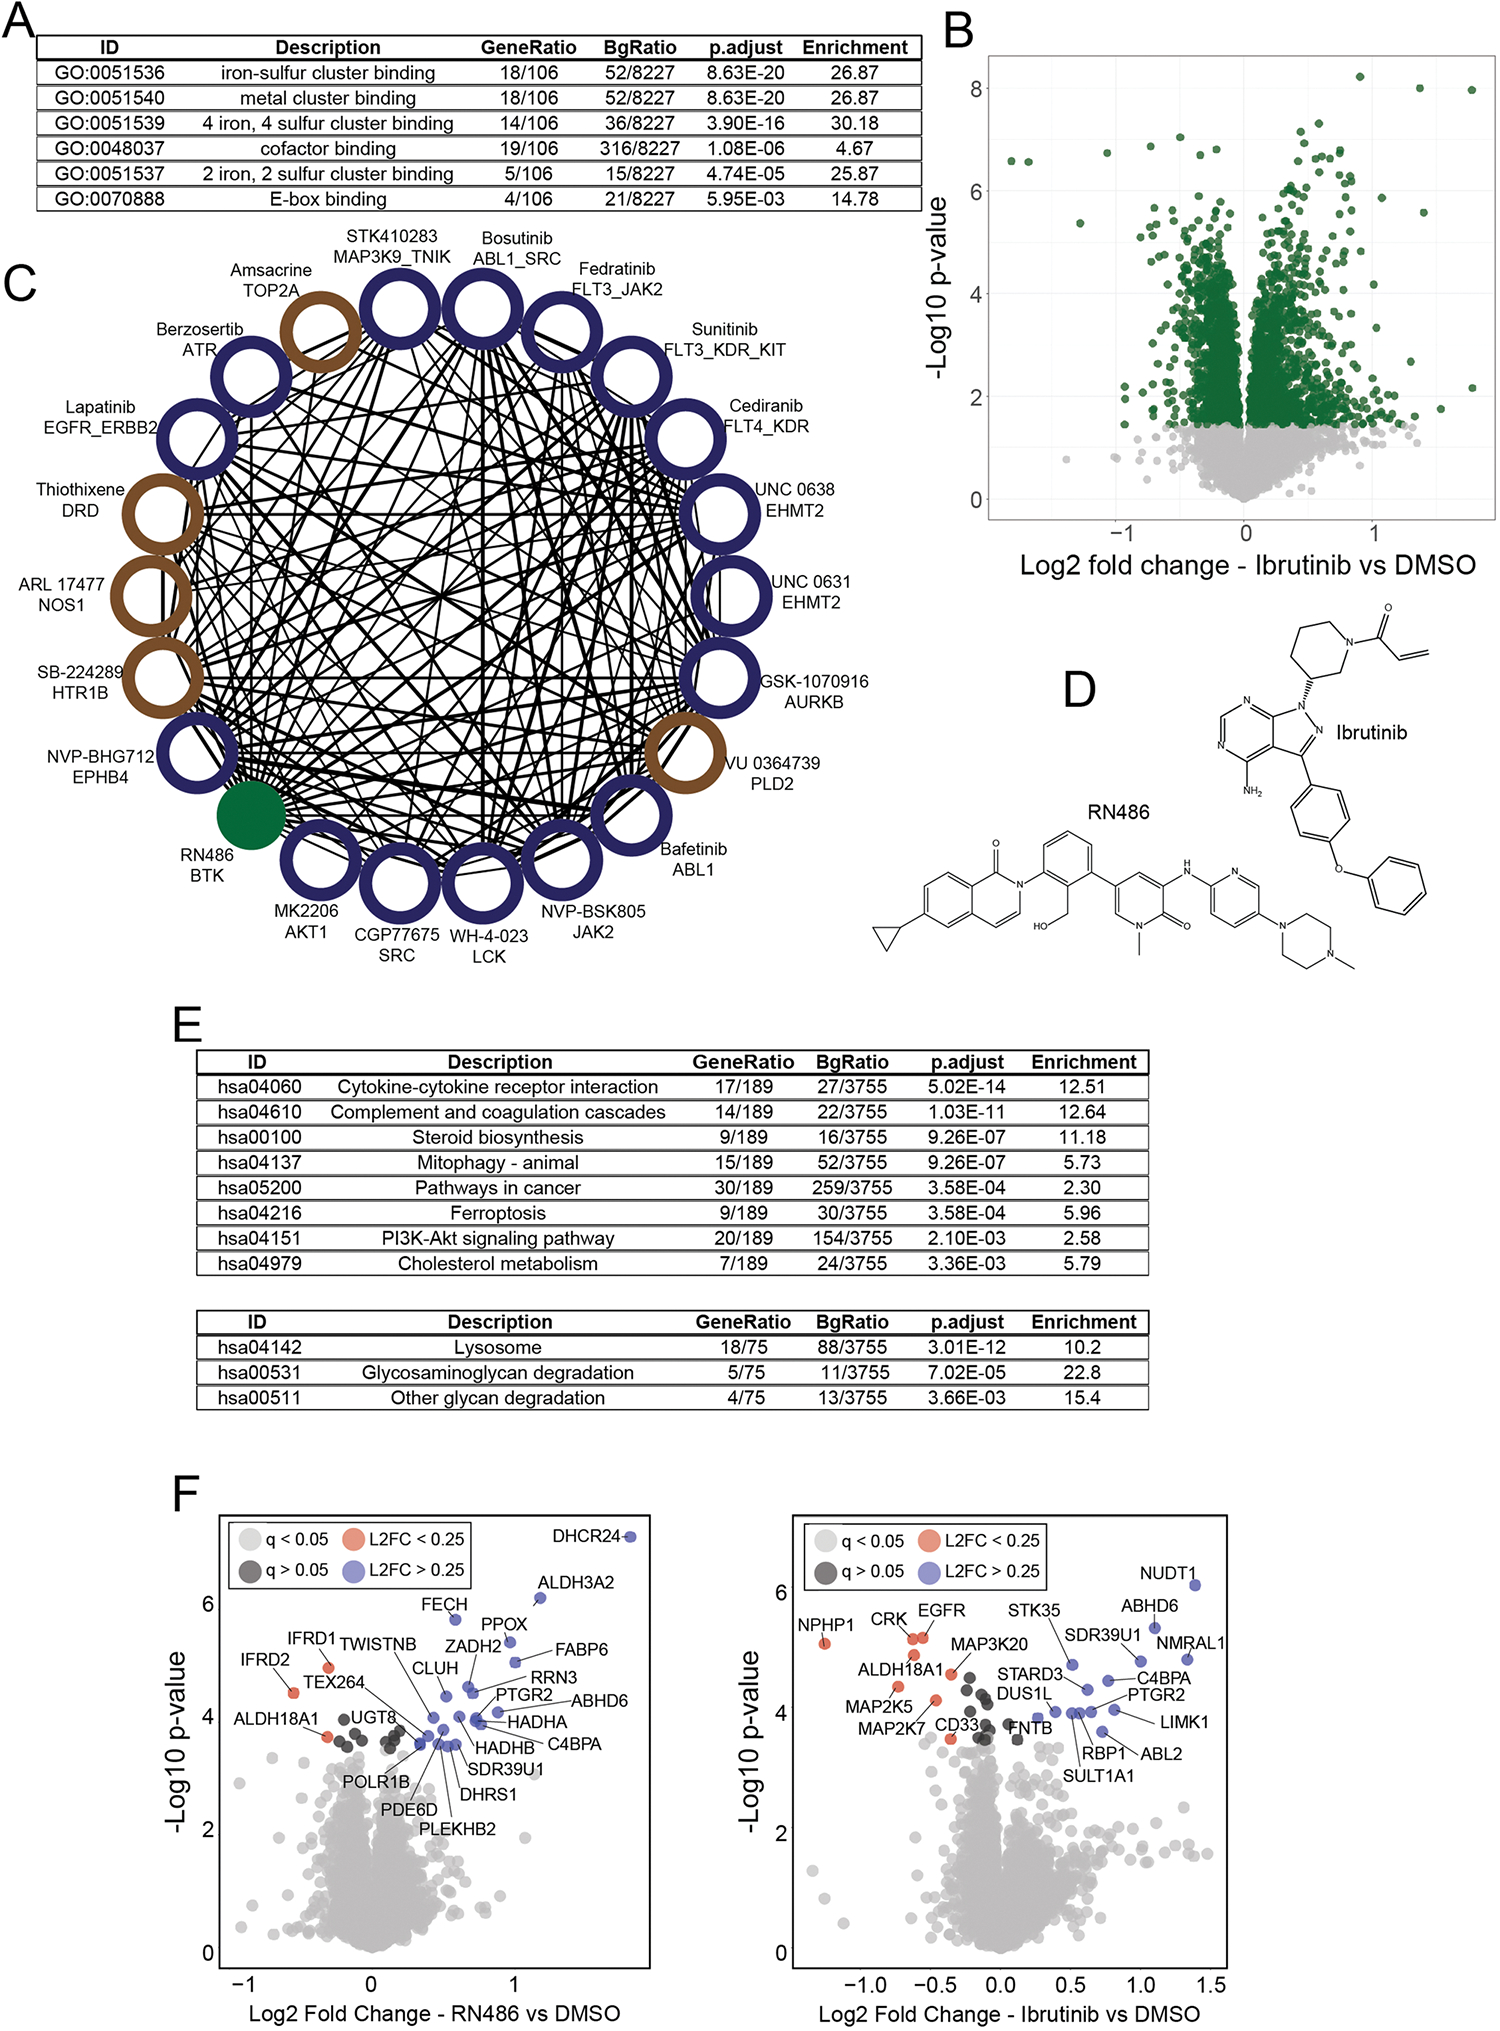
(a) Full table of GO enrichment results from Supplementary Fig. 6b. Enriched GO functions and their adjusted (using Benjamini-Hochberg) p-values were calculated using the enrichGO R package. (b) Volcano plot of protein expression from cells treated with (repurchased) ibrutinib for 24 hr at 10 μM. Green dots have q < 0.05 by permutation-based FDR. (c) Compound-compound community of RN486 correlated compounds (Pearson > 0.5). Blue nodes are kinase inhibitors, brown nodes are annotated to target other classes of proteins. The RN486 node is green. (d) Chemical structures of RN486 and Ibrutinib. (e) Full tables of KEGG pathway enrichment related to Supplementary Fig. 6E. Pathways enriched from upregulated proteins (top) and down-regulated proteins (bottom) are shown. Enriched pathways and their adjusted (using Benjamini-Hochberg) p-values were calculated using the enrichKEGG R package. (f) Volcano plot showing results of the thermal shift assay (PISA experiment) from HCT116 cells treated with Ibrutinib (left) or RN486 (right). Compounds were treated at 10 μM for 30 minutes in suspension. All proteins (with q < 0.05) with Log2FC greater than 0.25 or less than −0.25 are included in Fig. 6g. ‘L2FC’ = Log2 fold change (treated vs DMSO). P-values in panels (b and f) were calculated for each protein within each treatment group relative to DMSO using a two-sided student’s t-test. False discovery rates (q-values) were estimated using the permutation-based method with 250 randomizations.
Extended Data Fig. 8 |. JP1302 stops transcription by disrupting the FACT complex and histone H1.
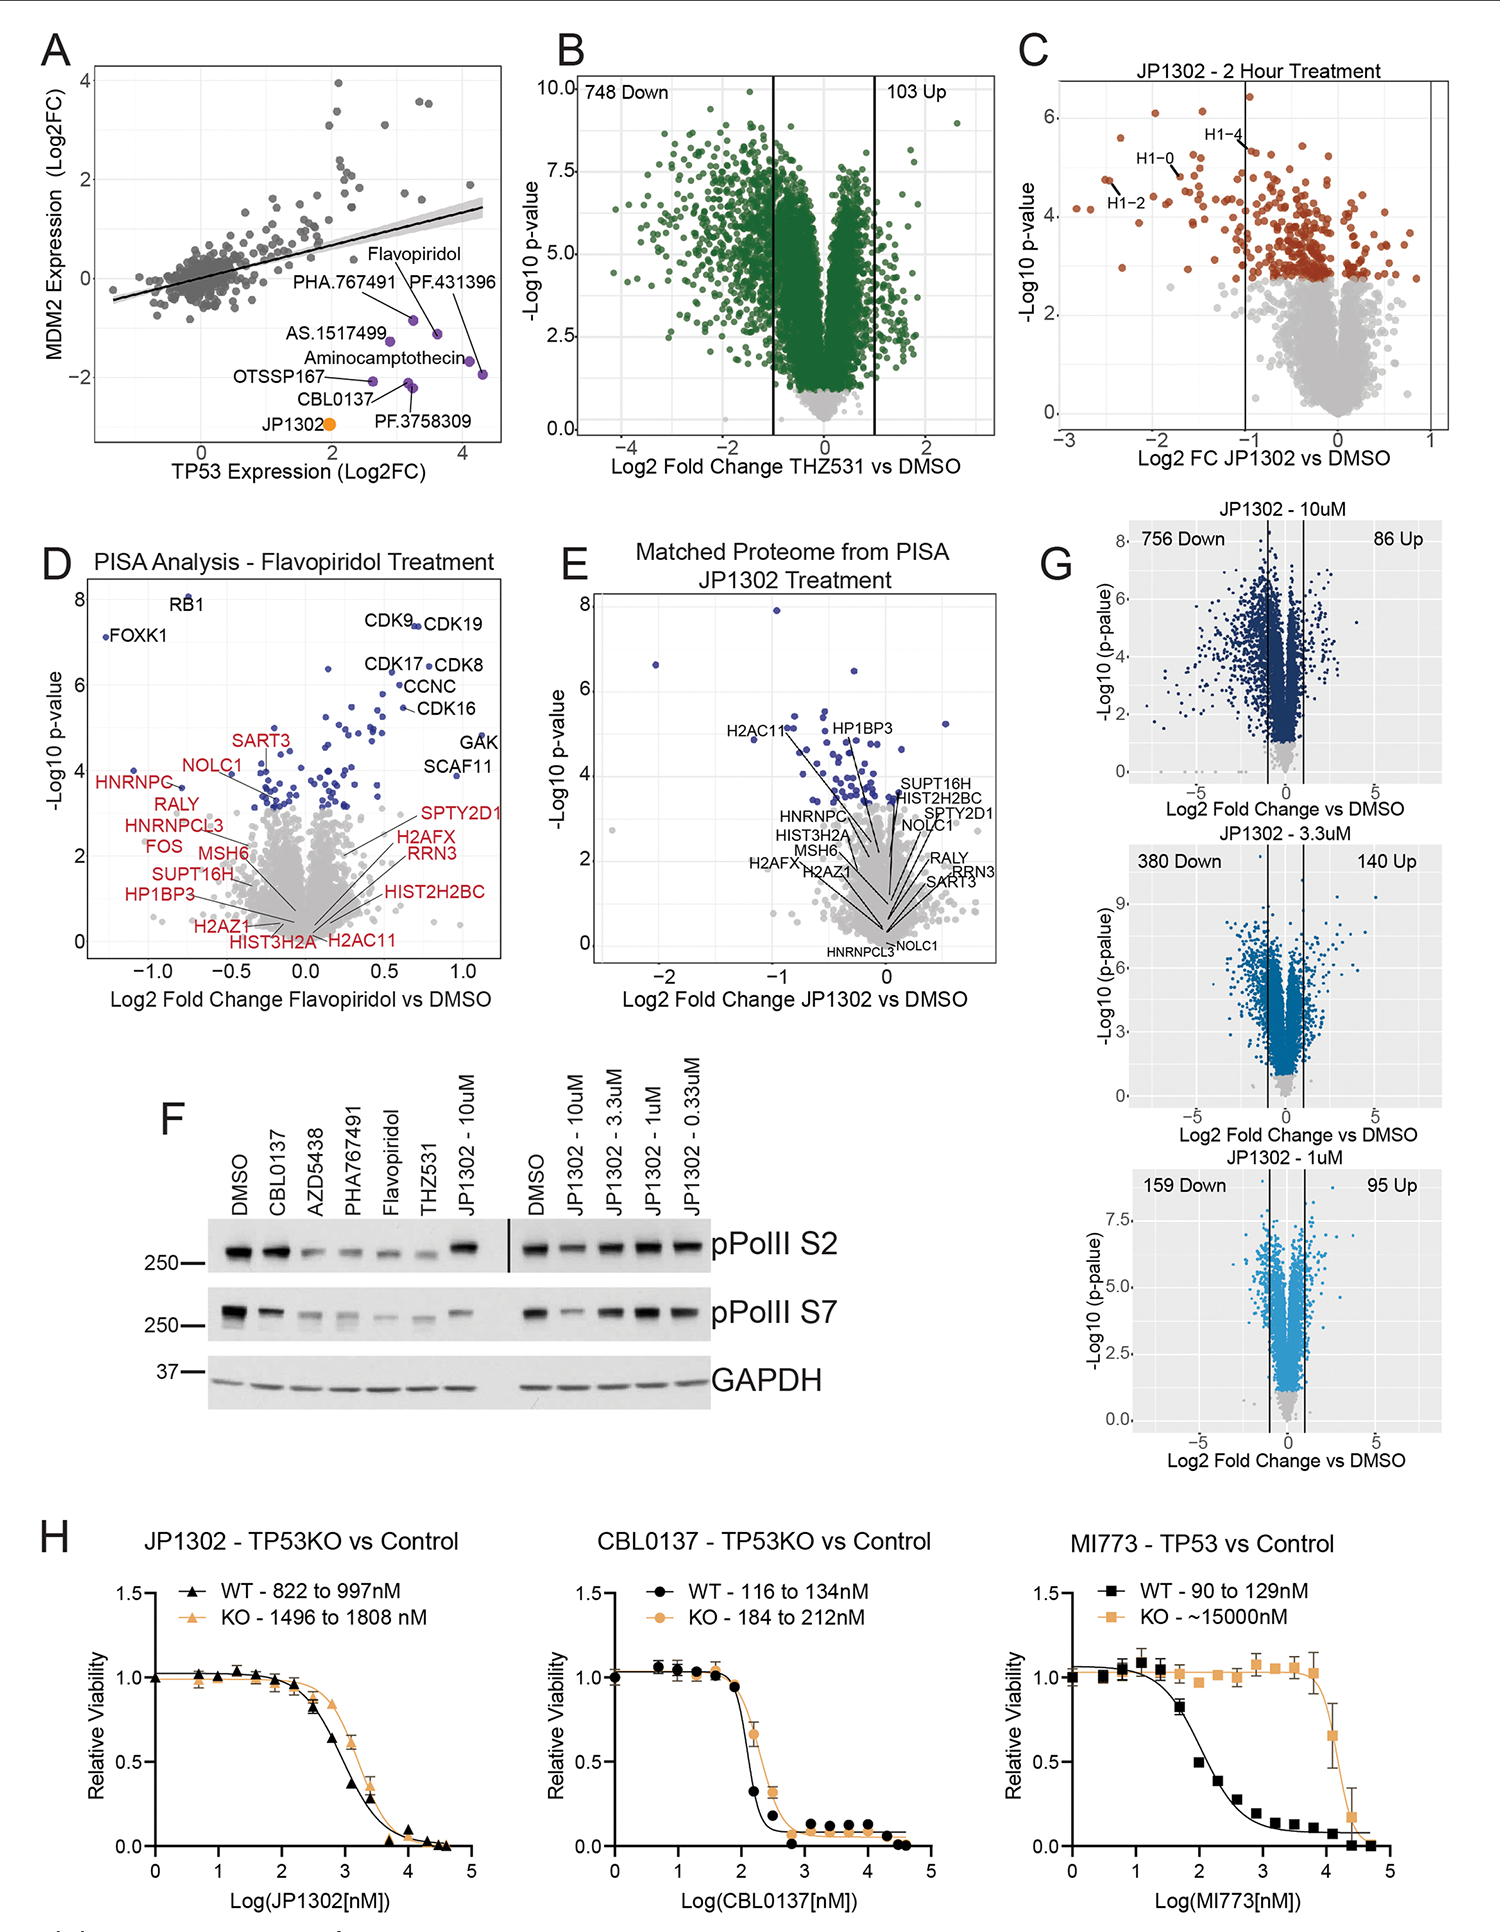
(a) Protein-level linear regression of TP53 and the TP53 response gene MDM2 for all compounds in the dataset. Compounds that break the expected trend are shown (purple), including JP1302 (orange). Shading along the regression line represents the 95% confidence interval. (b) Volcano plot of protein expression from HCT116 cells treated with 1 μM THZ531 for 24 hr. (c) Volcano plot of protein expression from HCT116 cells treated with repurchased JP1302 (10 μM) for 2 hr. (d) Volcano plot showing results from a PISA experiment from cells treated with flavopiridol (10 μM). Red labels correspond to the same proteins labeled in the CBL0137/JP1302 PISA experiment in Fig. 6h. Black text highlights proteins with melting temperatures uniquely affected by flavopiridol. (e) Volcano plot of protein expression from HCT116 cells treated with repurchased JP1302 for 30 min (10 μM), prior to being subjected to melting for PISA analysis. This is a matched proteome for Fig. 6h; the same proteins are labeled to show ligand-induced changes in thermal stability are not due to protein-level changes. (f) Western blot of RNA polymerase II phosphorylation levels in HCT116 cells treated for 90 minutes with indicated compounds. Treatment concentration is 10 μM or 1 μM (THZ531) unless indicated. The ‘pPolII S2’ panel is made from two separate Western blots, as indicated by the black vertical line. This experiment was performed twice, on different days, achieving similar results. (g) Volcano plots from the dose-dependent JP1302 whole proteome experiment. Noted in each plot is the number of proteins decreased by two-fold versus DMSO (left side) and increased two-fold versus DMSO (right side). (h) Full 16-point EC50 curves for the indicated compounds in HCT116 cells with wild-type (WT) TP53 or after TP53 knockout (KO). Labeled in each plot is the 95% confidence interval for each EC50 curve. Points on each curve are presented as the mean values ± standard deviation of biological triplicate measurements. MI773 is a nutlin-based, MDM2-P53 protein-protein interaction inhibitor. P-values in panels (B-E and G) were calculated for each protein within each treatment group relative to DMSO using a two-sided student’s t-test. False discovery rates (q-values) were estimated using the permutation-based method with 250 randomizations. Proteins with q > 0.05 are represented by light grey in each plot.
Extended Data Fig. 9 |. Proteome fingerprints can be maintained across a concentration range.
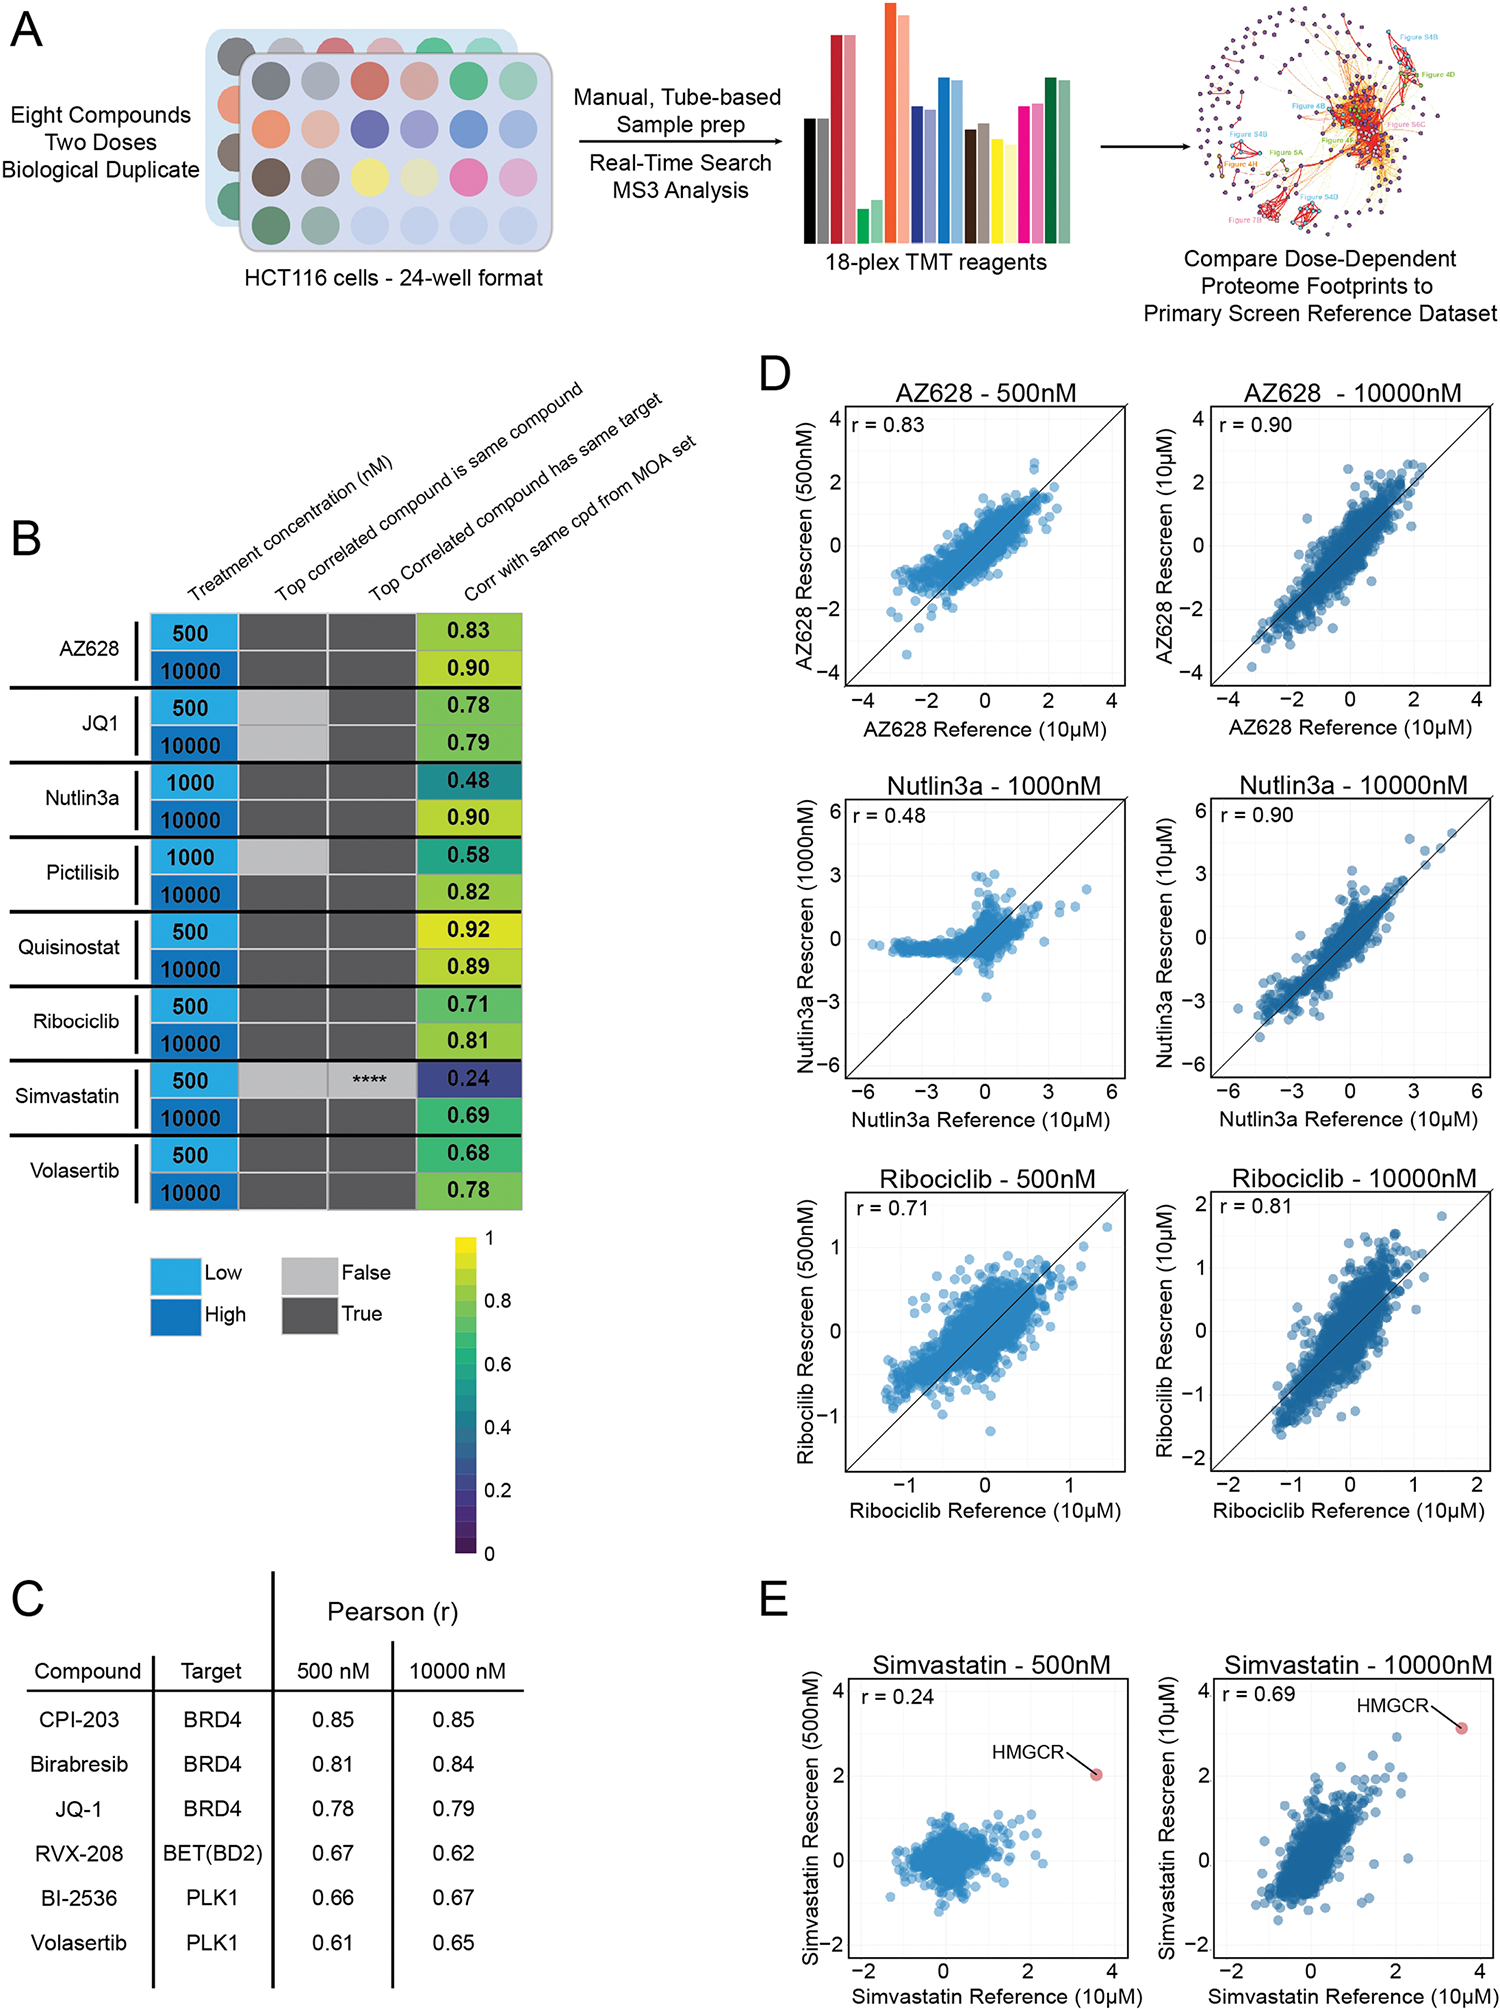
(a) Experimental design for a compound rescreen, which compares the proteome fingerprints of 8 tool compounds at two doses; 10 μM versus 500 nM or 1 μM, to those from the primary 875 compound MOA dataset (referred here as the reference dataset). **** There are no compounds with significant correlation (p > 0.38) to 500 nM Simvastatin (b) Study results depicting treatment concentration, identity of top correlated compounds from the reference dataset, and a heatmap of Pearson correlations (r) between proteome fingerprints from the indicated compound/concentration and the same compound from the reference dataset. (c) Table of the top six most similar compounds from the MOA reference dataset for the two treatment concentrations of JQ-1 from the rescreen experiment. (d) Scatterplots for a representative set of compounds from the rescreen experiment (y-axes) plotted against the indicated compound from the reference MOA dataset (x-axes). All values are Log2(fold change – compound vs. DMSO). The y = x line is shown on each plot to observe the relative trend in the relationship different concentrations and the reference proteome fingerprint. (e) Scatterplots for simvastatin, a HMGCR inhibitor, at two concentrations relative to the reference. This compound upregulates its target at both 500 nM and 10 μM.
Supplementary Material
Acknowledgements
We thank the ICCB-Longwood Screening Facility at Harvard Medical School for their help with small-molecule screening. We also thank J. Paolo for insightful discussions. This work was funded in part by grants from the National Institutes of Health (GM067945 to S.P.G.), a grant for technology development from Google Ventures/Third Rock Ventures (E.L.H. and S.P.G.), and the Mark Foundation for Cancer Research Fellow of the Damon Runyon Cancer Research Foundation Grant DRG2359–19 (J.G.V.V.).
Footnotes
Competing interests
S.P.G. is an advisory board member for Cell Signaling Technology, ThermoFisher Scientific, Cedilla Therapeutics, Casma Therapeutics and Frontier Medicines. The remaining authors declare no competing interests.
Reporting summary
Further information on research design is available in the Nature Portfolio Reporting Summary linked to this article.
Additional information
Extended data is available for this paper at https://doi.org/10.1038/s41587-022-01539-0.
Supplementary information The online version contains supplementary material available at https://doi.org/10.1038/s41587-022-01539-0.
Peer review information Nature Biotechnology thanks the anonymous reviewers for their contribution to the peer review of this work.
Reprints and permissions information is available at www.nature.com/reprints.
Data availability
More than 2,000 .RAW files have been deposited to MassiVE (MSV000089282). Spectra were searched against the human Uniprot database (download v.02/2020). Source data are provided with this paper.
References
- 1.Subramanian A et al. A next generation connectivity map: L1000 platform and the first 1,000,000 profiles. Cell 171, 1437–1452 e17 (2017). [DOI] [PMC free article] [PubMed] [Google Scholar]
- 2.Gygi SP et al. Correlation between protein and mRNA abundance in yeast. Mol. Cell. Biol. 19, 1720–1730 (1999). [DOI] [PMC free article] [PubMed] [Google Scholar]
- 3.Liu Y, Beyer A & Aebersold R On the dependency of cellular protein levels on mRNA abundance. Cell 165, 535–550 (2016). [DOI] [PubMed] [Google Scholar]
- 4.Nusinow DP et al. Quantitative proteomics of the cancer cell line encyclopedia. Cell 180, 387–402 e16 (2020). [DOI] [PMC free article] [PubMed] [Google Scholar]
- 5.Litichevskiy L et al. A library of phosphoproteomic and chromatin signatures for characterizing cellular responses to drug perturbations. Cell Syst. 6, 424–443e7 (2018). [DOI] [PMC free article] [PubMed] [Google Scholar]
- 6.Abelin JG et al. Reduced-representation phosphosignatures measured by quantitative targeted MS capture cellular states and enable large-scale comparison of drug-induced phenotypes. Mol. Cell Proteomics 15, 1622–1641 (2016). [DOI] [PMC free article] [PubMed] [Google Scholar]
- 7.Chernobrovkin A et al. Functional identification of target by expression proteomics (FITExP) reveals protein targets and highlights mechanisms of action of small molecule drugs. Sci. Rep. 5, 11176 (2015). [DOI] [PMC free article] [PubMed] [Google Scholar]
- 8.Saei AA et al. ProTargetMiner as a proteome signature library of anticancer molecules for functional discovery. Nat. Commun. 10, 5715 (2019). [DOI] [PMC free article] [PubMed] [Google Scholar]
- 9.Ruprecht B et al. A mass spectrometry-based proteome map of drug action in lung cancer cell lines. Nat. Chem. Biol. 16, 1111–1119 (2020). [DOI] [PubMed] [Google Scholar]
- 10.Bian Y et al. Robust, reproducible and quantitative analysis of thousands of proteomes by micro-flow LC-MS/MS. Nat. Commun. 11, 157 (2020). [DOI] [PMC free article] [PubMed] [Google Scholar]
- 11.Messner CB et al. Ultra-high-throughput clinical proteomics reveals classifiers of COVID-19 infection. Cell Syst. 11, 11–24 e4 (2020). [DOI] [PMC free article] [PubMed] [Google Scholar]
- 12.Li J et al. TMTpro reagents: a set of isobaric labeling mass tags enables simultaneous proteome-wide measurements across 16 samples. Nat. Methods 17, 399–404 (2020). [DOI] [PMC free article] [PubMed] [Google Scholar]
- 13.Thompson A et al. Tandem mass tags: a novel quantification strategy for comparative analysis of complex protein mixtures by MS/MS. Anal. Chem. 75, 1895–1904 (2003). [DOI] [PubMed] [Google Scholar]
- 14.Kuljanin M et al. Reimagining high-throughput profiling of reactive cysteines for cell-based screening of large electrophile libraries. Nat. Biotechnol. 39, 630–641 (2021). [DOI] [PMC free article] [PubMed] [Google Scholar]
- 15.Li J et al. Proteome-wide mapping of short-lived proteins in human cells. Mol. Cell 81, 4722–4735 e5 (2021). [DOI] [PMC free article] [PubMed] [Google Scholar]
- 16.McAlister GC et al. MultiNotch MS3 enables accurate, sensitive, and multiplexed detection of differential expression across cancer cell line proteomes. Anal. Chem. 86, 7150–7158 (2014). [DOI] [PMC free article] [PubMed] [Google Scholar]
- 17.Schweppe DK et al. Full-featured, real-time database searching platform enables fast and accurate multiplexed quantitative proteomics. J. Proteome Res. 19, 2026–2034 (2020). [DOI] [PMC free article] [PubMed] [Google Scholar]
- 18.Ting L et al. MS3 eliminates ratio distortion in isobaric multiplexed quantitative proteomics. Nat. Methods 8, 937–940 (2011). [DOI] [PMC free article] [PubMed] [Google Scholar]
- 19.Erickson BK et al. Active instrument engagement combined with a real-time database search for improved performance of sample multiplexing workflows. J. Proteome Res. 18, 1299–1306 (2019). [DOI] [PMC free article] [PubMed] [Google Scholar]
- 20.Uhlen M et al. Towards a knowledge-based human protein atlas. Nat. Biotechnol. 28, 1248–1250 (2010). [DOI] [PubMed] [Google Scholar]
- 21.Fischer ES et al. Structure of the DDB1–CRBN E3 ubiquitin ligase in complex with thalidomide. Nature 512, 49–53 (2014). [DOI] [PMC free article] [PubMed] [Google Scholar]
- 22.Kronke J et al. Lenalidomide causes selective degradation of IKZF1 and IKZF3 in multiple myeloma cells. Science 343, 301–305 (2014). [DOI] [PMC free article] [PubMed] [Google Scholar]
- 23.Donovan KA et al. Thalidomide promotes degradation of SALL4, a transcription factor implicated in Duane Radial Ray syndrome. eLife 7, e38430 (2018). [DOI] [PMC free article] [PubMed] [Google Scholar]
- 24.Sievers QL et al. Defining the human C2H2 zinc finger degrome targeted by thalidomide analogs through CRBN. Science 362, eaat0572 (2018). [DOI] [PMC free article] [PubMed] [Google Scholar]
- 25.Misra S, Ghatak S & Toole BP Regulation of MDR1 expression and drug resistance by a positive feedback loop involving hyaluronan, phosphoinositide 3-kinase, and ErbB2. J. Biol. Chem. 280, 20310–20315 (2005). [DOI] [PubMed] [Google Scholar]
- 26.Rozengurt E, Soares HP & Sinnet-Smith J Suppression of feedback loops mediated by PI3K/mTOR induces multiple overactivation of compensatory pathways: an unintended consequence leading to drug resistance. Mol. Cancer Ther. 13, 2477–2488 (2014). [DOI] [PMC free article] [PubMed] [Google Scholar]
- 27.Foulds CE Disrupting a negative feedback loop drives endocrine therapy-resistant breast cancer. Proc. Natl Acad. Sci. USA 115, 8236–8238 (2018). [DOI] [PMC free article] [PubMed] [Google Scholar]
- 28.Iskar M et al. Drug-induced regulation of target expression. PLoS Comput. Biol. 6, e1000925 (2010). [DOI] [PMC free article] [PubMed] [Google Scholar]
- 29.Isik Z et al. Drug target prioritization by perturbed gene expression and network information. Sci. Rep. 5, 17417 (2015). [DOI] [PMC free article] [PubMed] [Google Scholar]
- 30.Liu S et al. Structure-guided design and development of potent and selective dual bromodomain 4 (BRD4)/polo-like kinase 1 (PLK1) inhibitors. J. Med. Chem. 61, 7785–7795 (2018). [DOI] [PMC free article] [PubMed] [Google Scholar]
- 31.Wrobel A et al. Trimethoprim and other nonclassical antifolates an excellent template for searching modifications of dihydrofolate reductase enzyme inhibitors. J. Antibiot. (Tokyo) 73, 5–27 (2020). [DOI] [PMC free article] [PubMed] [Google Scholar]
- 32.Zhang Y et al. RNF146 is a poly(ADP-ribose)-directed E3 ligase that regulates axin degradation and Wnt signalling. Nat. Cell Biol. 13, 623–629 (2011). [DOI] [PubMed] [Google Scholar]
- 33.Wang W et al. Tankyrase inhibitors target YAP by stabilizing angiomotin family proteins. Cell Rep. 13, 524–532 (2015). [DOI] [PMC free article] [PubMed] [Google Scholar]
- 34.Thorsell AG et al. Structural basis for potency and promiscuity in poly(ADP-ribose) polymerase (PARP) and tankyrase inhibitors. J. Med. Chem. 60, 1262–1271 (2017). [DOI] [PMC free article] [PubMed] [Google Scholar]
- 35.Strimmer K fdrtool: a versatile R package for estimating local and tail area-based false discovery rates. Bioinformatics 24, 1461–1462 (2008). [DOI] [PubMed] [Google Scholar]
- 36.Finn RS et al. PD 0332991, a selective cyclin D kinase 4/6 inhibitor, preferentially inhibits proliferation of luminal estrogen receptor-positive human breast cancer cell lines in vitro. Breast Cancer Res. 11, R77 (2009). [DOI] [PMC free article] [PubMed] [Google Scholar]
- 37.Malumbres M & Barbacid M Cell cycle, CDKs and cancer: a changing paradigm. Nat. Rev. Cancer 9, 153–166 (2009). [DOI] [PubMed] [Google Scholar]
- 38.Villalonga-Planells R et al. Activation of p53 by nutlin-3a induces apoptosis and cellular senescence in human glioblastoma multiforme. PLoS One 6, e18588 (2011). [DOI] [PMC free article] [PubMed] [Google Scholar]
- 39.Hafner M et al. Multiomics profiling establishes the polypharmacology of FDA-approved CDK4/6 Inhibitors and the potential for differential clinical activity. Cell Chem. Biol. 26, 1067–1080 e8 (2019). [DOI] [PMC free article] [PubMed] [Google Scholar]
- 40.Filippakopoulos P et al. Selective inhibition of BET bromodomains. Nature 468, 1067–1073 (2010). [DOI] [PMC free article] [PubMed] [Google Scholar]
- 41.Picaud S et al. RVX-208, an inhibitor of BET transcriptional regulators with selectivity for the second bromodomain. Proc. Natl Acad. Sci. USA 110, 19754–19759 (2013). [DOI] [PMC free article] [PubMed] [Google Scholar]
- 42.Delmore JE et al. BET bromodomain inhibition as a therapeutic strategy to target c-Myc. Cell 146, 904–917 (2011). [DOI] [PMC free article] [PubMed] [Google Scholar]
- 43.Boada-Romero E et al. TMEM59 defines a novel ATG16L1-binding motif that promotes local activation of LC3. EMBO J. 32, 566–582 (2013). [DOI] [PMC free article] [PubMed] [Google Scholar]
- 44.Gremke N et al. mTOR-mediated cancer drug resistance suppresses autophagy and generates a druggable metabolic vulnerability. Nat. Commun. 11, 4684 (2020). [DOI] [PMC free article] [PubMed] [Google Scholar]
- 45.Mauvezin C & Neufeld TP Bafilomycin A1 disrupts autophagic flux by inhibiting both V-ATPase-dependent acidification and Ca-P60A/SERCA-dependent autophagosome-lysosome fusion. Autophagy 11, 1437–1438 (2015). [DOI] [PMC free article] [PubMed] [Google Scholar]
- 46.Shen S et al. Association and dissociation of autophagy, apoptosis and necrosis by systematic chemical study. Oncogene 30, 4544–4556 (2011). [DOI] [PubMed] [Google Scholar]
- 47.Becker E & Richardson DR Development of novel aroylhydrazone ligands for iron chelation therapy: 2-pyridylcarboxaldehyde isonicotinoyl hydrazone analogs. J. Lab. Clin. Med. 134, 510–521 (1999). [DOI] [PubMed] [Google Scholar]
- 48.Cukierman DS et al. Aroylhydrazones constitute a promising class of ‘metal-protein attenuating compounds’ for the treatment of Alzheimer’s disease: a proof-of-concept based on the study of the interactions between zinc(II) and pyridine2-carboxaldehyde isonicotinoyl hydrazone. J. Biol. Inorg. Chem. 23, 1227–1241 (2018). [DOI] [PubMed] [Google Scholar]
- 49.Lin A et al. Off-target toxicity is a common mechanism of action of cancer drugs undergoing clinical trials. Sci. Transl. Med. 11, eaaw8412 (2019). [DOI] [PMC free article] [PubMed] [Google Scholar]
- 50.Li F et al. Procaspase-3-activating compound 1 stabilizes hypoxia-inducible factor 1alpha and induces DNA damage by sequestering ferrous iron. Cell Death Dis. 9, 1025 (2018). [DOI] [PMC free article] [PubMed] [Google Scholar]
- 51.Deeks ED Ibrutinib: a review in chronic lymphocytic leukaemia. Drugs 77, 225–236 (2017). [DOI] [PubMed] [Google Scholar]
- 52.Lou Y et al. Structure-based drug design of RN486, a potent and selective Bruton’s tyrosine kinase (BTK) inhibitor, for the treatment of rheumatoid arthritis. J. Med. Chem. 58, 512–516 (2015). [DOI] [PubMed] [Google Scholar]
- 53.Kanehisa M et al. KEGG as a reference resource for gene and protein annotation. Nucleic Acids Res. 44, D457–D462 (2016). [DOI] [PMC free article] [PubMed] [Google Scholar]
- 54.Gaetani M et al. Proteome integral solubility alteration: a high-throughput proteomics assay for target deconvolution. J. Proteome Res. 18, 4027–4037 (2019). [DOI] [PubMed] [Google Scholar]
- 55.Li J et al. Selection of heating temperatures improves the sensitivity of the proteome integral solubility alteration assay. J. Proteome Res. 19, 2159–2166 (2020). [DOI] [PMC free article] [PubMed] [Google Scholar]
- 56.An H et al. TEX264 is an endoplasmic reticulum-resident ATG8-Interacting protein critical for ER remodeling during nutrient stress. Mol. Cell 74, 891–908e10 (2019). [DOI] [PMC free article] [PubMed] [Google Scholar]
- 57.Chino H et al. Intrinsically disordered protein TEX264 mediates ER-phagy. Mol. Cell 74, 909–921e6 (2019). [DOI] [PubMed] [Google Scholar]
- 58.Tricklebank MD JP-1302: a new tool to shed light on the roles of alpha2C-adrenoceptors in brain. Br. J. Pharmacol. 150, 381–382 (2007). [DOI] [PMC free article] [PubMed] [Google Scholar]
- 59.Baumli S et al. The structure of P-TEFb (CDK9/cyclin T1), its complex with flavopiridol and regulation by phosphorylation. EMBO J. 27, 1907–1918 (2008). [DOI] [PMC free article] [PubMed] [Google Scholar]
- 60.Chang HW et al. Mechanism of FACT removal from transcribed genes by anticancer drugs curaxins. Sci. Adv. 4, eaav2131 (2018). [DOI] [PMC free article] [PubMed] [Google Scholar]
- 61.Zhang T et al. Covalent targeting of remote cysteine residues to develop CDK12 and CDK13 inhibitors. Nat. Chem. Biol. 12, 876–884 (2016). [DOI] [PMC free article] [PubMed] [Google Scholar]
- 62.Mah LJ, El-Osta A & Karagiannis TC gammaH2AX: a sensitive molecular marker of DNA damage and repair. Leukemia 24, 679–686 (2010). [DOI] [PubMed] [Google Scholar]
- 63.Schenone M et al. Target identification and mechanism of action in chemical biology and drug discovery. Nat. Chem. Biol. 9, 232–240 (2013). [DOI] [PMC free article] [PubMed] [Google Scholar]
- 64.Wouters OJ, McKee M & Luyten J Estimated research and development investment needed to bring a new medicine to Market, 2009–2018. JAMA 323, 844–853 (2020). [DOI] [PMC free article] [PubMed] [Google Scholar]
- 65.Huttlin EL et al. Dual proteome-scale networks reveal cell-specific remodeling of the human interactome. Cell 184, 3022–3040 e28 (2021). [DOI] [PMC free article] [PubMed] [Google Scholar]
- 66.Hughes CS et al. Ultrasensitive proteome analysis using paramagnetic bead technology. Mol. Syst. Biol. 10, 757 (2014). [DOI] [PMC free article] [PubMed] [Google Scholar]
- 67.Hughes CS et al. Single-pot, solid-phase-enhanced sample preparation for proteomics experiments. Nat. Protoc. 14, 68–85 (2019). [DOI] [PubMed] [Google Scholar]
- 68.Liu X, Gygi SP & Paulo JA A semiautomated paramagnetic bead-based platform for isobaric tag sample preparation. J. Am. Soc. Mass. Spectrom. 32, 1519–1529 (2021). [DOI] [PMC free article] [PubMed] [Google Scholar]
- 69.Navarrete-Perea J, Yu Q, Gygi SP & Paulo JA Streamlined tandem mass tag (SL-TMT) protocol: an efficient strategy for quantitative (phospho)proteome profiling using tandem mass tag-synchronous precursor selection-MS3. J. Proteome Res. 17, 2226–2236 (2018). [DOI] [PMC free article] [PubMed] [Google Scholar]
- 70.Schweppe DK et al. Characterization and optimization of multiplexed quantitative analyses using high-field asymmetric-waveform ion mobility mass spectrometry. Anal. Chem. 91, 4010–4016 (2019). [DOI] [PMC free article] [PubMed] [Google Scholar]
- 71.Rad R et al. Improved monoisotopic mass estimation for deeper proteome coverage. J. Proteome Res. 20, 591–598 (2021). [DOI] [PubMed] [Google Scholar]
- 72.Eng JK, Jahan TA & Hoopmann MR Comet: an open-source MS/MS sequence database search tool. Proteomics 13, 22–24 (2013). [DOI] [PubMed] [Google Scholar]
- 73.Elias JE & Gygi SP Target-decoy search strategy for increased confidence in large-scale protein identifications by mass spectrometry. Nat. Methods 4, 207–214 (2007). [DOI] [PubMed] [Google Scholar]
- 74.Huttlin EL et al. A tissue-specific atlas of mouse protein phosphorylation and expression. Cell 143, 1174–1189 (2010). [DOI] [PMC free article] [PubMed] [Google Scholar]
- 75.Savitski MM, Wilhelm M, Hahne H, Kuster B & Bantscheff M A scalable approach for protein false discovery rate estimation in large proteomic data sets. Mol. Cell Proteomics 14, 2394–2404 (2015). [DOI] [PMC free article] [PubMed] [Google Scholar]
- 76.Shannon P et al. Cytoscape: a software environment for integrated models of biomolecular interaction networks. Genome Res. 13, 2498–2504 (2003). [DOI] [PMC free article] [PubMed] [Google Scholar]
- 77.Tyanova S et al. The Perseus computational platform for comprehensive analysis of (prote)omics data. Nat. Methods 13, 731–740 (2016). [DOI] [PubMed] [Google Scholar]
Associated Data
This section collects any data citations, data availability statements, or supplementary materials included in this article.
Supplementary Materials
Data Availability Statement
More than 2,000 .RAW files have been deposited to MassiVE (MSV000089282). Spectra were searched against the human Uniprot database (download v.02/2020). Source data are provided with this paper.


