


Abstract
We have used atomic force microscopy (AFM) to study the conformation of three-way DNA junctions, intermediates of DNA replication and recombination. Immobile three-way junctions with one hairpin arm (50, 27, 18 and 7 bp long) and two relatively long linear arms were obtained by annealing two partially homologous restriction fragments. Fragments containing inverted repeats of specific length formed hairpins after denaturation. Three-way junctions were obtained by annealing one strand of a fragment from a parental plasmid with one strand of an inverted repeat-containing fragment, purified from gels, and examined by AFM. The molecules are clearly seen as three-armed molecules with one short arm and two flexible long arms. The AFM analysis revealed two important features of three-way DNA junctions. First, three-way junctions are very dynamic structures. This conclusion is supported by a high variability of the inter-arm angle detected on dried samples. The mobility of the junctions was observed directly by imaging the samples in liquid (AFM in situ). Second, measurements of the angle between the arms led to the conclusion that three-way junctions are not flat, but rather pyramid-like. Non-flatness of the junction should be taken into account in analysis of the AFM data.
INTRODUCTION
Three-way DNA junctions, the simplest branched DNA molecules, can arise as intermediates in homologous recombination in the absence of replication and they are also formed transiently during DNA replication (see for example 1–4). Three-way junctions also constitute part of slipped strand DNA (5). The latter is formed by out-of-register pairing of the two complementary strands within direct repeats (including mono, di, tri, tetra and higher order repeat runs; 1,6). Instability in the length of repeating sequence tracts can lead to the development of hereditary neurological and other diseases (7). This instability may involve DNA structures, including those with three-way junctions. The structural and dynamic features of three-way DNA junctions involved in slippage events may help explain the molecular mechanisms of sequence instabilities, including trinucleotide repeat expansion.
Although four-way immobile junctions have recently been successfully crystallized (8), there have been no reports of high resolution X-ray analysis of three-way DNA junctions. Early gel electrophoretic analysis of branched molecules showed a bend between the arms (9,10). The overall geometry of three-way DNA junctions may depend on Mg2+ concentration (9–12), the sequence at the junction (13) and the length of the third arms (14). The presence of unpaired nucleotides at the junction influences the stability and geometry of three-way junctions (12,14–17). Gel retardation studies show that extra bases at the junction provide the conformational freedom to form a kink, allowing the formation of an acute angle between the arms (12). NMR studies of three-way DNA junctions with extra bases at the junction showed that the molecules adopt a conformation in which the bases of one of the arms are continuously stacked with bases of another arm (17–20). This conclusion is fully consistent with cyclization data (16) and fluorescence energy transfer (FRET) measurements (21). Much less effort has been made towards unraveling the global structure of three-way junctions with no irregularities at the junction. An oligonucleotide ligation–cyclization analysis approach (22,23) was consistent with the junction adopting a pyramidal geometry with an angle of 60–90° between the arms (24). This conclusion was also supported by FRET data (15). In addition, the cyclization and FRET data suggest a high intermolecular mobility of three-way junctions (9,16,24,25).
In this paper we have applied atomic force microscopy (AFM) to look directly at the global geometry and dynamics of three-way DNA junctions. The overall structure of the three-way junction is consistent with a pyramidal arrangement of the arms. In addition, we used the capability of AFM to perform imaging in liquid to observe the dynamics of the junction arms. The broad distribution of interarm angles obtained with dried samples is consistent with the very high mobility of the junction arms observed in liquid.
MATERIALS AND METHODS
Heteroduplex formation and isolation
Plasmids pDT20, pUC8S3B, pUC8S1F2 and pUC8F14C, containing 20, 42, 60 and 106 bp inverted repeat inserts in the EcoRI site of pUC8, respectively, were recently described (5). These plasmids were digested with PvuII, producing 2364 and 301 bp PvuII–PvuII fragments for pUC8 and similar fragments for the insert-containing plasmids. Heteroduplex formation between short fragments of pUC8 and the insert-containing plasmids and their isolation were as described (5). Briefly, ∼5 µg each of PvuII-cut plasmids were mixed in 40 µl of hybridization buffer and incubated stepwise at 100 (3 min), 85 (10 min) and 70°C (60 min) and then cooled to 4°C. Two hybridization buffers, A (50 mM Tris–HCl, 100 mM NaCl, 10 mM MgCl2, 1 mM dithiothreitol, pH 7.9) and B (50 mM Tris–HCl, 200 mM NaCl, 1 mM EDTA, pH 8.0), were used with similar results. The hybridization mixtures were separated at room temperature in a 5% polyacrylamide gel using TBE buffer (90 mM Tris–borate, pH 8.3, 2.5 mM EDTA). Heteroduplex isomers were excised from the gel and DNA was eluted by a standard crush and soak method (26). After an additional purification step using an UltraClean 15 kit from MoBio (Solana Beach, CA), isolated heteroduplexes were resuspended in 60 µl of TE (10 mM Tris–HCl, 1 mM EDTA, pH 7.8) and aliquots were taken for strand identification by sequencing and AFM analysis.
AFM sample preparation
An AP mica surface was obtained by vapor deposition of aminopropyltriethoxysilane (APTES) under ambient conditions as described (27–29). To prepare samples for visualization, 10 µl of the DNA (0.5 µg/ml in 25 mM Tris–HCl, 50 mM NaCl, 5 mM MgCl2, 0.5 mM dithiothreitol, pH 7.9) was placed on pieces of AP mica for 2 min, rinsed with deionized water and argon dried. Imaging in liquid was performed with an alternative surface, APS mica functionalized with aminopropylsilatrane (APS). 1-(3-Aminopropyl)silatrane (CAS no. 17869-27-1) was synthesized by vacuum evaporation of a mixture of 4.13 g triethanolamine containing 1 mg sodium as catalyst and 6.12 g (3-aminopropyl)triethoxysilane at 60°C to constant weight (6.4 g). Freshly cleaved mica squares (1 × 1 cm) were immersed in 0.1 mM aminopropylsilatrane in water. After a 30 min incubation, the mica was removed from the solution, rinsed thoroughly under a flow of deionized water, dried with argon and left sealed in an argon-filled vial. Typically, APS mica was used for sample deposition within 15–60 min.
Imaging with AFM
The AFM images in air and in buffer were taken with a MultiMode SPM instrument equipped with a D-scanner (Digital Instruments, Santa Barbara, CA) operating in tapping mode as described (30). NanoProbe TESP probes (Digital Instruments) and conical sharp silicon tips (K-Tek International, Portland, OR) were used for imaging in air. The typical tapping frequency for imaging in air was 240–280 kHz for TESP tips and 340–380 kHz for the K-TEK probes and the nominal scanning rate was 2–3 Hz. Imaging in liquid was done with silicone nitride oriented twin tips (NP-STT; Digital Instruments) mounted in a fluid cell (Digital Instruments) as described (30,31). The sample was prepared in TE buffer with 200 mM NaCl and injected into the fluid cell mounted on top of the APS mica. Typical tapping frequency was between 8 and 16 kHz and the scan rate was 2–3 Hz.
Analysis of the AFM data
NIH image 1.60 software was used for measurement of the angles between the linear arms. The number of molecules used for measurements on a single sample was between 200 and 400. Angle measurements were made as follows: a vertex point was selected at the center of the three-way junction and two straight lines (∼18–20 nm or 50–60 bp long on the molecular scale) were drawn along the long arms of the heteroduplex. Statistical analysis of the data was performed with Kaleidagraph software.
RESULTS
Design of the three-way junctions
As shown in Figure 1, three-way DNA junctions were obtained by denaturing and annealing two restriction fragments, A and B. The two fragments contain inverted repeats of different lengths. In addition to the formation of parental duplexes, annealing leads to the formation of two types of three-way junction isomers (H1 and H2) with two linear arms and a comparatively short hairpin. The H1 hybrid is formed by hybridization of the bottom strand of the B fragment with the upper strand of fragment A. Similarly, in hybrid H2 the upper strand of the B fragment is complexed with the bottom strand of the A fragment. Due to the formation of a strong kink, the heteroduplex isomers migrate more slowly in a polyacrylamide gel than linear molecules of equal molecular weight (5,9,10,24,30,32). In addition, the H1 and H2 hybrids also migrate differently (5), such that the hybrids can be separated in a polyacrylamide gel and can be purified for analysis by AFM.
Figure 1.

Preparation of three-way DNA junctions. The parental restriction fragment and fragment A, differing in the insert, were heat denatured and annealed. H1 and H2 are three-way junction isomers that form alongside the renatured parental fragments A and B.
AFM images of three-way junctions
The images of H2 junctions (the slow migrating isomer) with the 7, 18, 27 and 50 bp hairpins are shown in Figure 2A–D, respectively. Unambiguously identified junctions are indicated by arrows on the images. Re-scanned higher resolution images of individual three-way junctions typical of molecules with a given size of hairpin (7–27 bp) are shown as inserts in the large scale images. The three-way structure, with one short arm and two relatively long arms, is clearly seen for all heteroduplexes. The size of the short arm for the longest hairpin (Fig. 2A) is 15.1 ± 4.4 nm, which is very close to the size expected for a 50 bp hairpin in the B conformation (50 × 0.34 = 17 nm). The length of the 27 bp arm was 9.4 ± 3.1 nm, in perfect agreement with the expected value of 9.18 nm. The accuracy of length measurements for the two short hairpins is very low due to the tip convolution effect, which led to ∼5 nm broadening of the DNA filaments for the probes used (29,30,33).
Figure 2.

AFM images of three-way DNA junctions with different lengths of hairpin. (A) 7 bp; (B) 18 bp; (C) 27 bp; (D) 50 bp. The hairpins are indicated by arrows. The sample was deposited on AP mica, argon dried and imaged in air under ambient conditions.
The structure of three-way junctions
Regardless of hairpin size, all three-way junctions have one common feature: the formation of a sharp kink at the junction. The measured angles between the linear arms are shown in Figure 3.
Figure 3.

The angle between the linear arms of the three-way junctions. (A) 50 bp hairpin junction. (B) 27 bp hairpin junction. (C) 18 bp hairpin junction. (D) 7 bp hairpin junction. The average values of the inter-arm angles (±SD) are shown in Table 1. The number of molecules measured varied between 240 and 507 (see Table 1).
There are a few important implications from these data. First, the distributions of the angles are rather broad, suggesting that three-way junctions are very dynamic structures. This conclusion is consistent with our early cyclization results (24) and those from the Seeman laboratory (9). Second, another important characteristic of the junctions is the mean angle between the arms (Table 1). The angle varies between ∼80° (for 50, 27 and 18 bp hairpins) and 57° (for the 7 bp hairpin). These values are considerably less than the 120° expected for a flat symmetrical three-way junction. This indicates that the shape of three-way junctions is not flat, but rather pyramid-like, as suggested earlier (24). Remarkably, the conclusion of a trigonal pyramidal geometry of three-way junctions is directly supported by AFM images like that shown in the insert in Figure 2D, in which the hairpin arm is located between the linear arms. Images of this type would not be observed if the geometry of the junction was planar with 120° between the arms. The third interesting feature is the dependence of the inter-arm angle on the length of the hairpin arm. The angle for the junction with the 7 bp hairpin arm (57°) is considerably smaller than the values for other junctions (∼80°). A plausible explanation is that molecules with a pyramidal shape are deformed during the adsorption process. This is illustrated schematically in Figure 4. If the molecule binds to the surface with all three arms (Fig. 4A), after flattening the arms will move, leading to changes of angle between the arms. If the arms move freely on the surface during this process, then the molecule becomes a three-arm star with an ∼120° angle between the arms. However, this binding mode may depend on the hairpin length. If the hairpin is short, it cannot provide a stable contact with the mica support and the molecule can flip and bind to the surface by the two long linear arms (Fig. 4B). Therefore, the histograms for the molecules with long hairpins may be a superposition of two distributions corresponding to two different binding modes. A bimodal character of distributions is clearly seen in Figure 3A–C (18–50 bp hairpin), which shows two broad maxima around ∼70° and 120°. The bimodal character is not pronounced for the 7 bp hairpin (Fig. 3D), therefore, it is very likely that this three-way junction binds predominantly with the two long arms (Fig. 4B). This suggests that the mean value obtained from the histogram for this junction (Fig. 3D) is a good approximation for the inter-arm distance of the three-way junction in solution. The value of 57° is very close to our earlier cyclization data (60–90°) (24) and recent FRET measurements (15).
Table 1. The mean angle between linear arms for all three-way junctions studied in this paper.
| Type of junction (no. molecules measured) | ||||
|---|---|---|---|---|
| 50 bp hairpin (416) | 27 bp hairpin (240) | 18 bp hairpin (507) | 7 bp hairpin (256) | |
| Mean angle between arms (°) | 78 ± 35 | 82 ± 32 | 83 ± 33 | 57 ± 31 |
Figure 4.

Schematic illustrating binding to a surface of a non-flat three-way junction. (A) The molecules (drawn in red) bind initially to the surface at three ends (left). The contact points at the ends of the junction are shown schematically as blue balls. The fully flattened molecule (right) is drawn in blue. (B) The molecule approaches and attaches to the surface by the two long arms (blue), with the third hairpin arm (red) pointing away from the surface (left). This arm can stick to the surface in two different orientations, as indicated on the right.
Actually, for the junction with a short hairpin arm two different orientations on the surface are possible, in which the hairpin arm points either up or down. Theoretically, the two types of junction orientation on the surface can be distinguished by AFM. In the hairpin-down orientation, DNA strands in the vicinity of the junction gradually change their height relative to the surface, whereas the height of the DNA around the junction in the other orientation should be constant. Unfortunately, height measurements on dried samples are not precise enough to unambiguously distinguish between the two conformations.
Dynamics of the junction
According to the cyclization (9,24) and FRET data (25), three-way junctions are very dynamic. The width of the distribution of the inter-arm angle in Figure 3D is quite broad, suggesting high mobility of the arms. However, as discussed above, the width of the histogram is a combination of two effects, the dynamics of the junction and interaction of the sample on the surface, which may induce some distortion. We took advantage of AFM to perform scanning of the sample in solution without drying, i.e. AFM in situ (30,34–36), to directly observe the DNA dynamics at the single molecule level.
Three-way DNA junctions with 7 bp hairpins were injected into a fluid cell and time-lapse observations were performed by capturing repetitive scans over the same area. Two consecutive images over a 1 µm area are shown in Figure 5A and B. One can clearly see the differences in molecular shape, or inter-arm angle, for several heteroduplex molecules, numbered 1–6. A series of nine consecutive images (Fig. 6) illustrate the dynamics of molecules 2 and 3; both molecules change their shape dramatically, although each molecule behaves differently. The differences in dynamics may be explained by different local binding of the molecules to the surface. Molecule 2 may be less dynamic, due to its stronger binding to the surface.
Figure 5.

Two consecutive AFM scans over the same area in liquid. The three-way junction with a 7 bp hairpin in TE buffer with 200 mM NaCl was injected into a fluid cell mounted on top of the APS mica. A few molecules the shape of which changed between the scans are numbered.
Figure 6.
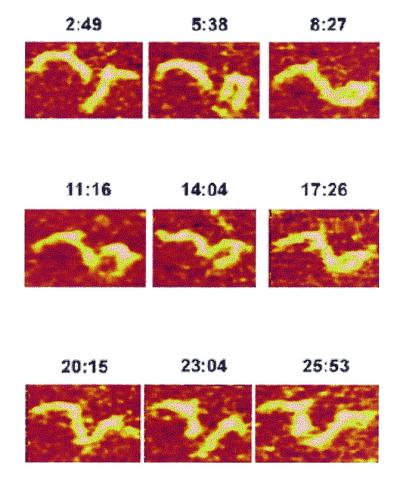
Consecutive images of molecules 2 and 3 in Figure 5 obtained by repetitive scans over the same area. The times after completion of each scan (min:s) are indicated above each panel.
DISCUSSION
The data presented in this paper indicate that three-way junctions adopt a pyramidal rather than a flat geometry. Earlier we used an oligonucleotide ligation–cyclization technique (22) to estimate a mean angle between the arms of a three-way junction of 60–90° (16,24). This suggests that a three-way junction should be a trigonal pyramid in structure (16,24). This geometry, with an angle between the arms of 86°, was also suggested from FRET spectroscopic analysis (15). The AFM measurements of the inter-arm angle for the junction with a short (7 bp) hairpin gave a mean value of 57 ± 31°. This is less than the FRET estimates, but in the range of the inter-arm angle determined by cyclization experiments. Keeping in mind inevitable distortion of the junction geometry during deposition onto a plane, we conclude that the coincidence of the AFM and solution data is surprisingly good.
The statistics of the AFM data for the inter-arm angle show that the arms can move in a very broad range. The standard deviation for the junction with a 7 bp hairpin is >50% (Table 1). This high mobility of three-way junctions was demonstrated by direct observation of intramolecular mobility of individual molecules by consecutive imaging in solution. If the molecule does not bind strongly to the surface, DNA segments can detach from the surface. While away from the surface, the segment can change its conformation prior to the next AFM scan. Thus, continuous scanning in liquid over the same area allows one to observe the dynamic changes in shape of individual DNA molecules. The time between consecutive frames in these experiments (∼2.5 min) was determined by the scanning speed, which is typically in the second per line range. Segmental motion of DNA in solution is in the millisecond range (37), but this process in AFM experiments may be slowed down by surface–DNA interactions. It is very likely that segments of the molecule undergo many partial desorption/adsorption steps between two consecutive scans. Simultaneous desorption at multiple sites may lead to dissociation of entire molecules. Thus the dynamics observed by AFM in situ are a combination of two processes, the intrinsic dynamics of the molecule, which are presumably in the millisecond range, and the kinetics of desorption/adsorption events. Therefore, the use of AFM for single molecule observation allows one to directly observe the propensity of the molecule to change its structure. Moreover, the range of structural changes of the molecule can be estimated. For example, the angle for molecule 1 in Figure 5 changes from ∼60° in the first image to 120° in the second frame, which is consistent with 50% variability of the mean number obtained by averaging the measurements over an ensemble of immobile molecules in a dry sample. A similar analysis was performed in our previous work (30) where the dynamics of a four-way DNA junction, a supercoiled stabilized cruciform, were studied. This excellent correlation between the data obtained with two different AFM imaging modes (with different sample preparation procedures) indicates that distortion of the molecule during the rinsing and drying steps of sample preparation do not significantly change the shapes of junctions bound to the surface.
Four-way junctions, like three-way junctions, have a defined, non-flat geometry in solution (35). In this case the tetrahedral pyramidal shape of four-way junctions is less pronounced than the trigonal pyramidal geometry of three-way junctions. The nature of the forces stabilizing a non-flat geometry relative to a flat one remains unclear. According to computer simulations of branched DNA molecules that considered electrostatic interactions (38), flat shapes of three-way junctions are more favorable than pyramidal ones. Thus other interactions, such as hydrophobic and Van der Waals interactions, should be taken into consideration to understand the nature of forces stabilizing folded conformations of DNA junctions under conditions close to physiological. The formation of a pyramidal shape makes the junction more compact and, according to a computer analysis, such structures accumulate a substantial number of excess counterions (38,39). Chemical and enzymatic probe analyses (11,14,40) showed that the distortion in the DNA helix geometry of three-way junctions is limited to the vicinity of the joint. Our computer modeling results (24) show that the deviation from perfect B-helix geometry occurred only at the bases adjacent to the junction. This suggests that the DNA electrostatic potential around the junction is different from that of the rest of the molecule. Such a DNA structure-dependent electrostatic effect may contribute to structural recognition of the junctions by junction-specific enzymes, e.g. resolvases (41,42), and low molecular weight ligands (43).
Acknowledgments
ACKNOWLEDGEMENT
We thank R. Glass for performing the length and angle measurements. This work was supported, in part, by NIH grant GM 54991.
REFERENCES
- 1.Chen X., Mariappan,S.V., Moyzis,R.K., Bradbury,E.M. and Gupta,G. (1998) J. Biomol. Struct. Dyn., 15, 745–756. [DOI] [PubMed] [Google Scholar]
- 2.Hu C.H., Xu,F.Y., Wang,K., Pearson,A.N. and Pearson,G.D. (1992) Gene, 110, 145–150. [DOI] [PubMed] [Google Scholar]
- 3.Pearson C.E. and Sinden,R.R. (1996) Biochemistry, 35, 5041–5053. [DOI] [PubMed] [Google Scholar]
- 4.Sinden R.R., Hashem,V.I. and Rosche,W.A. (1999) Ann. NY Acad. Sci., 870, 173–189. [DOI] [PubMed] [Google Scholar]
- 5.Oussatcheva E.A., Shlyakhtenko,L.S., Glass,R., Sinden,R.R., Lyubchenko,Y.L. and Potaman,V.N. (1999) J. Mol. Biol., 292, 75–86. [DOI] [PubMed] [Google Scholar]
- 6.Pearson C.E. and Sinden,R.R. (1998) Curr. Opin. Struct. Biol., 8, 321–330. [DOI] [PubMed] [Google Scholar]
- 7.Wells R.D., Parniewski,P., Pluciennik,A., Bacolla,A., Gellibolian,R. and Jaworski,A. (1998) J. Biol. Chem., 273, 19532–19541. [DOI] [PubMed] [Google Scholar]
- 8.Ortiz-Lombardia M., Gonzalez,A., Eritja,R., Aymami,J., Azorin,F. and Coll,M. (1999) Nature Struct. Biol., 6, 913–917. [DOI] [PubMed] [Google Scholar]
- 9.Ma R.I., Kallenbach,N.R., Sheardy,R.D., Petrillo,M.L. and Seeman,N.C. (1986) Nucleic Acids Res., 14, 9745–9753. [DOI] [PMC free article] [PubMed] [Google Scholar]
- 10.Duckett D.R. and Lilley,D.M. (1990) EMBO J., 9, 1659–1664. [DOI] [PMC free article] [PubMed] [Google Scholar]
- 11.Lu M., Guo,Q., Seeman,N.C. and Kallenbach,N.R. (1989) J. Biol. Chem., 264, 20851–20854. [PubMed] [Google Scholar]
- 12.Leontis N.B., Kwok,W. and Newman,J.S. (1991) Nucleic Acids Res., 19, 759–766. [DOI] [PMC free article] [PubMed] [Google Scholar]
- 13.Guo Q., Lu,M., Churchill,M.E., Tullius,T.D. and Kallenbach,N.R. (1990) Biochemistry, 29, 10927–10934. [DOI] [PubMed] [Google Scholar]
- 14.Zhong M. and Kallenbach,N.R. (1993) J. Mol. Biol., 230, 766–778. [DOI] [PubMed] [Google Scholar]
- 15.Stuhmeier F., Welch,J.B., Murchie,A.I., Lilley,D.M. and Clegg,R.M. (1997) Biochemistry, 36, 13530–13538. [DOI] [PubMed] [Google Scholar]
- 16.Shlyakhtenko L.S., Appella,E., Harrington,R.E., Kutyavin,I. and Lyubchenko,Y.L. (1994) J. Biomol. Struct. Dyn., 12, 131–143. [DOI] [PubMed] [Google Scholar]
- 17.Rosen M.A. and Patel,D.J. (1993) Biochemistry, 32, 6576–6587. [DOI] [PubMed] [Google Scholar]
- 18.Leontis N.B., Hills,M.T., Piotto,M., Ouporov,I.V., Malhotra,A. and Gorenstein,D.G. (1995) Biophys. J., 68, 251–265. [DOI] [PMC free article] [PubMed] [Google Scholar]
- 19.Leontis N.B., Piotto,M.E., Hills,M.T., Malhotra,A., Ouporov,I.V., Nussbaum,J.M. and Gorenstein,D.G. (1995) Methods Enzymol., 261, 183–207. [DOI] [PubMed] [Google Scholar]
- 20.Overmars F.J., Pikkemaat,J.A., van den Elst,H., van Boom,J.H. and Altona,C. (1996) J. Mol. Biol., 255, 702–713. [DOI] [PubMed] [Google Scholar]
- 21.Stuhmeier F., Lilley,D.M. and Clegg,R.M. (1997) Biochemistry, 36, 13539–13551. [DOI] [PubMed] [Google Scholar]
- 22.Lyubchenko Y., Shlyakhtenko,L., Chernov,B. and Harrington,R.E. (1991) Proc. Natl Acad. Sci. USA, 88, 5331–5334. [DOI] [PMC free article] [PubMed] [Google Scholar]
- 23.Lyubchenko Y.L., Shlyakhtenko,L.S., Appella,E. and Harrington,R.E. (1993) Biochemistry, 32, 4121–4127. [DOI] [PubMed] [Google Scholar]
- 24.Shlyakhtenko L.S., Rekesh,D., Lindsay,S.M., Kutyavin,I., Appella,E., Harrington,R.E. and Lyubchenko,Y.L. (1994) J. Biomol. Struct. Dyn., 11, 1175–1189. [DOI] [PubMed] [Google Scholar]
- 25.Yang M. and Millar,D.P. (1996) Biochemistry, 35, 7959–7967. [DOI] [PubMed] [Google Scholar]
- 26.Sambrook J., Fritsch,E.F. and Maniatis,T. (1989) Molecular Cloning: A Laboratory Manual, 2nd Edn. Cold Spring Harbor Laboratory Press, Cold Spring Harbor, NY.
- 27.Lyubchenko Y.L., Gall,A.A., Shlyakhtenko,L.S., Harrington,R.E., Jacobs,B.L., Oden,P.I. and Lindsay,S.M. (1992) J. Biomol. Struct. Dyn., 10, 589–606. [DOI] [PubMed] [Google Scholar]
- 28.Lyubchenko Y.L., Blankenship,R.E., Gall,A.A., Lindsay,S.M., Thiemann,O., Simpson,L. and Shlyakhtenko,L.S. (1996) Scanning Microsc., 10 (suppl.), 97–107. [PubMed] [Google Scholar]
- 29.Lyubchenko Y.L. and Lindsay,S.M. (1998) In Colton,R.J., Engel,A., Frommer,J.E., Gaub,H.E., Gewirth,A.A., Guckenberger,R., Rabe,J., Heckl,W.M. and Parkinson,B. (eds), Procedures in Scanning Probe Microscopy. John Wiley & Sons, Chichester, UK, pp. 493–496.
- 30.Shlyakhtenko L.S., Potaman,V.N., Sinden,R.R. and Lyubchenko,Y.L. (1998) J. Mol. Biol., 280, 61–72. [DOI] [PubMed] [Google Scholar]
- 31.Lyubchenko Y.L. and Shlyakhtenko,L.S. (1997) Proc. Natl Acad. Sci. USA, 94, 496–501. [DOI] [PMC free article] [PubMed] [Google Scholar]
- 32.Seeman N.C. (1991) DNA Cell Biol., 10, 475–486. [DOI] [PubMed] [Google Scholar]
- 33.Pfannschmidt C. and Langowski,J. (1998) J. Mol. Biol., 275, 601–611. [DOI] [PubMed] [Google Scholar]
- 34.Lyubchenko Y.L., Shlyakhtenko,L.S., Aki,T. and Adhya,S. (1997) Nucleic Acids Res., 25, 873–876. [DOI] [PMC free article] [PubMed] [Google Scholar]
- 35.Kasas S., Thomson,N.H., Smith,B.L., Hansma,H.G., Zhu,X., Guthold,M., Bustamante,C., Kool,E.T., Kashlev,M. and Hansma,P.K. (1997) Biochemistry, 36, 461–468. [DOI] [PubMed] [Google Scholar]
- 36.Engel A., Lyubchenko,Y. and Muller,D. (1999) Trends Cell Biol., 9, 77–80. [DOI] [PubMed] [Google Scholar]
- 37.Hammermann M., Brun,N., Klenin,K.V., May,R., Toth,K. and Langowski,J. (1998) Biophys. J., 75, 3057–3063. [DOI] [PMC free article] [PubMed] [Google Scholar]
- 38.Fenley M.O., Manning,G.S., Marky,N.L. and Olson,W.K. (1998) Biophys. Chem., 74, 135–152. [DOI] [PubMed] [Google Scholar]
- 39.Olmsted M.C. and Hagerman,P.J. (1994) J. Mol. Biol., 243, 919–929. [DOI] [PubMed] [Google Scholar]
- 40.Lu M., Guo,Q. and Kallenbach,N.R. (1991) Biochemistry, 30, 5815–5820. [DOI] [PubMed] [Google Scholar]
- 41.Jensch F., Kosak,H., Seeman,N.C. and Kemper,B. (1989) EMBO J., 8, 4325–4334. [DOI] [PMC free article] [PubMed] [Google Scholar]
- 42.Bhattacharyya A., Murchie,A.I., von Kitzing,E., Diekmann,S., Kemper,B. and Lilley,D.M. (1991) J. Mol. Biol., 221, 1191–1207. [DOI] [PubMed] [Google Scholar]
- 43.Kato T., Yano,K., Ikebukuro,K. and Karube,I. (2000) Nucleic Acids Res., 28, 1963–1968. [DOI] [PMC free article] [PubMed] [Google Scholar]