

Abstract
Germ free (GF) mice, which are depleted of their resident microbiota, are the gold standard for exploring the role of the microbiome in health and disease but are of limited value to study human-specific pathogens because they do not support their replication. Here, we develop GF mice systemically reconstituted with human immune cells and use them to evaluate the resident microbiome’s role in the acquisition, replication, and pathogenesis of two human-specific pathogens, Epstein-Barr Virus (EBV) and Human Immunodeficiency Virus (HIV). Comparison with conventional (CV)-humanized mice shows that resident microbiota enhance the establishment of EBV infection and EBV-induced tumorigenesis and increase mucosal HIV acquisition and replication. HIV-RNA levels are higher in plasma and in tissues of CV-humanized mice compared to GF-humanized mice. The frequency of CCR5+ CD4+ T cells throughout the intestine was higher in CV-humanized mice, indicating that resident microbiota govern HIV target cell levels. Thus, resident microbiota promote the acquisition and pathogenesis of two clinically relevant human-specific pathogens.
Ed summary:
Resident microbiota contribute to HIV and EBV infection in a germ-free humanized mouse model.
Resident microbiota maintain intestinal homeostasis by regulating digestion, metabolism, and immune development1. Resident microbes have been shown to provide protection against infection with a variety of human pathogens2–4. However, resident microbiota have been shown to also enhance the transmission of certain viruses that target the intestinal tract5–11. These studies were performed using germ-free (GF) mice or mice that had been depleted of intestinal microbiota following antibiotic treatment compared with conventionally raised controls5–11. Yet, this approach cannot be translated to any human-specific pathogen that does not replicate in mice. Non-human primate (NHP) models have been successfully used to model some human infections12. However, NHP models that are also GF do not exist and antibiotic treatment can select for outgrowth of drug-resistant bacteria and have off-target effects13. Therefore, the role of resident microbiota in the acquisition and pathogenesis of many human-specific pathogens of high clinical relevance is not known.
To address this significant gap in our knowledge, we developed a GF humanized mouse model using the bone marrow/liver/thymus (BLT) platform to provide a robust and flexible in vivo model that can be used to study the role of resident microbiota in human health and disease. To obtain important proof-of-principle of this new model’s utility, we evaluated the role of resident microbes in the acquistion, replication, and pathogenesis of Epstein-Barr Virus (EBV) and Human Immunodeficiency Virus (HIV), two human-specific pathogens of high clinical relevance that differ in genome structure and the primary cell types they target. EBV is an oncogenic DNA herpesvirus with limited tropism that establishes latency in B cells14. While most individuals maintain a life-long asymptomatic infection, EBV is the causative agent of infectious mononucleosis, is strongly associated with Hodgkin’s lymphoma, Burkitt’s lymphoma, nasopharyngeal carcinoma, and can cause post-transplant lymphoproliferative disorder in the immunocompromised15–20. HIV is a single-stranded RNA retrovirus that preferentially targets human dendritic cells, macrophages, and CD4+ T cells. The intestinal tract is an important site of HIV acquisition. Over half of new HIV infections in North America and parts of Europe occur in men who have sex with men 21. In addition, HIV can be transmitted mother-to-child during breastfeeding21. Regardless of how HIV is acquired, the intestinal tract is also a significant site of virus replication, CD4+ T cell depletion, and inflammation22–26. In addition, the intestinal tract may represent a substantial amount of the total viral reservoir in ART-suppressed individuals living with HIV, with major implications for HIV cure research27, 28. While conventional (CV)-BLT mice colonized with resident microbiota have been extensively used to study EBV and HIV infection, the effect of resident microbiota on EBV and HIV acquisition, replication, and pathogenesis is currently not known.
Our results herein show that the peripheral blood and tissues of GF-BLT mice are reconstituted with human innate and adaptive immune cells. We show that in comparison to GF-BLT mice, the incidence of EBV infection and EBV-induced tumorigenesis was higher in CV-BLT mice colonized with resident microbiota. HIV acquisition in the intestinal tract following an oral or rectal HIV challenge was also significantly higher in CV-BLT mice colonized with resident microbiota. Furthermore, systemic HIV replication was greatly augmented in the presence of resident microbiota resulting in 34-fold higher levels of HIV-RNA in plasma and 1000-fold higher in tissues. These results provide direct evidence that resident microbiota can have a dramatic effect on the establishment and sequela of infection by two different human-specific pathogens and validate GF-BLT mice as a useful in vivo platform to study the role of resident microbiota in human health and disease.
Results
Human immune cells systemically reconstitute GF-BLT mice
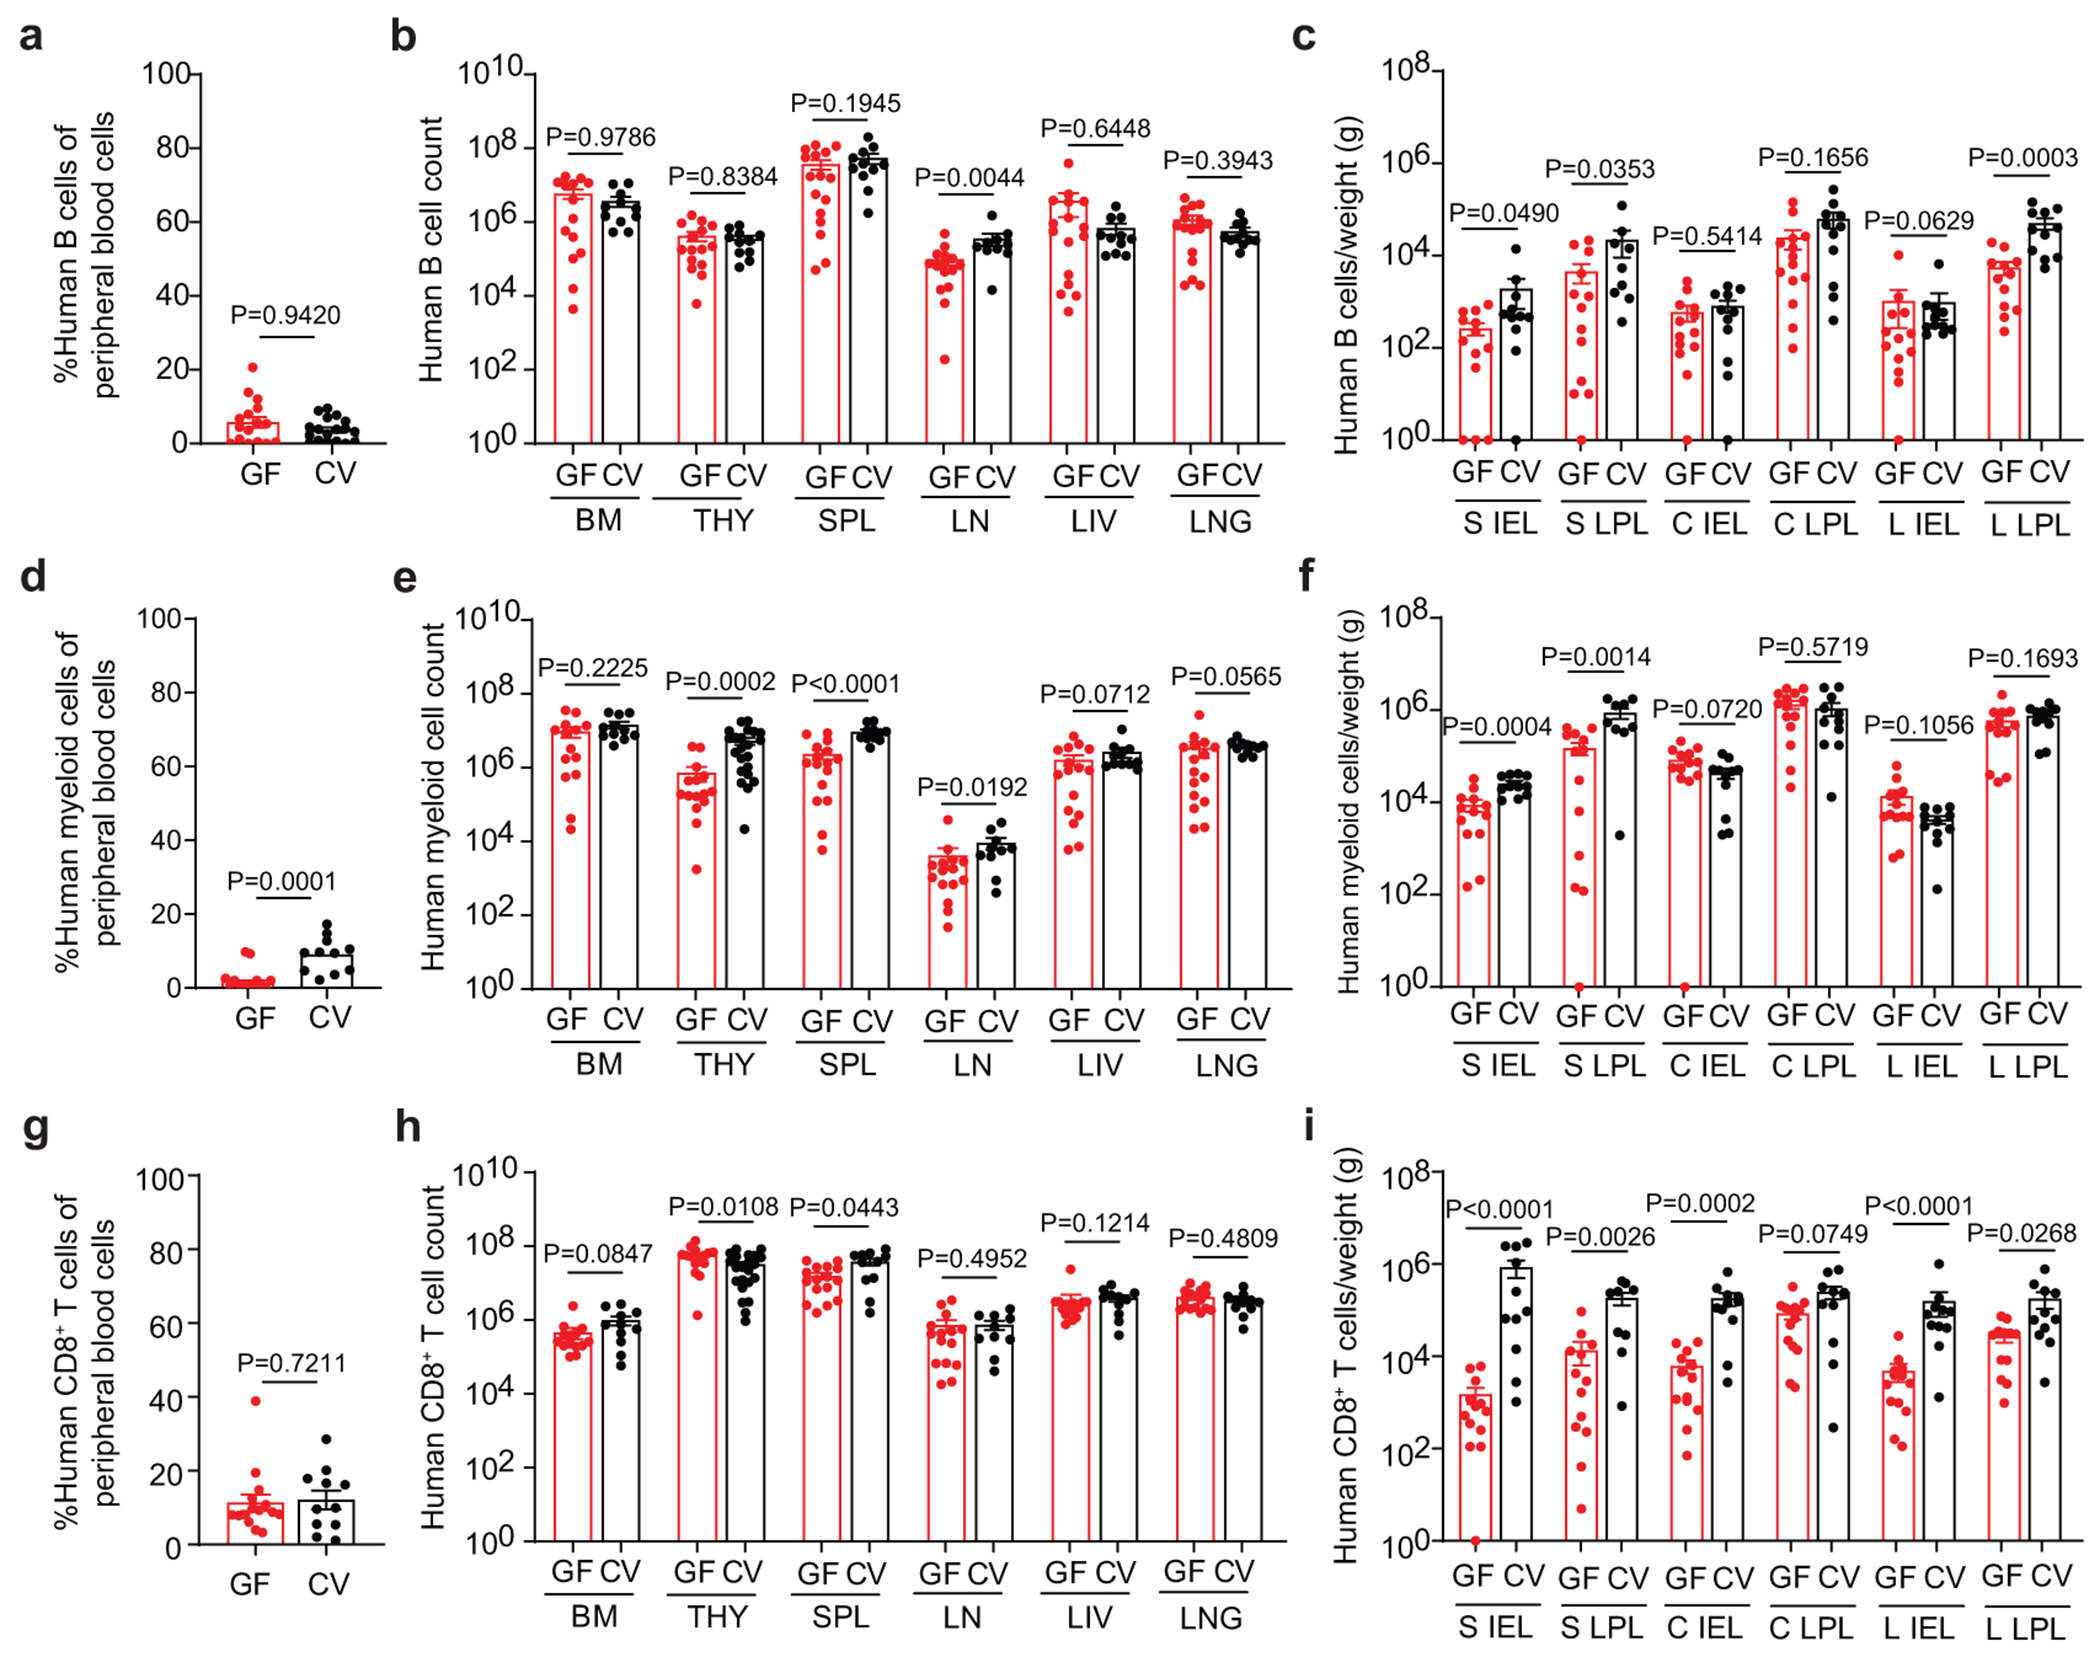
GF mouse models represent the gold standard for exploring the role of resident microbiota in health and disease13, 29. We developed a GF-BLT humanized mouse model to establish the role of resident microbiota in infection with human-specific pathogens using an immune deficient mouse strain that was rederived GF by sterile embryo transfer (Fig. 1a). We routinely confirmed the sterility of GF mice by aerobic and anaerobic culturing, Gram staining, and PCR of freshly passed fecal pellets. The intestinal microbiome of CV-BLT mice is dominated by bacteria in Firmicutes and Bacteroidetes phyla (Extended Data Fig. 1). Robust and sustained levels of human hematopoietic (CD45+) cells were observed in the peripheral blood of GF-BLT mice (46.8% ± 2.1% s.e.m; range 18-67%; n=29) (Fig.1b). Human hematopoietic cells in the peripheral blood of GF-BLT mice included B cells, T cells, myeloid cells, and dendritic cells (plasmacytoid and myeloid) (Fig. 1c). Human hematopoietic cells were also present in lymphoid (bone marrow, human thymic organoid, spleen, and lymph nodes) and effector (liver and lung) tissues of GF-BLT mice (Fig. 1d and Extended Data Fig. 2a). The presence of human hematopoietic cells was also examined in the intestinal tract. For this and subsequent analyses, the cecum was analyzed separately from the rest of the large intestine. In the intestinal tract of GF-BLT mice, human hematopoietic cells, and in particular HIV target cells (myeloid cells, dendritic cells and CD4+ T cells) were observed in the small intestine, cecum, and colon (Fig. 1e,f and Extended Data Fig. 2b). Human T cells were more abundant in the lamina propria layer of the small intestine (8.5-fold), cecum (12.6-fold), and large intestine (14.1-fold) of GF-BLT mice (Extended Data Fig. 2c). These data indicate that human hematopoietic stem cells can engraft and systemically reconstitute mice without resident microbiota.
Fig. 1. GF-BLT mice are systemically reconstituted human hematopoietic cells.
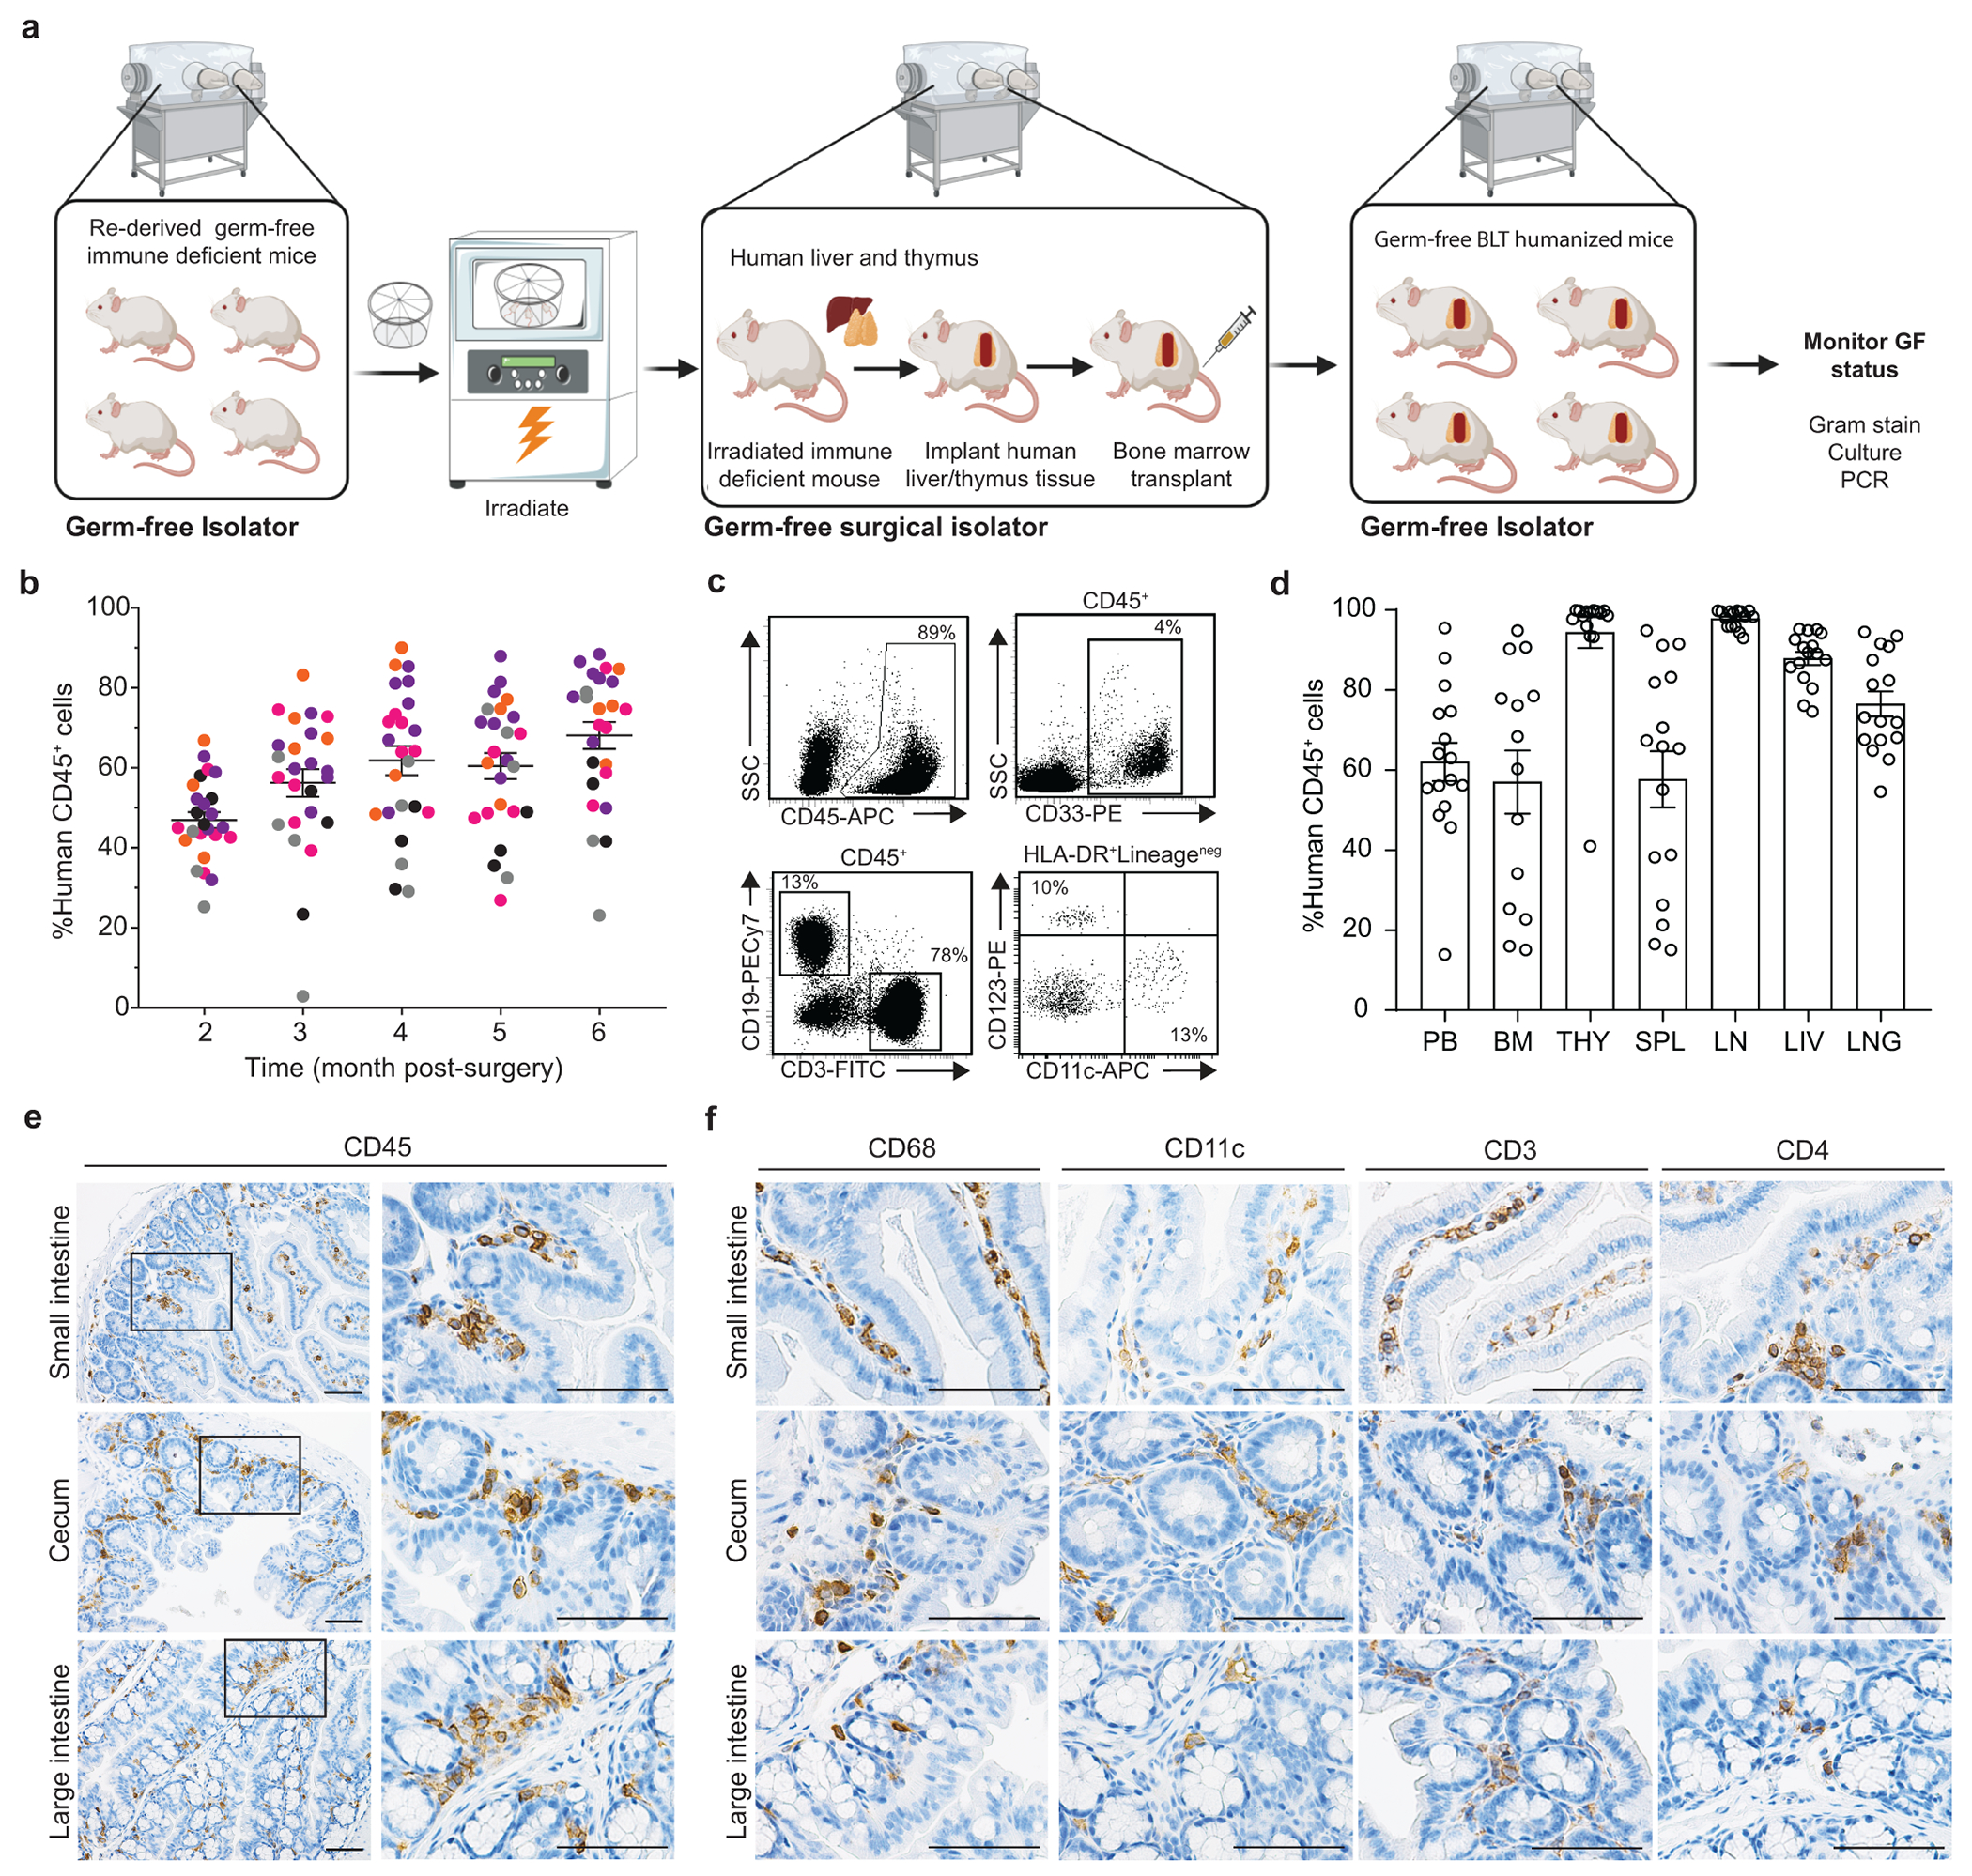
a, Construction of GF-BLT mice. b, Levels of human hematopoietic cells (hCD45+) in the peripheral blood (PB) of germ-free BLT mice (n=29). Colors indicate individual GF-BLT cohorts. c, Human hematopoietic cells (hCD45+), myeloid cells (hCD33+), T cells (hCD3+), B cells (hCD19+), plasmacytoid dendritic cells (hCD123+), and myeloid dendritic cells (hCD11c+) in the peripheral blood of a GF-BLT mouse analyzed at 52 weeks post-surgery by flow cytometry. SSC, side scatter. d, Human hematopoietic cells (hCD45+) in the PB (n=16), bone marrow (BM, n=14), thymic organoid (THY, n=15), spleen (SPL, n=16), lymph nodes (LN, n=15), liver (LIV, n=16), and lung (LNG, n=16) of GF-BLT mice by flow cytometry. Immunohistochemical staining for e, human hematopoietic cells (hCD45+) and f, human macrophages (hCD68+), dendritic cells (hCD11c+), T cells (hCD3+), and CD4+ T cells (hCD4+) in the small intestine (n=3 analyzed), cecum (n=6 analyzed), and large intestine colon (n=3 analyzed) of a GF-BLT mouse. Scale bars, 100 um. b and d, Horizontal and vertical lines represent the mean and standard error mean respectively.
Resident microbiota augment EBV infection and tumorigenesis
The effect of resident microbiota on the establishment of EBV infection and EBV-induced tumorigenesis was evaluated by exposing CV-BLT and GF-BLT mice to EBV by intraperitoneal injection (Supplementary Table 1). Human B cells in CV-BLT and GF-BLT mice express equivalent levels of CD21, the receptor for EBV (Extended Data Fig. 3). GF-BLT mice were maintained in a gnotobiotic isolator and their GF status confirmed for the duration of the study. EBV-DNA (cell-associated and/or cell-free) was detected in the peripheral blood of 67% (4/6) of CV-BLT mice and 25% (2/8) of GF-BLT mice by 8 weeks post-exposure with no notable differences in viral DNA levels between groups (Fig. 2a). EBV-DNA was also detected in multiple tissues of an aviremic CV-BLT mouse analyzed at 12 days post-exposure (Supplementary Table 2). Based on the presence of EBV-DNA in peripheral blood and/or tissues, the establishment of EBV infection was significantly higher in CV-BLT mice (P=0.0344) (Fig. 2b, Supplementary Table 2). At 8 weeks post-exposure, survival was lower in EBV-exposed CV-BLT mice (50%) compared to GF-BLT mice (88%) although this difference was not statistically significant (P=0.1765) (Fig. 2c). EBV infection induced similar CD8+ T cell expansion and activation in the peripheral blood of both CV-BLT and GF-BLT mice (Fig. 2d,e). CD8+ T cells contribute to the control of EBV infection in vivo30–32. To determine if infection had been established in any of the animals that did not show evidence of viremia, animals were treated with a CD8 depleting antibody. Evidence of CD8+ T cell depletion was established by flow cytometry (Fig. 2f). CD8+ T cell depletion resulted in a transient increase in EBV-DNA levels only in CV-BLT and GF-BLT mice that previously had detectable EBV-DNA in peripheral blood (Fig. 2g). None of the mice that were EBV-DNA negative in peripheral blood prior to CD8+ T cell depletion had a detectable increase in peripheral blood EBV-DNA levels after CD8+ T cell depletion (Fig. 2g). To complete this analysis, we determined the presence of EBV-DNA and tumors in the tissues of CV-BLT and GF-BLT mice at necropsy. EBV-DNA was detected significantly more often (P<0.0001, Fisher’s exact test) in the tissues of EBV-exposed CV-BLT mice compared to GF-BLT mice (27/36 vs 11/42 tissues analyzed respectively; Supplementary Table 2). Large macroscopic tumors were observed in three EBV-positive CV-BLT mice in multiple tissues (e.g. spleen, liver, kidney, and stomach) (Fig. 2h, Supplementary Table 3). In contrast, only a single small tumor was observed on the kidney of one of the two EBV-positive GF-BLT mice (Fig. 2i). No EBV-DNA was found in any tissues from the GF-BLT mice that had no detectable cell-free or cell associated EBV-DNA in peripheral blood (Supplementary Table 2). Collectively, these data show that the establishment of EBV infection and EBV-induced tumorigenesis is enhanced by resident microbiota.
Fig. 2. The establishment of EBV infection and EBV-induced tumorigenesis is increased in the presence of resident microbiota.
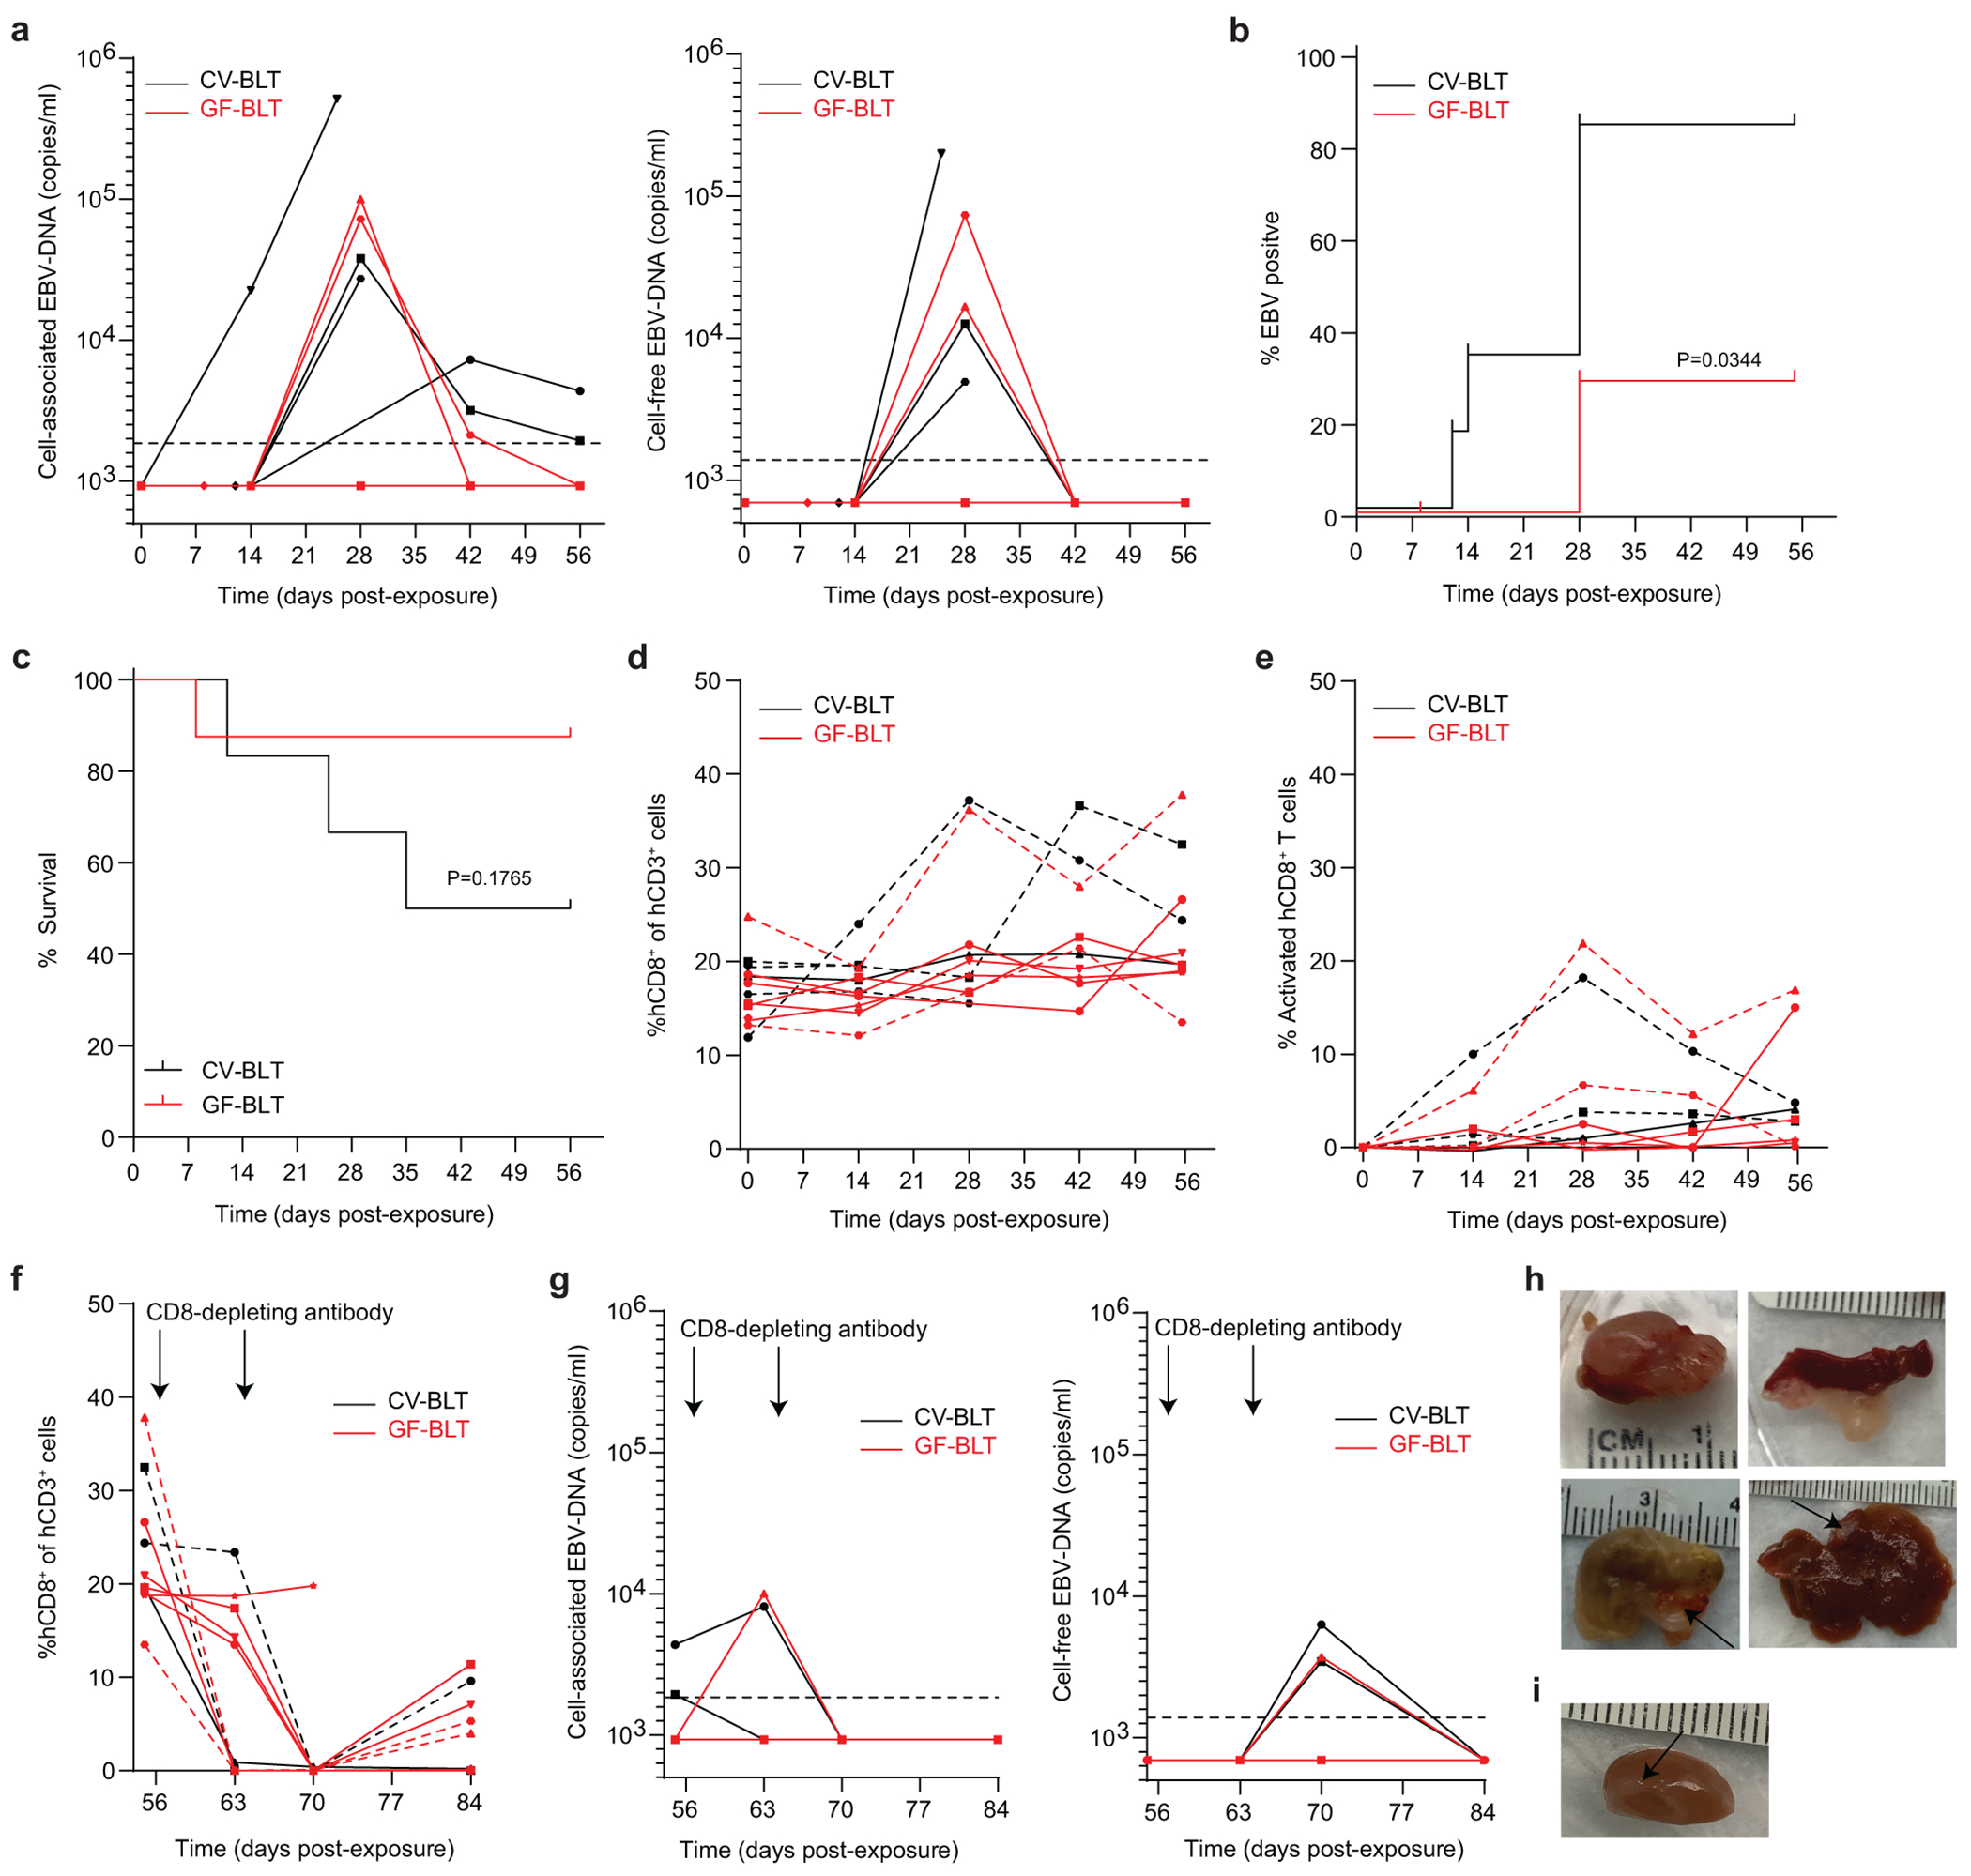
CV-BLT mice (black, n=6) and GF-BLT mice (red, n=8) were exposed to EBV by intraperitoneal injection. a, Cell-associated and cell-free EBV-DNA levels in peripheral blood were monitored longitudinally by real-time PCR. Percent b, EBV positive and c, survival of CV-BLT mice (black) and GF-BLT mice at 8 weeks post-EBV exposure were compared with a two-sided log-rank Mantel-Cox test. Levels of human d, CD8+ T cells and e, activated (CD38+HLA-DR+) CD8+ T cells in CV-BLT mice (black) and GF-BLT mice (red) as determined by flow cytometric analysis. After 8 weeks post-exposure, CV-BLT mice (black) and GF-BLT mice (red) were administered CD8-depleting antibody once per week for two weeks and the levels of f, human CD8+ T cells and g, cell-associated (left panel) and cell-free (right panel) EBV-DNA in peripheral blood measured longitudinally. Images of macroscopic tumors present on h, the kidney, spleen, stomach, and liver of CV-BLT mice and i, the kidney of a GF-BLT mouse at necropsy. In a and g, the limit of detection is shown with a dashed line. In d-f, viremic mice are shown with a dashed line.
Resident microbiota increase oral HIV acquisition
Mothers living with HIV can transmit HIV in breast milk to their infants through the gastrointestinal tract. To evaluate the effect of resident microbiota on HIV acquisition following an oral HIV exposure, CV-BLT and GF-BLT mice were exposed by oral gavage to HIV-1JRCSF, a CCR5-tropic strain previously validated for oral HIV transmission in BLT mice33–35 (Fig. 3a, Supplementary Table 4). GF-BLT mice were maintained in a gnotobiotic isolator and their GF status confirmed for the duration of the study as indicated above. HIV acquisition was significantly increased in the presence of resident microbiota (p=0.0487) following a single oral HIV challenge. Specifically, HIV-RNA was detected in the peripheral blood plasma of 40% (4/10) of CV-BLT mice within three weeks of receiving a single oral HIV challenge (Fig. 3b,c). In contrast, HIV-RNA was not detected in the peripheral blood plasma of any GF-BLT mouse (0/8) by three weeks post exposure (Fig. 3b,c). Following a second HIV challenge, viral RNA was detected in the peripheral blood plasma of 4/6 (66%) and 2/8 (25%) re-exposed CV-BLT and GF-BLT mice respectively (Fig. 3d,e). At necropsy, peripheral blood and tissues from GF-BLT and CV-BLT mice were analyzed for the presence of HIV-DNA to determine if aviremic mice harbored localized sites of low-level virus infection. No HIV-DNA was detected in peripheral blood or tissue samples (0/51) analyzed from aviremic mice at necropsy (Supplementary Table 5). Overall, HIV acquisition was significantly higher in CV-BLT mice (Fig. 3e; P=0.013). Specifically, 8/10 (80%) CV-BLT mice and 2/8 (25%) GF-BLT mice acquired HIV following oral HIV exposure. These results demonstrate that HIV acquisition following an oral HIV challenge is over three-fold higher in the presence of resident microbiota.
Fig. 3. Oral HIV acquisition is increased in the presence of resident microbiota.
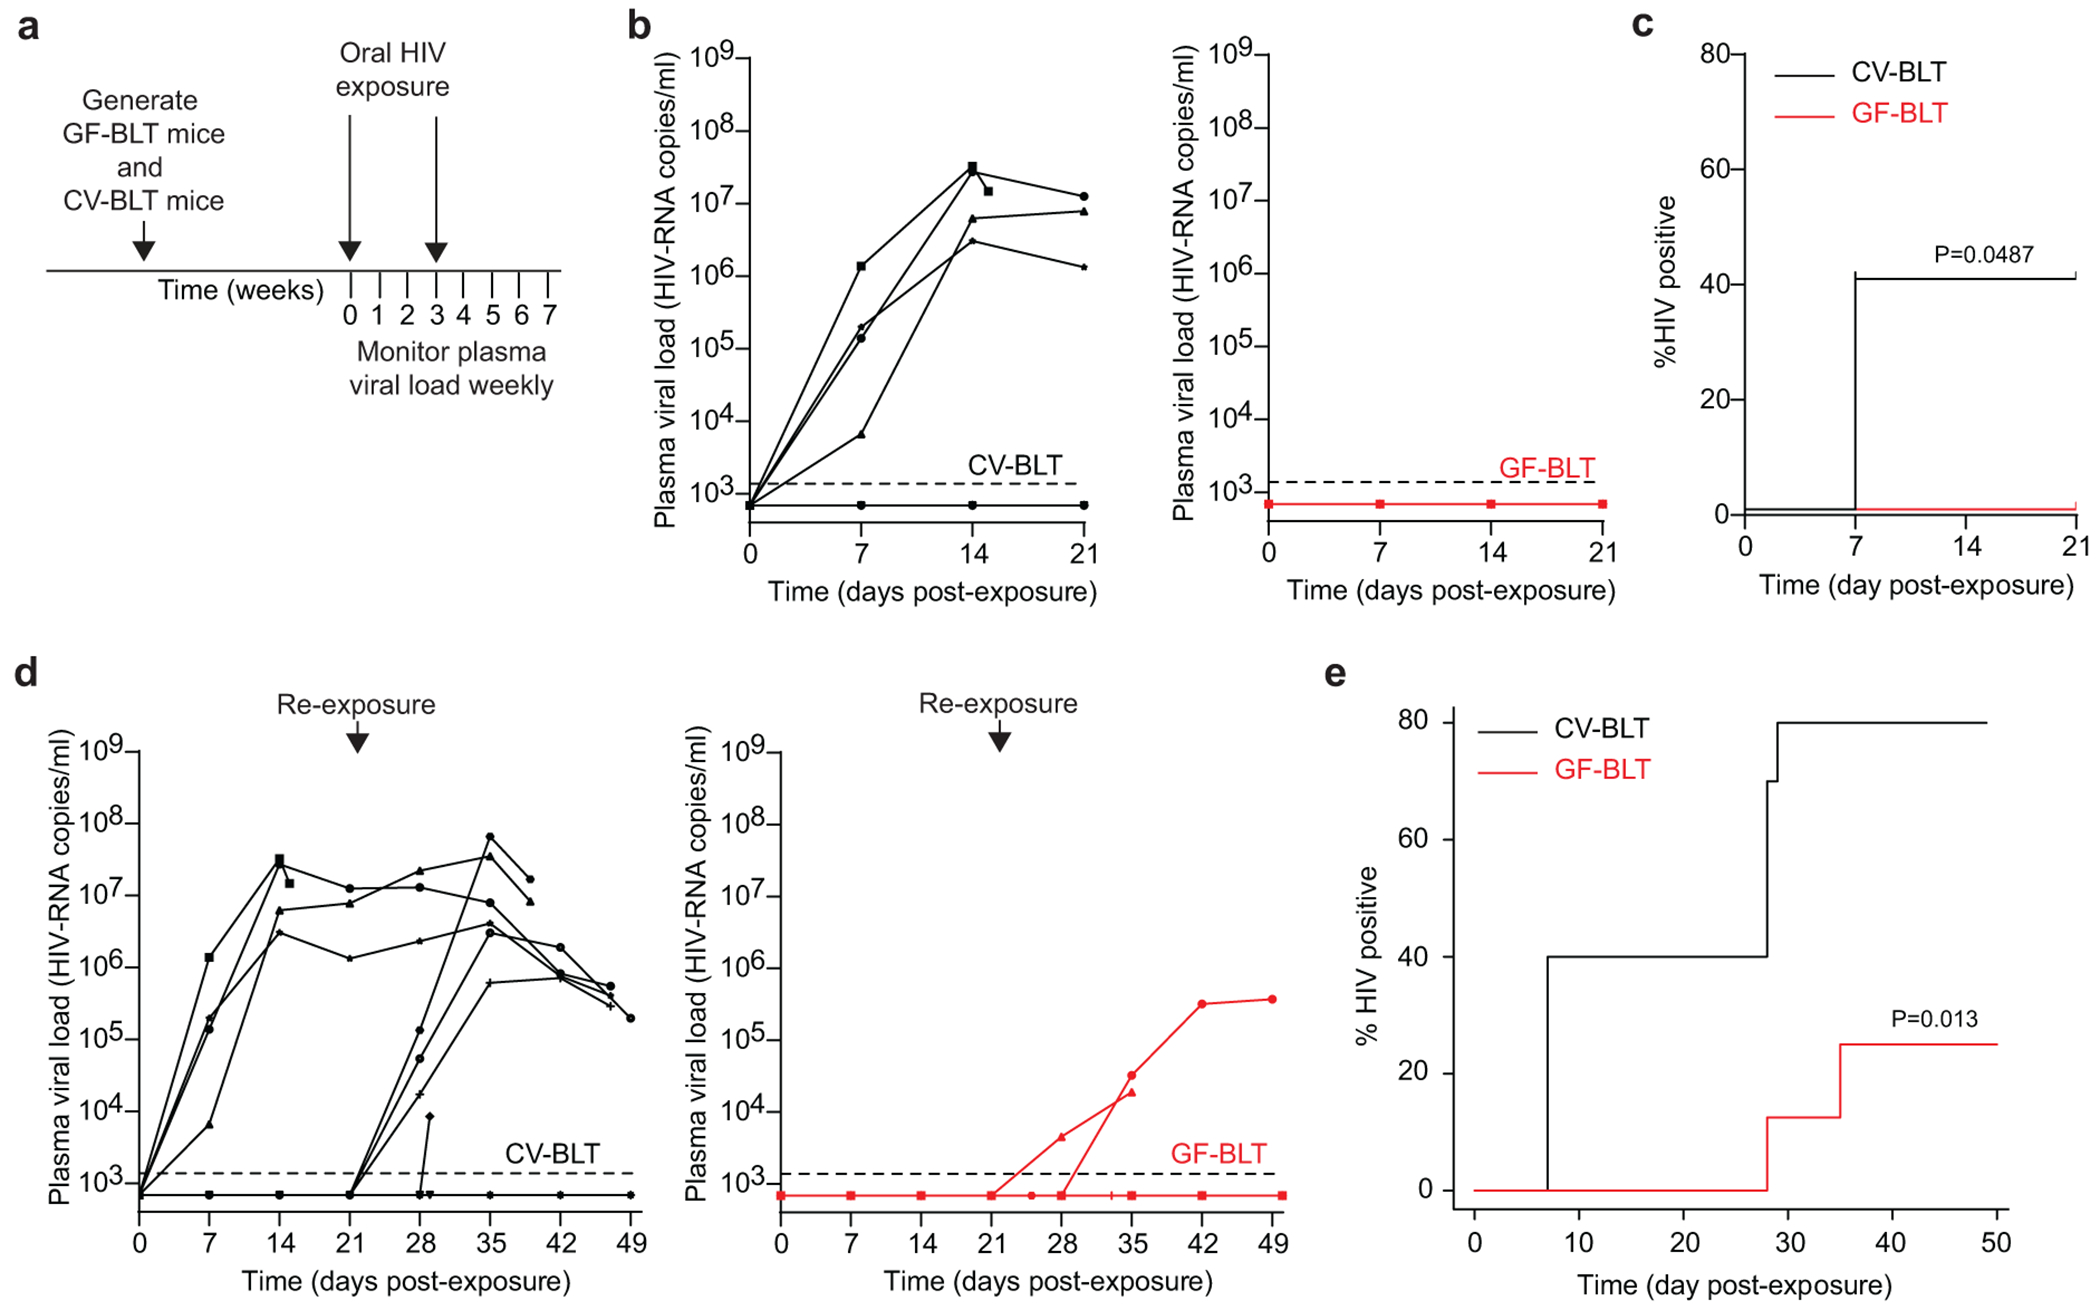
a, CV-BLT mice (n=10) and GF-BLT mice (n=8) were challenged orally with HIV-1JRCSF. HIV-RNA levels in peripheral blood plasma were monitored longitudinally by real-time PCR. Three weeks post-exposure, aviremic BLT mice were administered a second oral dose of HIV. GF-BLT mice were housed in a gnotobiotic isolator for the duration of the study and their GF status monitored longitudinally. b, Peripheral blood plasma viral load (HIV-RNA copies/ml) in CV-BLT mice (left panel, black) and GF-BLT mice (right panel, red) following a single HIV oral challenge. c, Percent HIV positive CV-BLT mice (black) and GF-BLT mice following one oral HIV dose was compared with a two-sided log-rank Mantel-Cox test. d, Peripheral blood plasma viral load (HIV-RNA copies/ml) in CV-BLT mice (left panel, black) and GF-BLT mice (right panel, red) following a second oral HIV challenge. e, Percent HIV positive CV-BLT mice (black) and GF-BLT mice following two oral HIV exposures were compared with a two-sided exact version of Gray’s test. b and d, The limit of detection is shown with a dashed line.
Resident microbiota enhance rectal HIV acquisition
The effect of microbiota on rectal HIV acquisition and the establishment of systemic infection was evaluated by exposing GF-BLT and CV-BLT mice rectally to a single dose of HIV-1THRO, a T cell tropic, CCR5-tropic, MSM-derived transmitted/founder virus36, 37 (Fig. 4a and Supplementary Table 6). Equivalent levels of human CD4+ T cells were present in the peripheral blood of GF-BLT and CV-BLT mice prior to HIV exposure (P=0.4141). GF-BLT mice were housed in a gnotobiotic isolator and their GF status confirmed throughout the study. HIV-RNA was detected in the plasma of 11/17 (64%) of CV-BLT mice (Fig. 4b). At necropsy, HIV-DNA was detected in all peripheral blood and tissue samples (101/101) analyzed from viremic CV-BLT mice and one aviremic animal (Supplementary Table 7 and 8). In contrast, HIV-RNA was only detected in the peripheral blood plasma of 4/11 (36%) GF-BLT mice. At necropsy, HIV-DNA was only detected in peripheral blood and tissue samples (44/46) analyzed from viremic GF-BLT mice (Supplementary Table 7 and 8). Based on the presence of HIV-RNA in plasma and HIV-DNA in tissues at necropsy, rectal HIV acquisition was twice as high in CV-BLT mice compared to GF-BLT mice (Fig. 4c, P=0.0286) indicating that the presence of resident microbiota doubles rectal HIV acquisition.
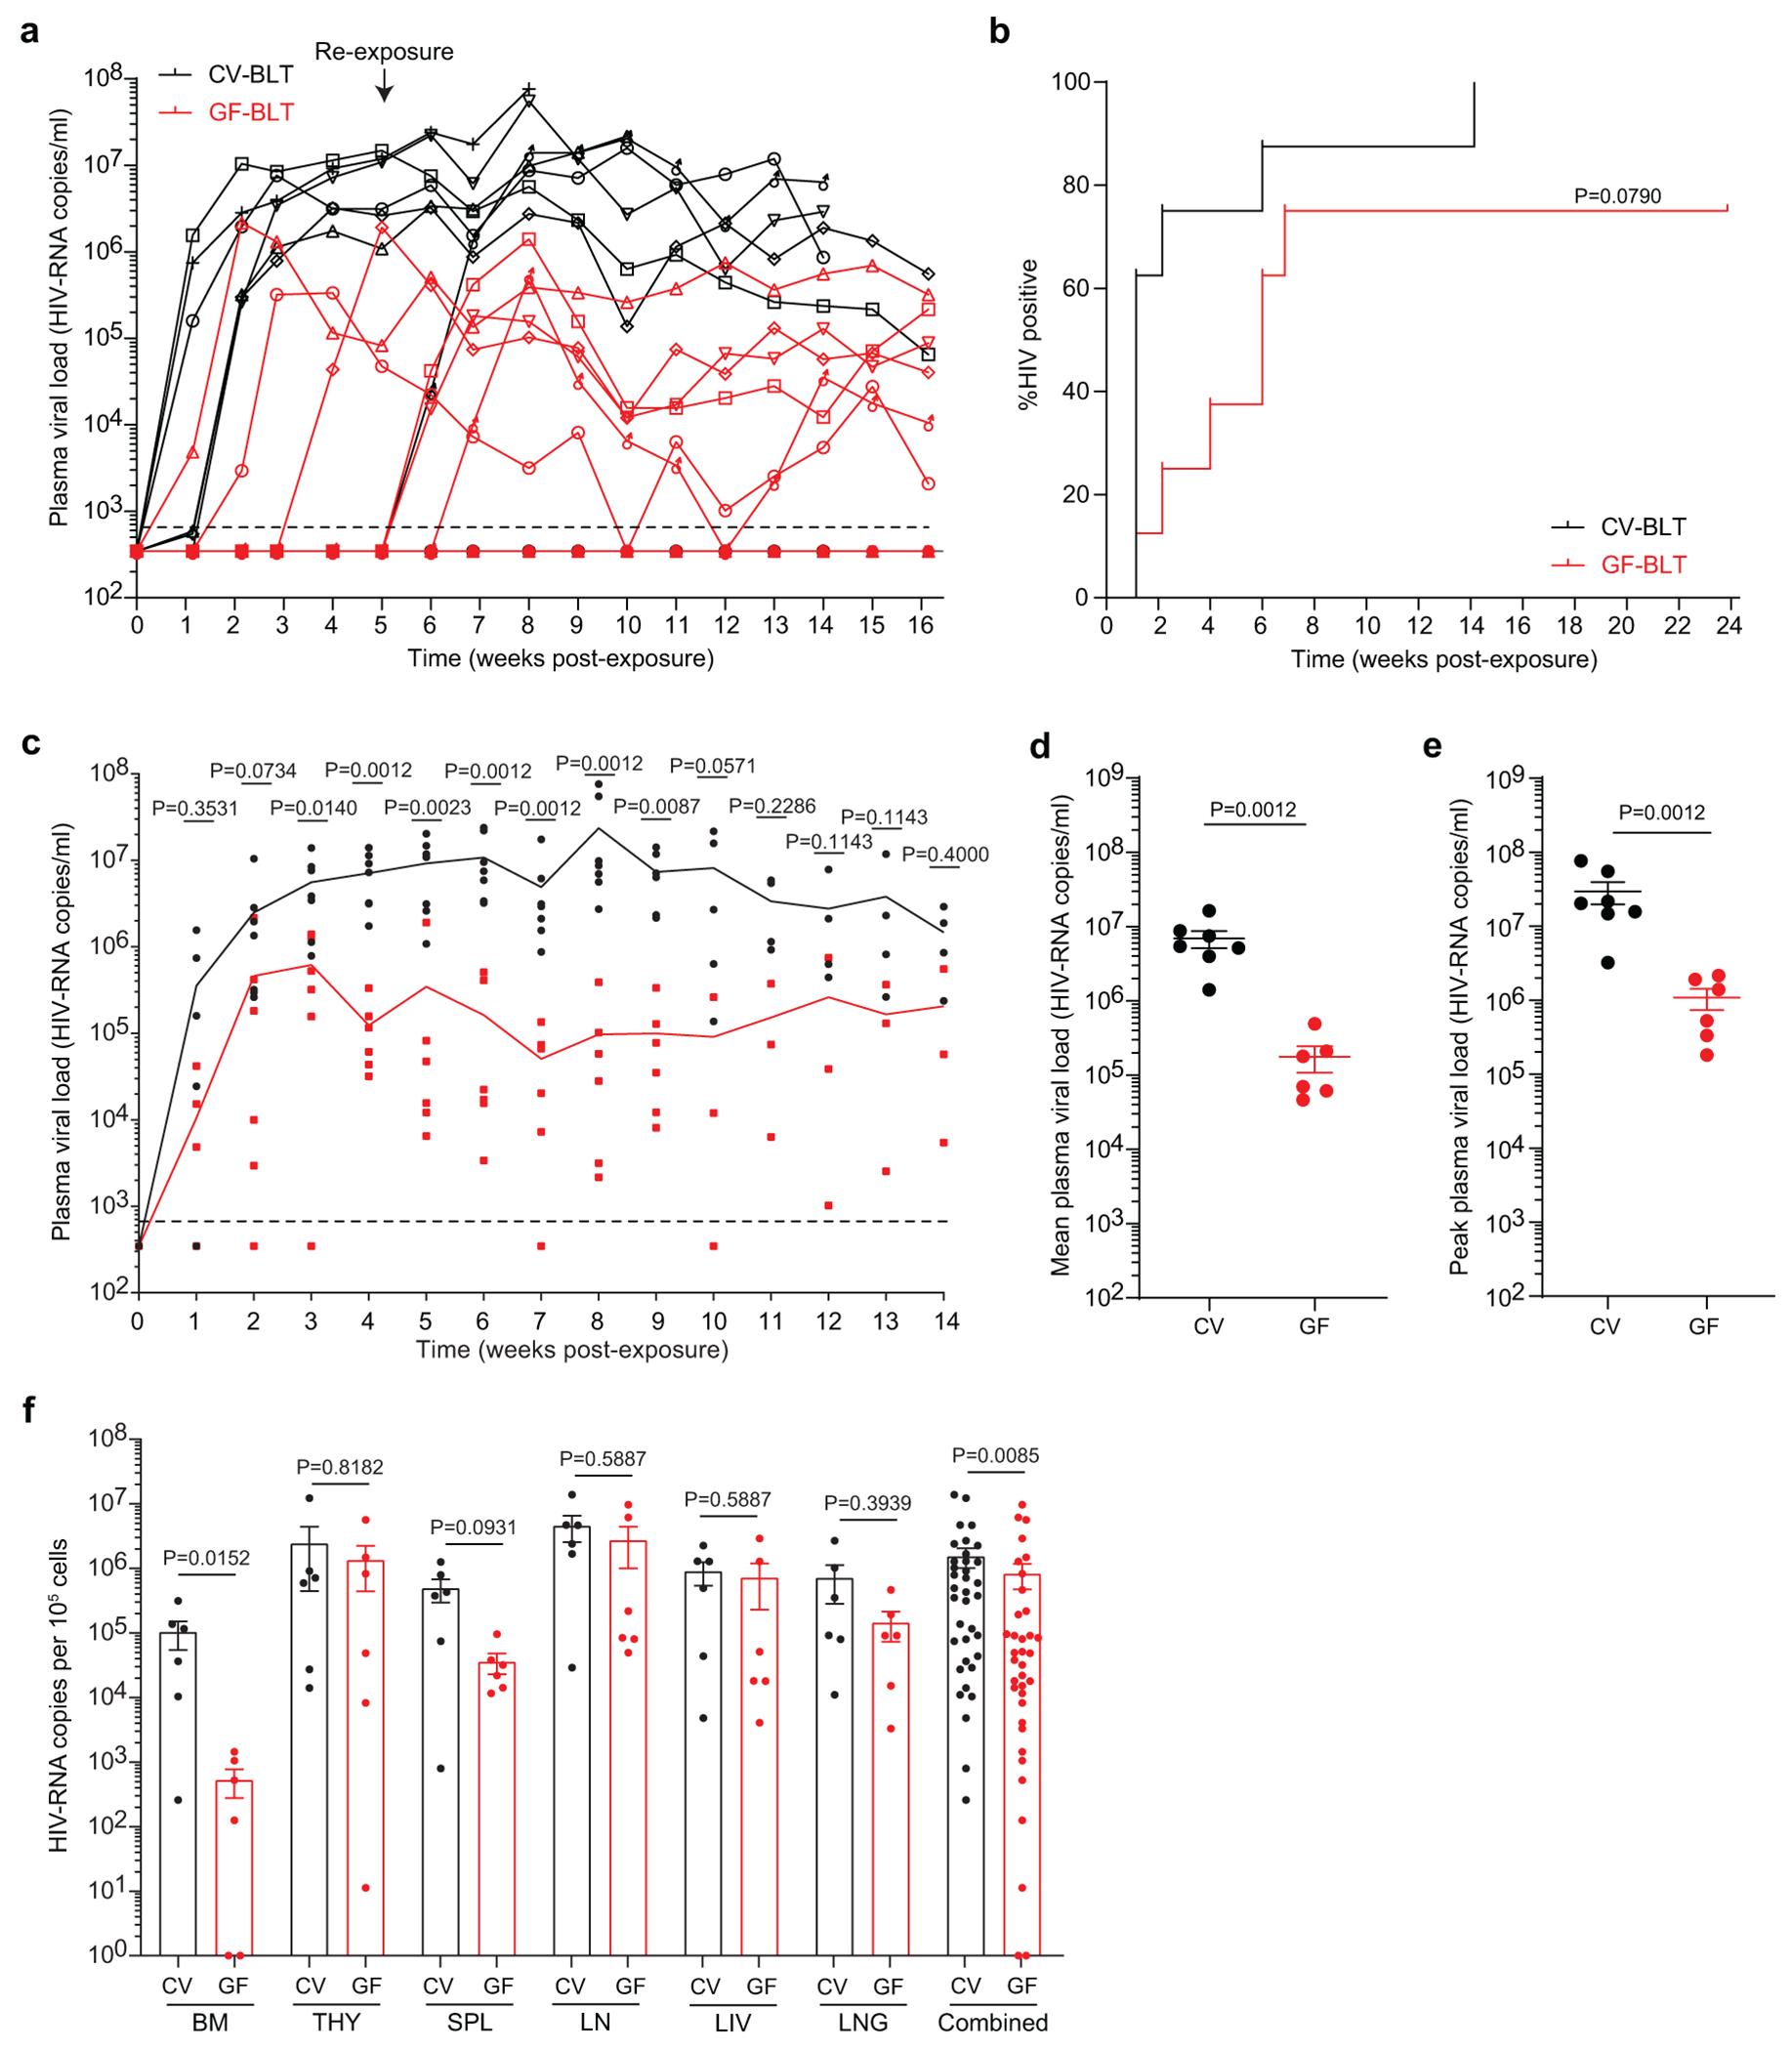
Fig. 4. Rectal HIV acquisition and virus replication in the intestinal tract are enhanced in the presence of resident microbiota.
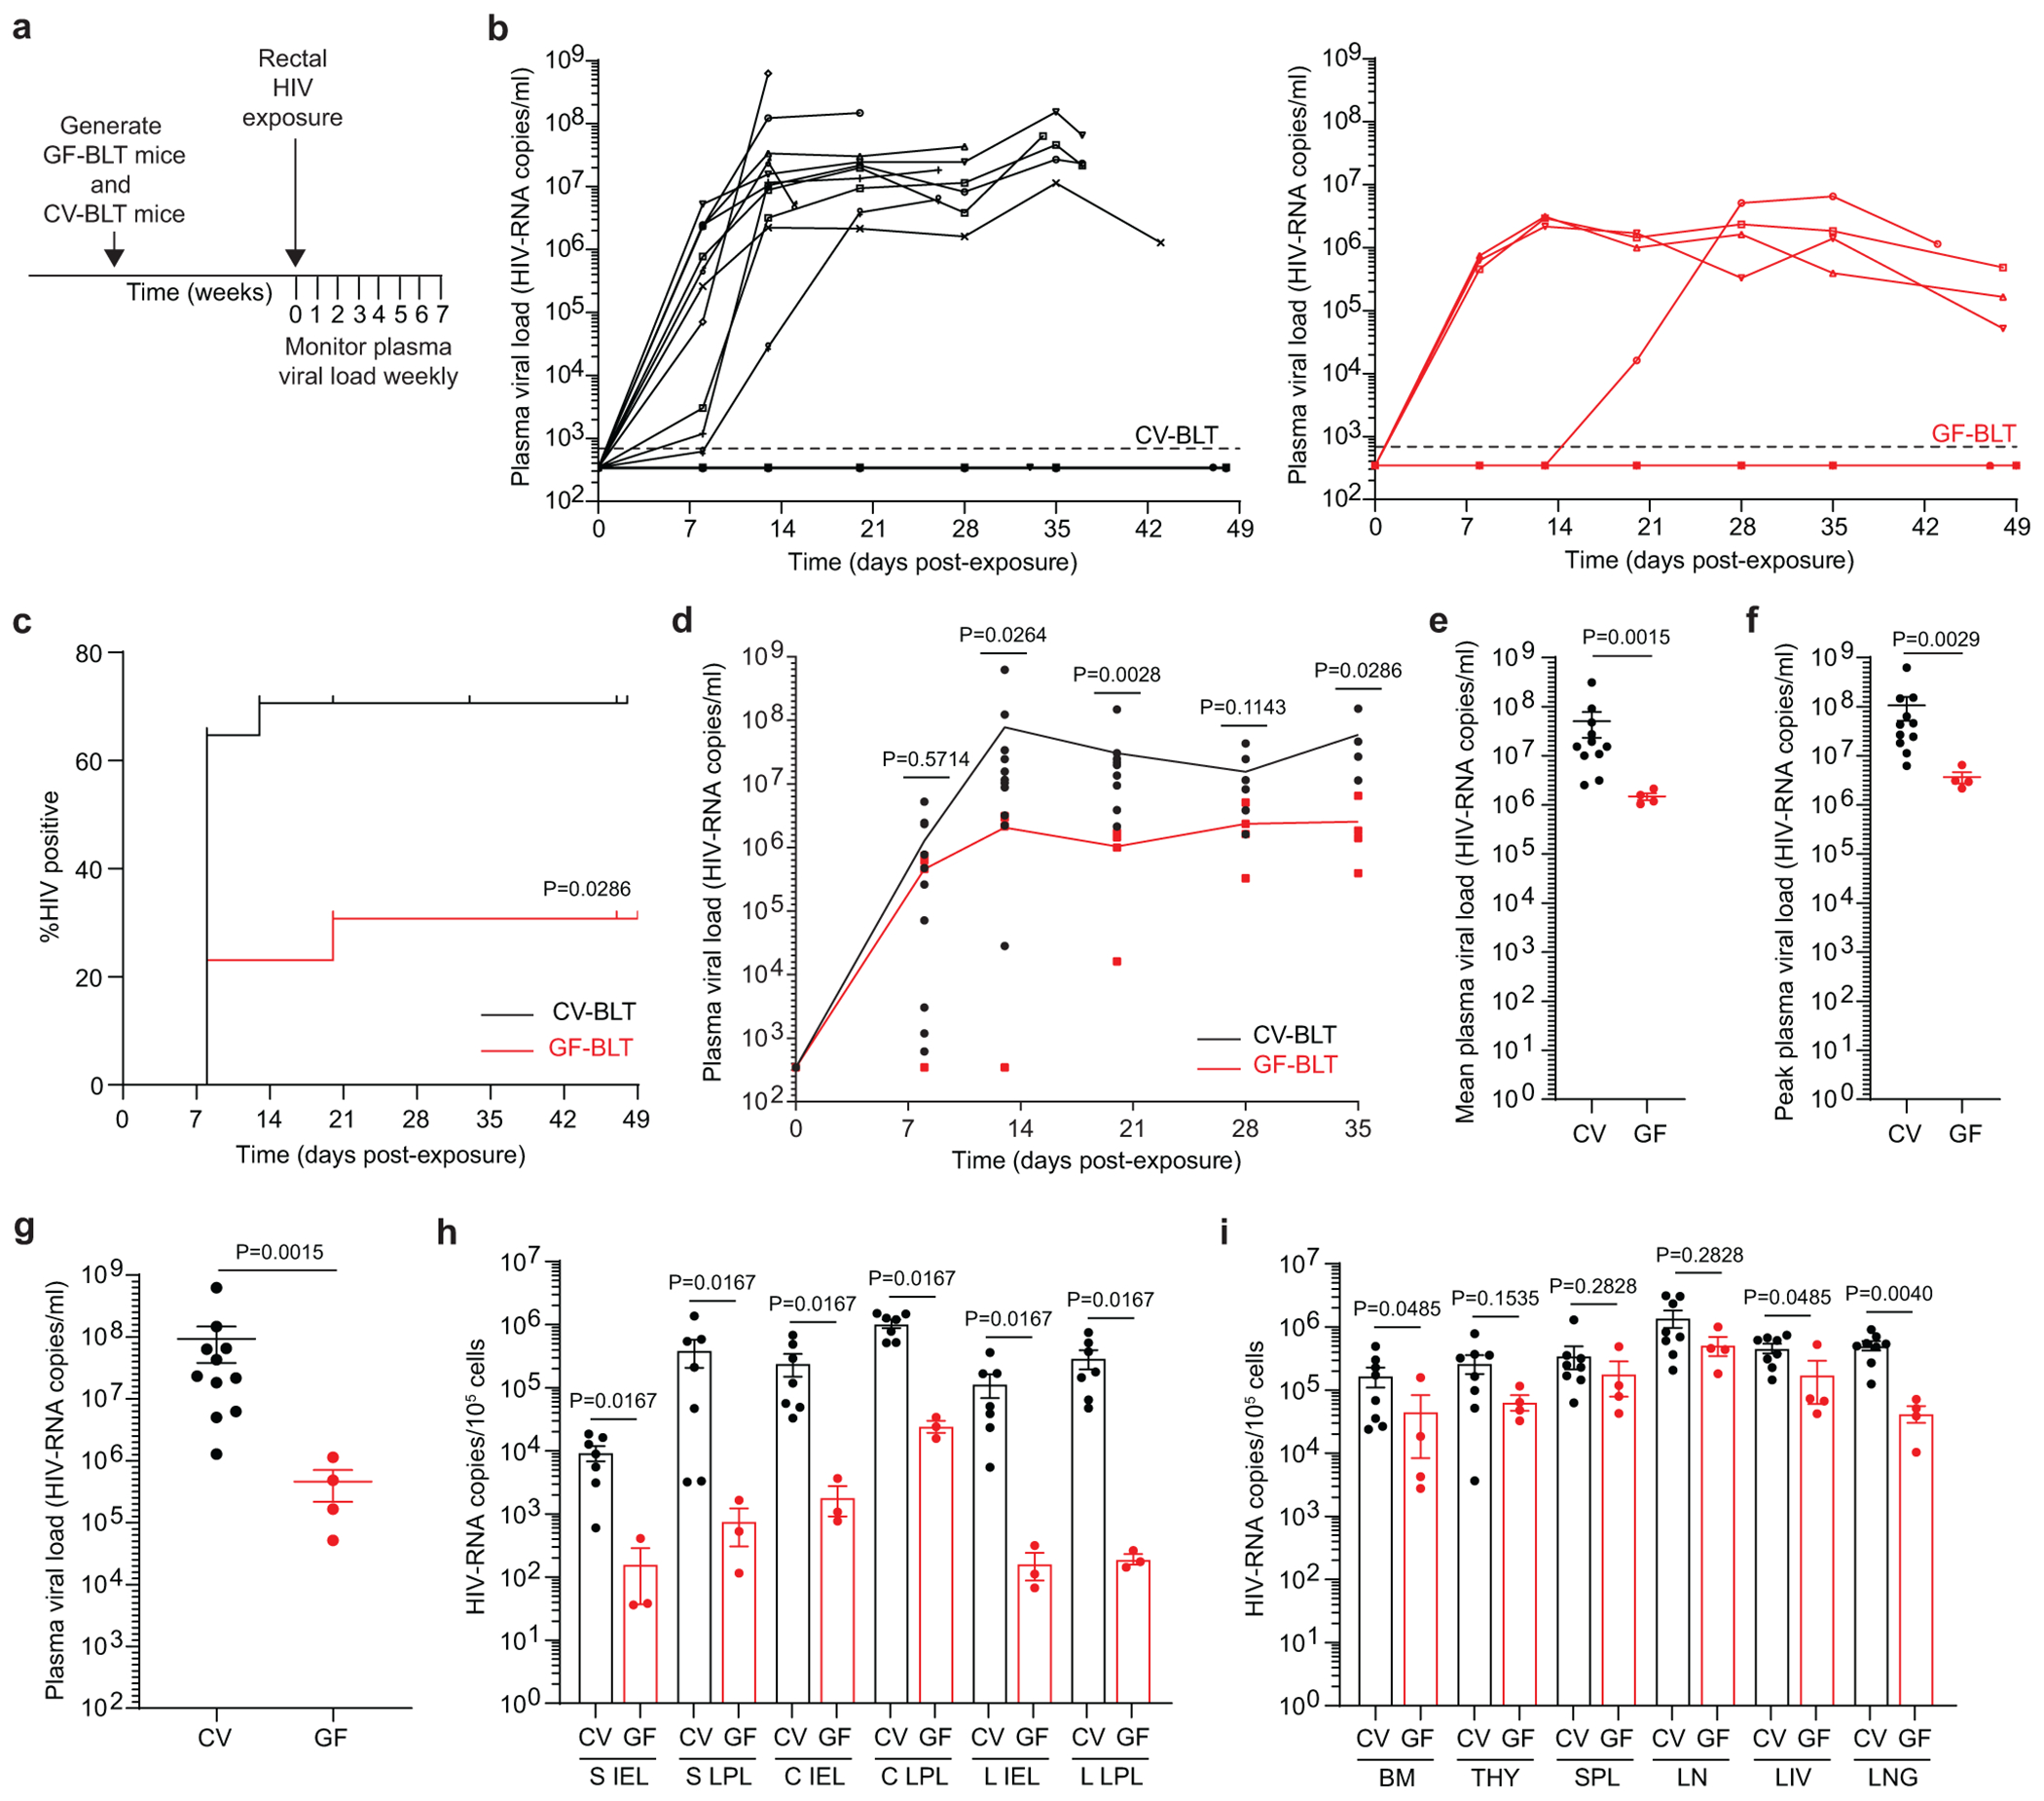
a, CV-BLT mice (n=17) and GF-BLT mice (n=13) were challenged with a single rectal dose of HIV-1. HIV-RNA levels in peripheral blood plasma were monitored longitudinally with real-time PCR. GF-BLT mice were housed in a gnotobiotic isolator for the duration of the study and their GF status monitored longitudinally. b, Peripheral blood plasma viral load (HIV-RNA copies/ml) in CV-BLT mice (left panel, black) and GF-BLT mice (right panel, red) following rectal HIV challenge. The limit of detection is shown with a dashed line. c, Percent HIV positive CV-BLT mice (black) and GF-BLT mice was compared with a two-sided log-rank Mantel-Cox test. d, Peripheral blood plasma viral load of viremic CV-BLT mice (n=11, black) and GF-BLT mice (n=4, red). Solid lines represent mean plasma viral loads. e, Mean and f, peak plasma viral load of viremic CV-BLT mice (n=11, black) and GF-BLT mice (n=4, red). HIV-RNA levels in the g, peripheral blood plasma (CV-BLT mice, n=11; GF-BLT mice, n=4) and cells isolated from h, GI tract tissues (CV-BLT mice, n=7; GF-BLT mice, n=3) and i, non-GI tract tissues (CV-BLT mice, n=8; GF-BLT mice, n=4) of viremic CV-BLT mice (black) and GF-BLT mice (red) at necropsy. S, small intestine; C, cecum; L, large intestine colon; IEL, intraepithelial layer; LPL, lamina propria layer; BM, bone marrow; THY, human thymus; SPL, spleen; LN, lymph nodes; LIV, liver. In e-i, horizontal and vertical lines represent the mean and standard error mean respectively. d-i, HIV-RNA levels were compared with a two-sided Mann-Whitney test.
HIV replication is higher in CV-BLT mice
A comparison of longitudinal HIV-RNA levels in the peripheral blood plasma of viremic CV-BLT and GF-BLT mice following rectal HIV acquisition revealed that mean HIV-RNA levels were 34-fold higher (P=0.0015) in the plasma of CV-BLT mice compared to GF-BLT mice (Fig. 4d,e). This increase in HIV-RNA in plasma was also fully reflected in the peak plasma HIV-RNA levels that were 28-fold higher (P=0.0029) and in the plasma HIV-RNA levels at necropsy that were 201-fold higher (P=0.0015) in CV-BLT mice compared to GF-BLT mice (Fig. 4f,g). Interestingly, mean (39.2-fold, P=0.0012) and peak (27.3-fold, P=0.0012) peripheral blood plasma HIV-RNA levels were also higher in viremic CV-BLT mice compared to GF-BLT mice following a systemic HIV exposure, bypassing the mucosa (Extended Data Fig. 4a–e and Supplementary Table 9 and 10).
Cell-associated HIV-RNA levels were consistently higher in cells isolated from the intraepithelial and lamina propria layers of the small intestine, cecum, and large intestine of CV-BLT mice compared to GF-BLT mice following rectal HIV acquisition (Fig. 4h; P=0.0167). Specifically, HIV-RNA levels were 57-fold, 134-fold, and 704-fold higher in the intraepithelial layer and 512-fold, 42-fold, and 1,520-fold higher in the lamina propria layer of the small intestine, cecum, and large intestine of CV-BLT mice respectively. Higher levels of HIV-RNA were also observed in cells isolated from the bone marrow (3.6-fold; P=0.0485), liver (2.6-fold; P=0.0485), and lung (11-fold; P=0.0040) of CV-BLT mice (Fig. 4i). These data demonstrate that the presence of resident microbiota enhance HIV replication in the intestinal tract and in non-intestinal tissues following rectal HIV acquisition. Of note, overall HIV-RNA levels were also higher in the tissues of viremic CV-BLT mice compared to GF-BLT mice following a systemic HIV exposure (1.8-fold, P=0.0085) (Extended Data Fig. 4f). Notably, 192-fold, 13.7-fold, and 4.9-fold higher levels of HIV-RNA were observed in the bone marrow, spleen and lung of CV-BLT mice respectively Extended Data Fig. 4f).
Higher intestinal CD8+ T cell activation in CV-BLT mice
Rectal HIV acquisition resulted in activation of CD8+ T cells in the peripheral blood and tissues of both viremic CV-BLT and GF-BLT mice (Extended Data Fig. 5). However, HIV infection had a more profound impact on the magnitude of CD8+ T cell activation, as measured by the difference in CD8+ T cell activation levels between viremic and aviremic mice, in the intestinal tract of CV-BLT mice compared to GF-BLT mice (GF: +7.0, CV: +22.6; P=0.0130) (Extended Data Fig. 5). Overall, CD4+ T cell depletion was similar in HIV-infected GF-BLT and Conv-BLT mice (GF: −15.7, CV: −22.3; P=0.2273), however in the bone marrow (GF: −22.2, CV: −44.7), liver (GF: −11.6, CV: −31.9), and cecum LPL (GF: −15.4, CV: −38.3) of CV-BLT mice, CD4+ T cell depletion appeared more dramatic (Extended Data Fig. 6). These data demonstrate that the magnitude of CD8+ T cell activation in the intestinal tract following rectal HIV acquisition was also higher in the presence of resident microbiota.
Resident microbiota govern intestinal HIV target cell levels
To address the molecular and cellular basis of the increased HIV acquisition and replication observed in the presence of resident microbiota, we compared the frequency and phenotype of CD4+ T cells in CV-BLT and GF-BLT mice (Fig. 5). Analysis of the intestinal tract revealed that in the presence of resident microbiota, human CD4+ T cell levels were significantly higher in the intraepithelial layer of the small intestine (19.3-fold, P<0.0001), cecum (1.3-fold, P=0.0088), and large intestine (15.3-fold, P=0.0005) as well as in the lamina propria of the small (1.5-fold, P=0.0033) and large (4.3-fold, P=0.0045) intestines (Fig. 5c and Extended Data Fig. 7a–c). CD8+ T cell levels were also significantly higher in the intestinal tract of CV-BLT mice compared to GF-BLT mice (Extended Data Fig. 8). In contrast, the presence of resident microbiota had minimal impact on human CD4+ T cell or CD8+ T cell levels in peripheral blood and non-intestinal tissues including the bone marrow, lymph nodes, liver, and lung (Extended Data Fig. 7d–j and 8). These data demonstrate that resident microbiota modulate human CD4+ T cell homeostasis specifically in the intestinal tract.
Fig. 5. Resident microbiota increase HIV target cell levels in the intestinal tract.
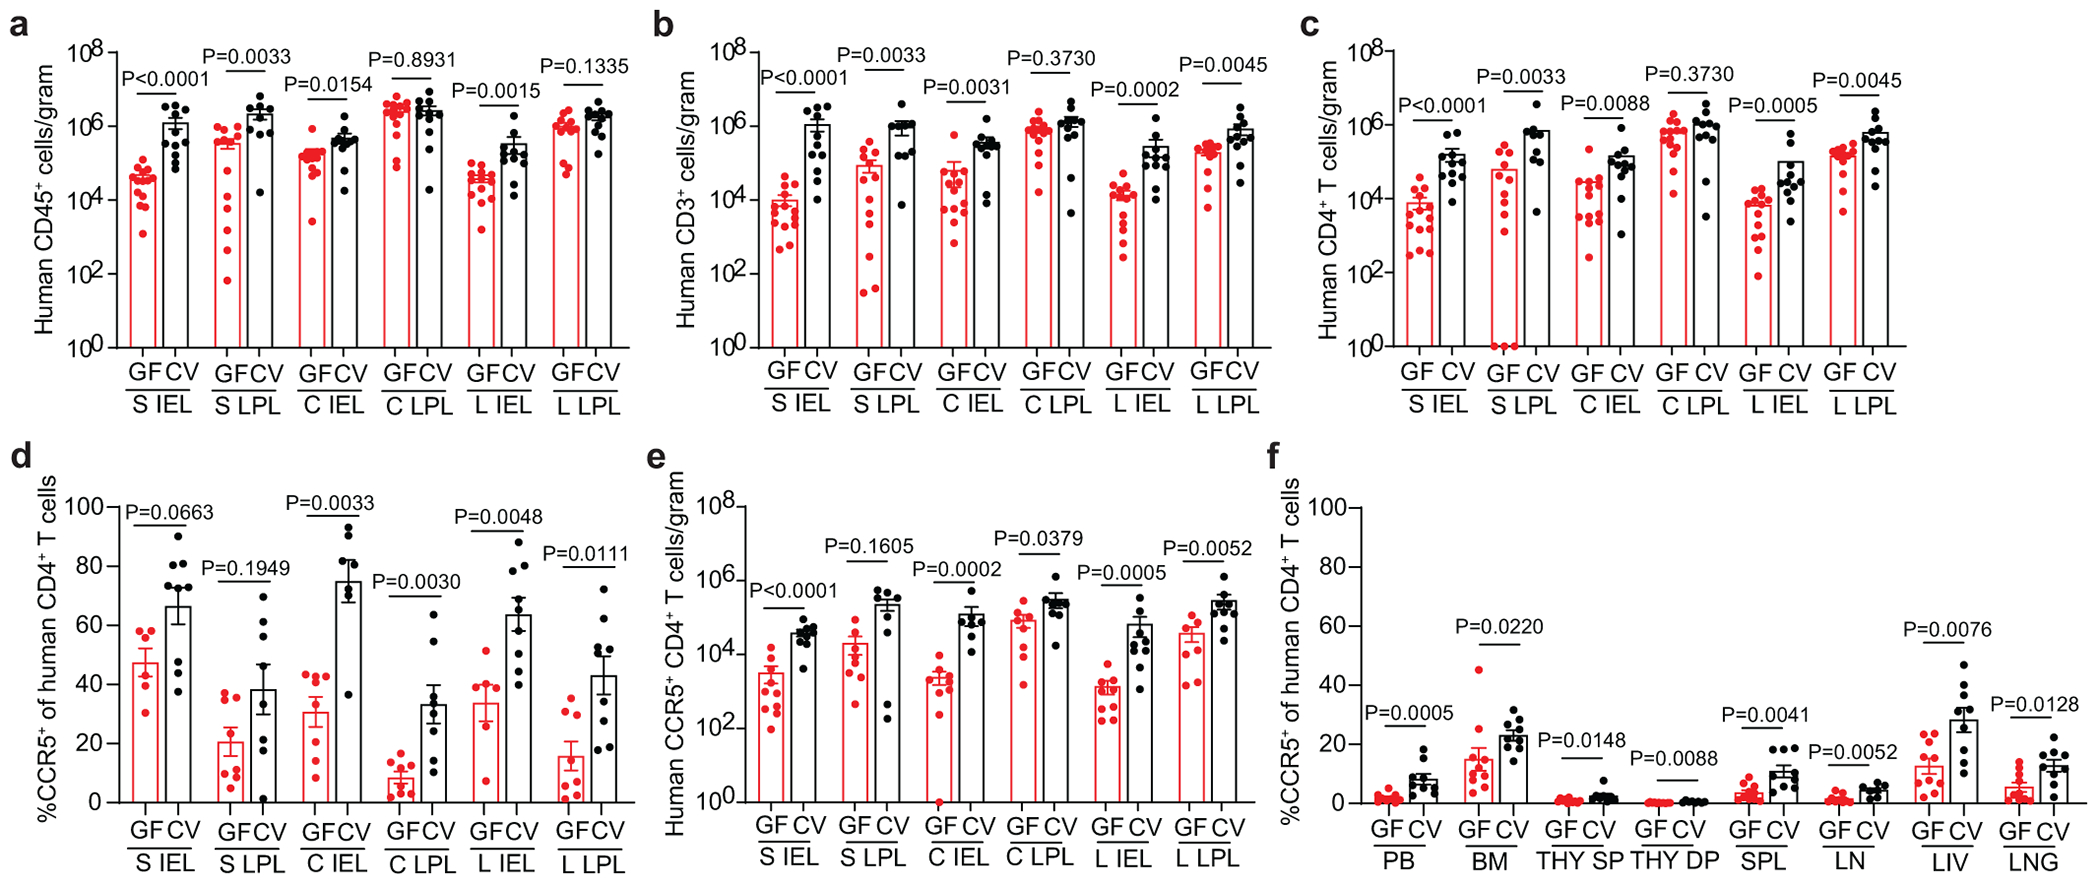
Numbers of a, human hematopoietic cells (hCD45+), including b, T cells (hCD3+) and c, CD4+ T cells in the small intestine (S), cecum (C), and large intestine (L) intraepithelial (IEL) and lamina propria (LPL) layers of GF-BLT mice (GF; red bars; S IEL, n=14; S LPL, n=13; C IEL, n=13; C LPL, n=14; L IEL, n=13; L LPL, n=12) and CV-BLT mice (CV; black; S IEL, n=11; S LPL, n=9; C IEL, n=11; C LPL, n=11; L IEL, n=11; L LPL, n=11) were determined by flow cytometric analysis. d, Percent of human CD4+ T cells expressing CCR5 in the S IEL (GF, n=6; CV, n=9), S LPL (GF, n=8; CV, n=8) C IEL (GF, n=8; CV, n=7), C LPL (GF, n=8; CV, n=8), L IEL (GF, n=6; CV, n=9), and L LPL (GF, n=8; CV, n=9) of GF-BLT (GF; red bars) and CV-BLT (CV; black bars) mice and e, numbers of human CCR5+ CD4+ T cells in the S IEL (GF, n=10; CV, n=9), S LPL (GF, n=8; CV, n=8) C IEL (GF, n=9; CV, n=7), C LPL (GF, n=8; CV, n=8), L IEL (GF, n=9; CV, n=9), and L LPL (GF, n=7; CV, n=9) of GF-BLT (GF; red bars) and CV-BLT (CV; black bars) mice. f, Percent of human CD4+ T cells expressing CCR5 in the peripheral blood (PB; GF, n=9; CV, n=9), bone marrow (BM; GF, n=10; CV, n=9), thymic organoid (THY; GF, n=11, CV, n=8), spleen (SPL; GF, n=10; CV, n= 9), lymph nodes (LN; GF, n=9; CV, n=7), liver (LIV; GF, n=10; CV, n=9), and lung (LNG; GF, n=10; CV, n=9) of GF-BLT (GF; red bars) and CV-BLT (CV; black bars) mice. SP, CD4+ single positive thymocyte. DP, CD4+CD8+ double positive thymocyte. Horizontal and vertical lines represent the mean and standard error mean respectively. A two-sided Mann-Whitney test was used to compare cell levels. a-c, e, The exact p values shown as P<0.0001 for the S IEL are as follows, Human CD45+ cells/gram: P=0.000003, Human CD3+ cells/gram: P=0.000008, Human CD4+ T cells/gram: P=0.000008, and Human CCR5+ CD4+ T cells/gram: P=0.000086.
Virtually all transmitted founder viruses use CCR5 as coreceptor for entry. Consistent with increased acquisition and virus replication in the intestinal tract the percentage of CD4+ T cells expressing CCR5 were significantly higher in the intraepithelial (cecum, P=0.0033; large intestine, P=0.0048) and lamina propria (cecum, P=0.0030, large intestine, P=0.0111) compartments of the cecum and large intestine of CV-BLT mice compared to GF-BLT mice (Fig. 5d). Higher, but not statistically different, percentages of CD4+ T cells expressing CCR5 were also observed in the intraepithelial (CV-BLT mice, 66.5% ± 6.2% s.e.m.; GF-BLT mice, 47.4% ± 4.7% s.e.m.) and lamina propria (CV-BLT mice, 38.3% ± 8.4% s.e.m.; GF-BLT mice, 20.6% ± 4.8% s.e.m.) layers of the small intestine of CV-BLT mice (Fig. 5d). Overall, higher numbers of CCR5+CD4+ T cells were observed throughout the intestinal tract of CV-BLT mice (Fig. 5e). Notably, the levels of CCR5 expression were also higher in peripheral blood and in non-intestinal tissues of CV-BLT mice (Fig. 5f). These results demonstrate that the presence of resident microbiota has a profound and systemic effect on the levels of co-receptor expression on HIV target cells providing a mechanistic explanation for the observed increases in HIV acquisition and replication.
Discussion
The human body is colonized with trillions of microbes, the majority of which reside in the intestinal tract38. GF rodent models have greatly increased our understanding of how resident microbiota contribute to human and health and disease including the role of resident microbiota in human pathogen infection2–4, 6–11. While resident microbiota can provide protection from infection by many pathogenic organisms (e.g. Salmonella typhimurium, Clostridium difficile, Vibrio cholerae, Candida albicans, influenza virus, lymphocytic choriomeningitis virus, etc), recent studies have shown that resident microbes can enhance infection of certain enteric viruses2–4, 6–11. Despite these important findings, the role of resident microbiota in the transmission, replication, and pathogenesis of many human infections cannot be studied in vivo due to the inability of many highly clinically relevant pathogens to replicate in mice. While informative, in vitro infection experiments performed with or without intestinal bacteria are non-physiological. For example, an intact epithelial barrier, mucous layer, defensins, etc. provide a protective shield in vivo to limit viable luminal bacteria from directly contacting cells within the lamina propria. Therefore, here we developed and validated a GF humanized mouse model for the study of human infections that overcomes these limitations by having circulating human immune cell populations that permit viral replication. Using GF-BLT and CV-BLT mice, we demonstrate that resident microbiota are a driver in the establishment of EBV and mucosal HIV infection and their pathogenesis in vivo.
The incidence of EBV infection based on the presence of EBV-DNA in peripheral blood and tissues was higher in the presence of resident microbiota. In addition, whereas large tumors were observed in multiple tissues of CV-BLT mice, a single small tumor was observed in one GF-BLT mouse suggesting that resident microbiota enhances EBV-induced tumorigenesis. Our data demonstrating equivalent levels of CD21 on human splenic B cells in CV-BLT and GF-BLT mice indicate that enhanced EBV infection and tumorigenesis observed in CV-BLT mice is not likely due to differences in expression of the EBV receptor. Future studies will be needed to evaluate the possible mechanism(s) for enhanced EBV infection and tumorigenesis in the presence of resident microbiota. For example, Porphyromonas gingivalis infection, the most common cause of periodontal disease, induces EBV reactivation through histone modification39, 40. P. gingivalis produces butyrate, a HDAC inhibitor, that has been shown to reactivate EBV from latency in vitro and in vivo41, 42. EBV reactivation from latency is associated with EBV-driven tumorigenesis43. It is therefore possible that microbial-derived metabolites may promote EBV-reactivation and tumorigenesis44. Helicobacter pylori and EBV co-infection has also been associated with an aggressive form of gastric cancer45.
HIV acquisition was higher in the presence of resident microbiota following two highly relevant routes of virus exposure at proximal (oral) and distal (rectal) regions of the intestinal tract. Resident microbiota also enhanced systemic HIV replication with the most dramatic impact on virus replication in the intestinal tract where cell-associated HIV-RNA levels were up to 1,520-fold higher in CV-BLT mice. Our results also demonstrate that pathogenic effects of HIV infection, CD4+ T cell depletion and activation of CD8+ T cells, were observed in both GF-BLT and CV-BLT mice. Following rectal HIV acquisition, CD8+ T cell activation was more pronounced in the intestinal tract of CV-BLT mice compared to GF-BLT mice, where the most striking differences in HIV-RNA levels were observed between viremic GF-BLT and CV-BLT mice.
The presence of resident microbiota increased the frequency of CCR5 expressing CD4+ T cells throughout the intestinal tract suggesting that the mechanism for enhanced HIV acquisition and replication CV-BLT mice is an increased density of target cells for local infection after oral or rectal HIV exposure. In support of this, an in vitro study using CD4 and CCR5 expressing HeLa cells demonstrated that when CD4 levels on cells were high, mimicking CD4+ T cells, increasing CCR5 levels on cells was associated with increased viral fusion and virus spread46. In addition, high percentages of CCR5+ CD4+ T cells in people living with HIV (PLWH) have been associated with higher viral loads and increased disease progression47–51. Lower numbers of CCR5+ CD4+ T cells have been observed in ART-naïve PLWH with long-term viral control (long-term non-progressors)52. In vitro, CCR5 expression on CD4+ T cells is enhanced by IL-2 and IL-12 and downregulated by IL-4, CCL5, CCL3, and IL-1053–57. Irrespective of GF status, systemic levels of human cells, particularly CCR5+ CD4+ T cells, could impact HIV acquisition and replication. Also, we cannot rule out the possibility that the higher levels of HIV-RNA observed in some tissues of CV-BLT mice could be due, at least in part, to greater HIV-RNA production per infected CD4+ T cell. A caveat of humanized mice is that the CD4:CD8 ratio in peripheral blood and tissues is slightly higher than what is observed in humans. However, this has not precluded the use of humanized mice to make important discoveries in HIV transmission, pathogenesis, prevention, treatment, and cure, many of which have been recapitulated in humans and/or non-human primates34, 35, 58–62. In addition to modulating intestinal immunity, mice with a resident microbiota demonstrate greater paracellular permeability in the intestinal tract. This has been attributed to lower levels of the tight junction proteins Claudin 1 and Occludin in the colon of these mice63. Increased permeability of the intestinal epithelial barrier could potentially facilitate HIV acquisition in the intestinal tract by enhancing exposure of HIV to lamina propria T cells.
The importance of resident microbiota in intestinal immune development and maturation in rodents has been highlighted in analyses of GF and CV immune competent mice, which demonstrated reduced intestinal intraepithelial and lamina propria murine lymphocytes in GF mice compared to CV mice2, 64–69. We now demonstrate the importance of resident microbiota in the development of the human intestinal T cell compartment. Future experiments will evaluate the effect of the microbiome on the transcriptome of different human T cell subsets in the intestines. Although murine and human microbiota are quantitatively similar, sharing 90% phyla and 89% genera similarity, qualitative host differences in immunologically dominant bacterial species could potentially affect human immune cell composition and function70–73. Future studies will investigate the immunologic effects of human fecal microbiota transferred to GF-BLT mice and how the microbial diversity that exists between humans affects immunity and the acquisition of infection and its sequalae. Prior work demonstrated that following antibiotic treatment, the intestinal microbiome of BLT mice can be colonized with human fecal microbiota74. While the effect of antibiotic depletion with or without colonization of human fecal microbiota on human immune cell levels, HIV infection, or another infection or disease was not examined, this study provided proof-of-principle that the intestine of BLT mice can be colonized with human microbiota. An advantage of GF-BLT mice for the creation of double humanized mice is that they do not have to be treated with antibiotics prior to fecal transplantation avoiding adverse effects such as incomplete depletion of mouse microbiota and overgrowth of antibiotic resistant bacteria that limit the duration and extent of human microbiota persistence. Dually humanized mice will be a useful platform to evaluate how the diversity in microbial composition that exists between people which is influenced by diet, antibiotic use, stress, etc. effects HIV acquisition, replication, and pathogenesis. Previously, a study demonstrated that treatment of HIV infected humanized mice with a broad-spectrum tetracycline antibiotic attenuated HIV replication75. However, due to the predicted high binding affinity of minocycline for HIV integrase, the noted effects are likely not attributable to the effect of the antibiotic on the microbiome.
Interestingly, resident microbiota have also been shown to stimulate maturation of the intestinal mucus layer making it less penetrable which could impede the ability of virus particles to reach HIV susceptible cells63. In vitro data also demonstrate that bacterial membrane lectins and vesicles released from certain types of bacteria can inhibit HIV infection76. Therefore, it was unexpected that despite these potential barriers to HIV transmission in the intestinal tract, we observed increased HIV acquisition and replication in the presence of resident microbiota. Although resident microbiota have been shown to enhance the transmission of a limited number of viruses, most of these were non-enveloped viruses (e.g. poliovirus, norovirus, reovirus, etc) that primarily target the stomach and/or small intestine following fecal-oral transmission5–11. In contrast, EBV and HIV are enveloped viruses. HIV is vertically and sexually transmitted and targets the proximal and distal intestine. Mouse mammary tumor virus, which is vertically transmitted in milk, is the only other retrovirus whose transmission has been shown to be modulated by resident microbiota9.
Immunodeficient mice, and specifically the NSG strain, have served as the basis for the production of precision animal models for biomedical research77. These models have been shown to be useful to gain critical insight into the biology of SARS-CoV, SARS-CoV-2, MERS-CoV, bat coronaviruses, RSV, HCMV, EBV, Zika, KSHV, and HIV33–36, 58–62, 77–89. The results presented herein support the implementation of humanized mice to investigate approaches that target the role of the microbiome, microbial products, or downstream pathways on these and other human specific pathogens. In summary, our results validate and support the use of precision animal models for the study of the role of the microbiome on the infection and pathology associated with numerous human-specific organisms with high clinical importance.
Methods
Ethics Statement
Animal studies were carried out according to protocols approved by the Institutional Use and Care Committee within UNC-Chapel Hill’s fully AAALAC accredited program and in adherence to the NIH Guide for the Care and Use of Laboratory Animals. Mice were kept on a 12 hr light/dark cycle and housed in a temperature (68-74°F) and humidity-controlled (30-70%) vivarium maintained by the Division of Comparative Medicine and National Gnotobiotic Rodent Resource Center (NGRRC) at UNC-Chapel Hill.
Construction of GF-BLT mice and CV-BLT mice
NOD.Cg-Prkdcscid Il2rgtm1Wjl/SzJ mice (NSG, The Jackson Laboratory) were derived GF by sterile transfer of embryos collected from impregnated super ovulated NSG females into surrogate GF females. Briefly, under aseptic conditions, embryos were sterilely harvested from impregnated superovulated female NSG mice and cultured overnight. Embryos that underwent cleavage were surgically implanted into GF pseudopregnant surrogate female mice. A breeding colony of GF-NSG mice was housed and maintained in a flexible film gnotobiotic isolator. We routinely confirmed the sterility of GF-NSG mice at least every 4 weeks by aerobic and anaerobic culturing and Gram staining of freshly passed fecal pellets. PCR detection of noncultivatable bacteria was performed using universal 16S ribosomal DNA primers: forward primer, UniF (5′-GTGSTGCAYGGYTGTCGTCA-3′) and reverse primer, UniR (5′-ACGTCRTCCMCACCTTCCTC-3′)90. Murine microbiota-colonized NSG mice (Extended Data Fig. 1) were bred and maintained under SPF conditions, then used to construct CV-BLT mice. To construct BLT mice, male and female 7-19-week-old NSG mice were irradiated in a sterile irradiation pie and then surgically implanted with human thymus and liver tissue (Advanced Bioscience Resources), treated with amphotericin B, penicillin, and streptomycin, under the kidney capsule33–36, 58–62, 79, 81–83, 86–88, 91, 92. Following tissue implantation, mice were transplanted with autologous human CD34+ stem cells via tail vein injection33–36, 58–62, 79, 81–83, 86–88, 91, 92. GF-BLT mice were constructed in a custom GF surgical isolator and transferred to a quarantine isolator until their GF status was confirmed by Gram-strain, culture, and 16S rRNA PCR as described above. GF-BLT mice were maintained in gnotobiotic isolators and the GF status of isolators was monitored at every port opening. CV-BLT mice were maintained under SPF conditions.
Bacterial microbiome sequencing of CV-BLT mice
Fecal pellets were collected from CV-BLT mice directly into cryovials, snap frozen with liquid nitrogen, and stored at −80°C until analysis. Samples were transferred to a 2 ml tube containing 200 mg of ≤106 μm glass beads (Sigma) and 0.5 ml of Qiagen PM1 buffer. Bead beating was performed for 5 min in a Qiagen TissueLyser II at 30Hz. After a 5 min centrifugation, 0.45 ml of supernatants were aspirated and transferred to a new tube containing 0.15 ml of Qiagen IRS solution. The suspension was incubated at 4°C overnight. After a brief centrifugation, supernatants were aspirated and transferred to deep well plates containing 0.45 ml of Qiagen binding buffer supplemented with Qiagen ClearMag Beads. DNA was purified using the automated KingFisher™ Flex Purification System and eluted in DNase free water93–95.
For 16S rRNA amplicon sequencing, 12.5 ng of total DNA were amplified using universal primers targeting the V4 region of the bacterial 16S rRNA gene. Primer sequences contained overhang adapters appended to the 5’ end of each primer for compatibility with Illumina sequencing platform. The primers used were F515/R80696. Master mixes contained 12.5 ng of total DNA, 0.5 μM of each primer and 2x KAPA HiFi HotStart ReadyMix (KAPA Biosystems, Wilmington, MA). The thermal profile for the amplification of each sample had an initial denaturing step at 95°C for 3 min, followed by a cycling of denaturing of 95°C for 30 sec, annealing at 55°C for 30 sec and a 30 sec extension at 72°C (25 cycles), a 5 min extension at 72°C and a final hold at 4°C. Each 16S amplicon was purified using the AMPure XP reagent (Beckman Coulter, Indianapolis, IN). In the next step each sample was amplified using a limited cycle PCR program, adding Illumina sequencing adapters and dual-index barcodes (index 1(i7) and index 2(i5)) (Illumina) to the amplicon target. The thermal profile for the amplification of each sample had an initial denaturing step at 95°C for 3 min, followed by a denaturing cycle of 95°C for 30 sec, annealing at 55°C for 30 sec and a 30 sec extension at 72°C (8 cycles), a 5-min extension at 72°C and a final hold at 4°C. The final libraries were again purified using the AMPure XP reagent (Beckman Coulter), quantified and normalized prior to pooling. The DNA library pool was then denatured with NaOH, diluted with hybridization buffer and heat denatured before loading on the MiSeq reagent cartridge (Illumina) and on the MiSeq instrument (Illumina). Automated cluster generation and paired–end sequencing with dual reads were performed according to the manufacturer’s instructions.
Sequencing output from the Illumina MiSeq platform were converted to fastq format and demultiplexed using Illumina Bcl2Fastq (version 2.18.0.12). The resulting paired-end reads were processed using QIIME 2 (version 2018.11)97. Index and linker primer sequences were trimmed using the QIIME 2 invocation of cutadapt (version 2018.11). The resulting paired-end reads were processed with DADA2 through QIIME 2 (version 2018.11) including merging paired ends, quality filtering, error correction, and chimera detection98. Amplicon sequencing units from DADA2 were assigned taxonomic identifiers with respect to Green Genes release (version 13_08) using the QIIME 2 q2-featureclassifier (version 2018.11)99.
Flow cytometric analysis
Human immune cell reconstitution in the peripheral blood of GF-BLT and CV-BLT mice were analyzed by flow cytometry longitudinally and in tissues at necropsy33–36, 58–62, 79, 81–83, 86–88, 91, 92. Mice were analyzed between 20-40 weeks post-surgery for the comparison of human immune cell levels between GF-BLT (n=8 human donor cohorts) and CV-BLT (n= 4 human donor cohorts) mice. Mononuclear cells (MNC) were isolated from tissues33–36, 58–62, 79, 81–83, 86–88, 91, 92. MNC from the human thymus, lymph nodes (cervical, axillary, brachial, celiac/portal, mesenteric), and spleen were isolated by passing tissue through a cell strainer. Bones were homogenized with a mortar and pestle and homogenate passed through a cell strainer to isolate bone marrow cells. The lung and liver were minced and enzymatically digested with collagenase D for 30 min at 37°C prior to passing tissue through a cell strainer. Lung and liver MNC were isolated with a 40/70% Percoll gradient. The intestinal tract was divided into the small intestine (S), cecum (C), and large intestine (L), the cecum was analyzed separately from the rest of the large intestine due to the cecal enlargement observed in GF mice49. MNC were then isolated from the intraepithelial layer (IEL) following an incubation with a dithiothreitol (DTT) and EDTA solution and from the lamina propria layer (LPL) with an enzymatic digest, resulting in S IEL, S LPL, C IEL, C LPL, L IEL, and L LPL MNC fractions. Tissue red blood cells were removed with ACK lysis buffer.
Prior to antibody incubation Ig-binding sites were blocked. Cells were then stained with the following antibody panels (Supplementary Fig. 1) to analyze human immune cell populations (3 ul/test CD3-FITC, CD33-PE, CD8-PerCP, CD19-PE-Cy7, CD45-APC, and CD4-APC-H7 or CD3-FITC, CD19-PE, CD4-PerCP, and CD45-APC), dendritic cells (3 ul/test HLA-DR-PerCP, Lineage-FITC, CD123-PE, and CD11c-APC), T cell activation (3 ul/test CD8-FITC or CD8-APC-Cy7, HLA-DR-PerCP or negative control mouse IgG2ak-PerCP, CD27-PE or negative control mouse IgG1k-PE, CD19-PE-Cy7, CD38-APC or negative control mouse IgG1k-APC, CD3-APC-R700 or CD3-BV711, CD4-APC-H7 or CD4-BV605, CD45RA-Pacific Blue or negative control mouse IgG1k- Pacific Blue, and CD45-V500), T cell HIV co-receptor expression (3 ul/test CD8-FITC, CD184[CXCR4]-PE or negative control mouse IgG2ak-PE, CD4-PerCP, CD3-PE-Cy7, CD195[CCR5]-APC or negative control mouse IgG2ak-APC, and CD45-APC-Cy7), and CD21 B cell expression (3 ul/test CD45-APC, CD3-FITC, CD19-PE-Cy7, CD21-BV421 or negative control mouse IgG1k-BV421, and CD27-PE or negative control mouse IgG1k-PE, and 1 ul/test Zombie NIR fixable dye). Following antibody incubation, peripheral blood was treated with 1X BD FACS lysing solution (BD Biosciences). Samples were then washed and fixed with PFA. Data was acquired on a BD LSRFortessa or FACSCanto instrument and analyzed with DIVA software (version 6.1.3) or FlowJo (version 10.6.2).
Immunohistochemical analysis
Immunohistochemical analyses were performed on tissues fixed in 4% PFA or 10% formalin, paraffin embedded and then cut into 5 μm sections as previously35, 79, 88, 92. Tissue sections were deparaffinized with xylene and graded ethanol, antigen retrieval performed (Diva Decloaker, BioCare Medical), and non-specific binding (Background Sniper, BioCare Medical) and endogenous peroxidase activity blocked. Tissue sections were incubated with primary antibodies directed against human hematopoietic cells (CD45, 1:350), macrophages (CD68, 1:200), dendritic cells (CD11c, 1:100), B cells (CD20, 1:100), T cells (CD3, 1:100), CD4+ T cells (CD4, 1:50), CD8+ T cells (CD8, 1:12.5) over night at 4°C. As a control, tissue sections from non-humanized NSG mice were also stained (Supplementary Fig. 2a). Tissue sections were also incubated with the appropriate isotype negative control antibodies (Supplementary Fig. 2b). Tissue sections were washed in TBST and developed using the MACH-3 polymer system (BioCare Medical) and 3,3′-diaminobenzidine (DAB) (Vector Laboratories), counterstained with hematoxylin, and mounted. Tissue sections were imaged on a Nikon Eclipse Ci microscope using Nikon Elements BR software (version 4.30.01) with a Nikon Digital Sight DS-Fi2 camera. Brightness and contrast were adjusted on whole images in Adobe Photoshop (CS6).
EBV production and infection of BLT mice
Stocks of EBV B95.8 were produced via reactivation of 293 cells harboring a B95.8 EBV bacmid following transfection of EBV BZLF1 and gp110100. Cell supernatant was filtered (0.4 uM) and concentrated. EBV stocks were titered on Raji cells. Raji cells infected with serial dilutions of EBV stocks and the number of GFP+ cells counted to calculate the number of green Raji units (GRU)/ml101. EBV (3x10⁵ GRU) was administered to CV-BLT (n=2 human donor cohorts) and GF-BLT (n=1 human donor cohort) mice via intraperitoneal injection. All EBV exposures of GF-BLT mice were performed in a GF isolator.
EBV-DNA quantification in EBV-exposed BLT mice
Cell-associated and cell-free (plasma) EBV-DNA levels in peripheral blood were analyzed longitudinally and cell-associated EBV-DNA levels in tissues were analyzed at necropsy by RT-PCR using the forward primer 5’-GGAACCTGGTCATCCTTGC-3’, reverse primer 5’-ACGTGCATGGACCGGTTAAT-3’, and the probe 5’-FAM-CGCAGGCACTCGTACTGCTCGCT-Q-3’102, 103.
HIV production and infection of BLT mice
Stocks of HIV-1THRO and HIV-1JRCSF were prepared by transfection of 293 T cells and tittered on TZM-bl cells33–36, 58–62, 81–88. For rectal exposures, HIV-1THRO (5.0x10⁶ TCIU) was administered rectally to anesthetized mice with a blunt needle (100 μl). Rectal exposures were performed on two sets of CV-BLT mice (n=5 human donor cohorts) and two sets of GF-BLT mice (n= 3 human donor cohorts). For oral exposures, HIV-1JR-CSF (1.4x 10⁶ TCIU) was administered to CV-BLT (n=3 human donor cohorts) and GF-BLT (n=1 human donor cohort) mice via oral gavage (100 μl). Mice with no detectable viremia at 3 weeks post-exposure received a second oral dose of HIV-1JR-CSF (1.4x 10⁶ TCIU). For systemic exposures, HIV-1JR-CSF (3x10⁵ TCIU) was administered to CV-BLT (n=2 human donors) and GF-BLT mice (n=1 human donor) via intraperitoneal injection (200 μl). Mice with no detectable viremia at 5 weeks post-exposure received a second intraperitoneal dose of HIV-1JR-CSF (3x10⁵ TCIU). All HIV exposures of GF-BLT mice were performed in a GF isolator.
Analysis of plasma viremia in HIV-exposed BLT mice
Plasma HIV-RNA levels in HIV-exposed BLT mice were measured longitudinally by RT–qPCR using a TaqMan RNA to-CT 1-step kit (Applied Biosystems). The sequences of the forward and reverse primers and the TaqMan probe for PCR amplification and detection of HIV gag RNA are: 5′-CATGTTTTCAGCATTATCAGAAGGA-3′, 5′-TGCTTGATGTCCCCCCACT-3′, and 5′-FAM-CCACCCCACAAGATTTAAACACCAT-GCTAA-Q-3′, respectively. All samples were run and analyzed on an ABI 7500 Fast Real Time PCR System (Applied Biosystems).
Cell-associated HIV RNA and DNA quantification in BLT mice
For the quantification of HIV-RNA, RNA was extracted using QIAamp viral RNA columns (Qiagen) according to the manufacturers’ protocol including an optional treatment with RNase-free DNase and analyzed using one-step reverse-transcriptase qPCR (ABI custom TaqMan Assays-by-Design). Known quantities of HIV gag RNA standards were run in parallel, creating a standard curve which was used to extrapolate sample RNA quantities. All samples were run and analyzed on an ABI 7500 Fast Real-Time PCR System (Applied Biosystems). The presence of viral DNA in tissues (5×10⁴–1×10⁶ cells) and peripheral blood collected from BLT mice was determined by RT–qPCR analysis33–36, 58–62, 81–88. The sequences of the forward and reverse primers and TaqMan probe used for detection are 5′-CATGTTTTCAGCATTATCAGAAGGA-3′, 5′-TGCTTGATGTCCCCCCACT-3′, and 5′-FAM-CCACCCCACAAGATTTAAACACCAT-GCTAA-Q-3′, respectively. As a control for the presence of DNA extracted from human cells, all samples were tested for the presence of human gamma globin DNA. The sequences of the forward and reverse primers and the TaqMan probe for PCR amplification and detection of human gamma globin are 5’-CGC TTC TGG AAC GTC TGA GATT-3’, 5’-CCT TGT CCT CCT CTG TGA AAT GA-3’, and 5’-FAM-TCA ATA AGC TCC TAG TCC AGA C-Q-3’, respectively.
Statistical analysis
No statistical methods were used to predetermine sample sizes. In addition, no randomization was used to determine allocation of samples or mice to experimental groups and downstream analysis. The investigators were not blinded to group allocation for data collection and analysis. Statistical analyses were performed in GraphPad Prism (version 6 or 7) or R using the survival (version 3.2-11) and cmprsk (version 2.2-11) packages104, 105. All data is plotted as mean ± S.E.M, statistical tests were two-sided, and P ≤ 0.05 was considered statistically significant. We used a log-rank Mantel-Cox test to compare the rates of EBV infection and HIV acquisition following one oral or rectal HIV exposure and an exact version of Gray’s test (treating death/necropsy as a competing risk) to compare the rate of HIV acquisition following two oral HIV exposures106, 107. A Mann–Whitney U-test was used to compare human immune cell profiles and HIV-RNA levels in the peripheral blood and tissues of BLT mice.
Extended Data
Extended Data Fig. 1. Fecal bacterial microbiome of CV-BLT mice.
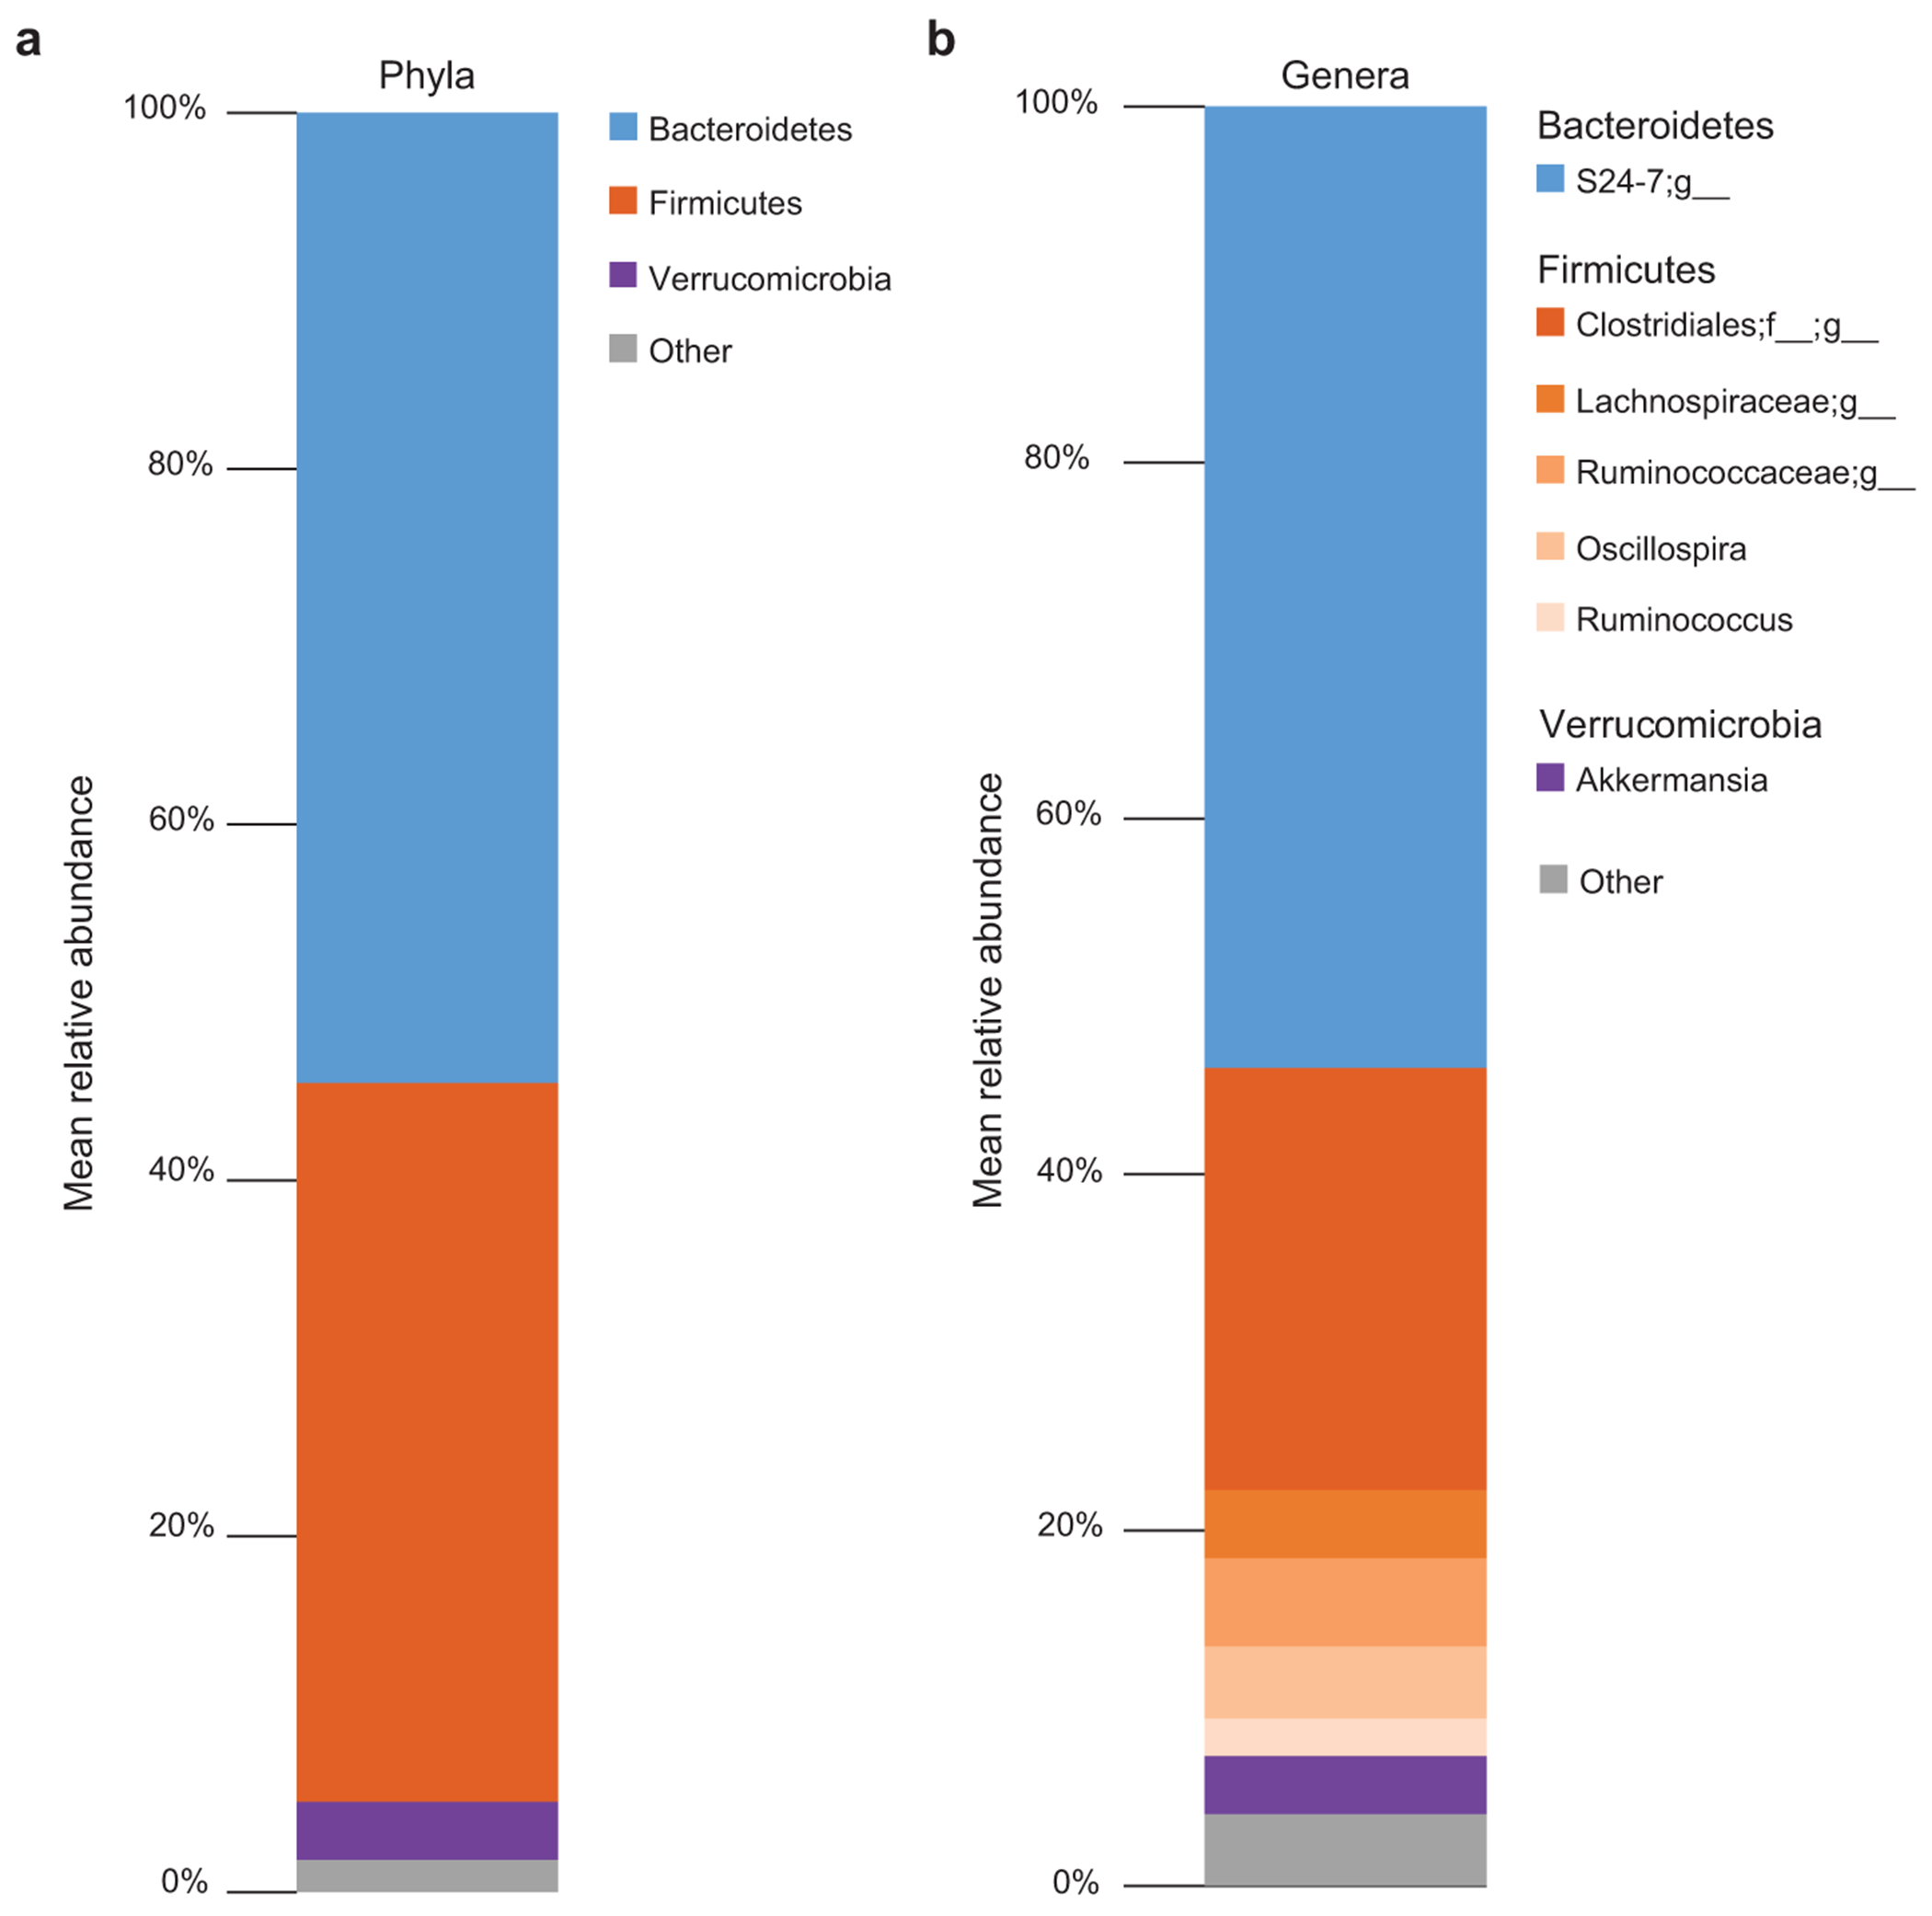
The composition of the bacterial microbiome was analyzed by 16S amplicon sequencing in fecal pellets collected from CV-BLT mice (n=10). The mean relative abundance at the a, phylum and b, genus levels are shown. Taxa with a mean relative abundance <2% were grouped together as other.
Extended Data Fig. 2. Human hematopoietic cells are present in lymphoid and non-lymphoid tissues of GF-BLT mice.
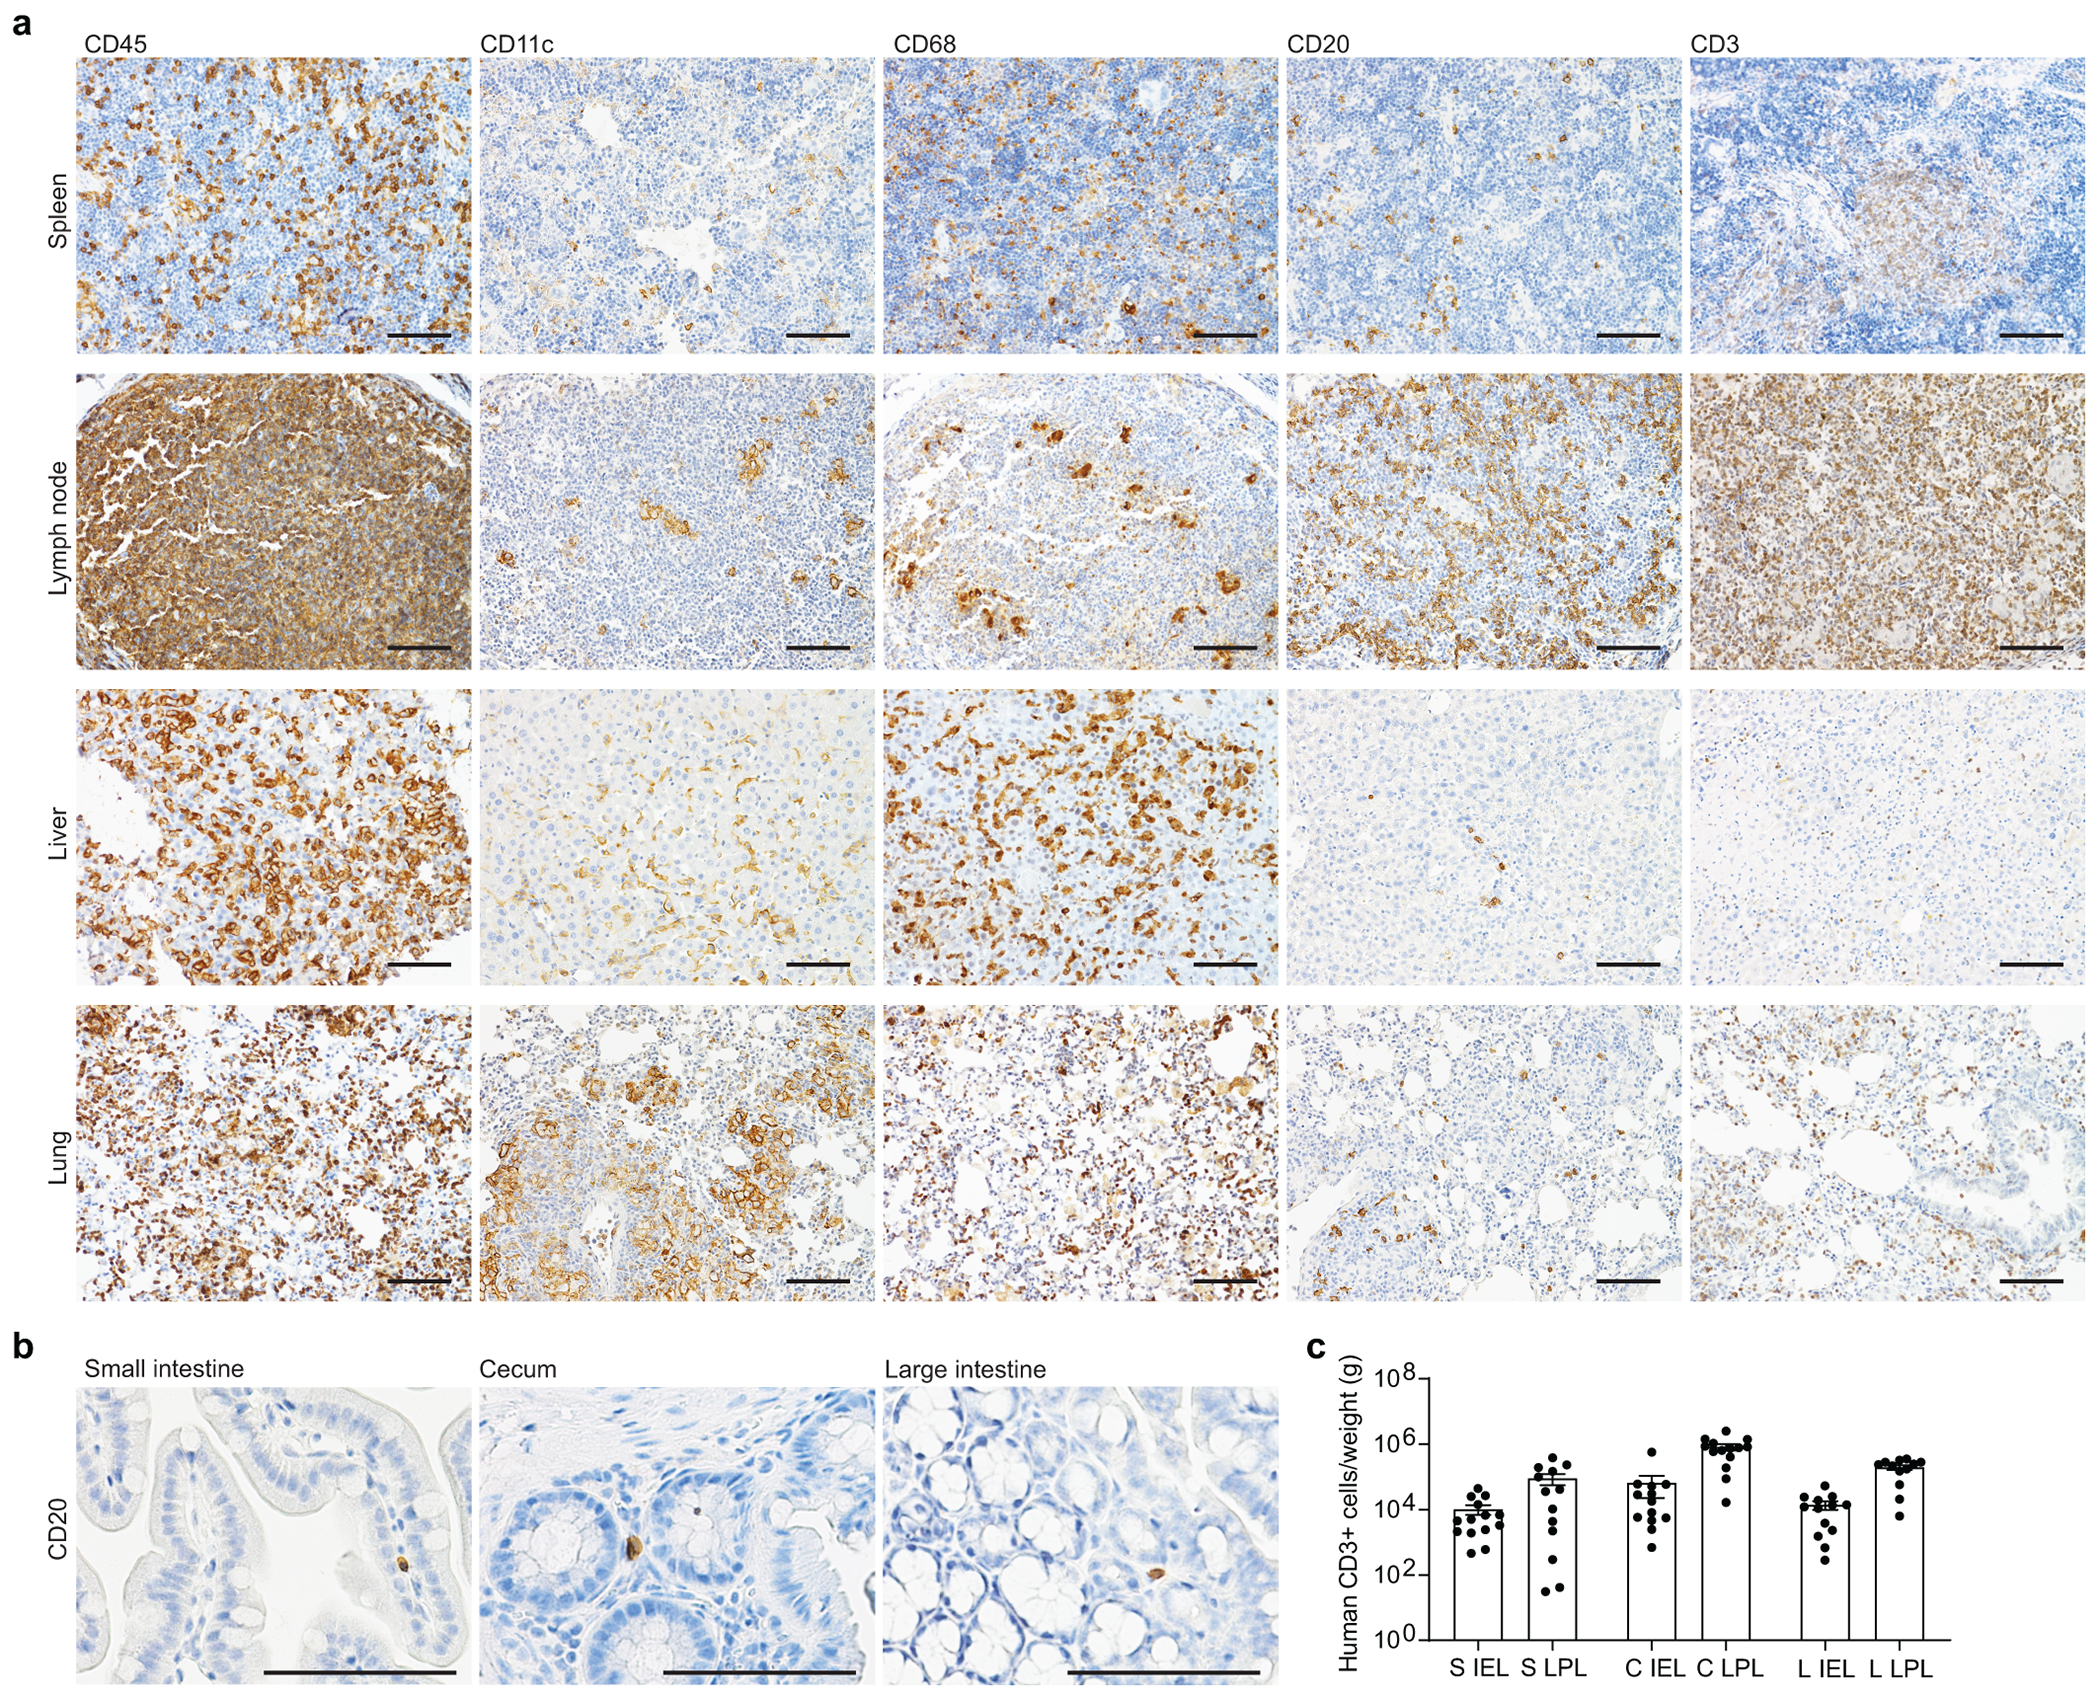
Immunohistochemical staining for a, human hematopoietic cells (hCD45+) including human dendritic cells (hCD11c+), myeloid cells (hCD68+), B cells (hCD20+) and T cells (hCD3+) in the spleen (n=6 analyzed), lymph nodes (n=5 analyzed), liver (n=5 analyzed), and lung (n=6 analyzed) of GF-BLT mice and b, human B cells (hCD20+) in the small intestine (n=3 analyzed), cecum (n=6 analyzed), and large intestine colon (n=3 analyzed). Positive cells are stained brown. Scale bars, 100 um. c, Flow cytometric analysis of human T cell levels in the intraepithelial layer (IEL) and lamina propria layer (LPL) of the small intestine (S), cecum (C), and large intestine (L) of GF-BLT mice (n=14 S IEL, C LPL; n=13 S LPL, C IEL, L IEL; n=12 L LPL). Horizontal and vertical lines represent the mean and standard error mean respectively.
Extended Data Fig. 3. CD21 expression on human splenic B cells in CV-BLT and GF-BLT mice.
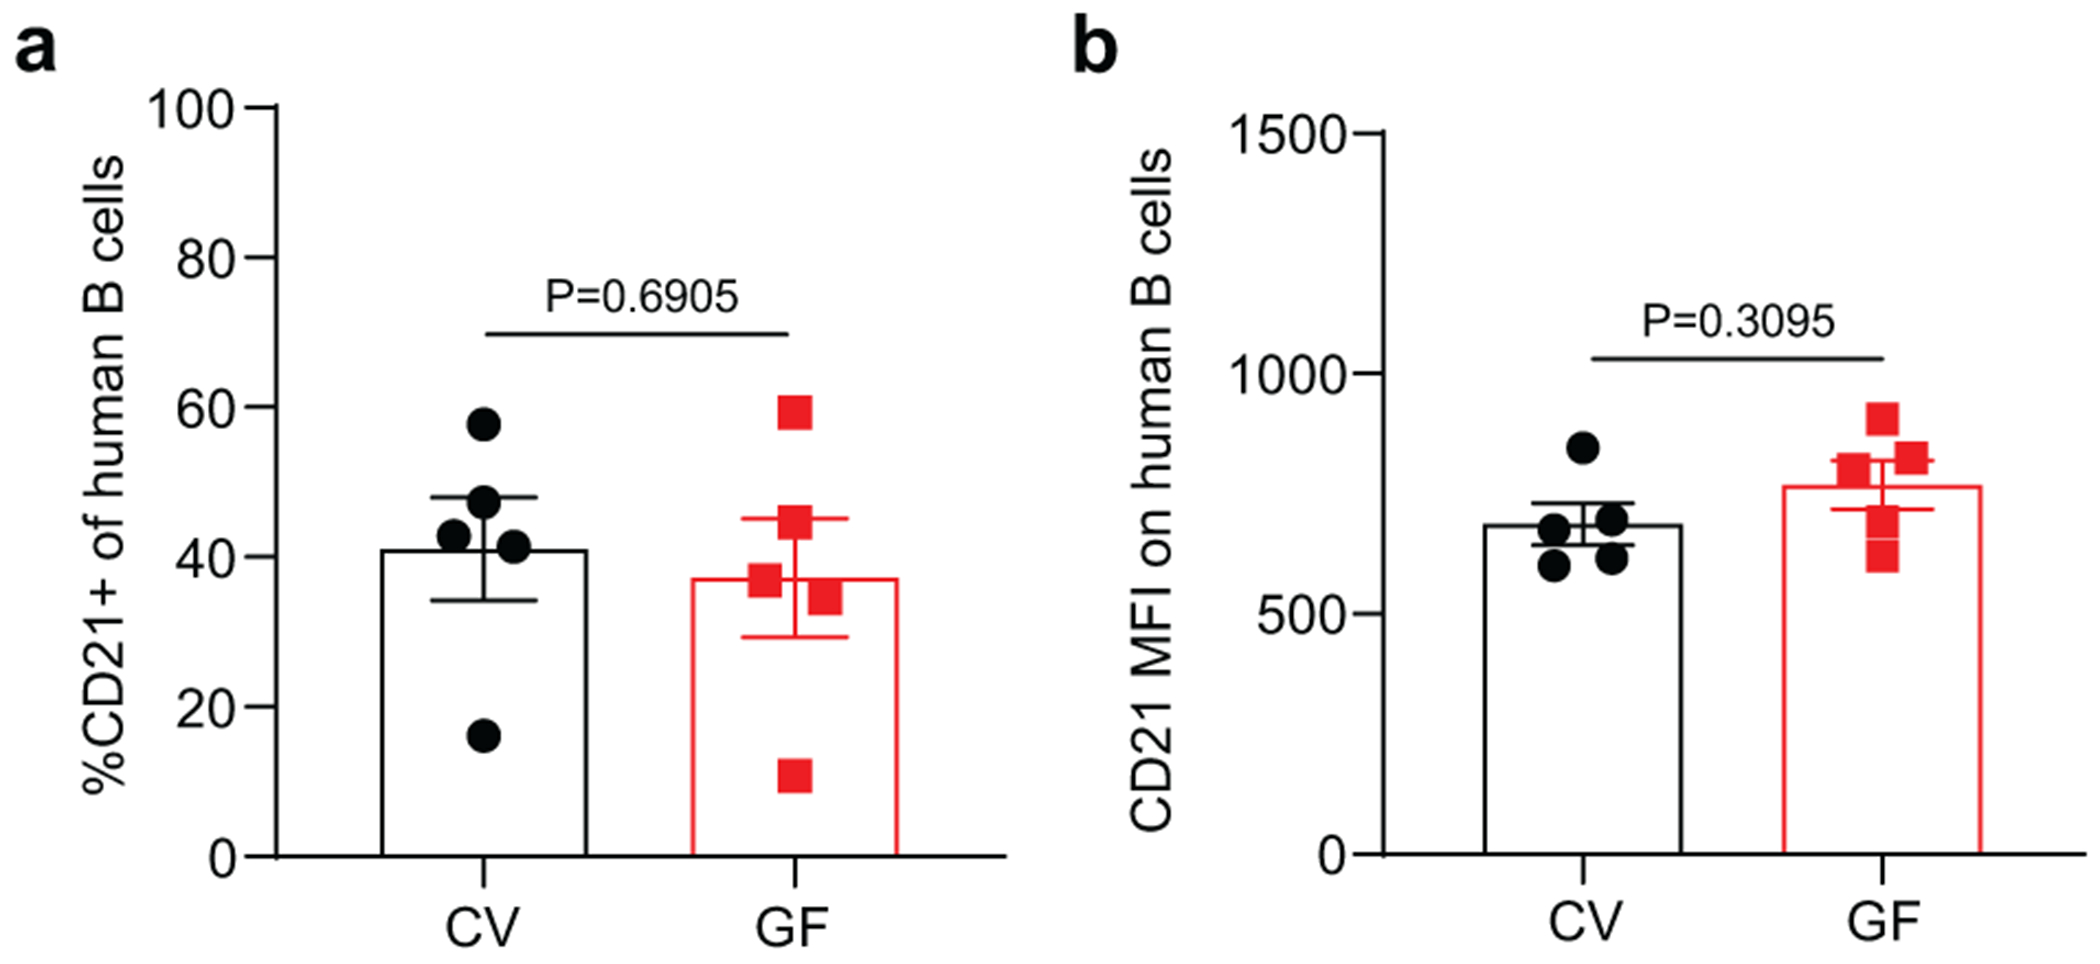
CD21 expression was evaluated on human B cells isolated from the spleen of CV-BLT (n=5, black) and GF-BLT (n=5, red) mice using flow cytometry. The a, percent of human B cells expressing CD21 and the b, mean fluorescent intensity (MFI) of CD21 staining on CD21+ human B cells was compared between CV-BLT and GF-BLT mice with a two-sided Mann-Whitney test. Horizontal and vertical lines represent the mean and standard error mean respectively.
Extended Data Fig. 4. HIV replication is enhanced in the presence of resident microbiota following a systemic HIV exposure.
CV-BLT mice (n=8) and GF-BLT mice (n=8) were challenged systemically with HIV-1JRCSF. HIV-RNA levels in peripheral blood plasma were monitored longitudinally by real-time PCR. Five weeks post-exposure, aviremic BLT mice were administered a second systemic dose of HIV. GF-BLT mice were housed in a gnotobiotic isolator for the duration of the study and their GF status monitored longitudinally. a, Peripheral blood plasma viral load (HIV-RNA copies/ml) in CV-BLT mice (left panel, black) and GF-BLT mice (right panel, red) following HIV challenge. The limit of detection is shown with a dashed line. b, Percent HIV positive CV-BLT mice (black) and GF-BLT mice were compared with a two-sided log-rank Mantel Cox test based on the presence of HIV-RNA and/or HIV-DNA in peripheral blood and/or tissues. c, Peripheral blood plasma viral load of viremic CV-BLT mice (n=7, black) and GF-BLT mice (n=6, red). For mice that acquired HIV infection after the second challenge, week one represents the viral load one week after the second HIV exposure (6 weeks after the first exposure). Solid lines represent mean plasma viral loads. d, Mean and e, peak plasma viral load of viremic CV-BLT mice (n=7, black) and GF-BLT mice (n=6, red). f, HIV-RNA levels in the bone marrow (BM), human thymus (THY), spleen (SPL), lymph nodes (LN), liver (LIV), and lung (LNG) of viremic CV-BLT mice (n=6, black) and GF-BLT mice (n=6, red). In d-f, horizontal and vertical lines represent the mean and standard error mean respectively. c-f, HIV-RNA levels were compared with a two-sided Mann-Whitney test.
Extended Data Fig. 5. CD8+ T cell activation is more pronounced in the intestinal tract in the presence of resident microbiota following rectal HIV acquisition.
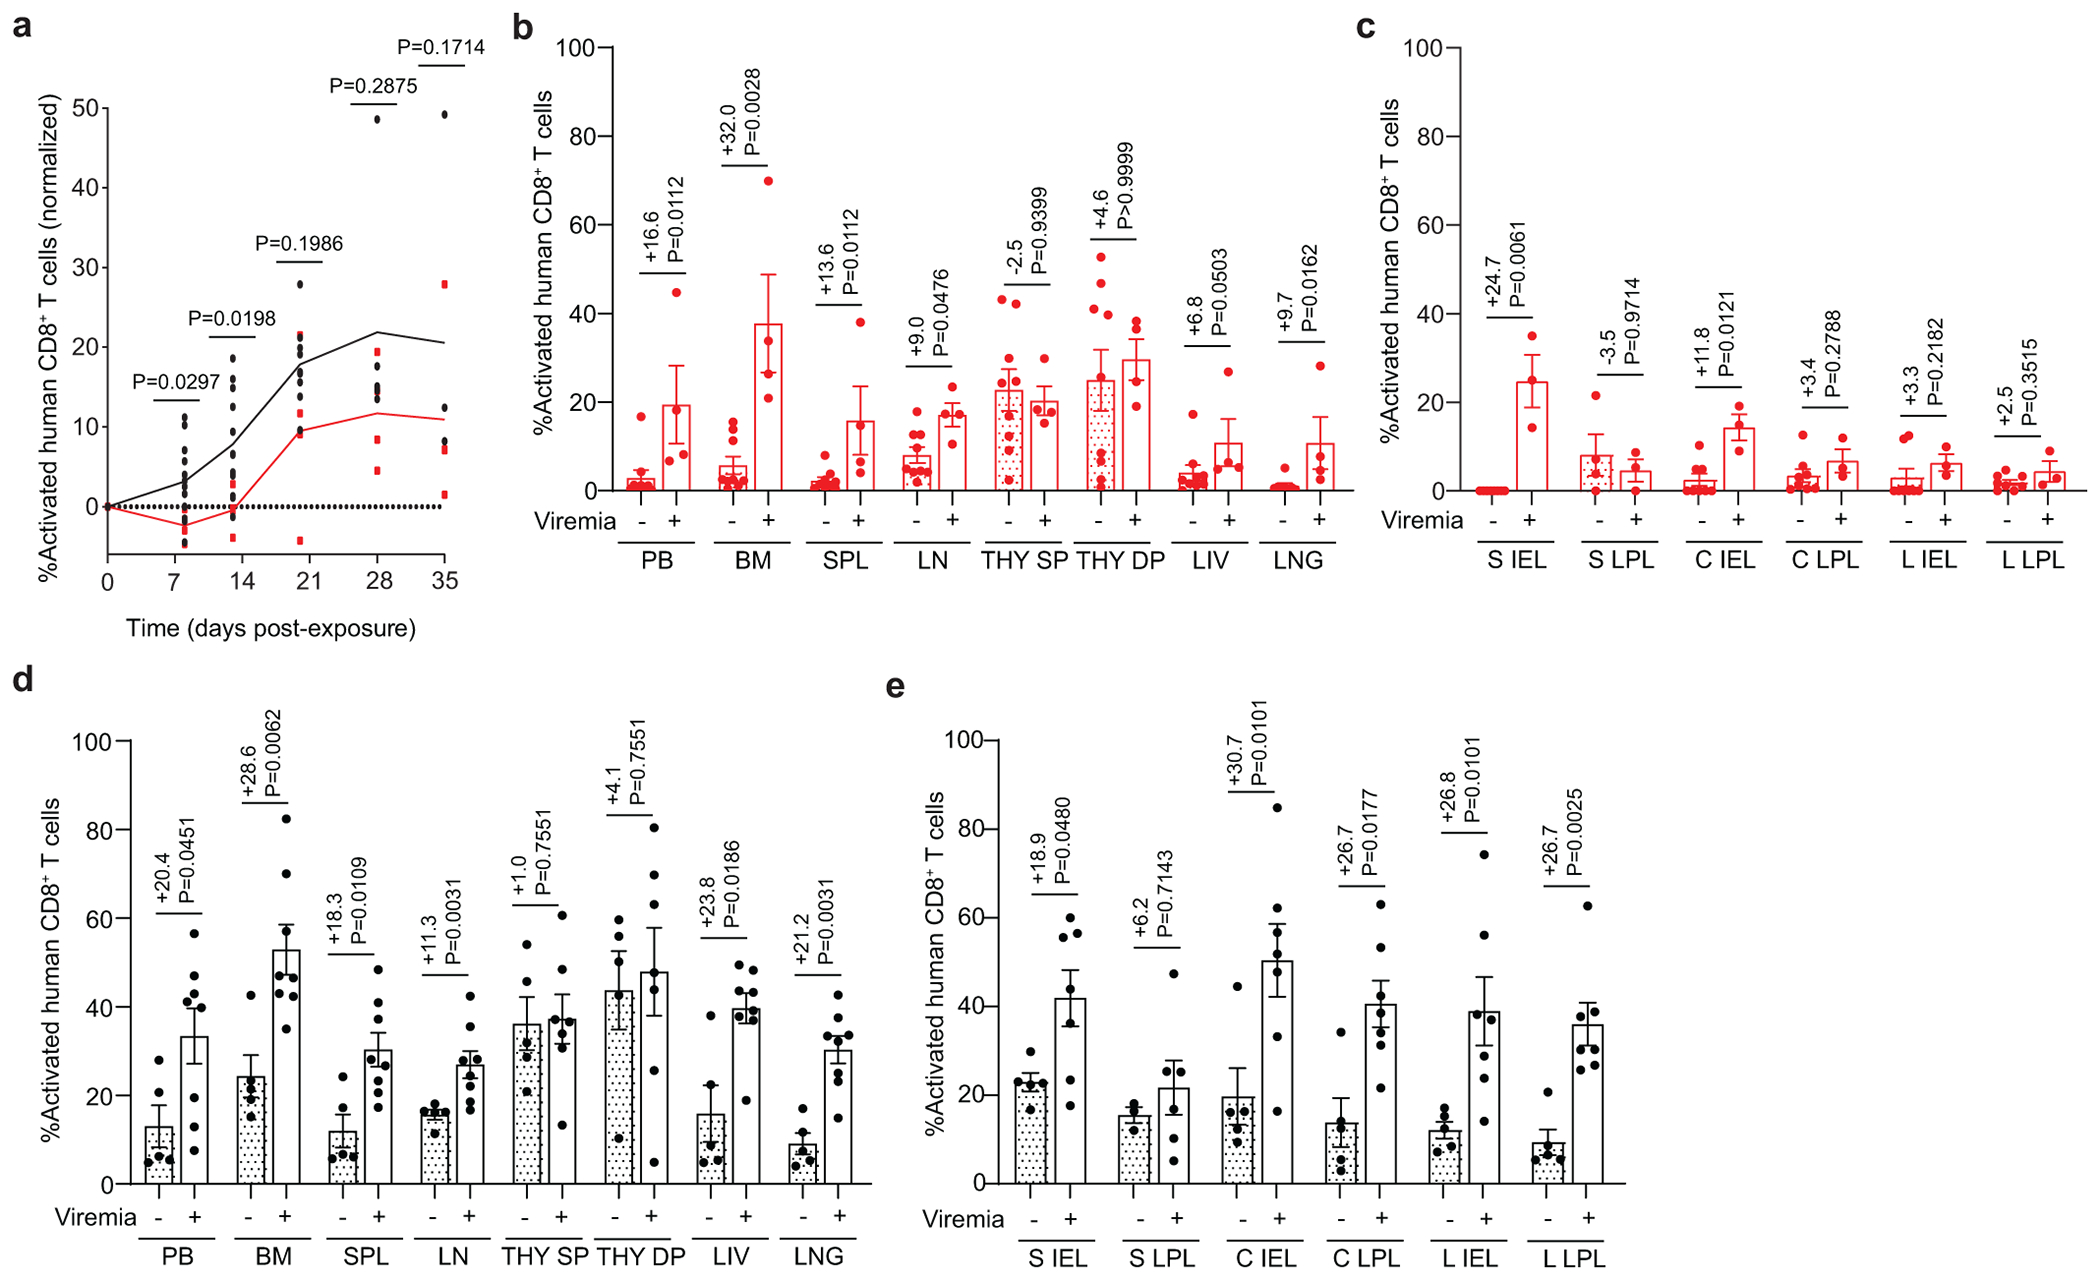
Flow cytometric analysis of a, activated (HLA-DR+CD38+) human CD8+ T cells of viremic GF-BLT (red) and CV-BLT (black) mice at day 8 (GF, n=4; CV n=12), day 13 (GF, n=4; CV n=12), day 20 (GF, n=4; CV n=9), day 28 (GF, n=4; CV n=5) and day 35 (GF, n=4; CV n=4) post rectal HIV acquisition. Percent activated human CD8+ T cells in the b, PB, bone marrow (BM), spleen (SPL), lymph nodes (LN), human thymic organoid (THY), liver (LIV), and lung (LNG) as well as the c, small intestine (S), cecum (C), and large intestine (L) intraepithelial layer (IEL) and lamina propria layer (LPL) of aviremic (filled bars) and viremic (open bars) GF-BLT mice. Aviremic GF-BLT mice, n=9 (PB, BM, SPL, LN, THY, LIV), n=8 (LNG, S IEL, C IEL, C LPL, L IEL, L LPL), or n=4 (S LPL). Viremic GF-BLT mice, n=4 (PB, BM, SPL, LN, THY, LIV, LNG) or n=3 (S IEL, S LPL, C IEL, C LPL, L IEL, L LPL). Percent activated human CD8+ T cells in the d, PB, BM, SPL, LN, THY, LIV, and LNG as well as the e, S IEL, S LPL, C IEL, C LPL, L IEL, and L LPL of aviremic (filled bars) and viremic (open bars) CV-BLT mice. Aviremic CV-BLT mice, n=5 (PB, BM, SPL, LN, THY, LIV, LNG, S IEL, C IEL, C LPL, L IEL, L LPL), n=3 (S LPL). Viremic CV-BLT mice, n=8 (PB, BM, SPL, LN, LIV, LNG), n=7 (S IEL, C IEL, C LPL, L IEL, L LPL), or n=6 (THY, S LPL). SP, CD8+ single positive thymocyte. DP, CD4+CD8+ double positive thymocyte. b-e, Shown is the difference in percent activated CD8+ T cells between viremic and aviremic mice. Horizontal and vertical lines represent the mean and standard error mean respectively. a-e, Cell levels mice were compared with a two-sided Mann-Whitney test.
Extended Data Fig. 6. HIV infection mediated CD4+ T cell depletion is not impacted by the presence of resident microbiota.
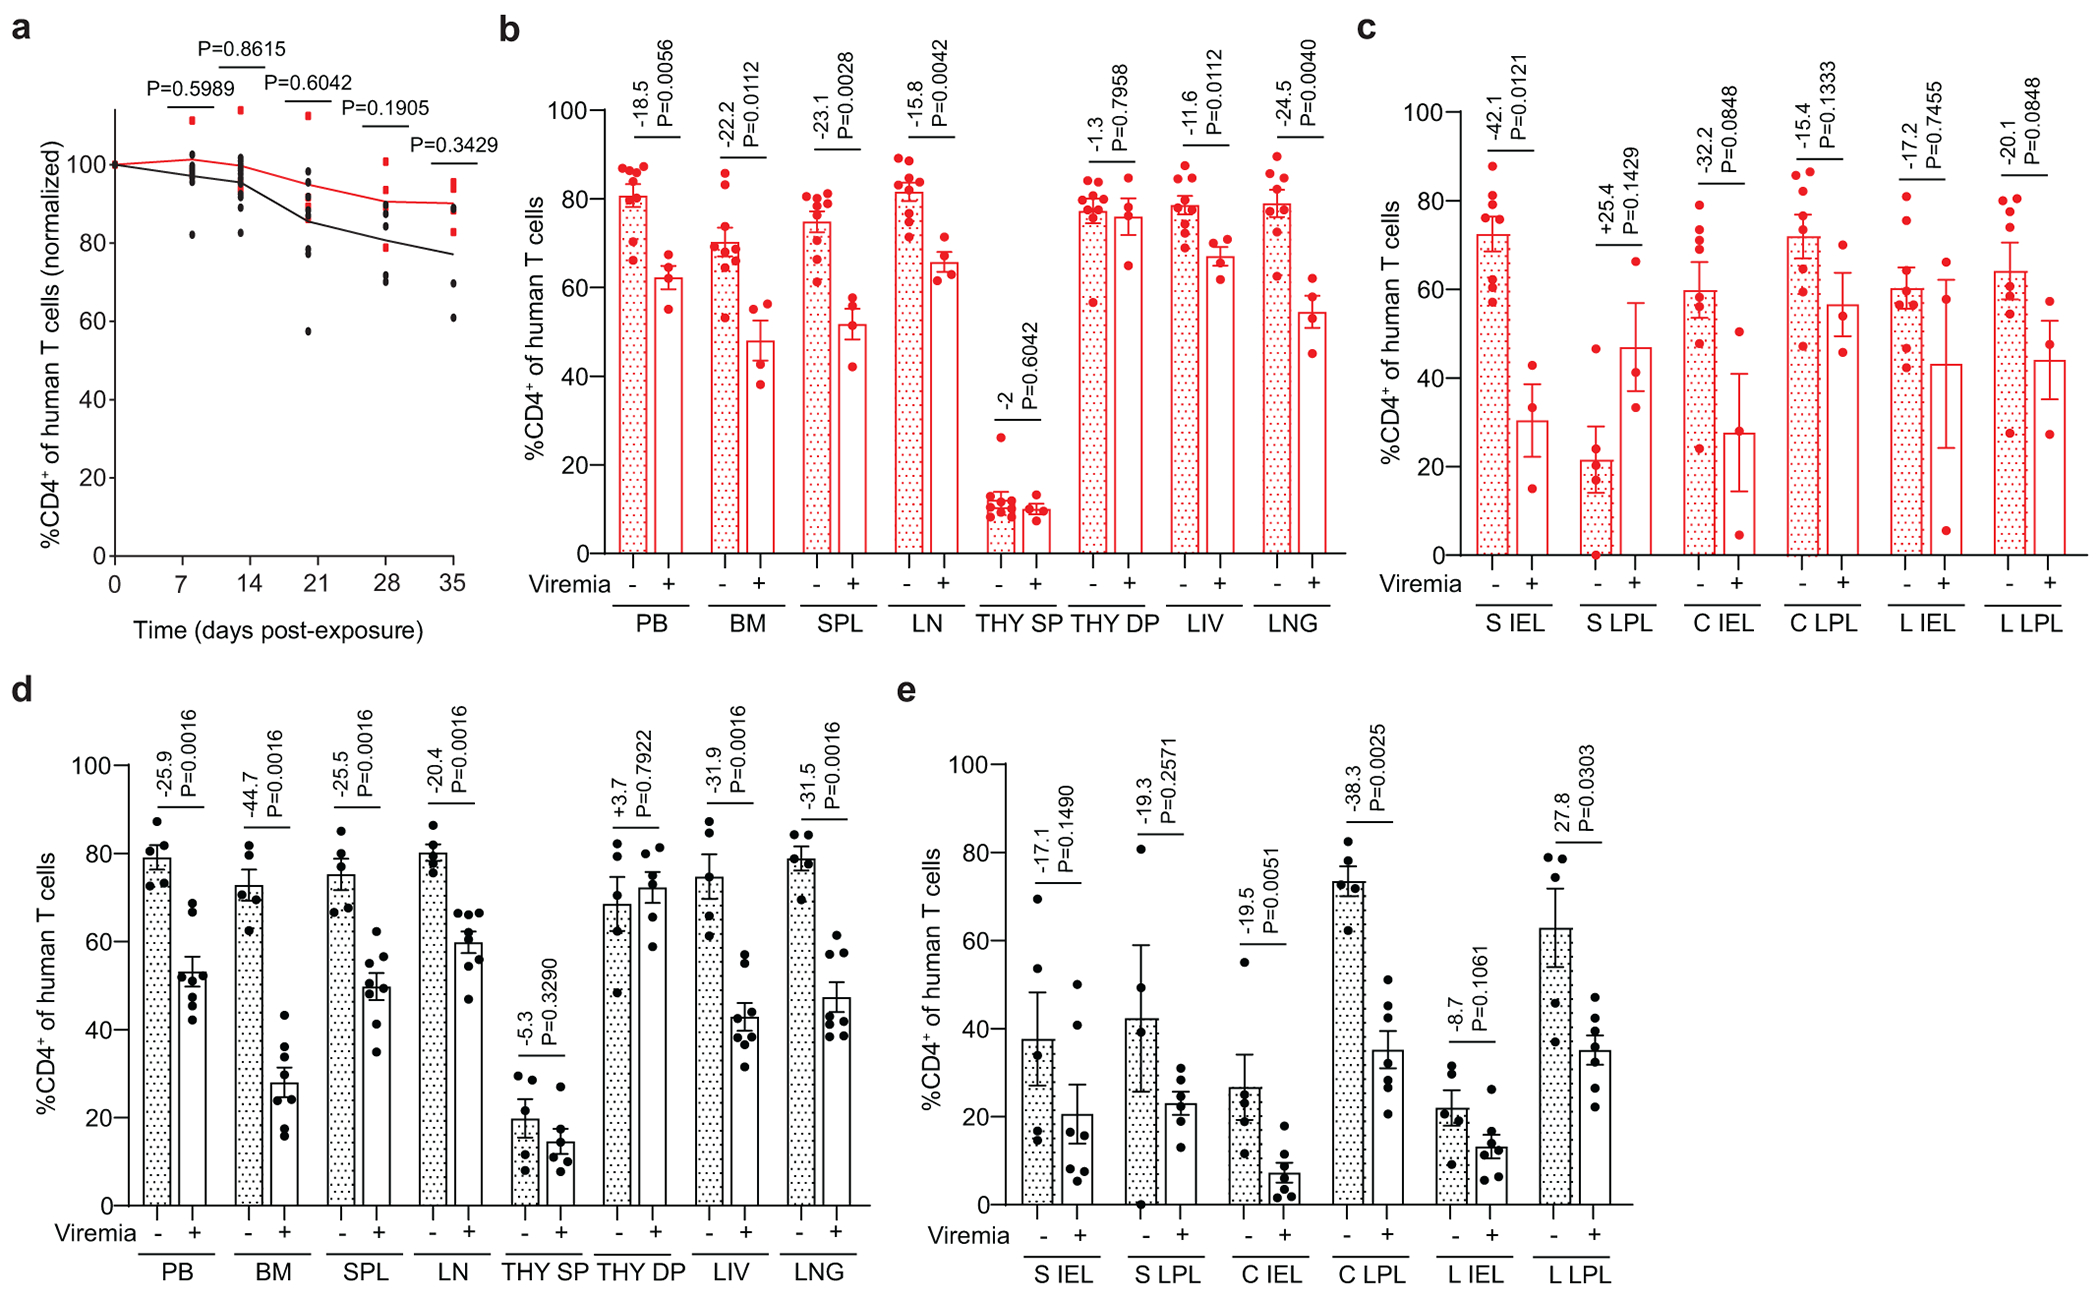
Flow cytometric analysis of a, human CD4+ T cells in the peripheral blood (PB) of viremic GF-BLT (red) and CV-BLT (black) mice at day 8 (GF, n=4; CV n=12), day 13 (GF, n=4; CV n=12), day 20 (GF, n=4; CV n=9), day 28 (GF, n=4; CV n=5) and day 35 (GF, n=4; CV n=4) post rectal HIV acquisition. Percent CD4+ of human T cells in the b, PB, bone marrow (BM), spleen (SPL), lymph nodes (LN), human thymic organoid (THY), liver (LIV), and lung (LNG) as well as the c, small intestine (S), cecum (C), and large intestine (L) intraepithelial layer (IEL) and lamina propria layer (LPL) of aviremic (filled bars) and viremic (open bars) GF-BLT mice. Aviremic GF-BLT mice, n=9 (PB, BM, SPL, LN, THY, LIV), n=8 (LNG, S IEL, C IEL, C LPL, L IEL, L LPL), or n=5 (S LPL). Viremic GF-BLT mice, n=4 (PB, BM, SPL, LN, THY, LIV, LNG) or n=3 (S IEL, S LPL, C IEL, C LPL, L IEL, L LPL). Percent CD4+ of human T cells in the d, PB, BM, SPL, LN, THY, LIV, and LNG as well as the e, S IEL, S LPL, C IEL, C LPL, L IEL, and L LPL of aviremic (filled bars) and viremic (open bars) CV-BLT mice. Aviremic CV-BLT mice, n=5 (PB, BM, SPL, LN, THY, LIV, LNG, S IEL, C IEL, C LPL, L IEL, L LPL), n=4 (S LPL). Viremic CV-BLT mice, n=8 (PB, BM, SPL, LN, LIV, LNG), n=7 (S IEL, C IEL, C LPL, L IEL, L LPL), or n=6 (THY, S LPL). SP, CD4+ single positive thymocyte. DP, CD4+CD8+ double positive thymocyte. b-e, Shown is the difference in percent CD4+ T cells between viremic and avirmic mice. Horizontal and vertical lines represent the mean and standard error mean respectively. a-e, Cell levels mice were compared with a two-sided Mann-Whitney test.
Extended Data Fig. 7. Minimal impact of resident microbiota on human CD4+ T cell homeostasis in the peripheral blood and non-intestinal tissues.
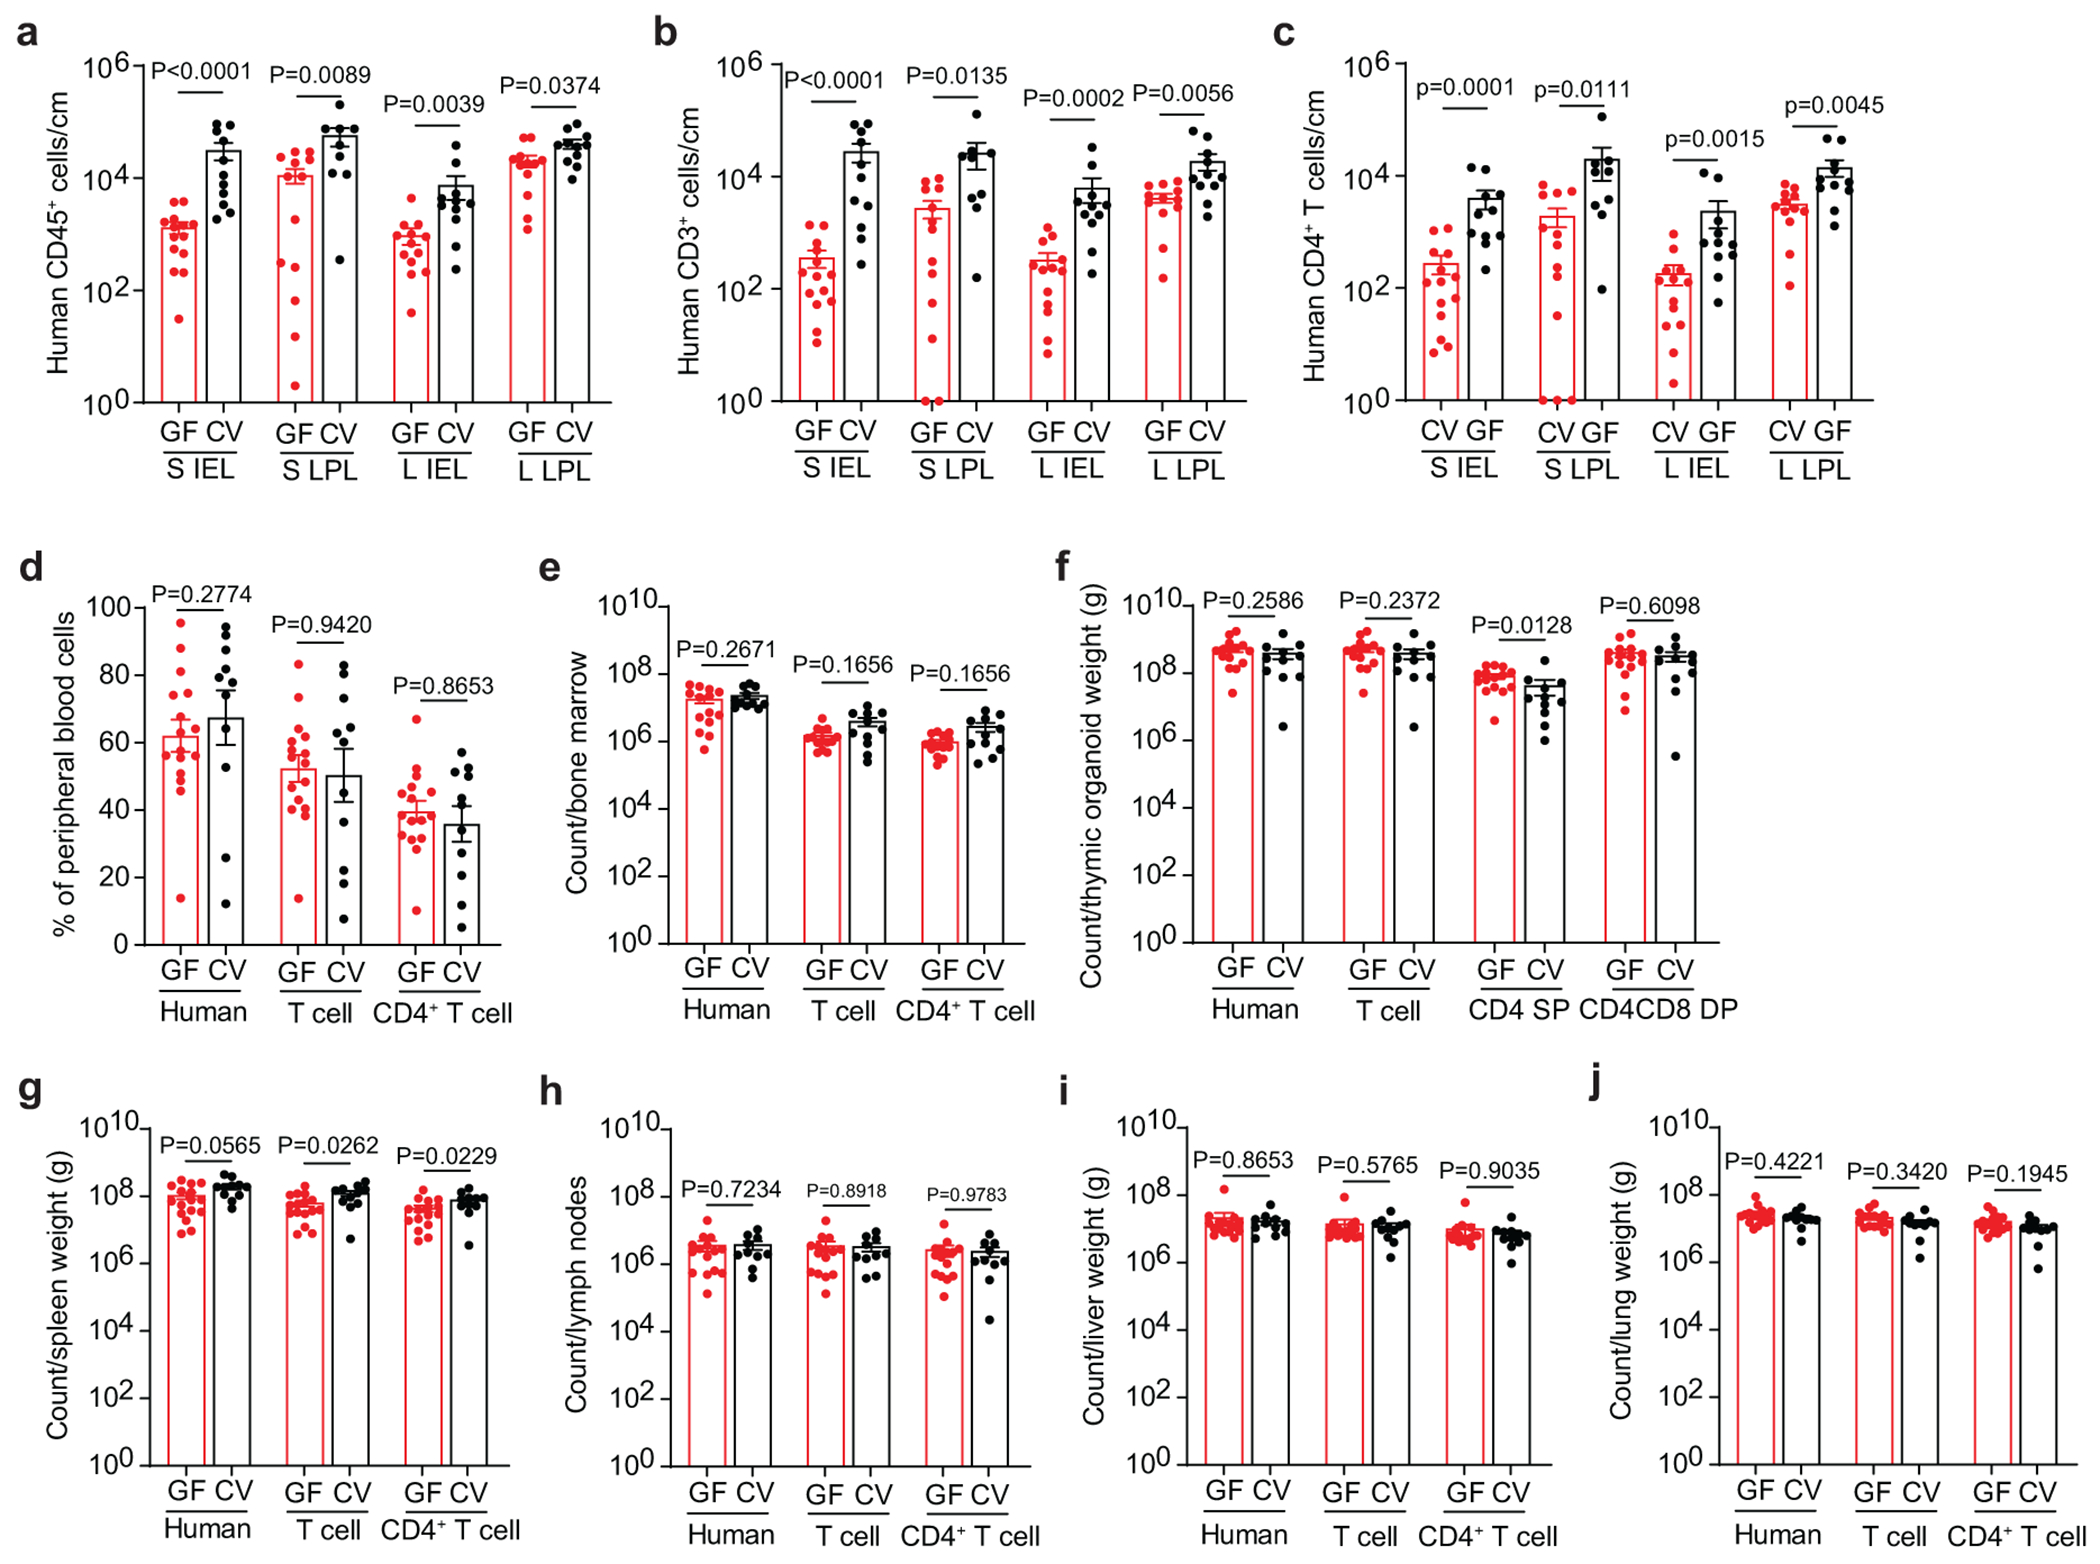
Numbers of a, human hematopoietic cells (hCD45+), including b, T cells (hCD3+) and c, CD4+ T cells in the small intestine (S) and large intestine (L) intraepithelial (IEL) and lamina propria (LPL) layers of GF-BLT mice (GF; red bars; S IEL, n=14; S LPL, n=13; L IEL, n=13; L LPL, n=12) and CV-BLT mice (CV; black; S IEL, n=11; S LPL, n=9; L IEL, n=11; L LPL, n=11) were determined by flow cytometric analysis. Flow cytometric analysis of human hematopoietic cells (hCD45+) including T cells (hCD3+) and CD4+ T cells in the d, peripheral blood (GF, n=16; CV, n=11), e, bone marrow (GF, n=14; CV, n=11), f, thymic organoid (GF, n=15; CV, n=11), g, spleen (GF, n=16; CV, n=11), h, lymph nodes (GF, n=15; CV, n=10), i, liver (GF, n=16; CV, n=11), and j, lung (GF, n=16; CV, n=11) of GF-BLT (GF; red boxes) and CV-BLT (CV; black boxes). Cell counts are normalized to a-c, tissue length (cm) or f, g, i, j, weight (g). SP, CD4+ single positive thymocyte. DP, CD4+CD8+ double positive thymocyte. Horizontal and vertical lines represent the mean and standard error mean respectively. Cell levels between GF-BLT and CV-BLT mice were compared with a two-sided Mann-Whitney test. a and b, The exact p values shown as P<0.0001 for comparisons of human CD45+ and CD3+ T cell numbers in the S IEL are P=0.000020 and P=0.000043 respectively.
Extended Data Fig. 8. Resident microbiota regulate human CD8+ T cell homeostasis in the intestinal tract.
Levels of human a-c, B cells, d-f, myeloid cells, and g-i, CD8+ T cells in the peripheral blood (GF, n=15; CV, n=11), bone marrow (BM; GF, n=14; CV, n=11), thymic organoid (THY; GF, n=15; CV, n=11), spleen (SPL; GF, n=16; CV, n=11), lymph nodes (LN; GF, n=15; CV, n=10), liver (LIV; GF, n=16; CV, n=11), lung (LNG; GF, n=16; CV, n=11) and the small intestine (S), cecum (C), and large intestine (L) intraepithelial layer (IEL; GF, n=13; CV, n=11) and lamina propria layer (LPL; GF S LPL, n=13; CV S LPL, n=9 CV-BLT; GF C LPL, n=14; CV CLPL, n=11; GF LPL, n=12; CV LPL, n=11) of GF-BLT (GF, red boxes) and CV-BLT mice (CV, black boxes). Horizontal and vertical lines represent the mean and standard error mean respectively. Cell levels between GF-BLT and CV-BLT mice were compared with a two-sided Mann-Whitney test. e and i, The exact p values shown as P<0.0001 for comparisons of human myeloid cell numbers in the SPL and human CD8+ T cell numbers in the S IEL and L IEL are P=0.000041, P=0.000020, and P=0.000077 respectively.
Supplementary Material
Acknowledgements:
The authors thank current and former members of the Garcia and Wahl laboratories for technical assistance and technicians at the UNC National Gnotobiotic Rodent Resource Center, Microbiome Core Facility, Division of Comparative Medicine, and Animal Histopathology and Clinical Chemistry Core for technical support. We also thank Drs. M. Kane, S. Lemon, J. Turpin, and N. Raab-Traub for helpful comments and discussions. Fig. 1a was created with BioRender.com.
Funding:
This work was supported by funding from the National Institutes of Health (NIH) grants AI123010 (A.W.), DK131585 (A.W./J.V.G/R.B.S), 1UM1AI126619 (current award 1UM1AI164567) (J.V.G), P40OD010995 (R.B.S/A.R.R.), P30DK034987 (R.B.S), U19AI082637 (I.M.), FIC D43TW009532 (J.D.T). The UNC CFAR Biostatistics Core is supported by NIH funded program P30AI050410. The UNC Animal Histopathology & Clinical Chemistry is supported in part by an NCI Center Core Support Grant (5P30CA016080-42). The UNC Microbiome Core is funded in part by the Center for Gastrointestinal Biology and Disease (P30 DK034987) and the UNC Nutrition Obesity Research Center (P30 DK056350).
Footnotes
Competing interests: The authors declare no competing interests.
Data availability:
Source data for Figs 1–5 and Extended Data Figs. 1–8 are provided with the manuscript.
References
- 1.Brestoff JR & Artis D Commensal bacteria at the interface of host metabolism and the immune system. Nat Immunol 14, 676–684 (2013). [DOI] [PMC free article] [PubMed] [Google Scholar]
- 2.Chung H. et al. Gut immune maturation depends on colonization with a host-specific microbiota. Cell 149, 1578–1593 (2012). [DOI] [PMC free article] [PubMed] [Google Scholar]
- 3.Robinson CM & Pfeiffer JK Viruses and the Microbiota. Annu Rev Virol 1, 55–69 (2014). [DOI] [PMC free article] [PubMed] [Google Scholar]
- 4.Ubeda C, Djukovic A & Isaac S Roles of the intestinal microbiota in pathogen protection. Clin Transl Immunology 6, e128 (2017). [DOI] [PMC free article] [PubMed] [Google Scholar]
- 5.Baldridge MT et al. Commensal microbes and interferon-lambda determine persistence of enteric murine norovirus infection. Science 347, 266–269 (2015). [DOI] [PMC free article] [PubMed] [Google Scholar]
- 6.Cortez V. et al. Astrovirus infects actively secreting goblet cells and alters the gut mucus barrier. Nat Commun 11, 2097 (2020). [DOI] [PMC free article] [PubMed] [Google Scholar]
- 7.Robinson CM, Jesudhasan PR & Pfeiffer JK Bacterial lipopolysaccharide binding enhances virion stability and promotes environmental fitness of an enteric virus. Cell host & microbe 15, 36–46 (2014). [DOI] [PMC free article] [PubMed] [Google Scholar]
- 8.Jones MK et al. Enteric bacteria promote human and mouse norovirus infection of B cells. Science 346, 755–759 (2014). [DOI] [PMC free article] [PubMed] [Google Scholar]
- 9.Kane M. et al. Successful transmission of a retrovirus depends on the commensal microbiota. Science 334, 245–249 (2011). [DOI] [PMC free article] [PubMed] [Google Scholar]
- 10.Kuss SK et al. Intestinal microbiota promote enteric virus replication and systemic pathogenesis. Science 334, 249–252 (2011). [DOI] [PMC free article] [PubMed] [Google Scholar]
- 11.Wilks J & Golovkina T Influence of microbiota on viral infections. PLoS pathogens 8, e1002681 (2012). [DOI] [PMC free article] [PubMed] [Google Scholar]
- 12.Ponte R et al. Reversing Gut Damage in HIV Infection: Using Non-Human Primate Models to Instruct Clinical Research. EBioMedicine 4, 40–49 (2016). [DOI] [PMC free article] [PubMed] [Google Scholar]
- 13.Kennedy EA, King KY & Baldridge MT Mouse Microbiota Models: Comparing Germ-Free Mice and Antibiotics Treatment as Tools for Modifying Gut Bacteria. Front Physiol 9, 1534 (2018). [DOI] [PMC free article] [PubMed] [Google Scholar]
- 14.Odumade OA, Hogquist KA & Balfour HH Jr. Progress and problems in understanding and managing primary Epstein-Barr virus infections. Clin Microbiol Rev 24, 193–209 (2011). [DOI] [PMC free article] [PubMed] [Google Scholar]
- 15.MacMahon EM et al. Epstein-Barr virus in AIDS-related primary central nervous system lymphoma. Lancet 338, 969–973 (1991). [DOI] [PubMed] [Google Scholar]
- 16.Zhang L et al. Interferon regulatory factor 7 is associated with Epstein-Barr virus-transformed central nervous system lymphoma and has oncogenic properties. Journal of virology 78, 12987–12995 (2004). [DOI] [PMC free article] [PubMed] [Google Scholar]
- 17.Raab-Traub N Epstein-Barr virus and nasopharyngeal carcinoma. Semin Cancer Biol 3, 297–307 (1992). [PubMed] [Google Scholar]
- 18.zur Hausen H et al. EBV DNA in biopsies of Burkitt tumours and anaplastic carcinomas of the nasopharynx. Nature 228, 1056–1058 (1970). [DOI] [PubMed] [Google Scholar]
- 19.Weiss LM, Movahed LA, Warnke RA & Sklar J Detection of Epstein-Barr viral genomes in Reed-Sternberg cells of Hodgkin’s disease. N Engl J Med 320, 502–506 (1989). [DOI] [PubMed] [Google Scholar]
- 20.Cohen JI, Fauci AS, Varmus H & Nabel GJ Epstein-Barr virus: an important vaccine target for cancer prevention. Sci Transl Med 3, 107fs107 (2011). [DOI] [PMC free article] [PubMed] [Google Scholar]
- 21.UNAIDS. UNAIDS DATA 2021. https://www.unaids.org/sites/default/files/media_asset/JC3032_AIDS_Data_book_2021_En.pdf (2021).
- 22.Brenchley JM & Douek DC HIV infection and the gastrointestinal immune system. Mucosal immunology 1, 23–30 (2008). [DOI] [PMC free article] [PubMed] [Google Scholar]
- 23.Brenchley JM et al. Microbial translocation is a cause of systemic immune activation in chronic HIV infection. Nature medicine 12, 1365–1371 (2006). [DOI] [PubMed] [Google Scholar]
- 24.Dillon SM et al. An altered intestinal mucosal microbiome in HIV-1 infection is associated with mucosal and systemic immune activation and endotoxemia. Mucosal immunology 7, 983–994 (2014). [DOI] [PMC free article] [PubMed] [Google Scholar]
- 25.Guadalupe M et al. Severe CD4+ T-cell depletion in gut lymphoid tissue during primary human immunodeficiency virus type 1 infection and substantial delay in restoration following highly active antiretroviral therapy. Journal of virology 77, 11708–11717 (2003). [DOI] [PMC free article] [PubMed] [Google Scholar]
- 26.Mutlu EA et al. A compositional look at the human gastrointestinal microbiome and immune activation parameters in HIV infected subjects. PLoS pathogens 10, e1003829 (2014). [DOI] [PMC free article] [PubMed] [Google Scholar]
- 27.Estes JD et al. Defining total-body AIDS-virus burden with implications for curative strategies. Nature medicine 23, 1271–1276 (2017). [DOI] [PMC free article] [PubMed] [Google Scholar]
- 28.Busman-Sahay K, Starke CE, Nekorchuk MD & Estes JD Eliminating HIV reservoirs for a cure: the issue is in the tissue. Curr Opin HIV AIDS 16, 200–208 (2021). [DOI] [PMC free article] [PubMed] [Google Scholar]
- 29.Rogala AR, Oka A & Sartor RB Strategies to Dissect Host-Microbial Immune Interactions That Determine Mucosal Homeostasis vs. Intestinal Inflammation in Gnotobiotic Mice. Front Immunol 11, 214 (2020). [DOI] [PMC free article] [PubMed] [Google Scholar]
- 30.Murer A et al. MicroRNAs of Epstein-Barr Virus Attenuate T-Cell-Mediated Immune Control In Vivo. mBio 10, e01941–18 (2019). [DOI] [PMC free article] [PubMed] [Google Scholar]
- 31.Antsiferova O et al. Adoptive transfer of EBV specific CD8+ T cell clones can transiently control EBV infection in humanized mice. PLoS pathogens 10, e1004333 (2014). [DOI] [PMC free article] [PubMed] [Google Scholar]
- 32.Pender MP, Csurhes PA, Pfluger CM & Burrows SR CD8 T cell deficiency impairs control of Epstein--Barr virus and worsens with age in multiple sclerosis. J Neurol Neurosurg Psychiatry 83, 353–354 (2012). [DOI] [PMC free article] [PubMed] [Google Scholar]
- 33.Kovarova M et al. HIV pre-exposure prophylaxis for women and infants prevents vaginal and oral HIV transmission in a preclinical model of HIV infection. J Antimicrob Chemother 71, 3185–3194 (2016). [DOI] [PMC free article] [PubMed] [Google Scholar]
- 34.Wahl A et al. Breast Milk of HIV-Positive Mothers Has Potent and Species-Specific In Vivo HIV-Inhibitory Activity. Journal of virology 89, 10868–10878 (2015). [DOI] [PMC free article] [PubMed] [Google Scholar]
- 35.Wahl A et al. Human Breast Milk and Antiretrovirals Dramatically Reduce Oral HIV-1 Transmission in BLT Humanized Mice. PLoS pathogens 8, e1002732 (2012). [DOI] [PMC free article] [PubMed] [Google Scholar]
- 36.Chateau ML, Denton PW, Swanson MD, McGowan I & Garcia JV Rectal transmission of transmitted/founder HIV-1 is efficiently prevented by topical 1% tenofovir in BLT humanized mice. PLoS One 8, e60024 (2013). [DOI] [PMC free article] [PubMed] [Google Scholar]
- 37.Ochsenbauer C et al. Generation of transmitted/founder HIV-1 infectious molecular clones and characterization of their replication capacity in CD4 T lymphocytes and monocyte-derived macrophages. Journal of virology 86, 2715–2728 (2012). [DOI] [PMC free article] [PubMed] [Google Scholar]
- 38.Sender R, Fuchs S & Milo R Revised Estimates for the Number of Human and Bacteria Cells in the Body. PLoS Biol 14, e1002533 (2016). [DOI] [PMC free article] [PubMed] [Google Scholar]
- 39.Doolittle JM & Webster-Cyriaque J Polymicrobial infection and bacterium-mediated epigenetic modification of DNA tumor viruses contribute to pathogenesis. mBio 5, e01015–01014 (2014). [DOI] [PMC free article] [PubMed] [Google Scholar]
- 40.Imai K et al. The periodontal pathogen Porphyromonas gingivalis induces the Epstein-Barr virus lytic switch transactivator ZEBRA by histone modification. Biochimie 94, 839–846 (2012). [DOI] [PubMed] [Google Scholar]
- 41.Westphal EM, Blackstock W, Feng W, Israel B & Kenney SC Activation of lytic Epstein-Barr virus (EBV) infection by radiation and sodium butyrate in vitro and in vivo: a potential method for treating EBV-positive malignancies. Cancer Res 60, 5781–5788 (2000). [PubMed] [Google Scholar]
- 42.Westphal EM et al. Induction of lytic Epstein-Barr virus (EBV) infection in EBV-associated malignancies using adenovirus vectors in vitro and in vivo. Cancer Res 59, 1485–1491 (1999). [PubMed] [Google Scholar]
- 43.Chien YC et al. Serologic markers of Epstein-Barr virus infection and nasopharyngeal carcinoma in Taiwanese men. N Engl J Med 345, 1877–1882 (2001). [DOI] [PubMed] [Google Scholar]
- 44.Wen Y, Xu H, Han J, Jin R & Chen H How Does Epstein-Barr Virus Interact With Other Microbiomes in EBV-Driven Cancers? Front Cell Infect Microbiol 12, 852066 (2022). [DOI] [PMC free article] [PubMed] [Google Scholar]
- 45.Kashyap D, Baral B, Jakhmola S, Singh AK & Jha HC Helicobacter pylori and Epstein-Barr Virus Coinfection Stimulates Aggressiveness in Gastric Cancer through the Regulation of Gankyrin. mSphere 6, e0075121 (2021). [DOI] [PMC free article] [PubMed] [Google Scholar]
- 46.Walter BL et al. Role of low CD4 levels in the influence of human immunodeficiency virus type 1 envelope V1 and V2 regions on entry and spread in macrophages. Journal of virology 79, 4828–4837 (2005). [DOI] [PMC free article] [PubMed] [Google Scholar]
- 47.de Roda Husman AM, Blaak H, Brouwer M & Schuitemaker H CC chemokine receptor 5 cell-surface expression in relation to CC chemokine receptor 5 genotype and the clinical course of HIV-1 infection. J Immunol 163, 4597–4603 (1999). [PubMed] [Google Scholar]
- 48.Reynes J et al. CD4+ T cell surface CCR5 density as a determining factor of virus load in persons infected with human immunodeficiency virus type 1. J Infect Dis 181, 927–932 (2000). [DOI] [PubMed] [Google Scholar]
- 49.Ostrowski MA et al. Expression of chemokine receptors CXCR4 and CCR5 in HIV-1-infected and uninfected individuals. J Immunol 161, 3195–3201 (1998). [PubMed] [Google Scholar]
- 50.Reynes J et al. CD4 T cell surface CCR5 density as a host factor in HIV-1 disease progression. AIDS 15, 1627–1634 (2001). [DOI] [PubMed] [Google Scholar]
- 51.Yang X et al. High CCR5 density on central memory CD4+ T cells in acute HIV-1 infection is mostly associated with rapid disease progression. PLoS One 7, e49526 (2012). [DOI] [PMC free article] [PubMed] [Google Scholar]
- 52.Meijerink H et al. The number of CCR5 expressing CD4+ T lymphocytes is lower in HIV-infected long-term non-progressors with viral control compared to normal progressors: a cross-sectional study. BMC Infect Dis 14, 683 (2014). [DOI] [PMC free article] [PubMed] [Google Scholar]
- 53.Weissman D et al. Interleukin-2 up-regulates expression of the human immunodeficiency virus fusion coreceptor CCR5 by CD4+ lymphocytes in vivo. J Infect Dis 181, 933–938 (2000). [DOI] [PubMed] [Google Scholar]
- 54.Yang YF et al. IL-12 as well as IL-2 upregulates CCR5 expression on T cell receptor-triggered human CD4+ and CD8+ T cells. J Clin Immunol 21, 116–125 (2001). [DOI] [PubMed] [Google Scholar]
- 55.Valentin A. et al. Dual effect of interleukin 4 on HIV-1 expression: implications for viral phenotypic switch and disease progression. Proc Natl Acad Sci U S A 95, 8886–8891 (1998). [DOI] [PMC free article] [PubMed] [Google Scholar]
- 56.Patterson BK et al. Regulation of CCR5 and CXCR4 expression by type 1 and type 2 cytokines: CCR5 expression is downregulated by IL-10 in CD4-positive lymphocytes. Clin Immunol 91, 254–262 (1999). [DOI] [PubMed] [Google Scholar]
- 57.Claireaux M. et al. Low CCR5 expression protects HIV-specific CD4+ T cells of elite controllers from viral entry. Nat Commun 13, 521 (2022). [DOI] [PMC free article] [PubMed] [Google Scholar]
- 58.McBrien JB et al. Robust and persistent reactivation of SIV and HIV by N-803 and depletion of CD8(+) cells. Nature 578, 154–159 (2020). [DOI] [PMC free article] [PubMed] [Google Scholar]
- 59.Nixon CC et al. Systemic HIV and SIV latency reversal via non-canonical NF-kappaB signalling in vivo. Nature 578, 160–165 (2020). [DOI] [PMC free article] [PubMed] [Google Scholar]
- 60.Denton PW et al. Systemic administration of antiretrovirals prior to exposure prevents rectal and intravenous HIV-1 transmission in humanized BLT mice. PLoS One 5, e8829 (2010). [DOI] [PMC free article] [PubMed] [Google Scholar]
- 61.Denton PW et al. One percent tenofovir applied topically to humanized BLT mice and used according to the CAPRISA 004 experimental design demonstrates partial protection from vaginal HIV infection, validating the BLT model for evaluation of new microbicide candidates. Journal of virology 85, 7582–7593 (2011). [DOI] [PMC free article] [PubMed] [Google Scholar]
- 62.Wahl A et al. Predicting HIV Pre-exposure Prophylaxis Efficacy for Women using a Preclinical Pharmacokinetic-Pharmacodynamic In Vivo Model. Sci Rep 7, 41098 (2017). [DOI] [PMC free article] [PubMed] [Google Scholar]
- 63.Hayes CL et al. Commensal microbiota induces colonic barrier structure and functions that contribute to homeostasis. Sci Rep 8, 14184 (2018). [DOI] [PMC free article] [PubMed] [Google Scholar]
- 64.Smith PM & Garrett WS The gut microbiota and mucosal T cells. Front Microbiol 2, 111 (2011). [DOI] [PMC free article] [PubMed] [Google Scholar]
- 65.Round JL & Mazmanian SK The gut microbiota shapes intestinal immune responses during health and disease. Nat Rev Immunol 9, 313–323 (2009). [DOI] [PMC free article] [PubMed] [Google Scholar]
- 66.Niess JH & Adler G Enteric flora expands gut lamina propria CX3CR1+ dendritic cells supporting inflammatory immune responses under normal and inflammatory conditions. J Immunol 184, 2026–2037 (2010). [DOI] [PubMed] [Google Scholar]
- 67.Umesaki Y, Setoyama H, Matsumoto S & Okada Y Expansion of alpha beta T-cell receptor-bearing intestinal intraepithelial lymphocytes after microbial colonization in germ-free mice and its independence from thymus. Immunology 79, 32–37 (1993). [PMC free article] [PubMed] [Google Scholar]
- 68.Macpherson AJ & Harris NL Interactions between commensal intestinal bacteria and the immune system. Nat Rev Immunol 4, 478–485 (2004). [DOI] [PubMed] [Google Scholar]
- 69.Kernbauer E, Ding Y & Cadwell K An enteric virus can replace the beneficial function of commensal bacteria. Nature 516, 94–98 (2014). [DOI] [PMC free article] [PubMed] [Google Scholar]
- 70.Krych L, Hansen CH, Hansen AK, van den Berg FW & Nielsen DS Quantitatively different, yet qualitatively alike: a meta-analysis of the mouse core gut microbiome with a view towards the human gut microbiome. PLoS One 8, e62578 (2013). [DOI] [PMC free article] [PubMed] [Google Scholar]
- 71.Park JC & Im SH Of men in mice: the development and application of a humanized gnotobiotic mouse model for microbiome therapeutics. Exp Mol Med 52, 1383–1396 (2020). [DOI] [PMC free article] [PubMed] [Google Scholar]
- 72.Ivanov II et al. Induction of intestinal Th17 cells by segmented filamentous bacteria. Cell 139, 485–498 (2009). [DOI] [PMC free article] [PubMed] [Google Scholar]
- 73.Alameddine J et al. Faecalibacterium prausnitzii Skews Human DC to Prime IL10-Producing T Cells Through TLR2/6/JNK Signaling and IL-10, IL-27, CD39, and IDO-1 Induction. Front Immunol 10, 143 (2019). [DOI] [PMC free article] [PubMed] [Google Scholar]
- 74.Daharsh L, Zhang J, Ramer-Tait A & Li Q A Double Humanized BLT-mice Model Featuring a Stable Human-Like Gut Microbiome and Human Immune System. J Vis Exp 150, 10.3791/59773 (2019). [DOI] [PMC free article] [PubMed] [Google Scholar]
- 75.Singh M et al. Minocycline attenuates HIV-1 infection and suppresses chronic immune activation in humanized NOD/LtsZ-scidIL-2Rgamma(null) mice. Immunology 142, 562–572 (2014). [DOI] [PMC free article] [PubMed] [Google Scholar]
- 76.Nahui Palomino RA et al. Extracellular vesicles from symbiotic vaginal lactobacilli inhibit HIV-1 infection of human tissues. Nat Commun 10, 5656 (2019). [DOI] [PMC free article] [PubMed] [Google Scholar]
- 77.Wahl A et al. Precision mouse models with expanded tropism for human pathogens. Nat Biotechnol 37, 1163–1173 (2019). [DOI] [PMC free article] [PubMed] [Google Scholar]
- 78.Wahl A et al. SARS-CoV-2 infection is effectively treated and prevented by EIDD-2801. Nature 591, 451–457 (2021). [DOI] [PMC free article] [PubMed] [Google Scholar]
- 79.Melkus MW et al. Humanized mice mount specific adaptive and innate immune responses to EBV and TSST-1. Nature medicine 12, 1316–1322 (2006). [DOI] [PubMed] [Google Scholar]
- 80.Akkina R et al. Small Animal Models for Human Immunodeficiency Virus (HIV), Hepatitis B, and Tuberculosis: Proceedings of an NIAID Workshop. Curr HIV Res 18, 19–28 (2020). [DOI] [PMC free article] [PubMed] [Google Scholar]
- 81.Council OD, Swanson MD, Spagnuolo RA, Wahl A & Garcia JV Role of Semen on Vaginal HIV-1 Transmission and Maraviroc Protection. Antimicrob Agents Chemother 59, 7847–7851 (2015). [DOI] [PMC free article] [PubMed] [Google Scholar]
- 82.Denton PW et al. Generation of HIV latency in humanized BLT mice. Journal of virology 86, 630–634 (2012). [DOI] [PMC free article] [PubMed] [Google Scholar]
- 83.Honeycutt JB et al. T cells establish and maintain CNS viral infection in HIV-infected humanized mice. J Clin Invest 128, 2862–2876 (2018). [DOI] [PMC free article] [PubMed] [Google Scholar]
- 84.Honeycutt JB et al. HIV-1 infection, response to treatment and establishment of viral latency in a novel humanized T cell-only mouse (TOM) model. Retrovirology 10, 121 (2013). [DOI] [PMC free article] [PubMed] [Google Scholar]
- 85.Honeycutt JB et al. Macrophages sustain HIV replication in vivo independently of T cells. J Clin Invest 126, 1353–1366 (2016). [DOI] [PMC free article] [PubMed] [Google Scholar]
- 86.Olesen R et al. ART influences HIV persistence in the female reproductive tract and cervicovaginal secretions. J Clin Invest 126, 892–904 (2016). [DOI] [PMC free article] [PubMed] [Google Scholar]
- 87.Shanmugasundaram U et al. Efficient Inhibition of HIV Replication in the Gastrointestinal and Female Reproductive Tracts of Humanized BLT Mice by EFdA. PLoS One 11, e0159517 (2016). [DOI] [PMC free article] [PubMed] [Google Scholar]
- 88.Sun Z et al. Intrarectal transmission, systemic infection, and CD4+ T cell depletion in humanized mice infected with HIV-1. J Exp Med 204, 705–714 (2007). [DOI] [PMC free article] [PubMed] [Google Scholar]
- 89.Wang LX et al. Humanized-BLT mouse model of Kaposi’s sarcoma-associated herpesvirus infection. Proc Natl Acad Sci U S A 111, 3146–3151 (2014). [DOI] [PMC free article] [PubMed] [Google Scholar]
Methods-only References
- 90.Packey CD et al. Molecular detection of bacterial contamination in gnotobiotic rodent units. Gut Microbes 4, 361–370 (2013). [DOI] [PMC free article] [PubMed] [Google Scholar]
- 91.Denton PW et al. IL-2 receptor gamma-chain molecule is critical for intestinal T-cell reconstitution in humanized mice. Mucosal immunology 5, 555–566 (2012). [DOI] [PMC free article] [PubMed] [Google Scholar]
- 92.Nochi T, Denton PW, Wahl A & Garcia JV Cryptopatches are essential for the development of human GALT. Cell Rep 3, 1874–1884 (2013). [DOI] [PMC free article] [PubMed] [Google Scholar]
- 93.Allali I et al. A comparison of sequencing platforms and bioinformatics pipelines for compositional analysis of the gut microbiome. BMC Microbiol 17, 194 (2017). [DOI] [PMC free article] [PubMed] [Google Scholar]
- 94.Azcarate-Peril MA et al. An Attenuated Salmonella enterica Serovar Typhimurium Strain and Galacto-Oligosaccharides Accelerate Clearance of Salmonella Infections in Poultry through Modifications to the Gut Microbiome. Appl Environ Microbiol 84, e02526–17 (2018). [DOI] [PMC free article] [PubMed] [Google Scholar]
- 95.Guadamuro L, Azcarate-Peril MA, Tojo R, Mayo B & Delgado S Use of high throughput amplicon sequencing and ethidium monoazide dye to track microbiota changes in an equol-producing menopausal woman receiving a long-term isoflavones treatment. AIMS Microbiol 5, 102–116 (2019). [DOI] [PMC free article] [PubMed] [Google Scholar]
- 96.Caporaso JG et al. Global patterns of 16S rRNA diversity at a depth of millions of sequences per sample. Proc Natl Acad Sci U S A 108 Suppl 1, 4516–4522 (2011). [DOI] [PMC free article] [PubMed] [Google Scholar]
- 97.Mohsen A, Park J, Chen YA, Kawashima H & Mizuguchi K Impact of quality trimming on the efficiency of reads joining and diversity analysis of Illumina paired-end reads in the context of QIIME1 and QIIME2 microbiome analysis frameworks. BMC Bioinformatics 20, 581 (2019). [DOI] [PMC free article] [PubMed] [Google Scholar]
- 98.Callahan BJ et al. DADA2: High-resolution sample inference from Illumina amplicon data. Nat Methods 13, 581–583 (2016). [DOI] [PMC free article] [PubMed] [Google Scholar]
- 99.Bokulich NA et al. Optimizing taxonomic classification of marker-gene amplicon sequences with QIIME 2’s q2-feature-classifier plugin. Microbiome 6, 90 (2018). [DOI] [PMC free article] [PubMed] [Google Scholar]
- 100.Delecluse HJ, Hilsendegen T, Pich D, Zeidler R & Hammerschmidt W Propagation and recovery of intact, infectious Epstein-Barr virus from prokaryotic to human cells. Proc Natl Acad Sci U S A 95, 8245–8250 (1998). [DOI] [PMC free article] [PubMed] [Google Scholar]
- 101.Kumar R, Whitehurst CB & Pagano JS The Rad6/18 ubiquitin complex interacts with the Epstein-Barr virus deubiquitinating enzyme, BPLF1, and contributes to virus infectivity. Journal of virology 88, 6411–6422 (2014). [DOI] [PMC free article] [PubMed] [Google Scholar]
- 102.Whitehurst CB et al. HIV co-infection augments EBV-induced tumorigenesis in vivo. Front Virol 2, 861628 (2022). [DOI] [PMC free article] [PubMed] [Google Scholar]
- 103.Wahl A et al. A cluster of virus-encoded microRNAs accelerates acute systemic Epstein-Barr virus infection but does not significantly enhance virus-induced oncogenesis in vivo. Journal of virology 87, 5437–5446 (2013). [DOI] [PMC free article] [PubMed] [Google Scholar]
- 104.Therneau T A Package for Survival Analysis in R. R package version 3.2-11. https://CRAN.R-project.org/package=survival (2021).
- 105.Gray RJ cmprsk: Subdistribution Analysis of Competing Risks. R package version 2.2-11. https://CRAN.R-project.org/package=cmprsk (2022).
- 106.Aalen OO & Johansen S An Empirical Transition Matrix for Non-Homogeneous Markov Chains Based on Censored Observations. Scandinavian Journal of Statistics 5, 141–150 (1978). [Google Scholar]
- 107.Gray RJ A Class of K-Sample Tests for Comparing the Cumulative Incidence of a Competing Risk. The Annals of Statistics 16, 1141–1154 (1988). [Google Scholar]
Associated Data
This section collects any data citations, data availability statements, or supplementary materials included in this article.
Supplementary Materials
Data Availability Statement
Source data for Figs 1–5 and Extended Data Figs. 1–8 are provided with the manuscript.