


Abstract
With the increase in the flow of sequence data, both in contigs and whole genomes, visual aids for comparison and analysis studies are becoming imperative. We describe three web-based tools for visualizing alignments of bacterial genomes. The first, called Enteric, produces a graphical, hypertext view of pairwise alignments between a reference genome and sequences from each of several related organisms, covering 20 kb around a user-specified position. Insertions, deletions and rearrangements relative to the reference genome are color-coded, which reveals many intriguing differences among genomes. The second, Menteric, computes and displays nucleotide-level multiple alignments of the same sequences, together with annotations of ORFs and regulatory sites, in a 1 kb region surrounding a given address. The third, a Java-based viewer called Maj, combines some features of the previous tools, and adds a zoom-in mechanism. We compare the Escherichia coli K-12 genome with the partially sequenced genomes of Klebsiella pneumoniae, Yersinia pestis, Vibrio cholerae, and the Salmonella enterica serovars Typhimurium, Typhi and Paratyphi A. Examination of the pairwise and multiple alignments in a region allows one to draw inferences about regulatory patterns and functional assignments. For example, these tools revealed that rffH, a gene involved in enterobacterial common antigen (ECA) biosynthesis, is partly deleted in one of the genomes. We used PCR to show that this deletion occurs sporadically in some strains of some serovars of S.enterica subspecies I but not in any strains tested from six other subspecies. The resulting cell surface diversity may be associated with selection by the host immune response.
INTRODUCTION
Advances in automatic DNA sequence analysis and the whole-genome shotgun sequencing strategy have resulted in a tremendous increase in the amount of available sequence data, both in contigs and complete genomes. Bacterial species are particularly convenient due to their small genome size and their ability to produce observable phenotypic variations within relatively short periods of time, which makes them good subjects for experimental studies and functional analysis. At the time of writing, there are 28 complete bacterial genomes publically available and 108 in progress (http://www.tigr.org/tdb/mdb/mdb.html ).
The parallel analysis of a number of phylogenetically diverse genomes can contribute to our understanding of their functional subsystems and overall physiological designs. In distantly related species, for instance, analyses of conserved gene clusters may provide clues about the selective pressures governing their clustering (1), while searches on a genome-wide basis for rearrangements in gene order may reveal interesting evolutionary phenomena such as lateral gene transfer. For example, sequence analysis of the proteins encoded in the genome of Thermotoga maritima showed that about one-half are most similar to bacterial proteins, while a quarter are most similar to archaeal proteins, mainly from Pyrococcus horikoshii (2), which provides evidence for lateral gene transfer between archaea and bacteria.
Comparison among closely related species, such as particular groups of bacteria, can provide other kinds of insights. Genome-wide comparisons and gene rearrangement studies will reveal unique DNA regions that can be targeted for study to determine the genetic basis for their phenotypic variation. In a complementary fashion, characterization of similarities among the species, rather than differences, can contribute to the functional identification of genes. Also, searching for similarities in non-coding regions can reveal conserved fragments that may have been preserved due to selective pressure, and hence are likely to play some functional role. To date such comparisons have typically involved many genes in the same regulatory pathway within one organism [e.g., (3)], although this has been extended to look at the same regulatory pathway in multiple species (4,5). One of the few examples of a sufficiently large database for comparisons of orthologs among multiple species has been the hemoglobins (6). It is expected that when a sufficient number of genomes from closely related bacteria are acquired, direct comparison of potential regulatory sequences should be possible for each orthologous promoter among these species.
A number of tools for comparing two genomes are available [e.g., (7,8)]. However, to take full advantage of the vast amount of genomic sequence and annotation data that is now being produced, biologists will need to access this information in new ways. We have developed methods to visually portray DNA sequence information in a form that allows one completed genome to be compared simultaneously to several sampled or completed genomes from related organisms. The enterobacteria provide a suitable model for this objective, because the Escherichia coli K-12 genome has been completed (9) and a series of related genomes are in the process of being sequenced to completion or have been extensively sample sequenced. We present an example in which the E.coli K-12 genome is compared to the partially sequenced genomes of Klebsiella pneumoniae, Yersinia pestis, Vibrio cholerae, and the Salmonella enterica serovars Typhimurium, Typhi and Paratyphi A. (The Pseudomonas aeruginosa genome has since been integrated into the system.) Escherichia coli K-12, hereafter referred to as ECO, is used as the reference genome. The name abbreviations and estimated distances of the other bacteria from ECO, defined based on identified sequence similarities, are shown in Table 1.
Table 1. Bacterial species included in the comparative views.
| Organism | Abbreviation | Completion (%) | Homologs of E.coli K-12 ORFs | Source | |
|---|---|---|---|---|---|
| E.coli K-12 | ECO | 100 | 4405 | 100% | (9) |
| K.pneumoniae | KPN | 95 sample | 3120 | 71% | WUSTL |
| Y.pestis | YPE | >99 | 2476 | 56% | Sanger Centre |
| V.cholerae | VCH | 100 | 1864 | 42% | TIGR |
| P. aeruginosa | PAE | ∼100 | 1826 | 41% | University of Washington, PathoGenesis Corp. |
| S.enterica serovar | |||||
| Typhimurium LT2 | STM | >99 | 3368 | 76% | WUSTL |
| Typhi | STY | >99 | 3341 | 76% | Sanger Centre |
| Paratyphi A | SPA | 95 sample | 3102 | 70% | WUSTL |
Similarity to the E.coli sequence was measured as the proportion of E.coli genes that are identified as ‘present’ in the pairwise alignments. An E.coli gene is counted as ‘present’ in a particular genome if at least 70% of its nucleotide positions are contained in alignments that overlap it by 100 bp or more. For genes <100 bp long, 70% of the whole gene must match.
We report three web-based visualization tools for portraying annotated pairwise and multiple alignments of bacterial sequences, both at the nucleotide-level and at the level of conserved sequence fragments: the Enteric and Menteric web servers, and the Java-based Maj viewer. These tools are available for public use at http://bio.cse.psu.edu/ or via the Salmonella genome sequencing project at http://genome.wustl.edu/gsc/bacterial/newlistdisplay.pl
MATERIALS AND METHODS
The E.coli K-12 sequence is from Blattner et al. (9). Sequence data for Salmonella typhimurium (STM), Salmonella paratyphi A (SPA) and K.pneumoniae (KPN) were obtained from ftp://genome.wustl.edu/pub/gsc1/sequence/st.louis/bacterial/salmonella/ , those for Salmonella typhi (STY) from ftp://ftp.sanger.ac.uk/pub/pathogens/st/ , those for Y.pestis (YPE) from ftp://ftp.sanger.ac.uk/pub/pathogens/yp/ , and those for P.aeruginosa (PAE) from http://www.pseudomonas.com/ . The V.cholerae (VCH) genome was sequenced at TIGR. Two of the genomes, ECO and VCH, are complete, while the others have been sequenced to varying extents. The numbers of melded contigs are: STM, 518; STY, 133; SPA, 887; YPE, 112; VCH, 2; PAE, 1.
The Enteric tool produces a hyperlinked, graphical representation of the pairwise alignments between E.coli and each of the enterobacteria. Alignment information for each of the organisms is displayed as a separate percent identity plot (PIP). A PIP is a representation of all local alignments between two sequences, with the positions in the first (reference) sequence numbered along the horizontal axis, and the sequence matches represented as horizontal lines placed at their corresponding locations within the reference sequence. The vertical coordinate of a line represents the quality of that match, measured by its percent identity. For example, a strongly conserved feature would be represented as a horizontal line near the top of the PIP. For our adaptation to the bacterial model system, only alignments with 50–100% identity values were considered and displayed.
Above the PIPs in Enteric’s output are displayed the names of genes in ECO, with arrows indicating their orientations. Embedded in the genes’ labels are links to corresponding entries in the WIT database (http://wit.IntegratedGenomics.com/IGwit/ ). Within the PIPs, colored rectangles or vertical bars denote regions with programmer-defined properties (in this case, discontinuities in the alignments). These colored features, together with additional notes (e.g., name of the aligning contig) that are disclosed when the cursor is pointing at the feature, can be used to infer information about insertions, deletions and rearrangements between the genomes.
The pairwise alignments between ECO and each of the bacteria are computed using a high-performance similarity search program developed locally [blastz (8)]. Because this is a relatively CPU intensive operation, the alignments are pre-computed and stored on-site for access by the server. To submit a request, users must supply an address in the E.coli genome. The Enteric server scans the alignments and extracts those in the 20 kb region surrounding this address, which are then combined with the corresponding annotations.
The output from Enteric is in PDF format, and can be viewed using any of the various standard tools for displaying PDF documents, such as the free Acrobat Reader program from Adobe Inc. (http://www.adobe.com/products/acrobat/readstep.html ), or the free Ghostscript program from Aladdin Inc. (http://www.cs.wisc.edu/∼ghost/ ).
The Menteric tool computes and displays multiple alignments of bacterial genomes, along with annotations of functional landmarks (ORFs, promoters and protein binding sites) and motifs with a potential role in regulation. It functions as a web server, with a CGI interface that allows the user to specify an address in the reference organism (E.coli), a source for annotation data, the desired output format (PostScript or PDF) and conservation criteria to be used for motif detection.
For the 1 kb region surrounding the specified address, Menteric first determines the best-matching sequence in each of the other bacteria, which it aligns later in a multiple alignment. To determine the pool of homologous regions, it inspects the set of genome-wide pairwise alignment files pre-computed using the blastz sequence alignment program. The best homolog in each genome is selected based on simple score examination, i.e., the best-scoring alignment covering at least 50% of the query region is chosen. The multiple alignment is then generated using a locally developed alignment tool (align5, currently under development), and annotated with information about functional and conserved regions. For the functional landmarks, information on promoters, transcription start sites, ORFs and protein binding sites was extracted from the GenBank E.coli strain K-12 annotated sequence version M54 (9), and from the RegulonDB (10) database, separately, and stored in a format recognizable by the graphical assembler. These annotations contain embedded hyperlinks to various web resources (entries in the WIT database, the GenBank E.coli entry, the search page for RegulonDB, or the contig sequences). One of five available programs [infocon, phylogen, agree, kkno or kunk (11)] searches the multiple alignments for conserved regions (motifs), according to the conservation criteria specified by the user. The alignment constituents (text, annotations and links) are combined by a graphical assembler (maps) into a PostScript document, which is optionally convertible to PDF format. The Menteric package was written in C, Perl and KornShell, and uses PostScript primitives.
The Maj viewer produces interactive displays of the bacterial sequence alignments at ‘wide’ and ‘close-up’ levels of resolution, corresponding roughly to the views presented by Enteric and Menteric, respectively. The Maj viewer is a Java applet requiring Java 1.2 or higher (1.2.2 recommended). It is closely related to our Laj tool for displaying pairwise alignments (http://bio.cse.psu.edu/ ), but has been adapted to display multiple alignments. Its ‘wide’ and ‘close-up’ views use primarily the same underlying program modules, but display different data in order to resemble the Enteric and Menteric tools. Clicking the ‘Start’ button on the applet’s input form submits the user’s address and view selections to a CGI script on the server, which runs the necessary programs to generate and return a JAR file containing the appropriate data for display. The main Maj window then conforms itself to the chosen view and loads the JAR data accordingly. For each view, Maj uses the same data sets as Enteric or Menteric, though in some cases the files are first transformed to fit Maj’s input formats. For example, the PIPs in the ‘close-up’ view are not obtained from the pairwise alignment files used by Enteric, but are instead projected from the multiple alignment used by Menteric.
In order to attempt PCR amplification of rffH in several serovars of S.enterica subspecies, primers were designed flanking the rffH gene. sal.1 5′-GCGAAAACCGTTCAGTG, is located downstream of the gene, and sal.3 5′-ACAATGCCGCTATTCAC, upstream of the gene. Some experiments were also performed with sal.2 5′-ACGGCAGGTTCTTACTC and sal.4 5′-CCAAAGAGAATCCCAGC, similarly oriented. Glycerol stock (2 µl) of each strain was PCR amplified in a volume of 25 µl with the primers. The PCR protocol used standard buffer with 1.5 mM Mg2Cl (Promega, Madison, WI) and the cycling parameters, 94°C, 5 min, followed by 35 cycles of 65°C, 30 s, 72°C, 2 min, and 15 s, 94°C. An aliquot (10 µl) was resolved on a 1% agarose–TBE gel and then stained with ethidium.
OVERVIEW OF THE TOOLS AND THEIR USES
The Enteric server
The PIPs generated by the Enteric server display simultaneous alignments of ECO with each of the ECO, STM, STY, SPA, KPN, YPE, VCH and PAE genomes in a 20 kb region around an ECO address supplied by the user. The output is presented as a PDF document containing ECO gene annotations with embedded hyperlinks to their corresponding entries in the WIT database, and color-coded bands that indicate insertions, deletions and rearrangements between the genomes. Information about the rearrangement location, contig name or insertion size is obtained by positioning the cursor over the relevant band.
ECO gene names and orientations are represented as labeled arrows along the ECO genome. Embedded in each gene’s label is a hyperlink to its entry in the WIT database of Overbeek and Selkov, which contains references to gene function, if known, and information about potential homologs (12). The WIT system stores data derived from about 40 sequenced genomes, and supports additional comparative analysis that can be instrumental, e.g., for the assignment of gene function. Figure 1 presents PIPs centered on the mog gene at ~10 kb in ECO, where base zero is situated, according to convention, at the beginning of the thr operon.
Figure 1.

Enteric alignments of E.coli K-12 with related genomes. PIP alignments of the 20 kb region at the beginning of the E.coli sequence with genomes of related bacteria, showing characteristic elements.
The PIP showing the alignments obtained from the intragenomic comparison of ECO (top panel) is edited to remove the trivial 100% identity match of the genome with itself. The remaining matches, displayed as horizontal lines on the PIP, correspond to regions elsewhere in the genome that share >50% nucleotide identity with the ECO fragment at the displayed location. Examples of such paralogs can be seen in Figure 1 for talB, dnaK and the insertion sequence protein yi81_1. A catalog of such genes, including more divergent genes than can be seen on the PIP, is being constructed and maintained by Monica Riley (13) (http://www.mbl.edu/html/ecoli.html ). The tRNA family and some other sequences, such as REP elements, display a wide range of percent homologies. A group of tRNA family members is seen at ~5.5 kb in Figure 1.
The other PIPs in Figure 1 show comparisons between ECO and the other genomes, which are all sufficiently related to ECO to share >50% DNA similarity in many genes. ECO’s departure from these genomes is evident not only in nucleotide sequence divergence, but also in the presence or absence of large numbers of individual genes, entire cistrons, or other large clusters of genes (collectively referred to as ‘loops’ in this paper), and rearrangements in gene order. Such large-scale events appear as alignment discontinuities, which are color-coded in the PIPs. Additional information about each discontinuity can be obtained by placing the cursor over it.
A red vertical stripe at the end of an alignment is used to indicate that the immediate neighbor of the aligned sequence from the compared genome has a homolog elsewhere in ECO. This can indicate a rearrangement or deletion event in the comparison genome relative to ECO. Pointing at the stripe reveals the address of the distant homolog. For example, in STM there is a rearrangement that separates thrL and thrA at about base zero in ECO.
A simple deletion in the comparison genome, without other rearrangements, is represented by a red box. This is identified as a region flanked on both sides by alignments of ECO with the same, contiguous fragment from the other genome. For example, the gene b0005 (at ~5 kb in ECO) is simply deleted from STM.
A blue vertical stripe at the end of an alignment means that the immediate neighbor of the aligned sequence from the compared genome has no detectable homolog in ECO. This indicates an insertion event in this genome relative to ECO. When the cursor is placed here the stripe reveals the length of the unmatched sequence (only insertions >400 bp qualify). Examples of such inserted sequences can be found in all three Salmonella species immediately following the dnaJ gene at ~15 kb in ECO.
A yellow box indicates that the region is absent in the compared genome, but the deletion event is complex. For example, yi81_1 and gefL are missing from STM and replaced by other sequences (indicated by blue stripes flanking the yellow box at ~15–17 kb in ECO).
A gray box is used to indicate a region from the compared genome that apparently has not been sequenced yet. When a contig sequence has a significant match with ECO right up to the end, but there are no significant alignments with the neighboring region of ECO, there is reason to believe that some of the adjacent sequence is missing from the sequence sample. A region of ECO that shows no alignment and is flanked on one or both ends by such an event is colored gray. For example, part of the mog gene (at ~9 kb in ECO) is apparently not in the STM sequence sample. Some of these gray regions are extensive. It is probable that large portions of these actually correspond to deletions in the sampled genome, but the sequences that define one or both ends flanking the deletion have not been sampled yet.
If an E.coli gene has multiple homologs in a compared genome, they will appear on the PIP at the same location in ECO. An interesting subset of these homologs are genes embedded in otherwise unique portions of the compared genome. These alignments are marked with blue vertical stripes of half height on the PIP. An example is the second homolog of nhaA in KPN (at ~18 kb in ECO), illustrated in Figure 1.
There are a few caveats to bear in mind when comparing incomplete sequence data to a complete reference genome. There may be some fragments in the compared genome that do not match the reference genome at all. Some of these ‘orphans’ may reside on plasmids, such as the 94 kb pSTL plasmid in STM, and some orphan contigs may be internal parts of sequences not found in ECO, referred to here as ‘loops’. Thus, the length of any loop in the sampled genome that is not entirely spanned by a contig is unknown. In such a case, the blue stripe on the PIP merely indicates the known length of unmatched sequence anchored at one end by a sequence that matches ECO. Finally, incomplete genomes may have a few sequences that are assembled incorrectly, leading to some cases of ‘rearrangement’ that are not real.
The Menteric server
The Menteric server computes and displays on-the-fly nucleotide-level multiple alignments of sequences from several related genomes in a 1 kb region surrounding a user-specified address. The alignment is rendered as a PostScript or PDF document in which annotations of E.coli ORFs, promoters and protein binding sites are color-coded. Conserved regions, potentially associated with functional sites, are surrounded by boxes. This close-up view of the alignment allows users to analyze the local conservation patterns and draw inferences about potential regulatory regions.
The multiple alignment treats the E.coli sequence as the reference sequence, and all of the other sequences are portrayed with respect to it. Dots are used to indicate positions where the reference and comparison sequences agree. Locations in the E.coli sequence are marked along the top of the alignment in increments of 10, and an abbreviation for the species name is indicated at the right end of each line.
Known functional regions are represented on the alignment as color underlays: promoter regions are shown in green, protein binding sites in red, and ORFs (genes and putative genes) in light chocolate. Each site is labeled to indicate the name of the associated feature. The label ‘PR’ above a green band is used to indicate a promoter that is only predicted, as opposed to one that is documented with experimental evidence. Transcription start sites are represented as green bands spanning one alignment column, labeled by the name of the promoter from which transcription is being initiated, together with the ‘+1’ qualifier.
Annotation data for the functional landmarks were collected from two different sources: the GenBank E.coli annotation version M54 (9), and the web-based RegulonDB database (10). The two sources differ in the degree of annotation and the type of evidence required for each recorded site. The GenBank annotations record both predicted and documented functional sites (304 of the total 4109 promoters, and 295 of the total 1080 protein binding sites are documented), and therefore offer a more extensive collection. From RegulonDB, we extracted only those regulatory sites that were verified experimentally. This collection is smaller, but more accurate for certain purposes such as program evaluation studies. The user can choose to color the functional regions according to either of these sources.
In addition, the user can select from several programs for identifying conserved regions (11), each using a different type of conservation criteria. Depending on the method used, a ‘conserved’ block in the alignment is one with high information content (infocon), good letter agreement (agree), low phylogenetic distance (phylogen), or one in which each of the alignment rows differs in at most one position from either a specified sequence in the alignment (kkno) or an unknown ‘center’ sequence (kunk). The latter two methods can be used to model binding sites with known or unknown consensus sequences. In all cases, unlike pattern-matching techniques, no prior knowledge of a site’s consensus sequence is necessary, hence all of these methods can reveal informative new patterns potentially associated with the binding sites of novel proteins.
For all of these methods, the adjustable parameters have been optimized to best match the functional sites in the E.coli araC–araBAD intergenic fragment (14). This reference region was chosen because the extensive amount of study and literature on this locus increases the confidence in assigning to each position a functional or non-functional role, which improves the accuracy of the evaluation. As with any predictive method based on sequence comparison, however, the best parameter settings may differ slightly depending on the conservation pattern in a particular region, and hence they should only be used as guidelines.
Figure 2 shows the annotated multiple alignment produced by Menteric in a 1 kb segment containing the transcription control region for the E.coli carAB operon, which encodes carbamoyl-phosphate synthetase. This intergenic fragment extends between positions 29 100 and 30 100 in the E.coli sequence, and is flanked by the dapB and carA genes, both transcribed in the forward direction. The control region of the carAB operon contains two tandem promoters, carAp1 (29 515–29 543, +1 = 29 551) and carAp2 (29 584–29 613, +1 = 29 619), repressed respectively by pyrimidines and arginine (15). These are shown in green on the alignment display. Primer extension and S1 nuclease mapping of in vivo carAB transcripts have revealed that transcription in S.typhimurium is similar to that of E.coli in its initiation and in its two promoters, P1 and P2 (16). The arginine control is mediated through binding of the arginine repressor ArgR to two adjacent palindromic ARG boxes overlapping carAp2 (P2). Thus, the RNA polymerase and the arginine repressor are in competition for the carAp2 promoter and bind in a mutually exclusive manner. In addition, the integration host factor (IHF) has been shown to modulate the expression of the pyrimidine-specific carAp1 (P1) promoter (17,18). The ArgR binding sites are located between positions 29 602 and 29 617, and between 29 625 and 29 640 in the E.coli sequence (data extracted from RegulonDB), while the IHF binds between positions 29 239 and 29 251. These regions are shown as red bands in Figure 2, and are labeled with the name of the binding protein. The conserved regions in this example were determined using the phylogen program.
Figure 2.

Menteric multiple alignment at base resolution. A multiple alignment produced by Menteric in a 1 kb region surrounding the control locus for the carAB operon. Promoters, ORFs and regulatory protein binding sites are colored in green, light chocolate and red, respectively. Conserved regions detected with our phylogen tool on the basis of phylogenetic distance are enclosed in boxes.
As the field of functional genomics develops, the integration of information from various sources, including literature references, sequence data, and reports from sequence analysis tools, is becoming increasingly important. The PDF file produced by Menteric contains embedded links to various data repositories available on the web. Clicking on the gene name, for instance, leads to its entry in the WIT database. Promoter and protein binding site labels are links to the source of annotation data, i.e., the GenBank entry of the E.coli annotated sequence, or the fixed-query form of the RegulonDB database. Pointing at the sequence name on the right-hand side of the graphical display (called the alignment ‘trailer’) reveals the name of the contig, and the start and end locations of the aligned fragment within this contig. Clicking on the trailer downloads a web page containing this information and the contig’s sequence data. Lastly, to simplify access to a particular location in the alignment, the position in the reference organism that appears at the start of each alignment page is indexed using the PDF bookmark feature.
DNA sequence comparison methods have long been used as reliable guides for detecting regions of homology, such as protein coding genes common to two or more organisms. In pairwise sequence alignments between relatively distant organisms (e.g., mouse and human), strong local similarities in non-coding regions may indicate regulatory elements. In multiple alignments, where the probability of a random match in a column decreases considerably, highly conserved regions are even more likely to play a role in regulation. The investigator interested in functional studies may find this annotated nucleotide-level view suitable for detecting conserved sites deserving of further experimental analysis, and for inferring putative regulatory roles for these regions.
Currently, the Menteric server is limited to the particular model system of enteric bacteria. The server operates from the web site of the bioinformatics group at Penn State and uses local repositories of sequence, annotation and alignment data. It is also highly dependent on the specific format of the output from the alignment tools. To address these limitations, a new version of Menteric that allows portability to other genetic systems (including those in eukarya) is currently in progress. This new package includes software for formatting the organism-specific data repositories, as well as a mechanism for dynamically selecting a particular system based on the reference organism. The software is available at http://bio.cse.psu.edu/ . Pairwise alignments, in the format required by Menteric, from comparisons between two user-specified sequences can be obtained from our PipMaker web server [(8); http://bio.cse.psu.edu/ ], or by contacting us directly. For increased portability, future versions of Menteric will allow several input file formats, such as those produced by widely used genome alignment programs like MUMmer (7) and tfastx (19).
The Maj viewer
This tool uses a Java applet to provide an interactive graphical display for the alignment data, combining some of the features from the other tools. It has two distinct viewing modes that correspond roughly to the Enteric and Menteric tools, respectively, and buttons that allow the user to switch back and forth.
Figure 3 shows an example of Maj’s ‘wide’ view, which displays Enteric-like PIPs aligning a 20 kb region from ECO with each of the other bacteria. It uses the same color-coding scheme to indicate insertions, deletions and gene rearrangements, and as before the gene arrows above the PIPs are hyperlinks to the WIT database. Instead of labeling items directly on the plot, Maj uses two message boxes near the top of the window. The top box displays information about the location where the mouse is currently pointing (e.g., PIP coordinates, contig name and/or details about color bands), while the other gives information about a particular local alignment the user has selected. Clicking with the mouse in one of the PIP panels ‘marks’ the nearest aligned location with a red circle, and also colors that entire local alignment red to show its extent. An additional feature of Maj is that it allows one to zoom in on areas of interest to examine the PIPs more closely. When the user drags the mouse to select an alignment region in any of the PIP panels, that region is expanded horizontally to fill the entire window. All of the graphical panels zoom together in a synchronized fashion. Lastly, holding down the right mouse button adds crosshairs at the mouse pointer’s location, which is convenient for checking exactly how different features line up.
Figure 3.

Maj alignments of E.coli K-12 with related genomes. Example of Maj’s ‘wide’ view, displaying a 20 kb region surrounding the araBAD and araC operons (position 70 200) in E.coli. This view is similar to the Enteric tool, but has more interactive capabilities. The two message boxes at the top provide information about the location of the mouse pointer and the ‘mark’ (red circle), respectively.
Maj’s ‘close-up’ view (Fig. 4) is somewhat similar to Menteric in that it focuses on a 1 kb region and displays the same nucleotide-level multiple alignment in a scrollable panel across the bottom of the window. Interactive PIPs are still displayed, although in this case they are pairwise projections of the multiple alignment, rather than the pre-computed, independent pairwise alignments displayed in the ‘wide’ view. The colored regions now reflect the GenBank annotations from Menteric, which appear in the top message box when the user points the mouse at the corresponding bands. At this time Maj does not identify conserved regions, provide links for downloading the contig sequences, or allow the user to choose the RegulonDB annotations.
Figure 4.

Maj multiple alignment at base resolution. Example of Maj’s ‘close-up’ view centered on the same E.coli position (70 200) as Figure 3. This 1 kb region includes the intergenic regulatory locus between the araB and araC genes in E.coli. This view shares some features with the Menteric tool, including the multiple alignment and GenBank annotations, but does not display conserved regions in the alignment.
Applications of the tools to biology
One example of the utility of these visualization tools is the ability to focus on unexpected differences in the compared genomes. To demonstrate this, we selected one unexpected phenomenon that was readily apparent when scanning these visualizations. The E.coli gene rffH encodes a glucose-1-phosphate thymidylyltransferase (EC 2.7.7.24) and is part of a cluster involved in the synthesis of enterobacterial common antigen (ECA) (Fig. 5). There is a large in-frame deletion within rffH in STM, bounded by red stripes, but not in STY or SPA. A second, lower homology alignment in this region indicates there is a similar gene found elsewhere in these genomes. Upon examination at base pair resolution the difference in STM appears to be due to a simple deletion within the gene, with no sequence drift in the remaining portion of the gene, indicating a relatively recent mutation. To establish the distribution of this unexpected deletion, PCR primers were developed spanning the gene and amplified the region from 40 other strains of S.enterica subspecies I in the SARB collection (20), including four other Typhimurium strains, and two strains each from seven other subspecies in the SARC collection (21). All of the Typhimurium strains contained the deletion. However, strains with the deleted variant and strains with the full-length variant of this gene were found in every major lineage of subspecies I as defined by Boyd et al. (20), which includes all the major Salmonella pathogens of humans. The deletion was not seen in the other seven subspecies. The complete list of strains and PCR results is available at http://globin.cse.psu.edu/ftp/dist/Enterix/ . Some examples of the PCR results are shown in Figure 6. Interestingly, there are relatively close homologs of rffH and the adjacent gene in the same cistron, rffG, located elsewhere in all of these genomes. These homologs, rfbA and rfbB, respectively, are enzymes involved in lipopolysaccharide (LPS) production. The fact that there is only one glucose-1-phosphate thymidylyltransferase (rfbA) in serovar Typhimurium explains the otherwise confusing observation that mutants in rfbA are unable to synthesize ECA (22) whereas this would not be true in any strain with a functional rffH gene.
Figure 5.

Enteric alignments spanning a region around rffH. The rffH gene is involved in ECA biosynthesis. It is partially deleted in STM (the region is bounded by red stripes), but is present in ECO, STY, SPA and KPN. A second, lower homology alignment of ECO with all of these genomes in this region indicates that a similar gene is present elsewhere.
Figure 6.
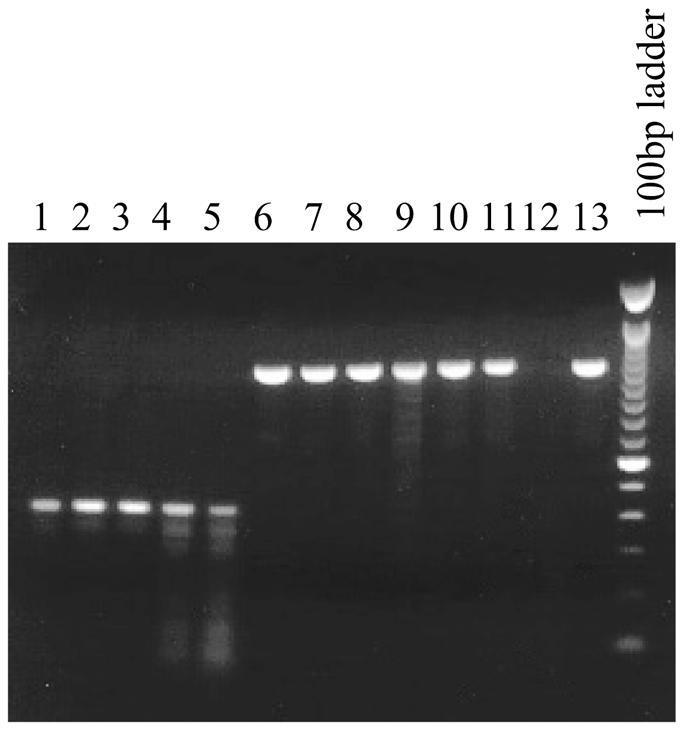
rffH is deleted in some but not all members of S.enterica subspecies I. Members of subspecies I in the SARB set and seven other subspecies in the SARC set (20) were PCR amplified under stringent conditions using primers flanking both sides of rffH. PCR resulted in products of length 1053 in STY and SPA and length 402 in STM. Some examples are shown. Lane 1, SARB 65, serovar Typhimurium LT2; lane 2, SARB 66, serovar Typhimurium; lane 3, SARB 67, serovar Typhimurium; lane 4, SARB 68, serovar Typhimurium; lane 5, SARB 16, serovar Enteritidis; lane 6, SARB 17, serovar Enteritidis; lane 7, SARB 48, serovar Paratyphi C; lane 8, SARB 64, serovar Typhi; lane 9, SARC 5, subspecies IIIa; lane 10, SARC 7, subspecies IIIb; lane 11, SARC 9, subspecies IV; lane 12, SARC 11, subspecies V (no PCR product was generated in this species); lane 13, SARC 13, subspecies VI; last lane, molecular weight marker: 100 bp ladder (Gibco).
We do not yet know why both rffH and rfbA seem to have been conserved in ECO, KPN and many Salmonella species, and what phenotypic differences, if any, the presence or absence of rffH may confer. The wide distribution of the deletion within subspecies I, but restricted to only this subspecies, suggests that this polymorphism may confer fitness to the population. This observation correlates with the fact that genes involved in LPS construction are known to undergo relatively high rates of lateral transfer between genomes, presumably to ensure high diversity (23,24).
Other results from the comparative analysis of the E.coli K-12 genome with the Salmonella and Klebsiella genomes can be found elsewhere (M.McClelland, L.Florea, K.Sanderson, S.Clifton, R.Wilson and W.Miller, submitted for publication).
DISCUSSION
The three tools presented here offer complementary views of bacterial sequence alignments. The large views of the similarities between E.coli and other genomes in the model system provided by Enteric and Maj are useful guides for studying deletions, insertions and gene rearrangements in the compared genomes. Such information can be instrumental in determining the factors responsible for phenotypic variations, and in elucidating phylogenetic relationships among the genomes. Readers are directed to another paper that demonstrates the utility of these tools and summarizes some of the results and biological implications of the comparisons presented here (M.McClelland, L.Florea, K.Sanderson, S.Clifton, R.Wilson and W.Miller, submitted for publication).
Direct comparison of sequences has proven essential for revealing the mechanisms that govern gene function and regulation. The underlying paradigm is that selection lowers the rate of mutation in functional DNA, and hence such regions tend to be resistant to evolutionary drift. In multiple alignments, where the chance of a random match in a column decreases considerably, regions of good conservation are strong candidates for playing a functional role. Menteric’s nucleotide-level view and annotations can help to correlate the sequence data with information about the conservation patterns and known functional landmarks, and thus can suggest functional assignments.
In both genome-wide and nucleotide-level analyses, insights revealed by visual inspection of the alignments can be correlated with the existing experimental evidence for validation, or can prompt further laboratory investigation. Combining computational and experimental methods could ultimately be the key for the efficient analysis of uncharacterized data.
Each of the three tools provides its own set of features and information, and can also differ from the others in the procedures and formats used to produce and present its results. Maj’s interactive nature makes it possible for the user to switch back and forth between the high-level and regional scales used by Enteric and Menteric, respectively, and to magnify these views if desired. However, its output is more difficult to store and print. Menteric and Enteric each show only one of these views, but the PDF and PostScript documents they produce can be stored locally and retrieved for re-examination. By making all of these visualization tools available, we allow the investigator to choose whichever one is most appropriate for the task at hand, or to use a combination of them to correlate information from the different views.
While this software is currently adapted for this particular model system of enteric bacteria, its alignment visualization techniques are universally applicable to any system of related organisms that is biologically informative, as long as at least one of the sequences in the system has been completely assembled. As part of an effort to increase the generality of these tools, a version of Menteric that is adaptable to a variety of genetic systems is currently being implemented. Indeed, the treatment shown here may be of considerable interest not only for many bacteria, but also for any other organisms that share some regions of DNA similarity in excess of 45–50%. Systems that could benefit from such portrayals include mammals, where genomes are likely to be extensively sampled long before they are completely sequenced. The ability to extract information using one completed genome and one or more sampled genomes should be of particular interest in these cases. This ability to extract useful information from sampled genomes can be added to the many reasons why publically funded sequencing efforts should release their data as it is being generated, rather than wait for completion or some arbitrary intermediate milestone. Once a genome in a bacterial family has been completely sequenced, the availability of comparative tools such as those we describe here should encourage the sampling of multiple related genomes at a small fraction of the cost of completion. This may be particularly useful for ‘orphan’ genomes that might not otherwise receive sufficient support for total sequencing.
Acknowledgments
ACKNOWLEDGEMENTS
We thank the members of the Salmonella sequencing consortium, in particular, the Principal Investigator of the project, Rick Wilson, Sandy Clifton, Michael Nhan and John Spieth at WUSTL, Ken Sanderson (Univeristy of Calgary), and Aaron McKay and Bill Pearson (Univeristy of Virginia) for their co-operation and many helpful discussions. M.M. was supported by grants, AI 34829 (M.M.) and AI 34829-09 AI (Rick Wilson). W.M., L.F., C.R., Z.Z., N.S. and S.S. were supported by LM05110 (W.M.) from the National Library of Medicine.
REFERENCES
- 1.Itoh T., Takemoto,K., Mori,H. and Gojobori,T. (1999) Mol. Biol. Evol., 16, 332–346. [DOI] [PubMed] [Google Scholar]
- 2.Nelson K.E., Clayton,R.A., Gill,S.R., Gwinn,M.L., Dodson,R.J., Haft,D.H., Hickey,E.K., Peterson,J.D., Nelson,W.C., Ketchum,K.A. et al. (1999) Nature, 399, 323–329. [DOI] [PubMed] [Google Scholar]
- 3.Zhang M.Q. (1999) Genome Res., 9, 681–688. [Published erratum appears in Genome Res., 9, 1156.] [PubMed] [Google Scholar]
- 4.Gelfand M.S., Koonin,E.V. and Mironov,A.A. (2000) Nucleic Acids Res., 28, 695–705. [DOI] [PMC free article] [PubMed] [Google Scholar]
- 5.Bono H., Ogata,H., Goto,S. and Kanehisa,M. (1998) Genome Res., 8, 203–210. [DOI] [PubMed] [Google Scholar]
- 6.Hardison R., Slightom,J.L., Gumucio,D.L., Goodman,M., Stojanovic,N. and Miller,W. (1997) Gene, 205, 73–94. [DOI] [PubMed] [Google Scholar]
- 7.Delcher A.L., Kasif,S., Fleischmann,R.D., Peterson,J., White,O. and Salzberg,S.L. (1999) Nucleic Acids Res., 27, 2369–2376. [DOI] [PMC free article] [PubMed] [Google Scholar]
- 8.Schwartz S., Zhang,Z., Frazer,K.A., Smit,A., Riemer,C., Bouck,J., Gibbs,R., Hardison,R. and Miller,W. (2000) Genome Res., 10, 577–586. [DOI] [PMC free article] [PubMed] [Google Scholar]
- 9.Blattner F.R., Plunkett,G.,III, Bloch,C.A., Perna,N.T., Burland,V., Riley,M., Collado-Vides,J., Glasner,J.D., Rode,C.K., Mayhew,G.F. et al. (1997) Science, 277, 1453–1474. [DOI] [PubMed] [Google Scholar]
- 10.Salgado H., Santos-Zavaleta,A., Gama-Castro,S., Millan-Zarate,D., Blattner,F.R. and Collado-Vides,J. (2000) Nucleic Acids Res., 28, 65–67. [DOI] [PMC free article] [PubMed] [Google Scholar]
- 11.Stojanovic N., Florea,L., Riemer,C., Gumucio,D., Slightom,J., Goodman,M., Miller,W. and Hardison,R. (1999) Nucleic Acids Res., 27, 3899–3910. [DOI] [PMC free article] [PubMed] [Google Scholar]
- 12.Overbeek R., Larsen,N., Pusch,G.D., D’Souza,M., Selkov,E.,Jr, Kyrpides,N., Fonstein,M., Maltsev,N. and Selkov,E. (2000) Nucleic Acids Res., 28, 123–125. [DOI] [PMC free article] [PubMed] [Google Scholar]
- 13.Riley M. (1998) Nucleic Acids Res., 26, 54. [DOI] [PMC free article] [PubMed] [Google Scholar]
- 14.Florea L., Li,M., Riemer,C., Giardine,B., Miller,W. and Hardison,R. (2000) Curr. Genomics, 1, 11–27. [Google Scholar]
- 15.Charlier D., Weyens,G., Roovers,M., Piette,J., Bocquet,C., Pierard,A. and Glansdorff,N. (1988) J. Mol. Biol., 204, 867–877. [DOI] [PubMed] [Google Scholar]
- 16.Kilstrup M., Lu,C.D., Abdelal,A. and Neuhard,J. (1988) Eur. J. Biochem., 176, 421–429. [DOI] [PubMed] [Google Scholar]
- 17.Charlier D., Roovers,M., Gigot,D., Huysveld,N., Pierard,A. and Glansdorff,N. (1993) Mol. Gen. Genet., 237, 273–286. [DOI] [PubMed] [Google Scholar]
- 18.Charlier D., Huysveld,N., Roovers,M. and Glansdorff,N. (1994) Biochimie, 76, 1041–1051. [DOI] [PubMed] [Google Scholar]
- 19.Pearson W.R., Wood,T., Zhang,Z. and Miller,W. (1997) Genomics, 46, 24–36. [DOI] [PubMed] [Google Scholar]
- 20.Boyd E.F., Wang,F.S., Beltran,P., Plock,S.A., Nelson,K. and Selander,R.K. (1993) J. Gen. Microbiol., 139, 1125–1132. [DOI] [PubMed] [Google Scholar]
- 21.Boyd E.F., Wang,F.S., Whittam,T.S. and Selander,R.K. (1996) Appl. Environ. Microbiol., 62, 804–808. [DOI] [PMC free article] [PubMed] [Google Scholar]
- 22.Rick P.D., Wolski,S., Barr,K., Ward,S. and Ramsay-Sharer,L. (1988) J. Bacteriol., 170, 4008–4014. [DOI] [PMC free article] [PubMed] [Google Scholar]
- 23.Orskov F., Whittam,T.S., Cravioto,A. and Orskov,I. (1990) J. Infect. Dis., 162, 76–81. [DOI] [PubMed] [Google Scholar]
- 24.Stevenson G., Neal,B., Liu,D., Hobbs,M., Packer,N.H., Batley,M., Redmond,J.W., Lindquist,L. and Reeves,P. (1994) J. Bacteriol., 176, 4144–4156. [DOI] [PMC free article] [PubMed] [Google Scholar]