Abstract
The µ-opioid receptor (µOR) is an important target for pain management1 and molecular understanding of drug action on µOR will facilitate the development of better therapeutics. Here we show, using double electron–electron resonance and single-molecule fluorescence resonance energy transfer, how ligand-specific conformational changes of µOR translate into a broad range of intrinsic efficacies at the transducer level. We identify several conformations of the cytoplasmic face of the receptor that interconvert on different timescales, including a pre-activated conformation that is capable of G-protein binding, and a fully activated conformation that markedly reduces GDP affinity within the ternary complex. Interaction of β-arrestin-1 with the μOR core binding site appears less specific and occurs with much lower affinity than binding of Gi.
Subject terms: Molecular biophysics, Molecular biology
Studies on the µ-opioid receptor using fluorescent labelling of intracellular residues and energy transfer experiments in the presence of different ligands with or without G-protein binding reveals conformational changes that correlate to ligand efficacy.
Main
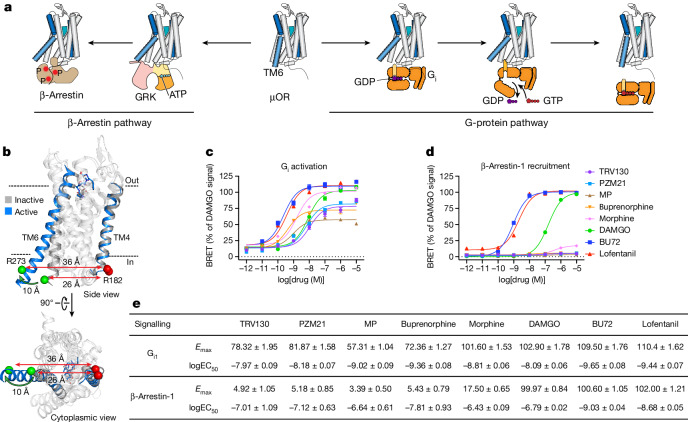
µOR is a family A G-protein-coupled receptor (GPCR) and an important drug target for analgesia. However, activation of the µOR by opioids such as morphine and fentanyl may also lead to adverse effects with varying severity, including constipation, tolerance and respiratory depression. The µOR activates Gi/o family G proteins and recruits β-arrestins-1 and 2 (Fig. 1a). It was previously thought that the analgesic effects of µOR signalling were mediated by G-protein signalling2, whereas respiratory depression was mediated by β-arrestin recruitment3. Thus, ligands that preferentially activate G protein, also known as G-protein-biased agonists, were expected to exhibit attenuated side effects. To this end, a series of G-protein-biased ligands were developed, including TRV130, PZM21, mitragynine pseudoindoxyl (MP) and SR-170184–8. However, although ligand bias towards G-protein signalling leads to the reduction of β-arrestin-mediated tolerance, more recent studies have shown that overly strong G-protein signalling (super-efficacy) is responsible for respiratory depression9–11, and that partial agonists with lower efficacy provide a safer therapeutic profile12.
Fig. 1. Ligand-dependent activation of the µOR.
a, Binding of agonist to the µOR activates two downstream signalling pathways: the G-protein pathway and the β-arrestin pathway. b, The hallmark conformational change of GPCR activation is an outward tilt of TM6 of approximately 10 Å. Cα atoms of Arg182 in TM4 and Arg273 in TM6 are shown as red and green spheres, respectively. TM4 and TM6 are highlighted (inactive μOR (grey), Protein Data Bank (PDB) 4DKL; active, G-protein-bound μOR with G-protein hidden for clarity (blue), PDB code 6DDF). c,d, Intrinsic efficacy of ligands towards Gi1 and β-arrestin-1 determined by TRUPATH assays. Error bars represent s.e.m. from 9–12 biological replicates. e, Maximum efficacy (Emax) and potency (half-maximal effective concentration (EC50)) values determined in c,d.
Some insight into the structural underpinnings of µOR activation and µOR-mediated G-protein signalling is provided by high-resolution structures. The C-terminal helix of Gi binds to an opening within the cytoplasmic surface of the 7-transmembrane helix bundle, which is formed upon an approximately 10-Å outward movement of the intracellular end of transmembrane helix 613–16 (TM6) (Fig. 1b). At present, there is still no high-resolution structure of µOR in complex with β-arrestin, probably owing to the lack of a stable or structurally homogenous protein complex. Nevertheless, structures determined by X-ray crystallography and cryo-electron microscopy (cryo-EM) generally represent snapshots of the most stable and homogenous conformations out of a large ensemble. The majority of GPCR–G-protein complex structures have been determined in the nucleotide-free state, a highly stable state that may not represent the active state in the presence of the physiologic concentrations of GDP and GTP in cells17. Conformations of less stable excited states and their relative populations within the conformational ensemble may not be amenable to structure determination but represent important modulators of downstream signalling18–21.
To investigate the molecular basis of µOR activation and signal transfer, we combined double electron–electron resonance (DEER) and single-molecule fluorescence resonance energy transfer (smFRET)22–24. DEER resolves an ensemble of conformations and their populations at sub-angstrom resolution and with high sensitivity to population changes, whereas smFRET provides access to real-time conformational dynamics. Here we examined the effect of nine representative µOR ligands with unique pharmacological profiles on the conformation and dynamics of TM6, including naloxone (antagonist), TRV130, PZM21, MP (low-efficacy G-protein-biased agonists), buprenorphine (low-efficacy agonist), morphine (high-efficacy agonist), DAMGO (high-efficacy reference agonist), BU72 and lofentanil (super-efficacy agonists) (Fig. 1c,e and Supplementary Fig. 1). Additionally, we investigated the synergistic effects of ligand and transducer binding on the conformational equilibrium and transducer activation—in particular nucleotide release from the G protein. Our results demonstrate how the conformational ensemble of μOR—whose conformational states exchange on fast and slow timescales—is fine-tuned by ligand binding, resulting in distinctive efficacies and signal bias.
Nitroxide spin probe and fluorophore labelling
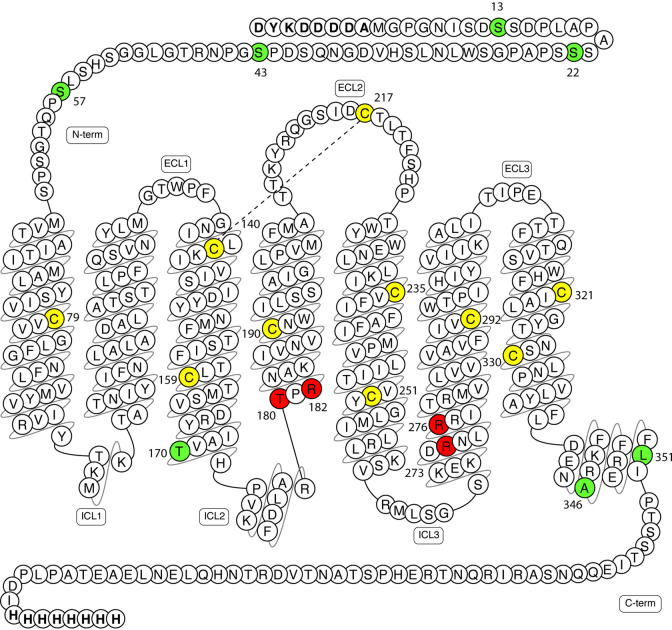
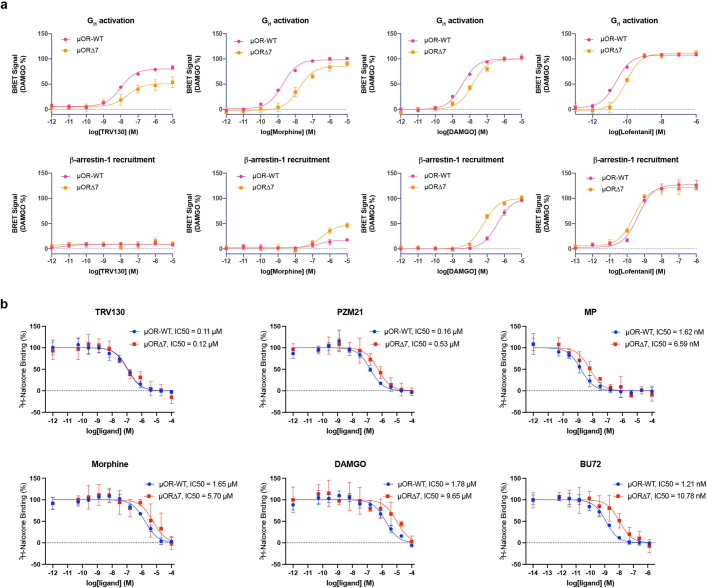
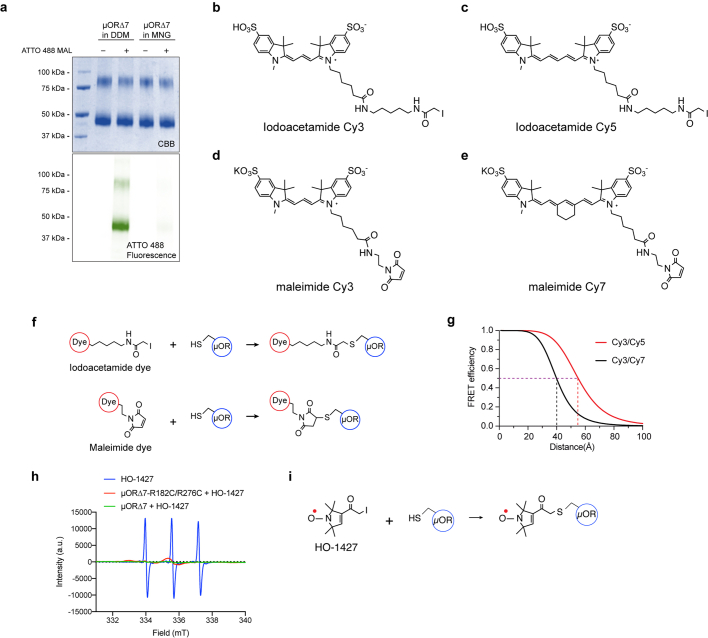
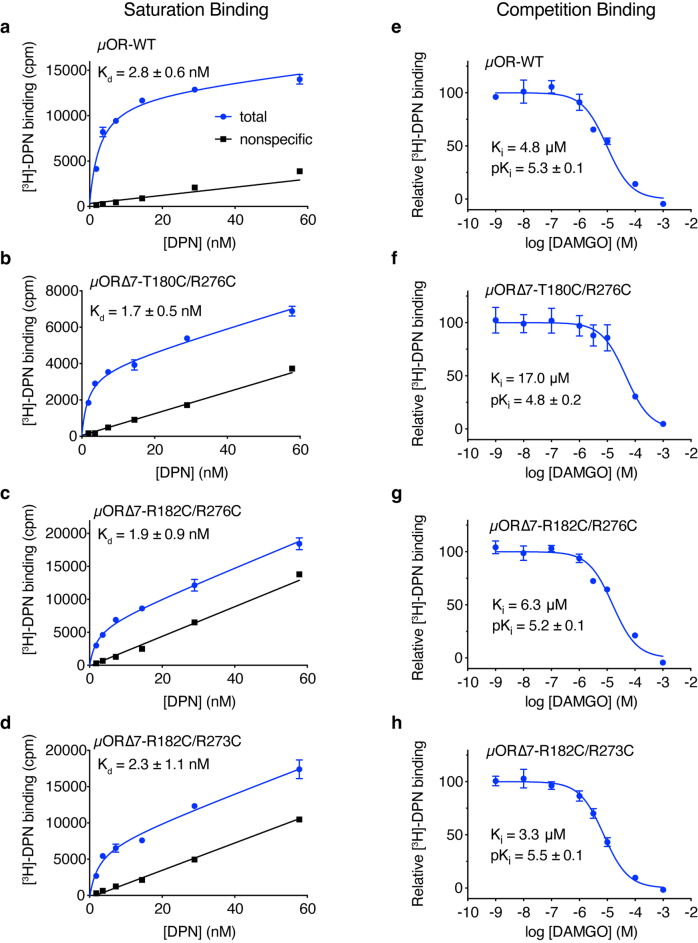
To label the µOR site-specifically with fluorophores or nitroxide spin labels, we first generated a minimal-cysteine µOR construct (µOR∆7), in which seven solvent-exposed cysteines were mutated to Ser, Thr, Ala or Leu, depending on the individual local environment (Extended Data Fig. 1). The µOR∆7 construct showed preserved function compared with the wild-type µOR in TRUPATH and ligand-binding assays (Extended Data Fig. 2). Furthermore, when reconstituted in lauryl maltose neopentyl glycol (LMNG) micelles, the purified µOR∆7 construct showed negligible background labelling of the remaining cysteines by the fluorophore (maleimide ATTO 488) or the nitroxide spin label HO-1427 (Extended Data Fig. 3). Two additional cysteine residues were introduced to the intracellular sides of TM4 and TM6 to create labelling sites for derivatization with spin-label or fluorophore reagents. The cysteine mutations did not significantly alter agonist or antagonist binding properties of the µOR (Extended Data Fig. 4). For DEER studies, µOR∆7(R182C/R276C) was derivatized with HO-1427 (creating µOR-HO-1427) (Extended Data Fig. 3i and Supplementary Fig. 2), a novel nitroxide spin label that combines the structures of two well-characterized spin labels, iodoacetamide proxyl and methanethiosulfonate spin label. HO-1427 generates a spin-label side chain characterized by reduced dynamics and a stable, non-reducible thioether bond25. For most smFRET studies, we labelled µOR∆7(R182C/R273C) and µOR∆7(T180C/R276C) with iodoacetamide-conjugated Cy3 and Cy5 fluorophore pair (Cy3/Cy5) and maleimide-conjugated Cy3 and Cy7 fluorophore pair (Cy3/Cy7), respectively, creating µOR–Cy3/Cy5 and µOR–Cy3/Cy7 (Extended Data Fig. 3b–g). Cy3/Cy5 and Cy3/Cy7 dye pairs exhibit different Förster radii (approximately 55 Å and 40 Å, respectively26), around which they are most sensitive to distance changes and the combination of both enables us to detect a large range of inter-dye distance changes with high sensitivity (Extended Data Fig. 3g).
Extended Data Fig. 1. Snake plot of the µOR sequence.
Cysteine residues in yellow indicate native cysteine that were kept in the labeling constructs. Residues in green indicate native cysteine that is mutated to corresponding residues to avoid nonspecific labeling by cysteine reactive labeling reagent. Residues in red indicate labeling sites that are mutated to cysteine for labeling with cysteine-reactive fluorophores and nitroxide spin labels.
Extended Data Fig. 2. Function validation of minimal-cysteine µOR (µOR∆7).
a, Ligand efficacy of µOR∆7 is determined by BRET-based assays. Error bars represent s.d. from n = 6 samples. b, Ligand-binding affinity of µOR∆7 is determined by radioligand binding assay. The cell membrane of sf9 cells expressing µOR-WT or µOR∆7 was extracted and used for competition binding. The hot ligand is 3H-naloxone. Error bars represent s.d. from n = 4 samples.
Extended Data Fig. 3. Minimal cysteine µOR (µOR∆7) shows minor nonspecific labeling by fluorophore or nitroxide spin label.
a, µOR∆7 purified in LMNG detergent shows almost no labeling by maleimide ATTO 488 as compared to µOR∆7 in DDM. 3 biological repeats were examined by UV-Vis spectrophotometry and showed similar labeling behavior. For demonstration, one sample was further examined through the gel. CBB, Coomassie Brilliant Blue staining. For gel source data, see Supplementary Fig. 8. b-c, Structures of iodoacetamide Cy3 (b) and Cy5 (c) that were made in-house using NHS-Cy3 and Cy5 from Lumiprobe. d-e, Structures of maleimide Cy3 (d) and Cy7 (e) that are commercially available from Lumiprobe. f, Labeling reactions of the µOR by cysteine-reactive iodoacetamide dye or maleimide dye. g, FRET efficiencies of Cy3/Cy5 and Cy3/Cy7 pairs as a function of inter-dye distances calculated based on R0 values, 55 Å and 40 Å for Cy3/Cy5 and Cy3/Cy7 pairs, respectively. h, Continuous-wave Electron Paramagnetic Resonance (CW-EPR) spectrum for HO-1427 labeled µOR∆7 (green) shows minimal labeling as compared to the same amount of free HO-1427 (blue) and HO-1427 labeled µOR∆7-R182C/R276C (red). i, Labeling reaction of the µOR by of HO-1427.
Extended Data Fig. 4. Radioligand binding of wild-type µOR (µOR-WT) and labeling constructs using sf9 insect cell membranes.
a–d, Saturation binding. e–h, Competition binding. Error bars represent the s.e.m from triplicate measurements. ± indicates s.e.
DEER reveals TM6 conformational heterogeneity
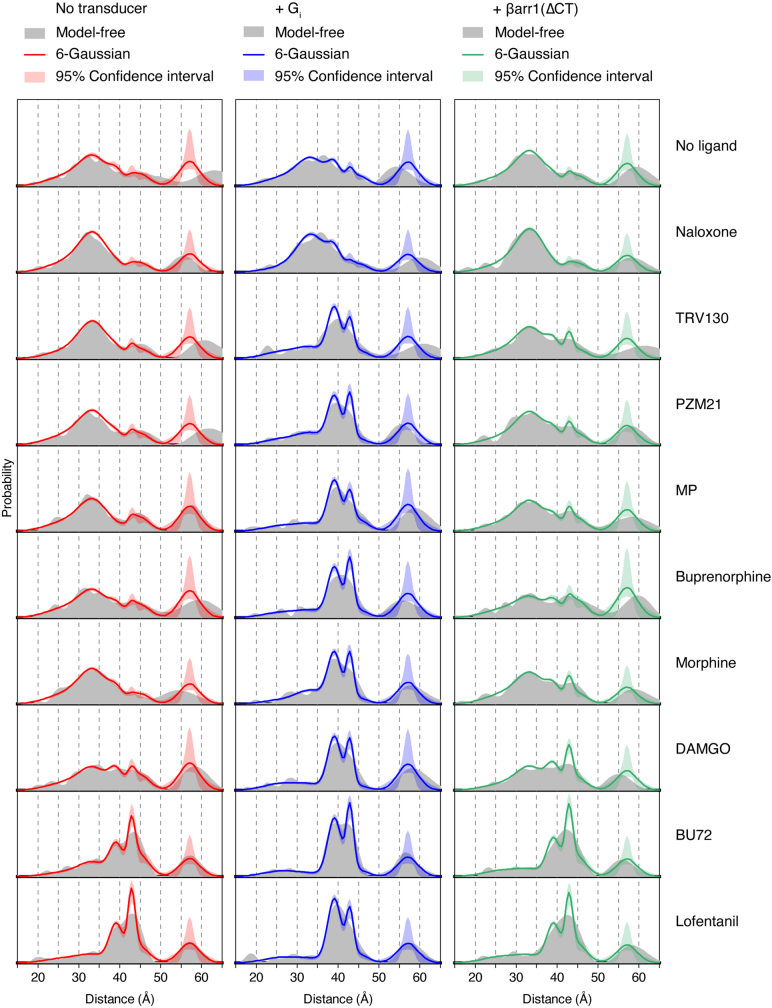
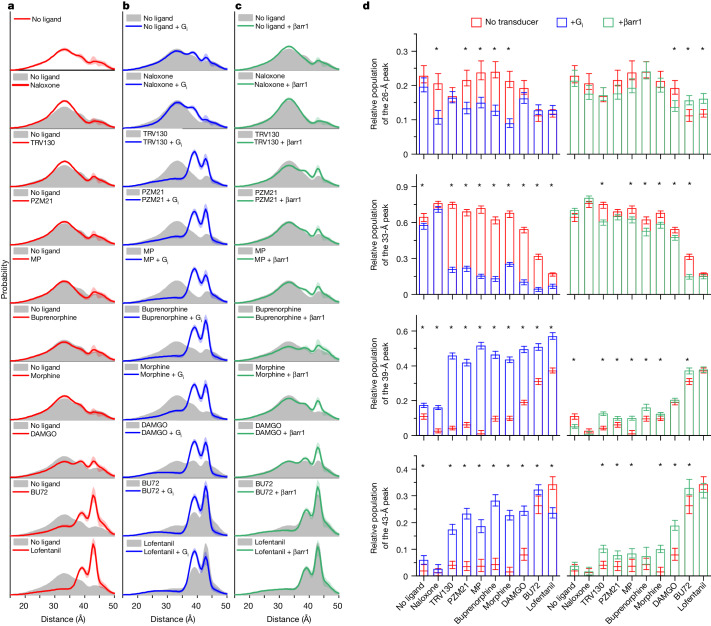
We examined TM4–TM6 distances of µOR by DEER under saturating ligand conditions and in the absence or presence of transducers (nucleotide-depleted) Gi or β-arrestin-1. Generic multi-Gaussian global fitting of the combined DEER data suggests a mixture of 6 Gaussians as the most parsimonious model describing the full datasets including all 30 conditions (Methods, Extended Data Fig. 5 and 6 and Supplementary Fig. 3). The resulting distance distributions and the populations (integrated areas) of the individual distance peaks are shown in Fig. 2. The two longest distances (45 Å and 57 Å) were excluded from the population analysis, since their populations were not correlated to the populations of other distance peaks (Extended Data Fig. 7) as expected for a ligand-dependent conformational equilibrium. These two distance peaks are likely to represent oligomeric or nonfunctional receptor populations.
Extended Data Fig. 5. Gaussian model selection for DEER was based on global AICc and BIC values.
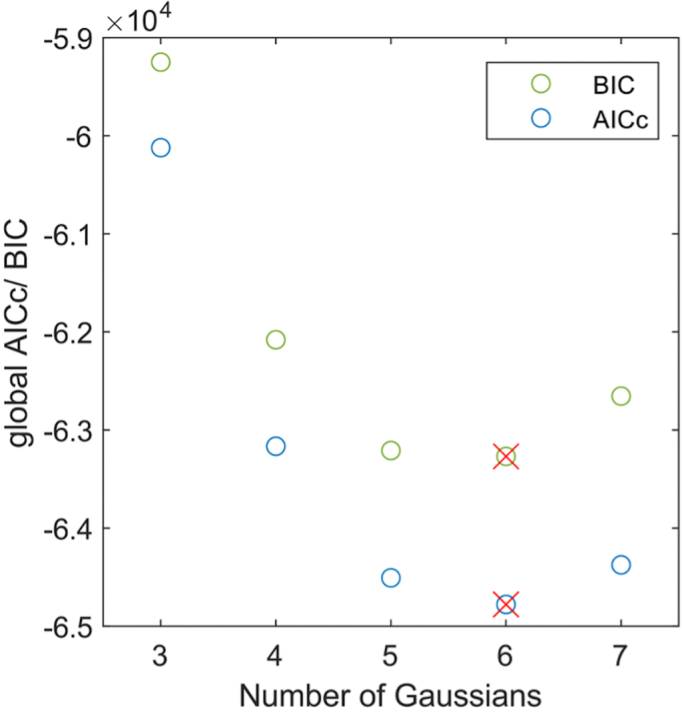
Both AICc and BIC values yield minimum values for six Gaussians (red cross) which was chosen as most parsimonious model.
Extended Data Fig. 6. DEER distance distributions of the µOR using a model-free analysis vs the 6-Gaussian global fitting.
.
Fig. 2. Ligand- and transducer-dependent µOR conformational heterogeneity characterized by DEER.
a, Distance distributions of spin-labelled µOR under different ligand conditions. b, Distance distributions in the presence of ligand and Gi. c, Distance distributions of phosphorylated µOR (µORp) in the presence of ligand and pre-activated β-arrestin-1 (βarr1). a–c, Shaded areas along the line indicate 95% confidence interval. d, Gaussian populations centred around 26 Å, 33 Å, 39 Å and 43 Å. Data represent median population ± 95% confidence interval derived from bootstrapping analysis using n = 1,000 iterations. Populations marked with asterisks have non-overlapping confidence intervals in the presence and absence of transducer.
Extended Data Fig. 7. Correlation analysis of DEER populations.
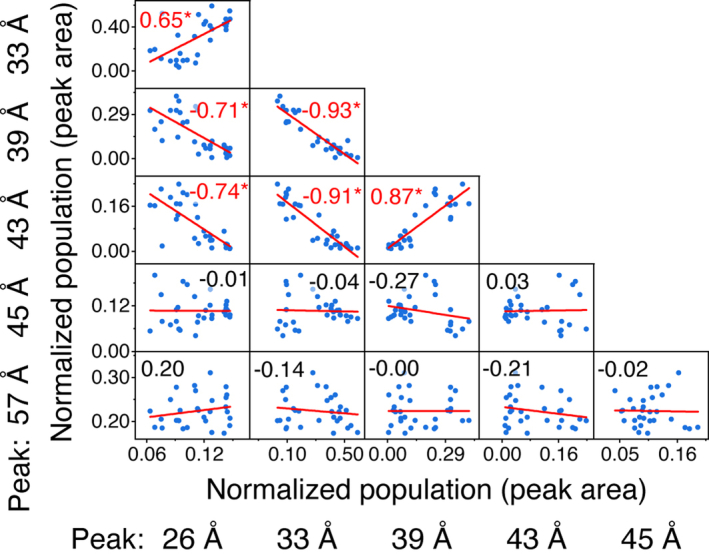
Populations from 6 Gaussian peaks of 30 DEER datasets are shown as scatter plot. Each blue dot represents one of the 30 samples. Red lines are the results of a linear fit. Numbers in each subpanel are corresponding correlation coefficients, which are labeled by a star (*) and red color if p < 0.05.
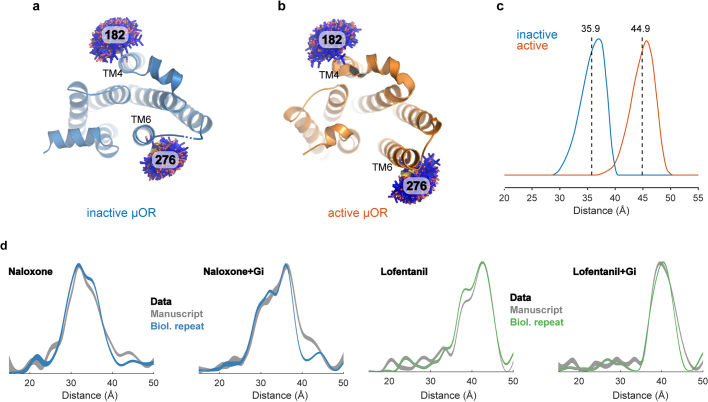
Comparison with high-resolution structures suggests that the 33-Å peak represents a conformation with TM6 in an inactive, inward position, whereas the population of the 43-Å peak exhibits an outward tilted TM6, thus representing an active conformation (Extended Data Fig. 8). Correlation analysis revealed that populations around 26 Å and 33 Å, as well as those at 39 Å and 43 Å, are highly correlated (P < 0.05), dividing each, the inactive and active states, into two conformations (Extended Data Fig. 7). We refer to the inactive conformations centred around 26 Å and 33 Å as R1 and R2, and to the active conformations centred around 39 Å and 43 Å as R3 and R4. Previous DEER studies and molecular dynamics simulations of the β2-adrenergic receptor (β2AR) suggest that R1 and R2 represent inactive conformations with an intact and broken TM3–TM6 hydrogen bond, respectively27–29.
Extended Data Fig. 8.
Modeling of spin-labeled µOR. a,b, HO-1427 labeled µOR was modeled using mtsslWizard and the inactive (a) and active (b) µOR structures. c, Distance distributions between 182 in TM4 and 276 in TM6 derived from (a) and (b). Dashed lines indicate average distances. d, Biological repeats for four selected ligand and transducer conditions.
Modulation of conformational heterogeneity
According to its antagonistic properties in cellular assays, naloxone only weakly stabilized inactive R2 at the cost of the active R3 conformation (Fig. 2d). Instead, super-efficacy agonists BU72 and lofentanil quantitatively stabilized the active conformations R3 and R4 (Fig. 2a,d). Surprisingly, in the presence of low-efficacy G-protein-biased agonists (TRV130, PZM21, MP and buprenorphine) the TM4–TM6 distance remained mostly in the inactive R1 and R2 conformations, suggesting that μOR regions other than TM6 control G-protein efficacy of these ligands (Fig. 1c). Binding of DAMGO, an analogue of the endogenous opioid met-enkephalin that is commonly used as the reference full agonist for the μOR, caused a small but significant population shift towards R3 and R4, in agreement with the higher efficacy of DAMGO compared with low-efficacy agonists. However, the discrepancy between the amount of the active conformations R3 and R4 (approximately 25%) and efficacy (100%) suggests that structural changes other than TM6 outward tilt are sufficient for permitting productive Gi and β-arrestin-1 engagement.
Further evidence for R3 and R4 representing active conformations came from experiments in the presence of transducers, since Gi as well as β-arrestin-1 bound and stabilized both conformations (Fig. 2b–d). G-protein binding clearly revealed the class of G-protein-biased ligands (TRV130, PZM21 and MP) for which large fractions of active R3 and R4 were observed, with a slight preference for stabilizing R3. For ligand-free and naloxone-bound μOR, the Gi-induced population shifts were much smaller. In the presence of the super-efficacious agonists BU72 and lofentanil, R3 and R4 were already dominant in the absence of a transducer, and the population shift from R4 to R3 confirmed preferential Gi binding to R3, at least under the chosen experimental conditions. The effect of β-arrestin-1 binding was much less pronounced: for non-biased agonists morphine and DAMGO, the most significant β-arrestin-1-induced population shifts were observed towards R4—however, β-arrestin-1 binding in the presence of G-protein-biased ligands was promiscuous towards R3 and R4 (Fig. 2c). In summary, the transducer-induced population shifts towards R3 and R4 reflect the ability of bound ligand to stabilize specific transducer-binding conformations and thus their signalling bias towards G protein or β-arrestin-1.
Ligand-specific conformational dynamics of μOR
To further investigate potential structural and functional differences between individual μOR conformations, we performed smFRET experiments. smFRET has been used to capture the conformational dynamics of β2AR30,31, metabotropic glutamate receptor dimer32 and β-arrestin33,34 in reconstituted systems or in cell membranes. We used an experimental design similar to that previously reported for β2AR30 and showed that smFRET of labelled µOR, despite the lower spatial resolution compared to DEER, provides access to protein dynamics and enables tight control of transducer and nucleotide conditions (Fig. 3a). Some ligand conditions had to be excluded from smFRET analysis: ligand-free μOR proved to be unstable under smFRET conditions, and the controlled substances buprenorphine, morphine and lofentanil were not available in China, where the smFRET experiments were performed.
Fig. 3. SmFRET experiments of the µOR bound to different ligands.
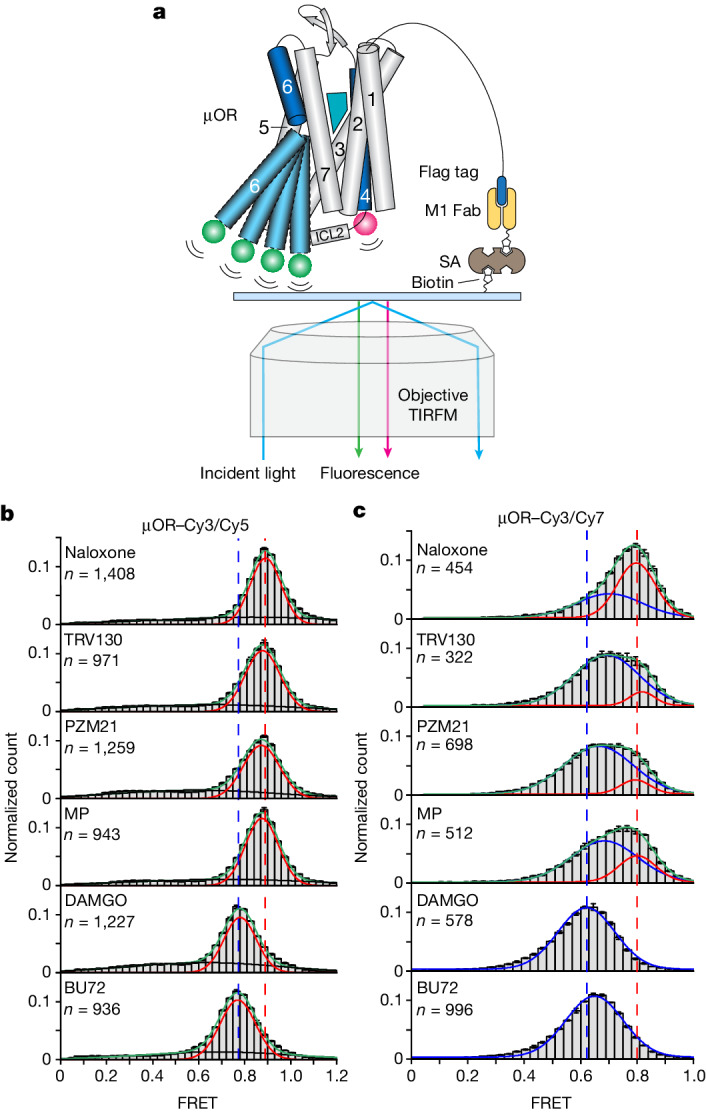
a, Schematic of single-molecule FRET experiment. Labelled µOR was tethered to a cover slip via its Flag tag, biotinylated M1 Fab, streptavidin (SA) and biotinylated PEG. TIRFM, total internal reflection fluorescence microscopy. b,c, SmFRET distributions of µOR–Cy3/Cy5 (b) and µOR–Cy3/Cy7 (c) in the presence of different ligands. Gaussian peaks were fitted to FRET states (red and blue) and background noise (black). Green lines represent the cumulative fitted distributions. Dashed lines in blue and red represent peak centres of naloxone- and DAMGO-bound samples, respectively (n represents the number of fluorescence traces used to calculate the corresponding histograms). Data are mean ± s.d. from three repeats.
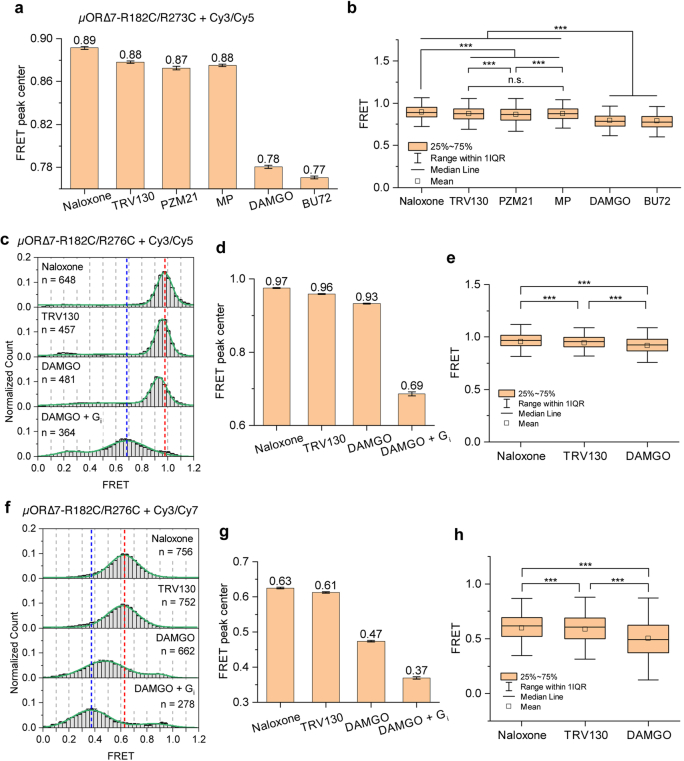
All smFRET distributions recorded for Cy3 and Cy5-labelled µOR (µOR–Cy3/Cy5) could be described by one main Gaussian distribution (Fig. 3b) and a broad, ligand-independent distribution that probably represents noise. The position of the dominant fluorescence resonance energy transfer (FRET) peak was clearly ligand-dependent, which indicates that the time resolution (100 ms) was insufficient to resolve the transitions between at least two μOR conformations with distinct donor–acceptor distances. This resulted in time-averaged FRET efficiencies scaled by the populations of the underlying conformations (Supplementary Fig. 4a). The time-averaged FRET efficiencies were still able to distinguish the different ligands, as FRET efficiency progressively shifted from 0.89 to 0.77 in the presence of agonists of increasing efficacy, indicating an increase in the time-averaged fluorophore distance. Even though the difference in FRET peak centres between the antagonist naloxone and low-efficacy, G-protein-biased agonists TRV130, PZM21 and MP was small (Fig. 3b and Extended Data Fig. 9a), the average FRET values showed significant differences (P < 0.001; Extended Data Fig. 9b), indicating a small shift of the conformational equilibrium of µOR towards more open, active conformations in the presence of G-protein-biased agonists and full activation for DAMGO and BU72.
Extended Data Fig. 9. FRET peak centers and average FRET values of fluorophore-labeled µOR.
a,b, µOR∆7-R182C/R273C is labeled with Cy3/Cy5. c–e, µOR∆7-R182C/R276C is labeled with Cy3/Cy5. f–h, µOR∆7-R182C/R276C is labeled with Cy3/Cy7. FRET distributions of µOR∆7-R182C/R276C labeled with Cy3/Cy5 (c) and Cy3/Cy7 (f). Error bars in c and f indicate s.d. from 3 repeats. FRET peak centers of µOR∆7-R182/R273 + Cy3/Cy5 (a, related to Fig. 3b), µOR∆7-R182/R276 + Cy3/Cy5 (d), and µOR∆7-R182/R276 + Cy3/Cy7 (g). The numbers on each bar are the peak centers extracted from the Gaussian fitting. Error bars indicate standard errors of the fitting. FRET values of each frame of µOR samples in Fig. 3b (b), Extended Data Fig. 9c (e), and Extended Data Fig. 9f (h) are plotted as box-and-whisker plots. IQR, inter qaurtile range. The number of traces of each condition is indicated in the corresponding histograms. FRET efficiencies between 0.6 and 1.2 (b and e) and between 0 and 1.2 (h) were used for one-way ANOVA Tukey’s test. ***, p < 0.001. n.s., not significant.
We also recorded smFRET data using the µOR–Cy3/Cy7 construct, whose fluorophore pair exhibits a shorter Förster radius than the Cy3 and Cy5 fluorophore pair (Extended Data Fig. 3g), and was attached to slightly altered labelling sites on μOR, using different labelling chemistry (Extended Data Fig. 10). Notably, for naloxone and the low-efficacy ligands TRV130, PZM21 and MP, the µOR–Cy3/Cy7 construct was able to resolve two well-separated FRET distributions, revealing a conformational exchange with an exchange rate slow enough to be captured by our smFRET setup (Fig. 3c). The high-FRET distribution was stably centred around 0.8 (blue), and dominant in the presence of antagonist naloxone and thus reflects an inactive conformation. The population of the low-FRET state (red) increased with G-protein efficacy of bound ligand, such that for the high-efficacy agonist DAMGO and the super-efficacy agonist BU72, only a low-FRET signal was observed. Further, the low-FRET distribution showed a ligand-dependent centre position below 0.7, indicating a time-averaged conformational equilibrium, similar to what we observed for µOR–Cy3/Cy5 (Fig. 3b, red).
Extended Data Fig. 10. Labeling sites of µOR for nitroxide spin HO-1427 and different fluorophore pairs.
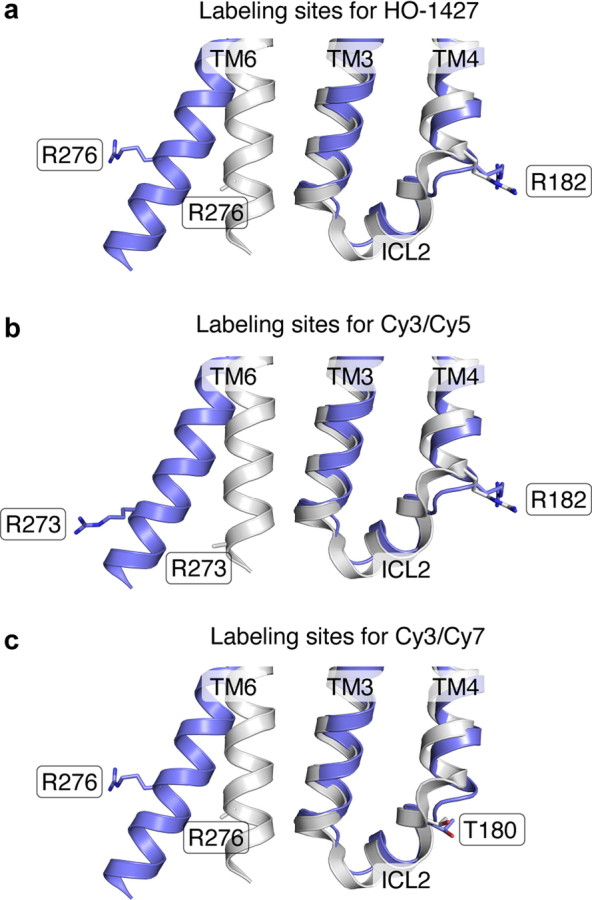
Inactive µOR structure (in grey, PDB code 4DKL) and G protein-coupled active µOR structure (in blue, PDB code 6DDF) are superimposed. Transmembrane 1, 2, 5, and 7 are hidden for clarity. a, Arg182C and Arg276C were labeled by HO-1427. b, Arg182C and Arg273C were labeled by Cy3/Cy5 pair. c, Tyr180C and Arg276C were labeled by Cy3/Cy7 pair. Sidechains of Arg273 and Arg276 were not modeled in the published inactive structure (PDB 4DKL).
We interpret these smFRET results as the superposition of two conformational changes: receptor-activating structural changes occurring on a fast timescale (<100 ms) lead to a ligand-dependent centre position of the associated FRET state observed with both constructs. This is in accordance with reports for other GPCRs, for which activation rates between 0.3–40 ms have been reported28,35–37. Additionally, and only observable using the µOR–Cy3/Cy7 construct, we identified a slow conformational transition (>100 ms). The underlying structural change reflects a prerequisite of G-protein binding or activation, as it clearly distinguishes μOR bound to naloxone from G-protein-biased ligands. We tentatively assign this slow conformational change to a structural transition in intracellular loop 2 (ICL2), which represents a critical receptor segment for G-protein binding and activation38–40 and for which different conformations have been observed in high-resolution structures41. µOR–Cy3/Cy7 includes a labelling site at the C-terminal end of ICL2 (Extended Data Fig. 10c) and localized structural changes at equivalent site have been detected in a DEER study investigating ligand binding to the type 1 angiotensin II receptor40 (AT1R). However, another possible interpretation for the slow conformational change includes a rotation of TM6, which represents a structural prerequisite of TM6 outward movement42,43. In any case, our smFRET findings complement our DEER results monitoring TM4–TM6 distances, in which DAMGO and G-protein-biased agonists had only a small or no significant effect on the populations of active receptor species. Cy3/Cy5- and Cy3/Cy7-labelled µOR∆7(R182C/R276C), the same construct used in our DEER measurements (Extended Data Fig. 9c–h), displayed the similar trend of FRET changes in the presence of a series of ligands. However, µOR∆7(R182C/R276C)–Cy3/Cy7 is unable to resolve two FRET states shown in µOR∆7(R180/R276)–Cy3/Cy7 in the presence of low-efficacy ligands (Fig. 3c). This finding supports our assignment that these two FRET states reflect a slow conformational change of ICL2. Moving one labelling site from T180 to R182, thus away from ICL2, depletes the sensitivity towards local motions of ICL2. We attribute the discrepancy between smFRET and DEER to the long-linker fluorophores that may amplify the rotational conformation change and/or local conformational change to a linear distance change compared with the short spin labels (Extended Data Fig. 10).
Conformational dynamics of µOR with G protein
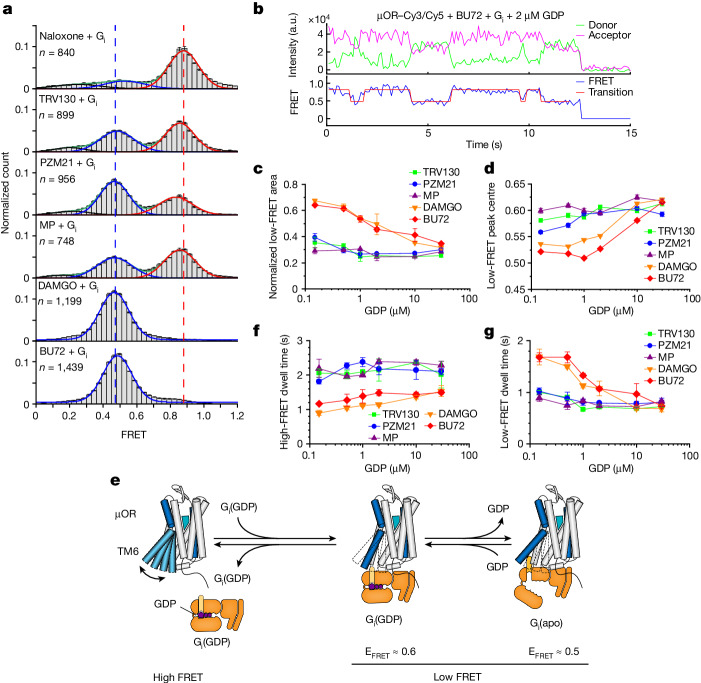
To investigate the role of µOR conformational changes for transducer binding and nucleotide exchange, we examined µOR–Cy3/Cy5 in the presence of ligands and transducer. We chose µOR–Cy3/Cy5 over µOR–Cy3/Cy7 because of the higher signal-to-noise ratio of single-molecule fluorescence trajectories during these experiments to unambitiously characterize dynamic transitions between G-protein-bound and G-protein-unbound μOR. Compared with the active conformation stabilized by ligands alone (FRET efficiency of around 0.77; Fig. 3b), G-protein binding, upon depletion of nucleotide GDP using apyrase, led to a reduction in FRET efficiency to around 0.5 (Fig. 4a, blue and Supplementary Fig. 4b). This marked decrease may be owing to a direct interaction of G protein and fluorophore. The population of the low-FRET peak showed the same MP → TRV130 → PZM21 → DAMGO and BU72 progression as observed for ligand efficacy (Fig. 1) and is thus interpreted as nucleotide-free µOR–Gi complex. The high-FRET peak (Fig. 4a, red) showed the same peak positions observed in the absence of G protein (Fig. 3b), and is thus interpreted as time-averaged equilibrium of active and inactive µOR conformations not bound to G protein. A third, ligand-independent and broad FRET distribution (Fig. 4a, black), is assumed to represent noise. Of note, the observation of two well-separated FRET peaks (centred around 0.5 and 0.8), representing G-protein-bound and G-protein-unbound μOR, respectively, provides the opportunity to apply a two-state hidden Markov Model44 and to describe μOR complex formation and signal transfer in more detail. To this end, only traces that had at least one transition between high-FRET and low-FRET states during the course of the experiment were selected, thus enabling us to selectively analyse those μOR molecules involved in G-protein binding.
Fig. 4. Structural dynamics of the µOR in the presence of Gi and GDP.
a, smFRET distributions of µOR–Cy3/Cy5 in the presence of different ligands and Gi, followed by treatment of apyrase to remove GDP. Red, blue and black lines represent Gaussians fitted to high-FRET, low-FRET and nonfunctional states, respectively. Green lines represent the cumulative fitted distributions. Dashed lines indicate high-FRET peak centre of naloxone sample (red) and low-FRET peak centre of the BU72 sample (blue), respectively. n represents the number of fluorescence traces used to calculate the corresponding histograms. Data are mean ± s.e.m. from three repeats. b, Exemplary smFRET traces of µOR–Cy3/Cy5 and analysis via a two-state hidden Markov model. a.u., arbitrary units. c, Area of the low-FRET peak at increasing GDP concentrations. Data are mean ± s.d. from two biological repeats. d, Low-FRET peak position with increasing GDP concentrations. Frames of low-FRET state identified by a two-state hidden Markov Model were extracted and binned to plot histograms. FRET histograms were further fitted to Gaussians and the peak centres are plotted. Error bars represent the standard error of fitting. e, Schematic of a simplified reaction model of G-protein coupling. f, Dwell time of the high-FRET state. g, Dwell time of the low-FRET state. f,g, Data are mean ± s.d. from two biological repeats.
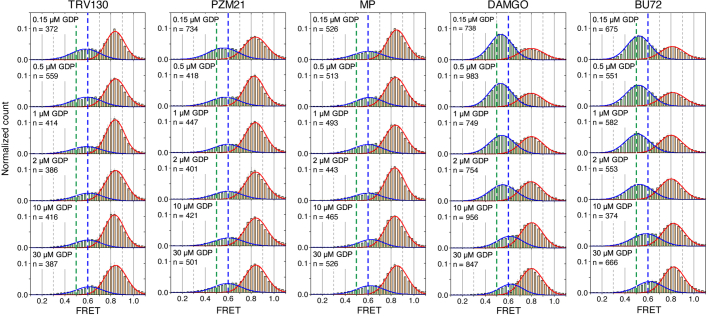
To characterize conformational dynamics of GDP-bound and nucleotide-free forms of μOR–Gi complex, we recorded smFRET time traces at different concentrations of GDP (Fig. 4b and Supplementary Fig. 5). We found that for high- and super-efficacy agonists DAMGO and BU72 the low-FRET peak population was reduced with increasing GDP concentrations (Fig. 4c and Extended Data Fig. 11), indicating dissociation of the μOR–Gi•GDP complex and reestablishment of the time-averaged, ligand-bound μOR state (Fig. 3b). For these two ligands, we also observed a shift of the low-FRET peak from around 0.5 to 0.6 with increasing GDP concentration (Fig. 4d), and we assign the 0.6 low-FRET state to the complex of active µOR with GDP-bound Gi as opposed to the nucleotide-free complex at around 0.5 (Fig. 4e). Similar smFRET changes were described to occur transiently for GDP-bound Gs interacting with β2AR30. In contrast to the high-efficacy and super-efficacy agonists, the 0.6 FRET state was dominant for low-efficacy G-protein-biased agonists at all GDP concentrations, indicating increased stability of the GDP-bound μOR–Gi complex for these ligands (Fig. 4d and Extended Data Fig. 11).
Extended Data Fig. 11. FRET histogram of high and low FRET states.
FRET traces in the presence of 20 µM Gi, increasing concentrations of GDP, and ligand of TRV130, PZM21, MP, DAMGO, or BU72 were analyzed using a two-state hidden Markov Model. Only traces with at least one transition were selected. Frames of high-FRET and low-FRET states were extracted separately and binned to plot histograms. FRET histograms of high FRET (bars in orange) and low FRET (bars in green) states are shown and fitted to Gaussians (solid curves in red and blue, respectively). FRET efficiencies at 0.5 and 0.6 are highlighted with dashed lines in green and blue, respectively. n, number of fluorescence traces used to calculate the corresponding histograms. Error bars represent s.e.m. from 2 repeats.
On the basis of previous studies30,45, we used a simplified, three-state model of G-protein binding to active μOR (Fig. 4e) for the evaluation of the dwell-time distributions of high- and low-FRET states (Supplementary Figs. 6 and 7). The dwell-time distributions of the high-FRET state were adequately described by mono-exponentials indicating a single rate-limiting step of G-protein binding (Supplementary Fig. 6). The resulting high-FRET dwell times are shown in Fig. 4f and indicate that the rate of G-protein binding is largely independent of GDP for all ligands. However, for DAMGO and BU72, both of which quantitatively stabilized the μOR–Gi complex in the absence of nucleotide (Fig. 4a), overall shorter high-FRET dwell times indicate faster binding of Gi to µOR compared with low-efficacy G-protein-biased agonists (Fig. 4f). The rates of G-protein binding scaled with the amount of active µOR, as identified by smFRET in the absence of G protein (Fig. 3b,c).
The dwell-time distributions of the low-FRET state are associated with two low-FRET states at 0.6 and 0.5 FRET, reflecting the GDP-bound and nucleotide-free μOR–Gi complex, respectively (Fig. 4e). Correspondingly, for all ligands, the low-FRET dwell-time distributions were best described using biexponential decay curves (Supplementary Fig. 7), and for simplicity, we calculated a weighted average of low-FRET dwell times for each condition to represent the overall stability of the μOR–Gi complex (Fig. 4g). At a physiological GDP concentration of 30 µM, low-FRET dwell times for all ligands were very similar. At low GDP concentration and only in the presence of high-efficacy agonists DAMGO and BU72, longer low-FRET dwell times indicated a higher stability of the nucleotide-free μOR–Gi complex. Together, these results show that G-protein-biased agonists do not lower GDP affinity to Gi as much as high-efficacy and super-efficacy agonists, which, in combination with slower Gi binding (Fig. 4f), manifests in their lower efficacy.
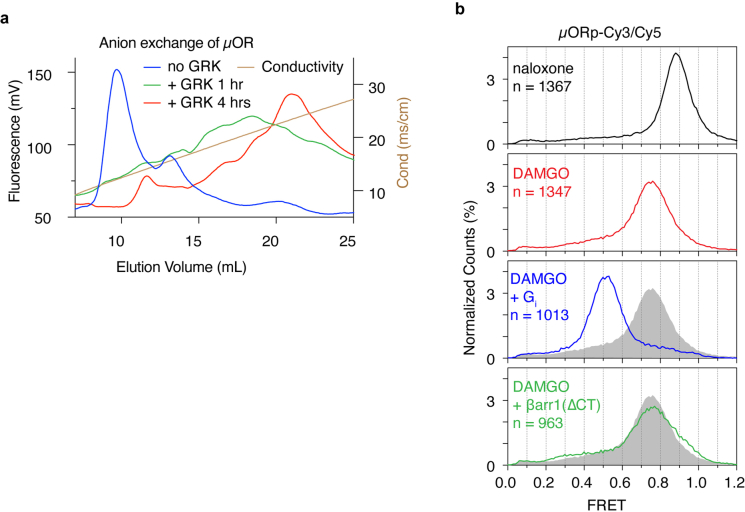
Similar to the results of our DEER experiments, which showed only subtle population shifts due to β-arrestin-1 binding to µORp (Fig. 2c), the smFRET distributions of µORp–Cy3/Cy5 show very little effect in response to β-arrestin-1 binding (Extended Data Fig. 12). These data support the current understanding of a promiscuous, low-affinity interaction of the arrestin finger loop with active GPCR conformations and suggests the necessity of this ‘core engagement’ for stabilization of an active, low-FRET conformation46.
Extended Data Fig. 12. Effect of β-arrestin-1 on smFRET distribution of phosphorylated µOR-Cy3/Cy5.
a, Phosphorylation of µOR∆7-182 C/276 C by GRK5 for DEER spectroscopy. Anion exchange chromatography (MonoQ) was used to find the best condition for GRK5 phosphorylation of the µOR. b, smFRET distributions of GRK5-phosphorylated µOR∆7-182 C/273C-Cy3/Cy5 (µORp-Cy3/Cy5) in the presence of 20 µM of C8-PIP2. The grey shaded areas are the DAMGO alone condition for comparison.
Conclusion
The present study reveals differences in the structure and dynamics of μOR bound to functionally diverse ligands and the effects of these differences on receptor catalytic activity and stability of the receptor–transducer complex. Our findings characterize the molecular underpinnings of Gi activation and β-arrestin-1 recruitment and provide insight into the mechanism of super-efficacy agonism, which cannot be understood on the basis of static X-ray and cryo-electron microscopy structures alone. Previous studies using NMR spectroscopy, molecular dynamics simulations, and DEER indicate that the conformational dynamics of GPCRs, especially in the TM5, TM6, TM7, ICL1, ICL2 and H8 domains40,47–49, have important roles in functional selectivity of GPCRs. Our results reveal the conformational heterogeneity of TM6 and that both fast and slow conformational dynamics of TM6 and ICL2 are differentially modulated by distinct ligands.
We performed DEER experiments, which highlight the conformational heterogeneity of µOR and how the ensemble of conformations is modulated by ligands with distinct functions. For low-efficacy G-protein-biased agonists we did not observe significant populations of receptor in the canonical ‘active’ conformation, which includes the outward tilt of TM6. However, the addition of the transducers Gi and β-arrestin-1 clearly revealed that these ligands ‘pre-activate’ the receptor, thereby facilitating transducer binding. Additionally, DEER was able to resolve two active conformations of TM6, for which our results suggest distinct G-protein affinities. In accordance with existing studies, binding of β-arrestin-1 to the intrahelical transducer binding site of µORp (core interaction) is more promiscuous and occurs with lower affinity.
The discrepancy between the canonical active receptor population observed in DEER and ligand efficacy, which is especially apparent for DAMGO, suggests that TM6 movement alone does not define receptor activity. We used smFRET as a complementary method as it provides access to rates of conformational interconversion, which have been implicated as ‘kinetic controls’ of G-protein binding or activation in other GPCRs37,50. The specific properties of the chosen fluorophores and receptor-labelling sites prove vital for capturing activating conformational changes at the intracellular receptor surface that correlate with the efficacy of bound ligand. Our data revealed a slow conformational change with an exchange dwell time of more than 100 ms connected to receptor pre-activation, a structural change that distinguishes μOR bound to the antagonist naloxone and low-efficacy G-protein-biased agonists, which is a potentially rate-limiting step for G-protein and β-arrestin binding and signalling. Experiments conducted in the presence of G protein and various concentrations of nucleotide GDP enabled the identification of the GDP-bound and nucleotide-free ternary complexes and how their formation is modulated by the nature of bound ligand. Even though ‘pre-activated’ μOR may bind G protein efficiently enough to cause signalling, fully activated μOR, as present in high- and super-efficacy bound µOR, couples to Gi at twice the rate. Moreover, once the ternary complex is formed, high-efficacy and super-efficacy agonists lower the affinity towards GDP substantially, thereby driving GDP release and G-protein activation. Low-efficacy, G-protein-biased agonists lead to a slower release of GDP and large fractions of the complex remain GDP-bound. Thus, the rate of G-protein binding and GDP release are both ligand-controlled via modulation of the conformational ensemble involving inactive, pre-activated and fully activated species. Instead, binding of β-arrestin-1 to the receptor core relies on formation of the canonical, fully activated receptor conformation as binding of low-efficacy, G-protein-biased agonists promotes formation of the μOR–β-arrestin-1 complex only weakly, whereas we observed greater changes for the more efficacious morphine and DAMGO. Of interest, when bound to lofentanil and BU72, μOR exists mostly in the active conformations, in agreement with their high efficacy for recruitment of β-arrestin-1; however, since no significant change in the DEER distributions was observed upon the addition of β-arrestin-1, we cannot conclude that it actually bound.
In sum, this study provides insights into μOR functional selectivity and super-efficacy, based on the coexistence and differential population of inactive and active conformations exchanging on fast or slow timescales. Moreover, it emphasizes the importance of solution-state, biophysical studies for the characterization of GPCR–ligand–transducer signalling, as we report experimental evidence for important intermediate conformations that are responsible for G-protein functional selectivity. These findings suggest potential approaches for the design of therapeutic agents with fewer adverse effects, that target sparsely populated conformational states that have evaded detection by high-resolution structural biology methods. The need for such therapies is imminent for the opioid receptor subfamily, but intermediate conformations with functional selectivity properties have been reported for other GPCRs40, and thus this approach may be generalizable for other targets.
Methods
µOR expression and purification
The wild-type Mus musculus µOR (6-398) with an N-terminal HA signal sequence followed by a Flag tag and a C-terminal 8×His tag was cloned in the pFastBac1 vector. The minimal-cysteine construct (µOR∆7) was created by introducing the mutations51 C13S, C22S, C43S, C57S, C170T, C346A and C351L into the wild-type µOR. Double-cysteine mutation constructs (µOR∆7(R182C/R276C) for DEER, µOR∆7(T180C/R276C) and µOR∆7(R182C/R273C) for smFRET experiments) were generated based on the µOR∆7 construct. The µOR was expressed and purified following a previous protocol13 with some modifications. The µOR was expressed in Sf9 insect cells (Expression Systems, authenticated by supplier, not tested for mycoplasma) using Bac-to-Bac baculovirus systems with 10 µM naloxone. Cells were collected 48 h post infection and were lysed in a buffer of 10 mM Tris pH 7.5, 1 mM EDTA, 100 µM TCEP, 10 µM naloxone, 160 µg ml−1 benzamidine and 2.5 µg ml−1 leupeptin. The receptor was extracted from the Sf9 membrane using buffer of 20 mM HEPES pH 7.5, 500 mM NaCl, 0.7% N-dodecyl-β-d-maltoside (DDM), 0.3% CHAPS, 0.03% cholesteryl hemisuccinate (CHS), 30% (v/v) glycerol, 5 mM imidazole, 2 mM MgCl2, 160 µg ml−1 benzamidine, 2.5 µg ml−1 leupeptin, 10 µM naloxone, 100 µM TCEP and 2 µl benzonase in the cold room for 1 h. After centrifugation, Ni-NTA resin was added to the supernatant in a 500-ml centrifuge tube (Corning) and rotated for 2 h at 4 °C. Ni-NTA resin was washed in batch with washing buffer of 20 mM HEPES pH 7.5, 500 mM NaCl, 0.1% DDM, 0.03% CHAPS, 0.03% CHS, 5 mM imidazole and 10 µM naloxone and protein was eluted in washing buffer supplemented with 250 mM imidazole. Ni-NTA eluate was supplemented with 2 mM CaCl2 and loaded onto anti-Flag M1 resin (Millipore-Sigma) for further purification. The detergent was exchanged to LMNG on a Flag column by gradually increasing the proportion of the exchange buffer (20 mM HEPES pH 7.5, 100 mM NaCl, 0.5 LMNG, 0.05% CHS, 2 mM CaCl2 and 10 µM naloxone) over the Ni-NTA washing buffer supplemented with 2 mM CaCl2 at room temperature for 1 h. The µOR was finally eluted with buffer of 20 mM HEPES pH 7.5, 100 mM NaCl, 0.01% LMNG, 0.001% CHS, 5 mM EDTA, 0.2 mg ml−1 Flag peptide and 10 µM naloxone. After concentrating with a 4-ml 100-kDa cutoff concentrator (Amicon Ultra), the µOR was further purified by size-exclusion chromatography (SEC) using an SD200 increase 10/300 column (GE Healthcare) equilibrated with SEC buffer of 20 mM HEPES pH 7.5, 100 mM NaCl, 0.01% LMNG, 0.001% CHS and 10 µM naloxone. Fractions containing monomeric µOR were collected and concentrated with a 500-µl 100-kDa cutoff concentrator (Amicon Ultra). The µOR was supplemented with 15% (v/v) glycerol and flash frozen in liquid nitrogen.
Gi heterotrimer expression and purification
DNA for the human Gαi1 was cloned into the pFastBac1 vector. DNA of human Gβ1 with an N-terminal 6×His tag and HRV 3C protease cleavage site (LEVLFQGP) and Gγ2 were cloned into the vector of pFastBac Dual under the promoter of ph and p10, respectively. P2 viruses of Gαi1 and Gβ1γ2 were generated following the same protocol for the µOR. Gi1 heterotrimer was expressed in Hi5 cells (Expression Systems, authenticated by supplier, not tested for mycoplasma) with 4 ml P2 of Gαi1 and 10 ml P2 of Gβ1γ2 per liter cells when cells reached a density of 3 million per ml. Cells were collected 48 h post infection and kept in −80 °C freezer until use.
Cell pellets were thawed in lysis buffer (10 mM Tris pH 7.5, 1 mM MgCl2, 5 mM β-mercaptoethanol (β-ME), 10 µM GDP, 160 µg ml−1 benzamidine, 2.5 µg ml−1 leupeptin). After centrifugation, pellets were solubilized in solubilization buffer (20 mM HEPES pH 7.5, 100 mM NaCl, 1% sodium cholate, 0.05% LMNG, 5 mM MgCl2, 20 mM imidazole, 5 mM β-ME, 10 µM GDP, 160 µg ml−1 benzamidine, 2.5 µg ml−1 leupeptin) and were stirred in a cold room for 1 h. After centrifugation at 14,000 rpm for 20 min, the supernatant was mixed with Ni-NTA resin and rotated at 4 °C for 1 h. Ni-NTA resin was then washed four times in batch with solubilization buffer. Detergent was exchanged to LMNG on the Ni-NTA column by gradually increasing LMNG concentration at room temperature. Protein was eluted with elution buffer (20 mM HEPES pH 7.5, 50 mM NaCl, 0.01% LMNG, 2 mM MgCl2, 5 mM β-ME, 10 µM GDP, 180 mM imidazole). The His tag was cleaved by 1:50 (w/w) HRC 3 C protease. Gi1 was treated with 5 µl of λ protein phosphatase and was dialysed against dialysis buffer (20 mM HEPES pH 7.5, 50 mM NaCl, 0.01% LMNG, 2 mM MgCl2, 2 mM MnCl2, 5 mM β-ME, 10 µM GDP) overnight at 4 °C to remove imidazole. The His tag and contaminates were removed by loading Gi1 onto 2-ml Ni-NTA resin. Flow-through of Ni-NTA resin was loaded onto a MonoQ column and Gi1 was further purified by anion exchange. The Gi1 heterotrimer peak was collected and concentrated. After being supplemented with 15% glycerol, Gi1 was flash froze and kept in −80 °C freezer. For DEER samples, ion-exchange purified Gi1 was further injected onto an SD200 increase 10/300 column (GE Healthcare) equilibrated with SEC buffer (20 mM HEPES pH 7.5, 100 mM NaCl, 0.01% LMNG, 2 mM MgCl2 and 10 µM GDP). SEC fractions were pooled, concentrated to 336 µM and flash frozen.
GRK5 expression and purification
Human GRK5 DNA with a C-terminal 6×His tag was cloned into pFastBac1 vector. P2 virus was generated following the same protocol of the µOR. GRK5 was expressed in Sf9 insect cells with 25 ml of P2 virus and was collected 48 h after infection. Purification of GRK5 was performed on ice or at 4 °C. Cells were lysed in lysis buffer (20 mM HEPES pH 7.5, 150 mM NaCl, 20 mM imidazole, 5 mM β-ME, 160 µg ml−1 benzamidine, 2.5 µg ml−1 leupeptin) by sonication on ice. Cell debris was removed by centrifuge at 14,000 rpm for 20 min. GRK5 in supernatant was purified by Ni-NTA resin using wash buffer (20 mM HEPES pH 7.5, 150 mM NaCl, 20 mM imidazole, 5 mM β-ME). Protein was eluted in wash buffer supplemented with 160 mM imidazole. GRK5 was concentrated and injected in an SD200 increase 10/300 column equilibrated with cold SEC buffer (20 mM HEPES pH 7.5, 300 mM NaCl) in cold room. SEC fractions of GRK5 were pooled, concentrated and flash frozen.
β-Arrestin-1 expression and purification
To investigate the conformational changes of the µOR in the presence of β-arrestin-1, a C-terminal truncated β-arrestin-1 was used for smFRET and DEER measurements. The long splice variant of human, cysteine-free (C59V/C125S/C140L/C150V/C242V/C251V/C269S), truncated β-arrestin-1 (1-382) (βarr1(∆CT))52 with an N-terminal 6×His and HRV 3 C site was in vector of pET15b and was transformed into BL21 (DE3) competent cells. Escherichia coli cells were cultured in TB medium with 100 µg ml−1 ampicillin until OD600 reached 1.2 at 37 °C in a shaker at 220 rpm. The temperature was decreased to 18 °C and protein expression was induced with 200 µM IPTG for 16 h. Purification of βarr1(∆CT) was performed on ice or at 4 °C. Cells were collected and sonicated in buffer 1 (20 mM Tris 8.0 (25 °C), 300 mM NaCl, 20 mM imidazole) supplemented with 160 µg ml−1 benzamidine and 2.5 µg ml−1 leupeptin. After centrifugation, protein in the supernatant was incubated with Ni-NTA resin at 4 °C for 1 h. The Ni-NTA resin was extensively washed with buffer 1, then was further washed with 3 column volumes of buffer 2 (20 mM Tris 8.0 (25 °C), 50 mM NaCl and 20 mM imidazole). βarr1(∆CT) was eluted with buffer 2 supplemented with 160 mM imidazole. βarr1(∆CT) was loaded onto a Source 15Q 4.6/100 PE anion-exchange column (GE Healthcare). The column was washed with 2 column volumes of buffer A (20 mM Tris 8.0 (25 °C), 50 mM NaCl), and βarr1(∆CT) was eluted with 15 column volumes of a linear gradient from 0 to 30% buffer B (20 mM Tris 8.0 (25 °C), 1 M NaCl). The peak fractions were pooled and supplemented with NaCl to a final concentration of 300 mM, which prevented the protein from precipitating when concentrated to high concentration in the following step. The protein was concentrated and injected in an SD200 increase 10/300 column equilibrated with SEC buffer of 20 mM HEPES pH 7.5, 300 mM NaCl. For DEER samples, SEC buffer was made in D2O, and βarr1(∆CT) was concentrated to 986 µM and flash frozen.
Phosphorylation of µOR
The µOR was purified following the standard µOR purification protocol except that the naloxone was replaced with 10 µM DAMGO on the anti-Flag M1 resin and SEC purification procedures. 4 µM of µOR∆7(R182C/R276C) purified in the presence of DAMGO was incubated in phosphorylation buffer of 20 mM HEPES pH 7.5, 35 mM NaCl, 5 mM MgCl2, 100 µM TCEP, 20 µM 1,2-dioctanoyl-sn-glycero-3-phospho-(1′-myo-inositol-4′,5′-bisphosphate) (C8-PIP2), 0.01% LMNG, 0.001% CHS and 100 µM DAMGO at room temperature for 1 h. ATP and GRK5 were then added to the reaction to a final concentration of 1 mM and 0.8 µM, respectively, and incubated for 1 h before more GRK5 was added. GRK5 was added every 1 h four times in total and the reaction was kept at room temperature.
To evaluate the phosphorylation level and make sure it reaches completion using ion-exchange chromatography, 12 µl of the phosphorylation reaction containing about 50 picomoles of µOR at different time points was removed and diluted to 200 µl using the buffer of 20 mM Tris pH 8.0 (25 °C), 50 mM NaCl, 0.01% LMNG, 5 mM EDTA and 10 µM naloxone. The samples were then injected onto a MonoQ (5/50) anion-exchange column (GE Healthcare) equilibrated with buffer A of 20 mM Tris 8.0 (25 °C), 50 mM NaCl, 0.01% LMNG and 10 µM naloxone. The column was washed with 1 column volumes of buffer A, and then with 40 column volumes of a linear gradient from 0 to 40% buffer B of 20 mM Tris 8.0 (25 °C), 1 M NaCl, 0.01% LMNG and 10 µM naloxone at room temperature. Protein elution was monitored by a fluorescence detector (Shimadzu) with excitation at 280 nm and emission at 340 nm (Extended Data Fig. 12a).
After the 4-h incubation with GRK5, the reaction was diluted by tenfold with the wash buffer of 20 mM HEPES pH 7.5, 100 mM NaCl, 0.01% LMNG, 0.001% CHS, 2 mM CaCl2 and 10 µM naloxone before loading onto 3 ml M1 resin. The M1 resin was washed with 30 ml of the wash buffer at room temperature for 30 min. The µOR was finally eluted using elution buffer of 20 mM HEPES pH 7.5, 100 mM NaCl, 10 µM naloxone, 5 mM EDTA and 0.2 mg ml−1 Flag peptide. After concentration, the µOR was further injected onto an SD200 increase 10/300 column equilibrated with SEC buffer of 20 mM HEPES pH 7.5, 100 mM NaCl, 0.01% LMNG, 0.001% CHS and 10 µM naloxone. Fractions containing monomeric µOR were collected and concentrated with a 500-µl 100-kDa cutoff concentrator (Amicon Ultra). The µOR was supplemented with 15% (v/v) glycerol and flash frozen in liquid nitrogen.
Fluorophore synthesis
Iodoacetamide-conjugated Cy3 and Cy5 fluorophores were synthesized following a previous protocol30. In brief, 1 µmol of sulfo-Cyanine3 NHS ester or sulfo-Cyanine5 NHS ester (Lumiprobe) was dissolved in 500 μl dry dimethyl sulfoxide (DMSO). It was then added dropwise to a solution of 50 μl cadaverine in 500 μl of dry DMSO at room temperature. The reaction solution was stirred at room temperature for 5 min, then poured into 15 ml of 5% formic acid in ethyl acetate. The precipitate was collected and purified by high-performance liquid chromatography using 10 mM triethylammonium acetate pH 7.0 aqueous buffer (solvent A) with 100% acetonitrile (solvent B) as the mobile phase. The product fraction was dried using a rotary evaporator. The resulting pure fluorophore–cadaverine compound was then dissolved in 1 ml dry DMSO. N,N-diisopropylethylamine (100 μl) was added to this solution, followed by 1 mg iodoacetic acid NHS ester. The reaction solution was stirred at room temperature for 15 min and then poured into 15 ml ethyl acetate. The precipitate was collected and purified by high-performance liquid chromatography.
Synthesis of HO-1427
The bromo derivative53 (261 mg, 1.0 mmol) (HO-559) was dissolved in acetone (20 ml) and NaI (300 mg, 2 mmol) was added. The reaction mixture was refluxed for 1 h then evaporated. The residue was dissolved in ethyl acetate/diethyl ether (50:50, 20 ml) and washed with brine (2 × 10 ml). The organic phase was dried (MgSO4), filtered, evaporated and purified with flash chormatography (hexane:diethyl ether) yielding yellow crystals 230 mg (74%); melting point: 132–134 °C; retention factor (Rf) = 0.4 (hexane:ethyl acetate 2:1); Elemental analysis calculated for C10H15INO2 (Mw: 308.1) C: 38.98; H: 4.91; N: 4.55%; measured: C: 39.02; H: 4.78; N: 4.61%; IR (cm−1): 1665, 1615; MS (EI, m/z,%): 308 (8), 294 (6), 278 (6), 151 (100), 136 (8), 109 (52), 43 (61).
The melting point was measured with a Boetius micro melting point apparatus. The infrared (IR) spectrum was obtained using a Bruker Alpha FT-IR instrument with an attenuated total reflectance support on a diamond plate. The mass spectrum was recorded on a Shimadzu GCMS-2020 spectrometer in electron ionization (EI) mode (70 eV). The elemental analysis was performed on a Fisons EA 1110 CHNS instrument. Flash column chromatography was performed on Merck Kieselgel 60 (0.040–0.063 mm) column. Qualitative thin layer chromatography (TLC) was carried out on commercially available plates (20 cm × 20 cm × 0.02 cm) coated with Merck Kieselgel.
µOR labelling with fluorophores
Minimal-cysteine µOR with cysteine mutations on TM4 and TM6, namely µOR∆7(T180C/R276C) and µOR∆7(R182C/R273C), was labelled by commercial maleimide-conjugated sulfo-Cy3 and sulfo-Cy7 (Lumiprobe) or by home-made iodoacetamide-conjugated Cy3 and Cy5, respectively. SEC purified µOR was diluted to 10 µM in 20 µl of labelling buffer (50 mM HEPES pH 7.5, 100 mM NaCl, 0.01% LMNG, 0.001% CHS, 10 µM naloxone). 30 µM of donor fluorophore and 60 µM of acceptor fluorophore were added into the reaction. After incubation at 20 °C for 30 min, free dyes were quenched with 10 mM l-cysteine. The reaction was then loaded onto a home-packed desalt column filled with 2-ml G50 resin (Sigma) equilibrated with the desalt buffer (20 mM HEPES pH 7.5, 100 mM NaCl, 0.01% LMNG, 0.001% CHS, 15% glycerol). Fractions containing µOR were pooled, aliquoted and flash frozen. The concentration of µOR was approximately 500 nM.
µOR labelling with nitroxide spin label
To make samples of the µOR alone or in complex with G protein for DEER studies, SEC purified µOR∆7(R182C/R276C) without phosphorylation was diluted to 20 µM in labelling buffer (20 mM HEPES pH 7.5, 100 mM NaCl, 0.01% LMNG, 0.001% CHS, 10 µM naloxone). Nitroxide spin label reagent HO-1427 was added to a final concentration of 400 µM. After incubation at room temperature for 3 h, the reaction was quenched with 5 mM l-cysteine and was injected into an SD200 increase 10/300 column equilibrated with SEC buffer (20 mM HEPES pH 7.5, 100 mM NaCl, 0.01% LMNG, 0.001% CHS, 2 mM CaCl2 in D2O). Fractions of the monodisperse peak were pooled and equally divided into ten 1.5-ml tubes. The protein was diluted fourfold with SEC buffer. Ligands were added to each tube at a final concentration of 1 mM for naloxone, TRV130, PZM21, MP, buprenorphine, and morphine, 400 µM for DAMGO, 200 µM for lofentanil, and 500 µM for BU72. One tube of protein was kept without ligand. The µOR and ligand were incubated at room temperature for 2 h. Protein in each individual tube was concentrated and split into two parts, one of which was mixed with 20% (v/v) D8-glycerol, transferred to a capillary, and flash frozen. The other part was mixed with a threefold molar excess of Gi1, which was purified in D2O buffer, and incubated for 30 min at room temperature. 1:100 apyrase (v/v, NEB) was added to the G-protein samples to remove free GDP and incubated for 1 h at room temperature. The G-protein samples were then mixed with 20% (v/v) D8-glycerol, transferred to capillaries and flash frozen.
To make samples in complex with βarr1(∆CT) for DEER studies, µORp∆7(R182C/R276C) was labelled with HO-1427 following a similar protocol above. SEC fractions were pooled and equally divided into 10× 1.5-ml tubes. The protein was diluted fourfold with D2O dilution buffer of 20 mM HEPES pH 7.5, 100 mM NaCl, 0.01% LMNG, 0.001% CHS, 5 µM C8-PIP2, and respective ligand at a final concentration as indicated above. The µOR was incubated with ligand for 2 h at room temperature. Protein was then concentrated, mixed with a fourfold molar excess of βarr1(∆CT) that was in D2O buffer, and incubated at room temperature for 1 h. The samples were then mixed with 20% (v/v) D8-glycerol, transferred to capillaries and flash frozen.
Single-molecule FRET experiments and analysis
All smFRET experiments were performed at 25 °C following previous protocol with some modifications54. In brief, single-molecule FRET studies were performed on a home-built objective-type TIRFM microscope, based on a Nikon Eclipse Ti-E with an EMCCD camera (Andor iXon Ultra 897), and solid-state 532 nm excitation lasers (Coherent Inc. OBIS Smart Lasers). Fluorescence emission from the probes was collected by the microscope and spectrally separated by interference dichroic (T635lpxr, Chroma) and bandpass filters, ET585/65 m (Chroma, Cy3) and ET700/75 m (Chroma, Cy5), in a Dual-View spectral splitter (Photometrics). No bandpass filter was used for Cy7 in the Dual-View spectral splitter. The hardware was controlled and smFRET movies were collected using Cell Vision software (Beijing Coolight Technology).
The µOR was immobilized on the cover slip via biotinylated M1 Fab and streptavidin. In brief, the assembled glass chamber, which had been cleaned and passivated with biotin-polyethylene glycol, was incubated with 0.05 mg ml−1 streptavidin in 20 mM HEPES 7.5, 100 mM NaCl. One minute later, the unbound streptavidin was washed out by 25 nM biotinylated M1 Fab in incubation buffer (50 mM HEPES pH 7.5, 100 mM NaCl, 0.01% LMNG, 0.001% CHS, 2 mM CaCl2, 5 mM MgCl2 and 100 µM ligand). The biotinylated M1 Fab was incubated in the channel for one minute and the unbound M1 Fab was washed out by incubation buffer. The N-terminal Flag-tagged, fluorophore-labelled µOR was diluted to around 20 nM in incubation buffer and incubated on ice for 1 h before measurement. The µOR was diluted to about 1 nM and injected into the chamber. The unbound µOR was removed by imaging buffer (incubation buffer + 50 nM protocatechuate-3,4-dioxygenase (PCD), 2.5 mM protocatechuic acid (PCA), 1.5 mM aged Trolox, 1 mM 4-nitrobenzyl alcohol (NBA), 1 mM cyclooctatetraene (COT)). Movies were taken at a frame rate of 10 s−1 using the Cell Vision software. For measurement in complex with GDP-free Gi1, 20 nM µOR in the presence of 100 µM ligand was incubated with 20 µM Gi1 for 30 min followed by addition of 1:100 (v/v, NEB) apyrase. After incubation on ice for 1 h, the complex was diluted and injected into the chamber and measured following the same protocol above. For measurement in the presence of Gi1 and GDP, the surface-immobilized µOR was incubated with imaging buffer, then 20 µM Gi1 and various concentrations of GDP in imaging buffer were injected into the chamber and imaged. For measurement in the presence of βarr1(∆CT), the phosphorylated, Cy3/Cy5-labelled µOR was diluted to about 20 nM in arrestin buffer (50 mM HEPES pH 7.5, 100 mM NaCl, 0.01% LMNG, 0.001% CHS, 2 mM CaCl2, 5 mM MgCl2 and 100 µM ligand, 20 µM C8-PIP2), and 90 µM βarr1(∆CT) was added. After incubation on ice for 1 h, the µOR was diluted to 1 nM in arrestin buffer with βarr1(∆CT) at a final concentration of 90 µM. After immobilization, unbound µOR was washed out with imaging buffer supplemented with 90 µM βarr1(∆CT) and movies were taken.
To extract the time trajectories of single-molecule fluorescence, collected movies were analysed by a custom-made software program developed as an ImageJ plugin (http://rsb.info.nih.gov/ij). Fluorescence spots were fitted by a 2D Gaussian function within a nine-pixel by nine-pixel area, matching the donor and acceptor spots using a variant of the Hough transform55. The background subtracted total volume of the 2D Gaussian peak was used as raw fluorescence intensity I.
Actual FRET efficiency was calculated via equation , where ID is raw fluorescence intensity of donor, IA is raw fluorescence intensity of acceptor, and χ is the cross-talk of the donor emission into the acceptor channel. γ accounts for the differences in quantum yield and detection efficiency between the donor and the acceptor and is calculated as the ratio of change in the acceptor intensity (ΔIA) to change in the donor intensity (ΔID) upon acceptor photobleaching56 (γ = ΔIA/ΔID). The χ was 0.05, and the γ was 1 and 0.2 for Cy3/Cy5 and Cy3/Cy7 dye pairs, respectively. FRET traces were picked by a custom-made Matlab script based on three criteria57: (1) signal-to-nose ratio of trances, which is defined as the mean of total intensity before photobleaching divided by its standard deviation, was higher than 4 and 3 for Cy3/Cy5 and Cy3/Cy7 dye pairs, respectively; (2) donor traces have single-step photobleaching; (3) traces last for at least 2 s. To calculate the transition rate in the presence of G protein and GDP, only traces that showed at least one high/low-FRET transition were selected and analysed by a Hidden Markov model-based software (HaMMy)44. Two FRET states were identified by HaMMy. The cumulative frequency count of high-FRET dwell times for each condition was fitted in Origin software to single exponential decay curves, generating high-FRET dwell time. The cumulative frequency count of low-FRET dwell times for each condition was fitted in Origin software to double exponential decay curves and the low-FRET dwell time was calculated as a weighted average accordingly.
DEER experiments and analysis
Setup
Four pulse, Q-band DEER data were collected at 50 K on a Bruker e580 equipped with a QT-II resonator and a 150 W TWT amplifier using the pulse sequence: π/2(νA) – τ1 – π(νA) – (τ1 + t) – π(νB) – (τ2 − t) – π(νA) – τ2 – echo, with τ1 = 300 ns, τ2 = 3.5 μs, Δt = 16 ns, 16-step phase cycling and a repetition time of 510 μs. The observer pulses (νA) were set to 18 ns and 36 ns for π/2 and π pulses, respectively, and applied 70 MHz below resonance. The 100 ns pump pulse (νB) was applied on resonance and consisted of a 50 MHz linear chirp pulse generated by an arbitrary waveform generator. We furthermore used an 8-step ESEEM suppression protocol. All experiments were implemented using Xepr v2.6b.163.
Analysis
DEER data were processed via Gaussian mixture models (GMM) implemented in Matlab (v.2019b) using the DEERlab toolbox (v.0.9.2)58. In brief, all 30 datasets (10× ligand only, 10× ligand + Gi, 10× ligand + β-arr) were analysed simultaneously assuming a variable number of two to seven Gaussians whose mean positions and widths (global fitting parameters) were constrained in the range of 20–100 Å, and 2–20 Å, respectively. For each individual condition the sum of populations (local fitting parameters) was normalized to 1. Each of the thirty datasets was allowed a unique modulation depth (range 0.3–0.7) and each transducer condition allowed for a unique receptor concentration in the range of 25–150 μM. Model-based distance distributions and background corrected dipolar kernels were calculated using DEERlab functions and fit simultaneously to all 30 datasets using the fitparamodel.m routine (Multistart = 10). Post hoc model selection was performed using the Akaike information criterion corrected (AICc) and the more restrictive Bayesian information criterion (BIC) which were both evaluated globally for all DEER datasets and both yielded 6 Gaussians as most parsimonious model. Error analysis using 1,000 bootstrap iterations was performed for all fitting parameters, the dipolar fits and the parametric distance distributions, and evaluated at the 95% confidence level. Significant population changes between different transducer conditions were determined by disjunct 95% confidence intervals and are marked with * (star).
Comparison of model-based and model-free analysis
As a control, we also analysed all DEER data using Tikhonov regularization (TR) and model-free based analysis in DEERlab and LongDistances (v.946; http://www.biochemistry.ucla.edu/Faculty/Hubbell/software.html). Regularization or smoothness parameters were determined via AICc and L-curve criterion, respectively. The results from both analyses were superimposable. For comparison, the distance distributions derived from the model-based (6 Gaussian) best fit and model-free DEERlab fits are shown in Extended Data Fig. 5. Both methods yield almost identical distance distributions and reveal all ligand or transducer-dependent distance changes supporting the validity of the model-based fit. Most apparent differences appear in the 35–45-Å distance range, where model-based analysis was able to differentiate two peaks, namely at 39 Å and 43 Å, of different width, namely 3.8 Å and 2 Å. This finding exemplifies one of the inherent advantages of the global, GMM-based fitting approach over Tikhonov regularization or model-free analysis. While Tikhonov regularization or model-free based analyses apply a single regularization or smoothness parameter to the full distance range, the chosen GMM allows different widths for individual distance peaks, as they may exist for different conformational states. Other advantages of the model-based approach include straightforward quantification of each population (Gaussian area) and a rigorous error analysis for each fitting parameter using covariance matrix or bootstrapping based approaches.
We conducted biological repeats for naloxone and lofentanil with and without G protein. These conditions represent the most distinct ligand/transducer conditions investigated and we observe good reproducibility. In particular, for both ligands, the smaller Gi-induced shifts are accurately reproduced (Extended Data Fig. 8d).
Radioligand binding
Membranes of Sf9 cells expressing µOR were used for saturation binding and competition binding. Saturation binding was performed by incubating Sf9 membrane with increasing concentrations of the antagonist [3H]diprenorphine (3H-DPN, Perkin Elmer) for 2 h at room temperature in 0.5 ml of binding buffer containing 50 mM Tris-HCl pH 7.5, 100 mM NaCl, 0.1% BSA. Nonspecific binding of 3H-DPN was measured by adding 10 µM naloxone in the binding reaction. To separate unbound 3H-DPN, binding reactions were rapidly filtered over GF/B Brandel filters. The filters were then washed three times with 5 ml ice-cold binding buffer. Radioactivity was assayed by liquid scintillation counting.
For competition binding with 3H-DPN, Sf9 cell membrane was incubated with 2.9 nM 3H-DPN and increasing concentrations of DAMGO in 0.5 ml of binding buffer. Binding reactions were incubated for 2 h at room temperature. The free ligand was separated by rapid filtration onto a GF/B Brandel filter with the aid of a 48-well harvester (Brandel). Radioactivity was assayed by liquid scintillation counting.
The resulting data were analysed using Prism 9.0 (GraphPad Software). The dissociation constant (Kd) of 3H-DPN was calculated by fitting the saturation data in a one-site (total and nonspecific binding) model. The Ki of DAMGO was calculated by fitting the competition binding data in a one-site (fit Ki) model.
For competition binding with [3H]naloxone, mouse µOR-containing insect cell membranes prepared above were diluted to normalize expression levels between wild-type (1:1,000) and minimal-cysteine mouse µOR (1:100) in 20 mM HEPES pH 7.4, 100 mM NaCl, and 0.05% BSA. Membranes were then incubated with 3 nM [3H]naloxone and serially-diluted orthosteric ligands at their respective final concentrations. Tested ligands were diluted into the buffer above to a final concentration of 100 µM with a fourfold serial dilution series for 10 total concentrations. The only exception is BU72, which was diluted to 1.3 µM final concentration before the same serial dilution. All ligands include independent ‘no ligand’ controls (100% binding) and excess cold naloxone (200 µM) controls (0% binding) to which points were normalized. The mixtures were shaken for 1 h at room temperature before collection onto Filtermat B (Perkin Elmer) and washed with cold binding buffer (20 mM HEPES pH 7.4, 100 mM NaCl). The filters were then dried at 60 °C before adding a sheet of MultiLex B/HS melt-on scintillator sheets (Perkin Elmer) and counts read on a MicroBeta Counter (Perkin Elmer). Quadruplicate data values were plotted and normalized as described above.
BRET-based assays with TRUPATH and arrestin signalling
The BRET-based assays were based on TRUPATH59 and arrestin signalling48. To measure µOR’s coupling with Gi1, HEK 293 T cells (ATCC CRL-3216, authenticated by the supplier, routinely tested for mycoplasma) were plated in 10 cm dishes at 3–4 million cells per dish in Dulbecco′s Modified Eagle′s Medium (DMEM) supplemented with 10% FBS. The next day, cell medium was replaced with fresh DMEM + 10% FBS medium. Cells were transfected 2 h later, using a 1:1:1:1 DNA ratio of receptor:Gα-RLuc8:Gβ1:Gγ2-GFP2 (500 ng per construct). Transit 2020 (Mirus Biosciences) was used to complex the DNA at a ratio of 3 µl Transit per µg DNA, in OptiMEM (Gibco-ThermoFisher) at a concentration of 10 ng DNA per µl OptiMEM. The next day, cells were collected from the plate using Versene (0.1 M PBS + 0.5 mM EDTA, pH 7.4) and plated in poly-d-lysine-coated white, clear-bottom 96-well assay plates (Greiner Bio-One) at a density of 50,000 cells in 200 µl culture medium (DMEM + 1% dialysed FBS) per well. The next day, white backings (Perkin Elmer) were applied to the plate bottoms, and growth medium was carefully aspirated and replaced immediately with 60 µl of assay buffer (1× Hank’s balanced salt solution (1× HBSS, Gibco), 20 mM HEPES, pH 7.4), supplemented with 5 µM (final concentration) coelenterazine 400a (Nanolight Technologies). After a 5 min equilibration period, cells were treated with 30 µl of drug (3×) prepared in assay buffer for an additional 5 min. Plates were then read in an LB940 Mithras plate reader (Berthold Technologies) with 395 nm (RLuc8-coelenterazine 400a) and 510 nm (GFP2) emission filters, at integration times of 1 s per well. Plates were read serially four times, and measurements from the fourth read were used in all analyses. BRET ratios were computed as the ratio of the GFP2 emission to RLuc8 emission.
To measure coupling of µOR coupling with β-arrestin-1, the procedures are mostly similar to those in BRET-G-protein assays except: HEK 293 T cells were co-transfected in a 1:5 ratio with µOR-Rluc8 and Venus–β-arrestin-1. Before the addition of tested drugs, white backings (Perkin Elmer) were applied to the plate bottoms, and growth medium was carefully aspirated and replaced immediately with 60 µl of assay buffer (1× HBSS, 20 mM HEPES, pH 7.4), supplemented with 5 µM (final concentration in assay buffer) coelenterazine h (Nanolight Technologies). After a 5 min equilibration period, cells were treated with 30 µl of drug (3×) prepared in assay buffer for an additional 5 min. Plates were then read in an LB940 Mithras plate reader (Berthold Technologies) with 485 nm (RLuc8-coelenterazine h) and 530 nm (Venus) emission filters, at integration times of 1 s per well. Plates were read serially four times, and measurements from the fourth read were used in all analyses. BRET ratios were computed as the ratio of the Venus emission to RLuc8 emission. The BRET ratio from G-protein or arrestin assays was plotted using nonlinear regression and Dose-response stimulation equation in Prism 9 (Graphpad).
Reporting summary
Further information on research design is available in the Nature Portfolio Reporting Summary linked to this article.
Online content
Any methods, additional references, Nature Portfolio reporting summaries, source data, extended data, supplementary information, acknowledgements, peer review information; details of author contributions and competing interests; and statements of data and code availability are available at 10.1038/s41586-024-07295-2.
Supplementary information
Supplementary Figs. 1–8.
Source data
Acknowledgements
The authors thank T. Kálai for providing the HO-1427 spin label reagent; S. Peng for assistance with smFRET data collection and analysis; and D. Hilger for assistance with cwEPR measurements and helpful discussion. Support for this study came from the following funding sources: the National Natural Science Foundation of China (Grants 21922704, 22061160466, and 22277063 to C.C.), the National Institutes of Health (Grants R01GM137081 to M.E. and R37DA036246 to B.K.K.), the Deutsche Forschungsgemeinschaft (DFG, Grant 421152132 to M.E.), the National Research Development and Innovation Office (Grant NKFI 137793 to C.P.S.), the Beijing Frontier Research Center for Biological Structure (to C.C.) and the Jules Stein endowed chair (to W.L.H.).
Extended data figures and tables
Author contributions
J.Z. designed and validated constructs of the µOR, performed radioligand binding assays, purified all the proteins, performed phosphorylation of the µOR, synthesized iodoacetamide Cy3 and Cy5, labelled the µOR for smFRET and DEER studies, collected and analysed smFRET data and wrote the manuscript. M.E. performed DEER experiments, data analysis and wrote the manuscript. E.S.O. prepared DEER samples with J.Z. C.P.S. designed HO-1427. A.E.D. conducted cell signalling assays. J.H. assisted with smFRET data collection and analysis. X.S. assisted with protein purification. E.W. performed radioligand binding assays. T.C. supervised the cell signalling assays and analysis. W.L.H. supervised DEER data collection and analysis. B.K.K. and C.C. supervised the overall project and wrote the manuscript. All authors contributed to the manuscript preparation.
Peer review
Peer review information
Nature thanks Martin Lohse, Olav Schiemann and the other, anonymous, reviewer(s) for their contribution to the peer review of this work. Peer review reports are available.
Data availability
All data are available in the manuscript or supplementary materials, or from the corresponding authors upon reasonable request. Raw DEER data are available at 10.5281/zenodo.10631251 (ref. 60). Materials described in this study are available upon a request sent to the corresponding authors. Source data are provided with this paper.
Competing interests
B.K.K. is a cofounder of and consultant for ConfometRx. The other authors declare no competing interests.
Footnotes
Publisher’s note Springer Nature remains neutral with regard to jurisdictional claims in published maps and institutional affiliations.
These authors contributed equally: Jiawei Zhao, Matthias Elgeti
Contributor Information
Matthias Elgeti, Email: matthias.elgeti@uni-leipzig.de.
Brian K. Kobilka, Email: kobilka@stanford.edu
Chunlai Chen, Email: chunlai@mail.tsinghua.edu.cn.
Extended data
is available for this paper at 10.1038/s41586-024-07295-2.
Supplementary information
The online version contains supplementary material available at 10.1038/s41586-024-07295-2.
References
- 1.Katzung, B. G. Basic & Clinical Pharmacology (LANGE McGraw Hill Medical, 2012).
- 2.Bohn LM, et al. Enhanced morphine analgesia in mice lacking β-arrestin 2. Science. 1999;286:2495–2498. doi: 10.1126/science.286.5449.2495. [DOI] [PubMed] [Google Scholar]
- 3.Raehal KM, Walker JKL, Bohn LM. Morphine side effects in β-arrestin 2 knockout mice. J. Pharmacol. Exp. Ther. 2005;314:1195–1201. doi: 10.1124/jpet.105.087254. [DOI] [PubMed] [Google Scholar]
- 4.DeWire SM, et al. A G protein-biased ligand at the μ-opioid receptor is potently analgesic with reduced gastrointestinal and respiratory dysfunction compared with morphine. J. Pharmacol. Exp. Ther. 2013;344:708–717. doi: 10.1124/jpet.112.201616. [DOI] [PubMed] [Google Scholar]
- 5.Manglik A, et al. Structure-based discovery of opioid analgesics with reduced side effects. Nature. 2016;537:185–190. doi: 10.1038/nature19112. [DOI] [PMC free article] [PubMed] [Google Scholar]
- 6.Váradi A, et al. Mitragynine/corynantheidine pseudoindoxyls as opioid analgesics with mu agonism and delta antagonism, which do not recruit β-Arrestin-2. J. Med. Chem. 2016;59:8381–8397. doi: 10.1021/acs.jmedchem.6b00748. [DOI] [PMC free article] [PubMed] [Google Scholar]
- 7.Schmid CL, et al. Bias factor and therapeutic window correlate to predict safer opioid analgesics. Cell. 2017;171:1165–1175.e13. doi: 10.1016/j.cell.2017.10.035. [DOI] [PMC free article] [PubMed] [Google Scholar]
- 8.Lambert D, Calo G. Approval of oliceridine (TRV130) for intravenous use in moderate to severe pain in adults. Br. J. Anaesth. 2020;125:e473–e474. doi: 10.1016/j.bja.2020.09.021. [DOI] [PMC free article] [PubMed] [Google Scholar]
- 9.Kliewer A, et al. Phosphorylation-deficient G-protein-biased μ-opioid receptors improve analgesia and diminish tolerance but worsen opioid side effects. Nat. Commun. 2019;10:367. doi: 10.1038/s41467-018-08162-1. [DOI] [PMC free article] [PubMed] [Google Scholar]
- 10.Kliewer A, et al. Morphine‐induced respiratory depression is independent of β‐arrestin2 signalling. Br. J. Pharmacol. 2020;177:2923–2931. doi: 10.1111/bph.15004. [DOI] [PMC free article] [PubMed] [Google Scholar]
- 11.Bachmutsky I, Wei XP, Durand A, Yackle K. β-arrestin 2 germline knockout does not attenuate opioid respiratory depression. eLife. 2021;10:e62552. doi: 10.7554/eLife.62552. [DOI] [PMC free article] [PubMed] [Google Scholar]
- 12.Gillis A, et al. Low intrinsic efficacy for G protein activation can explain the improved side effect profiles of new opioid agonists. Sci. Signal. 2020;13:eaaz3140. doi: 10.1126/scisignal.aaz3140. [DOI] [PubMed] [Google Scholar]
- 13.Manglik A, et al. Crystal structure of the µ-opioid receptor bound to a morphinan antagonist. Nature. 2012;485:321–326. doi: 10.1038/nature10954. [DOI] [PMC free article] [PubMed] [Google Scholar]
- 14.Huang W, et al. Structural insights into µ-opioid receptor activation. Nature. 2015;524:315–321. doi: 10.1038/nature14886. [DOI] [PMC free article] [PubMed] [Google Scholar]
- 15.Koehl A, et al. Structure of the µ-opioid receptor–Gi protein complex. Nature. 2018;558:547–552. doi: 10.1038/s41586-018-0219-7. [DOI] [PMC free article] [PubMed] [Google Scholar]
- 16.Qu, Q. et al. Insights into distinct signaling profiles of the µOR activated by diverse agonists. Nat. Chem. Biol.19, 423–430 (2023). [DOI] [PMC free article] [PubMed]
- 17.Liu X, et al. Structural insights into the process of GPCR–G protein complex formation. Cell. 2019;177:1243–1251.e12. doi: 10.1016/j.cell.2019.04.021. [DOI] [PMC free article] [PubMed] [Google Scholar]
- 18.Weis WI, Kobilka BK. The molecular basis of G protein–coupled receptor activation. Annu. Rev. Biochem. 2018;87:897–919. doi: 10.1146/annurev-biochem-060614-033910. [DOI] [PMC free article] [PubMed] [Google Scholar]
- 19.Okude J, et al. Identification of a conformational equilibrium that determines the efficacy and functional selectivity of the μ‐opioid receptor. Angew. Chem. Int. Ed. 2015;54:15771–15776. doi: 10.1002/anie.201508794. [DOI] [PMC free article] [PubMed] [Google Scholar]
- 20.Sounier R, et al. Propagation of conformational changes during μ-opioid receptor activation. Nature. 2015;524:375–378. doi: 10.1038/nature14680. [DOI] [PMC free article] [PubMed] [Google Scholar]
- 21.Hilger D, Masureel M, Kobilka BK. Structure and dynamics of GPCR signaling complexes. Nat. Struct. Mol. Biol. 2018;25:4–12. doi: 10.1038/s41594-017-0011-7. [DOI] [PMC free article] [PubMed] [Google Scholar]
- 22.Hellenkamp B, et al. Precision and accuracy of single-molecule FRET measurements—a multi-laboratory benchmark study. Nat. Methods. 2018;15:669–676. doi: 10.1038/s41592-018-0085-0. [DOI] [PMC free article] [PubMed] [Google Scholar]
- 23.Ibáñez LF, Jeschke G, Stoll S. DeerLab: a comprehensive software package for analyzing dipolar electron paramagnetic resonance spectroscopy data. Magn. Reson. 2020;1:209–224. doi: 10.5194/mr-1-209-2020. [DOI] [PMC free article] [PubMed] [Google Scholar]
- 24.Peter MF, et al. Cross-validation of distance measurements in proteins by PELDOR/DEER and single-molecule FRET. Nat. Commun. 2022;13:4396. doi: 10.1038/s41467-022-31945-6. [DOI] [PMC free article] [PubMed] [Google Scholar]
- 25.Elgeti M, Hubbell WL. DEER analysis of GPCR conformational heterogeneity. Biomolecules. 2021;11:778. doi: 10.3390/biom11060778. [DOI] [PMC free article] [PubMed] [Google Scholar]
- 26.Hink MA, Visser NV, Borst JW, van Hoek A, Visser AJWG. Practical use of corrected fluorescence excitation and emission spectra of fluorescent proteins in förster resonance energy transfer (FRET) studies. J. Fluoresc. 2003;13:185–188. doi: 10.1023/A:1022947411788. [DOI] [Google Scholar]
- 27.Dror RO, et al. Identification of two distinct inactive conformations of the β2-adrenergic receptor reconciles structural and biochemical observations. Proc. Natl Acad. Sci. USA. 2009;106:4689–4694. doi: 10.1073/pnas.0811065106. [DOI] [PMC free article] [PubMed] [Google Scholar]
- 28.Manglik A, et al. Structural Insights into the dynamic process of β2-adrenergic receptor signaling. Cell. 2015;161:1101–1111. doi: 10.1016/j.cell.2015.04.043. [DOI] [PMC free article] [PubMed] [Google Scholar]
- 29.Lerch MT, et al. Viewing rare conformations of the β2 adrenergic receptor with pressure-resolved DEER spectroscopy. Proc. Natl Acad. Sci. USA. 2020;117:31824–31831. doi: 10.1073/pnas.2013904117. [DOI] [PMC free article] [PubMed] [Google Scholar]
- 30.Gregorio GG, et al. Single-molecule analysis of ligand efficacy in β2AR–G-protein activation. Nature. 2017;547:68–73. doi: 10.1038/nature22354. [DOI] [PMC free article] [PubMed] [Google Scholar]
- 31.Heng J, et al. Function and dynamics of the intrinsically disordered carboxyl terminus of β2 adrenergic receptor. Nat. Commun. 2023;14:2005. doi: 10.1038/s41467-023-37233-1. [DOI] [PMC free article] [PubMed] [Google Scholar]
- 32.Asher WB, et al. Single-molecule FRET imaging of GPCR dimers in living cells. Nat. Methods. 2021;18:397–405. doi: 10.1038/s41592-021-01081-y. [DOI] [PMC free article] [PubMed] [Google Scholar]
- 33.Asher WB, et al. GPCR-mediated β-arrestin activation deconvoluted with single-molecule precision. Cell. 2022;185:1661–1675.e16. doi: 10.1016/j.cell.2022.03.042. [DOI] [PMC free article] [PubMed] [Google Scholar]
- 34.Han M-J, et al. Single-molecule FRET and conformational analysis of beta-arrestin-1 through genetic code expansion and a Se-click reaction. Chem. Sci. 2021;12:9114–9123. doi: 10.1039/D1SC02653D. [DOI] [PMC free article] [PubMed] [Google Scholar]
- 35.Knierim B, Hofmann KP, Ernst OP, Hubbell WL. Sequence of late molecular events in the activation of rhodopsin. Proc. Natl Acad. Sci. USA. 2007;104:20290–20295. doi: 10.1073/pnas.0710393104. [DOI] [PMC free article] [PubMed] [Google Scholar]
- 36.Grushevskyi EO, et al. Stepwise activation of a class C GPCR begins with millisecond dimer rearrangement. Proc. Natl Acad. Sci. USA. 2019;116:10150–10155. doi: 10.1073/pnas.1900261116. [DOI] [PMC free article] [PubMed] [Google Scholar]
- 37.Vilardaga J-P. Theme and variations on kinetics of GPCR activation/deactivation. J. Recept. Signal Transduct. Res. 2010;30:304–312. doi: 10.3109/10799893.2010.509728. [DOI] [PMC free article] [PubMed] [Google Scholar]
- 38.Franke RR, König B, Sakmar TP, Khorana HG, Hofmann KP. Rhodopsin mutants that bind but fail to activate transducin. Science. 1990;250:123–125. doi: 10.1126/science.2218504. [DOI] [PubMed] [Google Scholar]
- 39.Du Y, et al. Assembly of a GPCR–G protein complex. Cell. 2019;177:1232–1242.e11. doi: 10.1016/j.cell.2019.04.022. [DOI] [PMC free article] [PubMed] [Google Scholar]
- 40.Wingler LM, et al. Angiotensin analogs with divergent bias stabilize distinct receptor conformations. Cell. 2019;176:468–478.e11. doi: 10.1016/j.cell.2018.12.005. [DOI] [PMC free article] [PubMed] [Google Scholar]
- 41.Wang J, Hua T, Liu Z-J. Structural features of activated GPCR signaling complexes. Curr. Opin. Struct. Biol. 2020;63:82–89. doi: 10.1016/j.sbi.2020.04.008. [DOI] [PubMed] [Google Scholar]
- 42.Latorraca NR, Venkatakrishnan AJ, Dror RO. GPCR dynamics: structures in motion. Chem. Rev. 2016;117:139–155. doi: 10.1021/acs.chemrev.6b00177. [DOI] [PubMed] [Google Scholar]
- 43.Jaakola V-P, et al. The 2.6 angstrom crystal structure of a human A2A adenosine receptor bound to an antagonist. Science. 2008;322:1211–1217. doi: 10.1126/science.1164772. [DOI] [PMC free article] [PubMed] [Google Scholar]
- 44.McKinney SA, Joo C, Ha T. Analysis of single-molecule FRET trajectories using hidden Markov modeling. Biophys. J. 2006;91:1941–1951. doi: 10.1529/biophysj.106.082487. [DOI] [PMC free article] [PubMed] [Google Scholar]
- 45.Dror RO, et al. Structural basis for nucleotide exchange in heterotrimeric G proteins. Science. 2015;348:1361–1365. doi: 10.1126/science.aaa5264. [DOI] [PMC free article] [PubMed] [Google Scholar]
- 46.Elgeti M, et al. The arrestin-1 finger loop interacts with two distinct conformations of active rhodopsin. J. Biol. Chem. 2018;293:4403–4410. doi: 10.1074/jbc.M117.817890. [DOI] [PMC free article] [PubMed] [Google Scholar]
- 47.Cong X, et al. Molecular insights into the biased signaling mechanism of the μ-opioid receptor. Mol. Cell. 2021;81:4165–4175.e6. doi: 10.1016/j.molcel.2021.07.033. [DOI] [PMC free article] [PubMed] [Google Scholar]
- 48.Daibani AE, et al. Molecular mechanism of biased signaling at the kappa opioid receptor. Nat. Commun. 2023;14:1338. doi: 10.1038/s41467-023-37041-7. [DOI] [PMC free article] [PubMed] [Google Scholar]
- 49.Suomivuori C-M, et al. Molecular mechanism of biased signaling in a prototypical G protein-coupled receptor. Science. 2020;367:881–887. doi: 10.1126/science.aaz0326. [DOI] [PMC free article] [PubMed] [Google Scholar]
- 50.Culhane KJ, Gupte TM, Madhugiri I, Gadgil CJ, Sivaramakrishnan S. Kinetic model of GPCR–G protein interactions reveals allokairic modulation of signaling. Nat. Commun. 2022;13:1202. doi: 10.1038/s41467-022-28789-5. [DOI] [PMC free article] [PubMed] [Google Scholar]
- 51.Liu H, Naismith JH. An efficient one-step site-directed deletion, insertion, single and multiple-site plasmid mutagenesis protocol. BMC Biotechnol. 2008;8:91. doi: 10.1186/1472-6750-8-91. [DOI] [PMC free article] [PubMed] [Google Scholar]
- 52.Huang W, et al. Structure of the neurotensin receptor 1 in complex with β-arrestin 1. Nature. 2020;579:303–308. doi: 10.1038/s41586-020-1953-1. [DOI] [PMC free article] [PubMed] [Google Scholar]
- 53.Hankovszky HO, Hideg K, Sár PC, Lovas MJ, Jerkovich G. Synthesis and Dehydrobromination of α-bromo aldehyde and ketone nitroxyl radical spin labels. Synthesis. 1990;1990:59–62. doi: 10.1055/s-1990-26788. [DOI] [Google Scholar]
- 54.Yang M, et al. The Conformational Dynamics of Cas9 Governing DNA Cleavage Are Revealed by Single-Molecule FRET. CellReports. 2018;22:372–382. doi: 10.1016/j.celrep.2017.12.048. [DOI] [PubMed] [Google Scholar]
- 55.Illingworth J, Kittler J. A survey of the Hough transform. Comput. Vis. Graph. Image Process. 1988;44:87–116. doi: 10.1016/S0734-189X(88)80033-1. [DOI] [Google Scholar]
- 56.Ha T, et al. Single-molecule fluorescence spectroscopy of enzyme conformational dynamics and cleavage mechanism. Proc. Natl Acad. Sci. USA. 1999;96:893–898. doi: 10.1073/pnas.96.3.893. [DOI] [PMC free article] [PubMed] [Google Scholar]
- 57.Niu X, et al. Pseudoknot length modulates the folding, conformational dynamics, and robustness of Xrn1 resistance of flaviviral xrRNAs. Nat. Commun. 2021;12:6417. doi: 10.1038/s41467-021-26616-x. [DOI] [PMC free article] [PubMed] [Google Scholar]
- 58.Ibáñez LF, Jeschke G, Stoll S. DeerLab: A comprehensive toolbox for analyzing dipolar EPR spectroscopy data. Magn. Reson. 2020;1:209–224. doi: 10.5194/mr-1-209-2020. [DOI] [PMC free article] [PubMed] [Google Scholar]
- 59.Olsen RHJ, et al. TRUPATH, an open-source biosensor platform for interrogating the GPCR transducerome. Nat. Chem. Biol. 2020;16:841–849. doi: 10.1038/s41589-020-0535-8. [DOI] [PMC free article] [PubMed] [Google Scholar]
- 60.Elgeti, M. Ligand efficacy modulates conformational dynamics of the µ-opioid receptor. Zenodo10.5281/zenodo.10631251 (2024). [DOI] [PMC free article] [PubMed]
Associated Data
This section collects any data citations, data availability statements, or supplementary materials included in this article.
Supplementary Materials
Supplementary Figs. 1–8.
Data Availability Statement
All data are available in the manuscript or supplementary materials, or from the corresponding authors upon reasonable request. Raw DEER data are available at 10.5281/zenodo.10631251 (ref. 60). Materials described in this study are available upon a request sent to the corresponding authors. Source data are provided with this paper.


