Abstract
The movement of water between microenvironments presents a central challenge in the physics of soft matter and porous media. Diffusion exchange spectroscopy (DEXSY) is a powerful 2D nuclear magnetic resonance method for measuring such exchange, yet it is rarely used because of its long scan time requirements. Moreover, it has never been combined with magnetic resonance imaging (MRI). Using probability theory, we vastly reduce the required data, making DEXSY MRI feasible for the first time. Experiments are performed on a composite nerve tissue phantom with restricted and free water-exchanging compartments.
Water is distributed within multiple microenvironments in a variety of heterogeneous biological, geological, organic, and soft matter porous media. Nuclear magnetic resonance (NMR) and magnetic resonance imaging (MRI) are powerful tools to explore microscopic domains and pores quantitively [1–7]. In addition to providing local microscopic information, dynamic migration of water from one domain to another, referred to as molecular exchange, is important to our understanding of transport processes within these media. In petrophysics, the frequency of this exchange can reveal features of rock permeability, which is an important parameter in assessing the potential for extracting oil [8]. In biology, molecular exchange between microenvironments is directly related to cell membrane permeability and active transport processes, which are essential in understanding cellular functionality and viability [9,10]. Measuring exchange is also valuable in soft matter applications, for example between liquid crystal domains or fluid-fluid interfaces in emulsions [5,11].
To noninvasively measure water exchange in biological tissue using NMR and MRI, one must discriminate between MR signals arising from water in the intra- and extracellular compartments. Most NMR methods for determining membrane transport rates rely on transmembrane differences in relaxivities, namely, longitudinal and transverse relaxation rates ( and , respectively) or their correlation [12]. For , the difference between the intra- and extracellular spaces is not sufficiently large to distinguish between them, often leading to the requirement to inject contrast agents that temporarily change the extracellular [9,13]. For , the most widely used method is relaxation exchange spectroscopy (REXSY) (first proposed by Lee et al. [14], with recent advancements [15,16]). With REXSY, exchange can be observed based on molecular transport between pools with different . However, achieving compartmental discrimination based on may also be problematic, because intra- and extracellular transverse relaxation rates are indistinguishable in many cases [17–20]. A third MR contrast mechanism, diffusion-weighted MR, noninvasively measures the microscopic net displacements of endogenous diffusing water molecules interacting with surrounding tissue, cellular, and subcellular structures [21]. These measurements provide information about the translational self-diffusion coefficient . In complex, heterogeneous systems, several diffusion domains resulting from local water microenvironments are often present. If one assumes that intra- and extracellular compartments are the only two types of compartments in biological tissue, this difference in diffusivities can be exploited for measuring exchange [22–24]. In most cases, generalization of the two-site system to model a multisite system is essential because there is often a wide distribution of exchanging compartments with different diffusion rates in biological tissue [25]. Progressing towards this goal, a recently proposed diffusion-based MRI method measured the apparent exchange rate (AXR) in a multisite system [26]. Despite these advancements, a single AXR value of multisite systems is difficult to relate to the true microscopic diffusion and exchange rates and, therefore, providing only a qualitative descriptor of exchange [26]. After laying the groundwork [3,4], Callaghan and Furó introduced in 2004 the diffusion exchange spectroscopy (DEXSY) experiment [5]. As opposed to 1D diffusion measurements, DEXSY relies on correlating the successive diffusional motion of molecules along collinear directions, and computing a 2D map that describes these correlations. DEXSY is a model-free approach to measure exchange directly, theoretically allowing for any number of exchange processes between any number of compartments. As powerful as it is, it involves inverting a Fredholm integral of the first kind, which normally requires large amounts of acquired data due to the ill-posed nature of the problem [27,28]. Despite its great potential, DEXSY has been used in a relatively small number of studies since its introduction [5,27–31], conceivably due to the requirements for large amounts of data that leads to exceptionally long scan times. MRI is more time demanding than NMR because of the additional spatial encoding, precluding any DEXSY MRI applications to date. For example, a human brain MRI would require a minimal scan time of ~1 min per diffusion encoding acquisition [32], while DEXSY typically requires an order of 1000 acquisitions at a single mixing time (the time in which the exchange is allowed to occur). From a series of DEXSY maps acquired with different mixing times, the exchange rates can be deduced, leading to data collection periods of more than 15 h per single mixing time. In many cases biological, preclinical, and clinical MRI involve in vivo measurements, and are therefore limited in time—typically 10 min for clinical scans, 40–60 min for human neuroscience research, and up to 180 min for small animals. Here we propose a method to vastly reduce the number of required acquisitions, making DEXSY NMR and MRI possible in a wide range of applications for the first time, and taking a step toward clinical feasibility of DEXSY MRI scanning.
Before addressing 2D diffusion exchange experiments, we consider the more common 1D diffusion experiment, pulsed gradient spin echo (PGSE) [33]. In this technique, a pair of magnetic PGSEs of duration and amplitude are used to encode the positions of precessing nuclear spins at two different times, and in opposite senses [1]. This leads to a distribution of precessional phase shifts that is characteristic of the spin displacements over the time period between the pulses. It is convenient to use the definition of as the wave vector amplitude of the gradient pulses, with being the gyromagnetic ratio [34]. The signal decay with sampled over an extended range in the same direction showed a decidedly nonmonoexponential behavior in heterogeneous samples [25,35] and can therefore be expressed as
| (1) |
where each subpopulation of molecules is characterized by a local diffusivity with a probability distribution . The function , which depends on the diffusion encoding, relates and and is called the kernel. The effect of diffusional displacements on the PGSE experiment is to impart Gaussian distributions of phase shifts, which in turn lead to an exponential decay of the subpopulation spin echo amplitude, and in the case that , the kernel is .
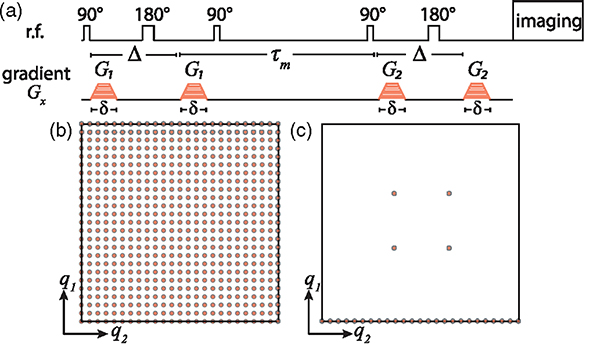
In the 2D variant of the PGSE, two diffusion encoding blocks separated by a mixing time, [Fig. 1(a)], provide information regarding the correlation of successive displacements of the same molecule [36,37]. It was previously used to study 2D diffusion correlations [5,38,39], and in conjunction with MRI to measure axon diameter [40,41] and diameter distribution in nerve tissue [42]. In this case, Eq. (1) becomes
| (2) |
FIG. 1.
Pulse sequence and acquisition schemes. (a) The pulse sequence based on two collinear PGSEs separated by a mixing time, . (b),(c) Schematic illustration of the data sampling strategies using (b) conventional and (c) marginal distribution constrained optimization (MADCO) approaches to obtain the 2D correlation function, .
When the kernel is [1]. Exchange can be measured with these two successive PGSE blocks by setting the directions of and to be identical; the experiment then probes changes in over the adjustable mixing time, is the initial diffusion coefficient obtained by the first gradient pair, while is the final diffusion coefficient of the molecules after the mixing time, measured by the second gradient pair. Conventionally, the two collinear gradient pulses pairs are stepped independently. If 1D acquisitions are required to obtain from Eq.(1), an order of acquisitions will be required to resolve from Eq. (2), which is infeasible for most applications, especially in vivo clinical or biological MRI applications.
To achieve a considerable reduction in data acquisition requirements for the 2D experiment, we adopt concepts from probability theory, and specifically, the properties of the joint probability distribution function (PDF). Given a joint PDF, , with variables, the PDF associated with alone is defined as
| (3) |
and is called a marginal distribution. We may regard the diffusion exchange spectrum, , as a joint probability distribution of two random variables, and . Equation (3) provides a link between the more accessible 1D information, , and the joint PDF we are interested in finding [43]. Equations (1) and (2) are both examples of a broad class of Fredholm integrals of the first kind. When the kernels have an exponential form, application of an inverse Laplace transform, which is a classic ill-conditioned problem [44], is required.
The kernel and the joint PDF can be discretized on a grid with and values of and , respectively, and and values of and , respectively. One practical technique for obtaining a stable solution for is by minimizing [45,46],
| (4) |
in which the first term is a data-quality term, and the second term performs Tikhonov regularization with being the regularization parameter (the method for determining is detailed in the Supplemental Material [47]). Here, a robust and widely used algorithm developed by Venkataramanan et al. [51,52] was used to solve Eq. (4). Since is a PDF, non-negativity constraints are usually imposed, such that
| (5) |
Resulting in vast data reduction while maintaining quality and accuracy, we recently proposed using the marginal distributions to constrain a diffusion-relaxation correlation measurement, which is a different type of a multidimensional NMR experiment [53]. These types of experiments assume that no water exchange occurs, while the current method is based on the dynamic behavior and time evolution of water transport. For exchange spectra, we note that the 1D projections of the 2D spectrum reconstructed from DEXSY onto either the first or second dimensions are always equal to the 1D PDF obtained from 1D diffusion measurements. Our MADCO framework enforces these physical constraints on the multidimensional PDF, in addition to the non-negativity constraint. The constraints are obtained from plugging in to a discretized version of Eq. (3),
| (6) |
These equality constraints are correct in an idealized system; however, expected errors in the 1D estimation of require a relaxed version of Eq. (6),
| (7) |
In this Letter we set to be the standard deviation of the noise (as determined after complete signal decay) normalized by the unattenuated signal and . We propose that instead of sampling the entire 2D experimental parameters space [Fig. 1(b)] and then estimating from it the 2D distribution by minimizing Eq. (4) subject to Eq. (5), using MADCO would only require sampling along q2, complemented with a small number of acquisitions in the 2D space [Fig. 1(c)]. The 2D reconstruction would then have two steps: (1) estimate from the 1D data, and then (2) use that estimate to constrain the estimation of by minimizing Eq. (4) subject to Eqs. (5) and (7). The exchange experiment allows us to use only a single marginal distribution as constraints, which further reduces data requirements by almost a factor of 2, compared to previous publications [53,54].
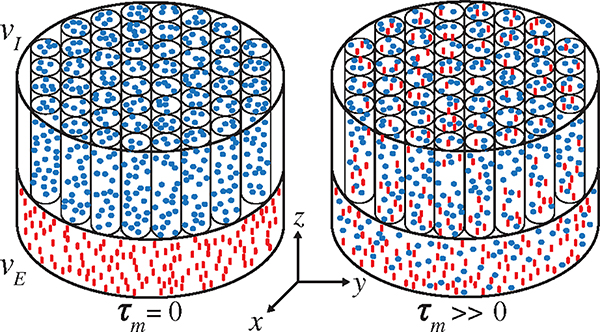
The new DEXSY MRI method was demonstrated by using a composite sample with two water components resembling those used to model water diffusion in white matter brain tissue [55]. The white matter phantom was composed of a water-filled glass capillary array [GCA (Photonis, Lancaster, PA)] with a nominal inner diameter of 5 μm and an open area ratio (OAR) of 0.55, along with an adjacent layer of freely diffusing water, mimicking the intra- and extracellular spaces, and , respectively [56] (Fig. 2). The 0.6-mm-thick imaging slice was made up of approximately 0.45 and 0.15 mm of GCA and free water, respectively. Water molecules in the capillaries were free to diffuse along the symmetry axis to the free-water pool, and vice versa, resulting in water exchange between restricted and unrestricted compartments. The composite phantom was put in a 15-mm NMR tube and scanned on a 7-T Bruker vertical wide-bore magnet with an AVANCE III MRI spectrometerequippedwithaMicro2.5microimagingprobe and three GREAT60 gradient amplifiers. DEXSY-filtered MRI data were acquired by applying the sequence in Fig. 1(a) followed by a 2D spin echo MRI sequence. Diffusion gradients, and , were applied in the same direction (, see Fig. 2), and their amplitudes were varied independently with linear steps (resulting in 45 × 45 = 2025 acquisitions) in the range of 0 to 1346 mT=m, repeated with mixing times, , 200, 300 ms, and of 3 (15) ms. MRI parameters were echo (repetition) times, TE (TR), of 7.6 (3000) ms, a single average, in-plane nominal resolution of 0.48 × 0.48 mm2, and an axial slice that included both free and restricted compartmentswithathicknessof0.6mm.Alldataprocessing was performed with in-house code written in matlab (The Mathworks, Natick, MA), on a grid with .
FIG. 2.
Schematics of geometry and microstructure of the composite white matter phantom. As increases, the fraction of water residing in during the first diffusion block (blue circles) which move to during the second diffusion block, and vice versa (red lines), increases as well.
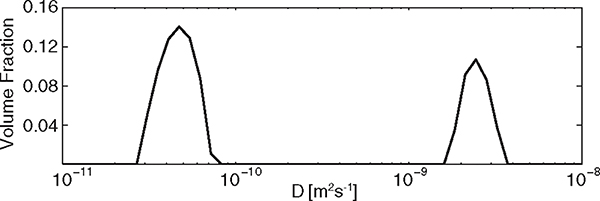
Taking into account the OAR, the ground truth water fractions in the restricted and free compartments were and , respectively. The ground truth diffusivity of the extracellular compartment was taken as water at 17 °C, . The derivation of the expected apparent diffusivity of the intracellular compartment, , was based on the multiple correlation function [57] and is detailed in the Supplemental Material. Processing a 1D data subset (with set to zero) generated two distinct contributions, shown in Fig. 3, at approximately and , for the intra- and extracellular compartments, respectively. Integration over these peaks yielded equilibrium occupancies of and . Both diffusivities and equilibrium occupancies were in good agreement with the ground truth values.
FIG. 3.
The 1D diffusivity distribution, , obtained by solving Eq. (4) for the 1D case, using a 1D subset of the full DEXSY data. The integrated peaks represent equilibrium occupancies of and .
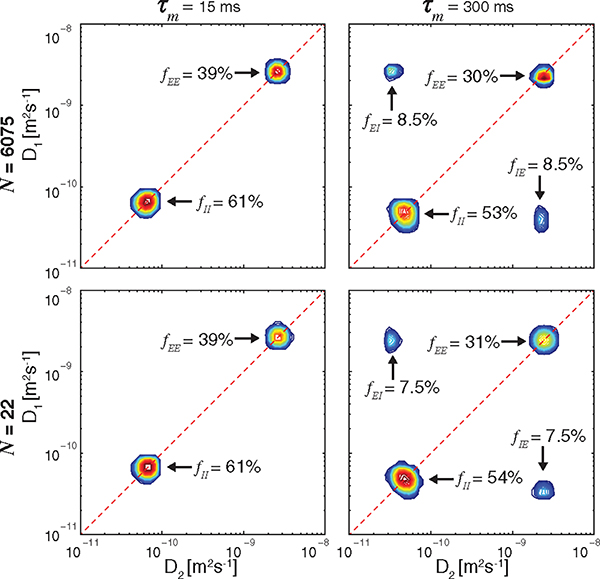
The existence of exchange effects is clearly indicated by the presence of off-diagonal features in the DEXSY spectrum, whose position and shape give a signature for the underlying dynamics. The volume fraction of water that remains in the compartment after the mixing time is and the volume that diffused from one space to the other and vice versa is . Processing the 2D data resulted in the spectra presented in Fig. 4. The distributions on the top row were obtained by using the entire data set, i.e., [Fig. 1(b)]. The spectra on the bottom of Fig. 4 were obtained by using only 0.35% of the data; i.e., 22 acquisitions were made in the following manner: 1D experiment consisting of 10 steps of with and , from which was obtained, and additional 4 random acquisitions on the 2D grid for each of the mixing times, i.e., [Fig. 1(c)]. It is evident from the spectra that the suggested method allowed for a vast reduction of required data, while yielding highly accurate results. As expected, decreased and increased as a function of (Fig. 4, left to right). It is worth noting that, to this point, no a priori assumptions or models were used to determine the number of compartments or exchange processes. Observation of the current spectra indicates that there are two exchanging compartments and, therefore, it is possible to model the dynamic exchange process accordingly. If dictated by the DEXSY spectra, multisite exchange modeling can be applied [58]. In our case, however, the exchange is governed by the first-order rate equation , where is the rate constant [11]. A similar relation governs transition from to simply by exchanging indices, resulting in a set of first-order equations, which along with the initial condition, , and conservation, , yields [11]
| (8) |
FIG. 4.
DEXSY spectra. Top to bottom: obtained by using the entire data set , and by using only acquisitions with MADCO. Left to right: the effect of increased , from 15 ms to 300 ms.
The time-dependent diagonal intensities are governed by an exponential decay with the same rate constant as for the growth of the off-diagonal peaks [31],
| (9) |
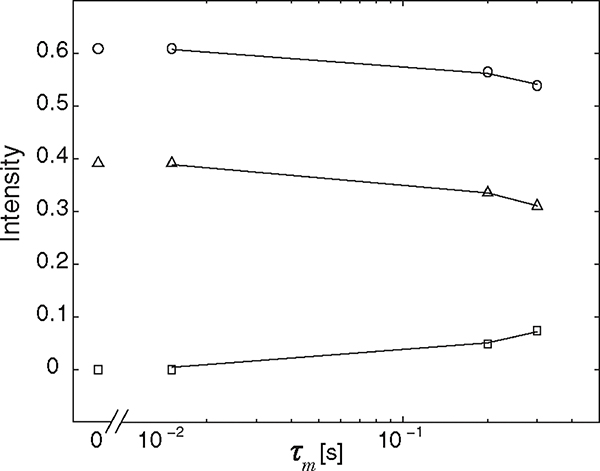
with representing either representing either or , and is the asymptotic intensity as . Shown in Fig. 5, the integrated off-diagonal and diagonal peak intensities as a function of mixing time were fitted according to Eqs. (8) and (9) for both amounts of data, resulting in exchange rates (corrected for relaxation [11,58]), , of 1.76 and 1.69 s−1, for and 22, respectively. When complete exchange occurred the diagonal peaks had intensities, , of 39% (12%) and 38% (14%), and of 25% and 24%, for and 22, respectively. A comparison of the conventional and MADCO approaches showed that the DEXSY spectra, exchange rates, and complete exchange intensities were all in very good agreement. The estimated value of the intracellular-extracellular exchange rate was quite close to the apparent exchange rate of 1.1 s−1 found in in vivo human brain white matter [59], indicating the physiological compatibility of the currently used phantom. Since its introduction, several corrections and improvements to DEXSY have been suggested, such as addressing the case of finite mixing times, i.e., [60], or correcting for possible gradient mismatch [31]. These can be readily applied by using the proposed MADCO framework.
FIG. 5.
Integrated intensities from the MADCO obtained spectra, , , and , and their corresponding fits (−), as a function of mixing time. The 95% confidence intervals of the estimated exchange rates were [1.47, 2.28] and [1.59, 1.82] using the conventional and MADCO methods, respectively.
We showed here that 22 acquisitions were sufficient to accurately determine the diffusion exchange spectrum at three mixing times. The presented framework allows one to add more mixing times at a low data requirement cost (i.e., 4 acquisitions per additional mixing time). Combined with a fast imaging readout, such as echo planar imaging, whole human brain imaging using 22 DEXSY acquisitions would take about 22 min [32], which is within the time frame of clinical MRI. Regarding the diffusion exchange spectrum as a joint probability function and accordingly imposing constraints in the optimization process, provides the opportunity to reliably and feasibly obtain spatially resolved water exchange, as reflected by physical microscopic environments. Cell membrane permeability and active transport processes in healthy and diseased tissue are only partially understood, and currently cannot be directly measured noninvasively and in vivo without imposed restricting assumptions. Fast DEXSY MRI and NMR can now be beneficial for broad application for heterogeneous materials such as biological tissues, food, plants, and rocks, providing exciting opportunities for investigators in a range of disciplines.
Supplementary Material
Acknowledgments
This work was supported by funds provided by the Intramural Research Program of the Eunice Kennedy Shriver National Institute of Child Health and Human Development (NICHD) (Grant No. ZIAHD000266), and the Center for Neuroregenerative Medicine (CNRM) under the auspices of the Henry Jackson Foundation (Grant No. 306135–2.01–60855). The authors would like to thank L. Salak for editing the manuscript.
References
- [1].Callaghan P, Principles of Nuclear Magnetic Resonance Microscopy (Oxford University Press, New York, 1991). [Google Scholar]
- [2].Arns CH, Physica (Amsterdam) 339A, 159 (2004). [Google Scholar]
- [3].Callaghan PT and Komlosh ME, Magn. Reson. Chem. 40, S15 (2002). [Google Scholar]
- [4].Callaghan P, Godefroy S, and Ryland B, Magn. Reson. Imaging 21, 243 (2003). [DOI] [PubMed] [Google Scholar]
- [5].Callaghan PT and Furó I, J. Chem. Phys. 120, 4032 (2004). [DOI] [PubMed] [Google Scholar]
- [6].Price W, NMR Studies of Translational Motion (Cambridge University Press, Cambridge, England, 2009). [Google Scholar]
- [7].Callaghan P, Translational Dynamics and Magnetic Resonance: Principles of Pulsed Gradient Spin Echo NMR (Oxford University Press, New York, 2011). [Google Scholar]
- [8].Burcaw LM and Callaghan PT, J. Magn. Reson. 198, 167 (2009). [DOI] [PubMed] [Google Scholar]
- [9].Quirk JD, Bretthorst GL, Duong TQ, Snyder AZ, Springer CS, Ackerman JJH, and Neil JJ, Magn. Reson. Med. 50, 493 (2003). [DOI] [PubMed] [Google Scholar]
- [10].Zhang Y, Poirier-Quinot M, Springer CS, and Balschi JA, Biophys. J. 101, 2833 (2011). [DOI] [PMC free article] [PubMed] [Google Scholar]
- [11].Washburn KE and Callaghan PT, Phys. Rev. Lett. 97, 175502 (2006). [DOI] [PubMed] [Google Scholar]
- [12].Dortch RD, Harkins KD, Juttukonda MR, Gore JC, and Does MD, Magn. Reson. Med. 70, 1450 (2013). [DOI] [PMC free article] [PubMed] [Google Scholar]
- [13].Rooney WD, Li X, Sammi MK, Bourdette DN, Neuwelt EA, and Springer CS, NMR Biomed. 28, 607 (2015). [DOI] [PMC free article] [PubMed] [Google Scholar]
- [14].Lee JH, Labadie C, Springer CS, and Harbison GS, J. Am. Chem. Soc. 115, 7761 (1993). [Google Scholar]
- [15].D’Eurydice MN, Montrazi ET, Fortulan CA, and Bonagamba TJ, J. Chem. Phys. 144, 204201 (2016). [DOI] [PubMed] [Google Scholar]
- [16].Song R, Song Y-Q, Vembusubramanian M, and Paulsen JL, J. Magn. Reson. 265, 164 (2016). [DOI] [PubMed] [Google Scholar]
- [17].Menon RS and Allen PS, Magn. Reson. Med. 20, 214 (1991). [DOI] [PubMed] [Google Scholar]
- [18].Stewart WA, Mackay AL, Whittall KP, Moore GRW, and Paty DW, Magn. Reson. Med. 29, 767 (1993). [DOI] [PubMed] [Google Scholar]
- [19].Mackay A, Whittall K, Adler J, Li D, Paty D, and Graeb D, Magn. Reson. Med. 31, 673 (1994). [DOI] [PubMed] [Google Scholar]
- [20].Gareau PJ, Rutt BK, Bowen CV, Karlik SJ, and Mitchell JR, Magn. Reson. Imaging 17, 1319 (1999). [DOI] [PubMed] [Google Scholar]
- [21].Le Bihan D, Breton E, Lallemand D, Grenier P, Cabanis E, and Laval-Jeantet M, Radiology 161, 401 (1986). [DOI] [PubMed] [Google Scholar]
- [22].Kärger J, Adv. Colloid Interface Sci. 23, 129 (1985). [Google Scholar]
- [23].Price WS, Barzykin AV, Hayamizu K, and Tachiya M, Biophys. J. 74, 2259 (1998). [DOI] [PMC free article] [PubMed] [Google Scholar]
- [24].Åslund I, Nowacka A, Nilsson M, and Topgaard D, J. Magn. Reson. 200, 291 (2009). [DOI] [PubMed] [Google Scholar]
- [25].Mulkern RV, Gudbjartsson H, Westin CF, Zengingonul HP, Gartner W, Guttmann CR, Robertson RL, Kyriakos W, Schwartz R, Holtzman D, Jolesz FA, and Maier SE, NMR Biomed. 12, 51 (1999). [DOI] [PubMed] [Google Scholar]
- [26].Lasič S, Nilsson M, Lätt J, Ståhlberg F, and Topgaard D, Magn. Reson. Med. 66, 356 (2011). [DOI] [PubMed] [Google Scholar]
- [27].Qiao Y, Galvosas P, Adalsteinsson T, Schönhoff M, and Callaghan PT, J. Chem. Phys. 122, 214912 (2005). [DOI] [PubMed] [Google Scholar]
- [28].Galvosas P, Qiao Y, Schönhoff M, and Callaghan PT, Magn. Reson. Imaging 25, 497 (2007). [DOI] [PubMed] [Google Scholar]
- [29].Hubbard PL, McGrath KM, and Callaghan PT, Langmuir 21, 4340 (2005). [DOI] [PubMed] [Google Scholar]
- [30].Hubbard PL, McGrath KM, and Callaghan PT, J. Phys. Chem. B 110, 20781 (2006). [DOI] [PubMed] [Google Scholar]
- [31].Gratz M, Wehring M, Galvosas P, and Stallmach F, Microporous Mesoporous Mater. 125, 30 (2009). [Google Scholar]
- [32].Lawrenz M and Finsterbusch J, Magn. Reson. Med. 73, 773 (2015). [DOI] [PubMed] [Google Scholar]
- [33].Stejskal E and Tanner J, J. Chem. Phys. 42, 288 (1965). [Google Scholar]
- [34].Callaghan PT, Eccles CD, and Xia Y, J. Phys. E 21, 820 (1988). [Google Scholar]
- [35].Pfeuffer J, Provencher SW, and Gruetter R, Magnetic Resonance Materials in Physics, Biology, and Medicine 8, 98 (1999). [Google Scholar]
- [36].Mitra P, Phys. Rev. B 51, 15074 (1995). [DOI] [PubMed] [Google Scholar]
- [37].Cheng Y and Cory DG, J. Am. Chem. Soc. 121, 7935 (1999). [Google Scholar]
- [38].Zong F, Ancelet LR, Hermans IF, and Galvosas P, Magn. Reson. Chem, DOI: 10.1002/mrc.4492 (2016). [DOI] [PubMed] [Google Scholar]
- [39].de Almeida Martins JP and Topgaard D, Phys. Rev. Lett. 116, 087601 (2016). [DOI] [PubMed] [Google Scholar]
- [40].Koch MA and Finsterbusch J, NMR Biomed. 24, 1422 (2011). [DOI] [PubMed] [Google Scholar]
- [41].Komlosh ME, Özarslan E, Lizak MJ, Horkayne-Szakaly I, Freidlin RZ, Horkay F, and Basser PJ, NeuroImage 78, 210 (2013). [DOI] [PMC free article] [PubMed] [Google Scholar]
- [42].Benjamini D, Komlosh ME, Holtzclaw LA, Nevo U, and Basser PJ, NeuroImage 135, 333 (2016). [DOI] [PMC free article] [PubMed] [Google Scholar]
- [43].Benjamini D and Basser PJ, J. Chem. Phys. 141, 214202 (2014). [DOI] [PMC free article] [PubMed] [Google Scholar]
- [44].McWhirter JG and Pike ER, J. Phys. A 11, 1729 (1978). [Google Scholar]
- [45].Kroeker RM and Mark Henkelman R, J. Magn. Reson. 69, 218 (1986). [Google Scholar]
- [46].Fordham E, Sezginer A, and Hall L, J. Magn. Reson. 113, 139 (1995). [Google Scholar]
- [47].See Supplemental Material at http://link.aps.org/supplemental/10.1103/PhysRevLett.118.158003, which includes Refs. [48–50], for further details regarding the regularization process, and the derivation of the expected apparent diffusivity of the intra-cellular compartment. [Google Scholar]
- [48].Neuman CH, J. Chem. Phys. 60, 4508 (1974). [Google Scholar]
- [49].Yablonskiy DA and Sukstanskii AL, NMR Biomed. 23, 661 (2010). [DOI] [PMC free article] [PubMed] [Google Scholar]
- [50].Torrey HC, Phys. Rev. 104, 563 (1956). [Google Scholar]
- [51].Venkataramanan L, Song Y-Q, and Hurlimann M, IEEE Trans. Signal Process. 50, 1017 (2002). [Google Scholar]
- [52].Song Y-Q, Venkataramanan L, Hürlimann M, Flaum M, Frulla P, and Straley C, J. Magn. Reson. 154, 261 (2002). [DOI] [PubMed] [Google Scholar]
- [53].Benjamini D and Basser PJ, J. Magn. Reson. 271, 40 (2016). [DOI] [PMC free article] [PubMed] [Google Scholar]
- [54].Benjamini D and Basser PJ, Microporous Mesoporous Mater. (in press; ). [DOI] [PMC free article] [PubMed] [Google Scholar]
- [55].Assaf Y and Basser PJ, NeuroImage 27, 48 (2005). [DOI] [PubMed] [Google Scholar]
- [56].Benjamini D, Komlosh ME, Basser PJ, and Nevo U, J. Magn. Reson. 246, 36 (2014). [DOI] [PMC free article] [PubMed] [Google Scholar]
- [57].Grebenkov DS, Concepts Magn. Reson., Part A 32A, 277 (2008). [Google Scholar]
- [58].Van Landeghem M, Haber A, D’espinose De Lacaillerie J-B, and Blümich B, Concepts Magn. Reson, Part A 36A, 153 (2010). [Google Scholar]
- [59].Nilsson M, Lätt J, van Westen D, Brockstedt S, Lasič S, Ståhlberg F, and Topgaard D, Magn. Reson. Med. 69, 1572 (2013). [DOI] [PubMed] [Google Scholar]
- [60].Paulsen JL and Song Y-Q, J. Magn. Reson. 244, 6 (2014). [DOI] [PubMed] [Google Scholar]
Associated Data
This section collects any data citations, data availability statements, or supplementary materials included in this article.


