

Abstract
Background and Purpose:
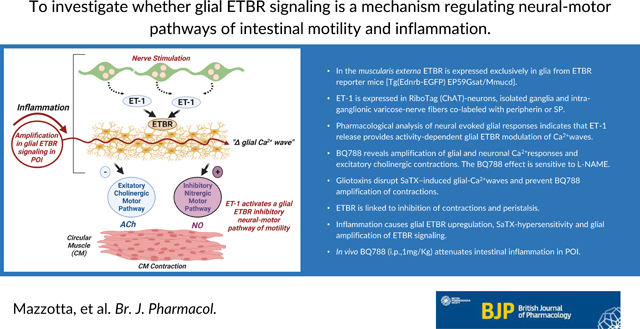
ET-1 signaling modulates intestinal motility and inflammation, but the role of ET-1/ETBR signaling is poorly understood. Enteric glia modulate normal motility and inflammation. We investigated whether glial ETBR signaling is a mechanism regulating neural-motor pathways of intestinal motility and inflammation.
Experimental Approach:
We studied ETBR signaling using: ETBR drugs (ET-1, SaTX, BQ788), activity-dependent stimulation of neurons (high K+-depolarization, EFS), gliotoxins, Tg(Ednrb-EGFP) EP59Gsat/Mmucd mice, cell-specific mRNA in Sox10CreERT2; Rpl22-HAflx or ChATCre; Rpl22-HAflx mice, Sox10CreERT2::GCaMP5g-tdT, Wnt1Cre2::GCaMP5g-tdT mice, muscle tension recordings, fluid-induced peristalsis, ET-1 expression, qPCR, western blots, 3-D LSM-immunofluorescence co-labeling studies in LMMP-CM and a POI model of intestinal inflammation (P<0.01 is significant).
Key Results:
In the muscularis externa ETBR is expressed exclusively in glia. ET-1 is expressed in RiboTag(ChAT)-neurons, isolated ganglia and intra-ganglionic varicose-nerve fibers co-labeled with peripherin or SP. Pharmacological analysis of neural evoked glial responses indicates that ET-1 release provides activity-dependent glial ETBR modulation of Ca2+waves. BQ788 reveals amplification of glial and neuronal Ca2+responses and excitatory cholinergic contractions. The BQ788 effect is sensitive to L-NAME. Gliotoxins disrupt SaTX–induced glial-Ca2+waves and prevent BQ788 amplification of contractions. ETBR is linked to inhibition of contractions and peristalsis. Inflammation causes glial ETBR upregulation, SaTX-hypersensitivity and glial amplification of ETBR signaling. In vivo BQ788 (i.p.,1mg/Kg) attenuates intestinal inflammation in POI.
Conclusion and Implications:
Enteric glial ET-1/ETBR signaling provides dual modulation of neural-motor circuits to inhibit motility - It inhibits excitatory cholinergic neural-motor pathways and stimulates inhibitory nitrergic motor pathways. Amplification of glial ETBR is linked to muscularis externa inflammation and possibly pathogenic mechanisms of postoperative ileus.
Graphical Abstract
Introduction:
Endothelins exert their effects in health and disease by interacting with G-protein coupled ETA and ETB receptors (ETAR and ETBR). Endothelin signaling is implicated in numerous diseases including pulmonary hypertension, neurological diseases, inflammatory bowel disease (IBD), necrotizing enterocolitis, sepsis, acute pancreatitis and degenerative diseases.1–7 Endothelin antagonists are approved for treatment of patients with advanced pulmonary hypertension.1,8
Endothelins are expressed in the gastrointestinal tract. Endothelin-1 (ET-1), ET-2 and ET-3 activate both receptors, although ET-1 is the predominant endothelin.9–11 ETBR signaling is critical in the development of the enteric nervous system (ENS) and loss of ETBR is linked to aganglionosis and Hirschsprung’s Disease (HD).12–14 Mutations of either ETBR or ET-3 have been identified in animal models of HD14 and in human15–18. However, little is known about ETBR signaling in the adult gastrointestinal tract. Earlier studies suggested that activation of both ETAR and ETBR are involved in intestinal motility,11,19,20 but the precise expression, distribution, and function of ETBR signaling in the enteric nervous system (ENS) and intestinal motility is not known.
Studies in other peripheral ganglia and brain suggest that ETBR signaling involves glia6,21 and neurons22,23. Our preliminary study in ETBR reporter mice (Tg(Ednrb-EGFP)EP59Gsat/Mmucd) showed that the EGFP reporter is expressed by enteric glia. Glia are important regulators of intestinal motility24 and this motivated us to focus our attention on enteric glial ETBR signaling and its role in motility. Glial activity encoded by intracellular Ca2+responses is required for normal intestinal motility and function.25–27 Disrupting glial Ca2+responses inhibit motility and intestinal transit, while activating glial Ca2+responses promote motility through interactions with neurons in gut motor circuits.29–31
‘Reactive’ enteric glial cells32 are emerging as an important target of investigation in neurogastroenterology and motility for gastrointestinal diseases.24,33–37 ‘Reactive’ glia are thought to be involved in pathogenic conditions associated with intestinal inflammation38,39, enteric neuropathy40, postoperative ileus35, constipation2, irritable bowel syndrome (IBS)41,42, infection and diarrhea24,38. Glia are implicated in neurologic mechanisms of gut injury43, as well as brain injury44. ET-1 and ETBR in ‘reactive’ glia of the brain are implicated in pathogenic mechanisms of neurological diseases.5,45
We focused our investigation on whether glial ETBR signaling is an important pathway in gut glial-neural motor pathways of motility and gut inflammation. The availability of more selective tools to study ETBR signaling, including selective drugs such as BQ788 or sarafotoxin, Tg(Ednrb-EGFP)EP59Gsat/Mmucd mice, specific antisera against EGFP, ET-1 and ETBR, cell-specific Ca2+reporter mice for glia (Sox10CreERT2;GCaMP5g-tdT) or neurons (Wnt1Cre2;GCaMP5g-tdT) to monitor ENS activation, RiboTag mice, and spatiotemporal imaging of peristalsis, provided definitive ways to investigate ETBR signaling in health or disease. To evaluate ETBR signaling in ‘reactive’ glia, we used an established mouse model of postoperative ileus (POI) that is linked to muscularis externa (ME) inflammation and disruption of motility35–37. ETBR signaling in human enteric glia was confirmed by Ca2+imaging in glial networks obtained from surgical specimens. BQ788 reveals glial ETBR modulation of neuronal cholinergic and nitrergic pathways to inhibit intestinal motility. ETBR signaling is linked to POI and may represent a pathogenic mechanism.
2. Methods:
Animals:
All animal studies were approved by the IACUC Institutional Ethics committee on the use of animals at The Ohio State University, Michigan State University and Virginia Commonwealth University. C57BL/6, six to eight weeks old male and female mice were purchased from Jackson Labs (Bar Harbor, ME). Mice were fed standard chow, water ad libitium. Mice for in vitro experiments were euthanized by CO2 and cervical dislocation according to our approved protocols. C57BL/6J mice (Strain 000664) were used in organ bath experiments, in vitro fluid induced peristalsis, or in vivo studies with BQ788. Tg(Ednrb-EGFP)EP59Gsat/Mmucd reporter mice for ETBR expression studies were obtained from Jackson MMRRC (STOCK Tg(Ednrb-EGFP)EP59Gsat/Mmucd, RRID:MMRRC_010620-UCD, was obtained from the Mutant Mouse Resource and Research Center (MMRRC) at University of California at Davis, an NIH-funded strain repository, and was donated to the MMRRC by Nathaniel Heintz, Ph.D., The Rockefeller University, GENSAT; cryopreserved and re-derived). The Tg(Ednrb-EGFP)EP59Gsat mouse contains the coding sequence for enhanced green fluorescent protein (EGFP), followed by a polyadenylation signal, inserted into the mouse genomic bacterial artificial chromosome (BAC) RP23–422M6 at the ATG transcription initiation codon of the endothelin receptor type B (Ednrb) gene so that expression of the reporter mRNA/protein is driven by the regulatory sequences of the mouse gene (J:100256).46 Ca2+reporter mice (Sox10CreERT2;GCaMP5g-tdT and Wnt1Cre2;GCaMP5g-tdT) were obtained from Dr. Brian Gulbransen and were bred at Michigan State University. They were shipped to our IACUC approved animal facility at OSU and kept in quarantine for 3 weeks to rule out any infection prior to use. Mice were maintained in a temperature-controlled environment on a 12-h light:dark cycle with access to water and mouse chow. Both male and female mice were used in the experiments.
Ca2+ reporter mice for glia and neurons:
Transgenic mice expressing the calcium indicator GCaMP5g selectively in enteric glia or in all enteric neurons and glia were generated by breeding Sox10CreERT2 mice33 or Wnt1Cre2 mice (The Jackson Laboratory; https://www.jax.org/strain/022137; 129S4.Cg-E2f1Tg(Wnt1-cre)2Sor/J; RRID: IMSR_JAX:002137) with PC::G5-tdTomato mice (Jackson Labs 02447; B6;129S6-Polr2aTn(pb-CAG-GCaMP5g,-tdTomato)Tvrd/J; RRID: IMSR_JAX:02447748), respectively. The efficacy and specificity of the resulting Sox10CreERT2+/−;PC::G5-tdT+/− (hereafter referred to as Sox10CreERT2;GCaMP5g-tdT) and Wnt1Cre2+/−;PC::G5-tdT+/− (hereafter referred to as Wnt1Cre2;GCaMP5g-td) have been described in prior work.29,49 All double transgenic mice were maintained as heterozygous for both Cre and the GCaMP5g-tdTomato construct. CreERT2 activity was induced in Sox10CreERT2;GCaMP5g-tdT mice by feeding the animals with chow containing tamoxifen citrate (400 mg/kg) for 1 week followed by 1 week of normal chow before use.49 Mice of both sexes were used for experiments when they reached 8–12 weeks of age. Mice were maintained in a temperature-controlled environment on a 12-h light:dark cycle with access to acidified water and a minimal phytoestrogen diet (Diet Number 2919; Envigo, Indianapolis, IN) ad libitum. Genotyping was performed by Transnetyx (Cordova, TN).49
Chemicals:
Natural product research was not conducted in this study. All chemicals or drugs used were known compounds commercially available (>99% purity): Sarafotoxin S6c (cat #1175), BQ788 sodium salt (cat #1500), IRL 1620 (cat #1196), Tetrodotoxin (cat #1078), Substance P (cat #1156), PPAD tetrasodium salt (cat #0625), and ARL67156 trisodium salt were purchased from Tocris Bioscience (Minneapolis, MN). Atropine sulfate salt monohydrate (cat #A0257), DL-Fluorocitric acid barium salt (cat #F9634), Adenosine 5’ triphosphate disodium salt hydrate (cat #A26209), and Liberase (cat #05414451001) were purchased from Sigma Aldrich (St. Louis, MO). Carbamoylcholine chloride (carbachol, cat #ab141354) was purchased from Abcam (Waltham, MA). ET1 was purchased from American Peptide. DMEM/F12 (1:1) (cat # 11330–032; Fetal bovine serum (cat. # 26140–079), Penicillin-Streptomycin (5,000 U/mL) (Cat. #1507006); amphotericin B (cat # 15290–018), and Fluo-4 (cat # F14201) were purchased from Invitrogen, Thermo Fisher Scientific. Sodium Fluoracetate (cat # 201080) was purchased from MP Biomedicals.
Interventions and study design:
Tg(Ednrb-EGFP)EP59Gsat/Mmucd reporter mice and immunofluorescence co-labeling studies were used to study the distribution of the ET-1/ETBR signaling pathway in the digestive tract. Real-time PCR and western blots confirmed gene transcripts and protein expression of ETBR molecular forms in ME tissues (in normal or inflamed tissues). We tested the effects of ET-1 or the selective ETBR agonist sarafotoxin S6c (SaTX) on enteric glia or neurons in Ca2+reporter mice. High K+ depolarization or EFS were used to study activity-dependent regulation of ET-1/ETBR signaling in glia-to-neuron bi-directional communication. EFS contractions and fluid distension induced peristalsis were used to study the role of glial ETBR in responses by disrupting glia with a gliotoxin (FC, 300μM; or FA, 5mM); the disruptive effect of gliotoxin on glial ETBR was confirmed against SaTX-induced Ca2+responses in glia. The physiological role of ETBR was determined by testing the influence of the ETBR antagonist BQ788 alone on intestinal tissues. BQ788 (1μM or 3μM) was incubated for 30 min to evaluate effects on glial Ca2+ responses, EFS responses, high K+ depolarization induced responses, fluid induced peristalsis, muscle tension or phasic contractions. Gliotoxin was also incubated for either 30 min (FC), 90 min (or 4h) FA to disrupt glial functions and evaluate glial Ca2+ waves or muscle contraction.47 L-NAME was incubated for 30 min to test if the inhibitory nitrergic signaling pathway is involved in the BQ788 effect. SaTX or ET-1 were incubated for 1–5 min to evaluate agonist effects at concentrations ranging from 0.5nM-100nM. In a postoperative ileus (POI) model of gut inflammation and abnormal motility, we tested whether ET-1/ ETBR signaling was altered by evaluating ETBR protein or mRNA expression, ETBR expression in Ednrb-EGFP reporter mice, ET-1 dependent neuron-to-glial communication with high K+ depolarization, or sensitivity to SaTX in glial Ca2+waves. MPO or a panel of inflammatory markers were used to confirm inflammation in the POI model. In vivo administration of the ETBR antagonist BQ788 was used to test whether ET-1 signaling contributes to intestinal inflammation in the mouse POI model.
Electrical Field Stimulation (EFS):
EFS was used to activate the ENS in the intact neural networks of enteric ganglia of cell-specific reporter mice for glia (Sox10CreERT2;GCaMP5g-tdT) or neurons and glia (WntCre2;GCaMP5g-tdT). An S48 Grass stimulator was used to deliver EFS trains of 0.1msec duration, 40V at 0.1Hz, 1Hz, 3Hz, 10Hz and 25 Hz frequencies, 3 min apart for a 5 sec duration. EFS was applied to tissues in a Quick-Release Low-Profile Field-Stimulation Chamber (RC-49MFSH, Warner Instruments, Hamden, CT).
High K+ Depolarization:
A 75mM high K+ solution balanced in osmolarity by subtracting Na+ (modified Krebs buffer solution substituting for NaCl) was incubated with tissues for 2 min to trigger a Ca2+response in glia.
Ca2+ Imaging:
Ca2+imaging was done in cell-specific Ca2+reporter mice or human enteric glia cells (hEGC). Methods for loading hEGC for Ca2+imaging was described previously in our publications with minor in house modifications.35,38,39 Briefly, hEGCs grown on a number zero coverslip in a 30 mm culture dish were incubated with 2 μM Fluo-4/AM (Invitrogen, Eugene, OR) in DMEM with no FBS for 30 min at 37°C and replaced with fresh media for an additional 30 min. At the end of this incubation, cells were placed on a stage of an up-right Nikon Eclipse FN1 microscope (Nikon, Tokyo, Japan) with a 20x-water immersion objective (Nikon Fluor, 0.50 n.a.) for Ca2+imaging. A fluo-4 filter cube/dichroic set was used to capture fluorescence of fluo-4 loaded cells. The fluorescence Ca2+signal was passed through an excitation filter model ET480/×40 center wavelength at 480-nm with 40-nm bandwidth, T510lpxrxt beamsplitter, and ET535/50-nm emission filter center at 535-nm with 50-nm bandwidth. For imaging in Ca2+reporter mice, flat sheet preparations of LMMP (0.8×0.8cm2) were stretched over a piece of glass embedded in Sylgard and pinned flat, to allow visualization and imaging. The same imaging system was used for monitoring Ca2+ signals in Ca2+reporter mice. Time-series images of Fluo-4 or GCaMP5g fluorescence (indicative of intracellular free [Ca2+]i levels) were acquired at 7 frames/sec using an ANDOR iXon Ultra 897 EMCCD camera (Andor, Belfast, UK) controlled by NIS Elements Advanced Research software (Nikon, Tokyo, Japan). Cells were perfused with a peristaltic pump at 4 ml/min with oxygenated Krebs solution (mM: NaCl 120, KCl 6.0, MgCl2 1.2, NaH2PO4 1.35, NaHCO3 14.4, CaCl2 2.5, glucose 12.7) or SaTX (0.5nM – 20nM) diluted in Krebs buffer and applied by perfusion for 120 s. Recordings were made until the responses recovered to baseline. A “solution inline heater” (Warner Instruments, Inc., Hamden, CT) was used to maintain the perfusion temperature at 36.5°C ± 0.5°C. Glial cells were identified by tdTomato fluorescence in Sox10CreERT2;GCaMP5g-tdT samples; tdTomato fluorescence was detected using excitation (535 nm, 20 nm) and emission (610 nm, 75 nm) band-pass filters. Neurons were identified and selected manually based on morphology, size, topography, and lack of tdT fluorescence and responsiveness to electrical stimulation (or high K+ depolarization).
Isolation of glial cells from human specimens, purification and cultures of hEGC:
The IRB protocol was approved by the ethics committee of the College of Medicine at The Ohio State University to collect surgical tissue from colon of patients undergoing a colectomy (sigmoid colon removal for polyps or cancer); surgical tissue was collected from the non-pathologic margins. Informed consent was obtained before procurement of surgical tissue for the isolation and establishment of purified human enteric glial culture networks. Methods were described in detail in our previous publications.38,50 Briefly, after cells reach semi-confluence in 3 to 4 weeks, hEGC were enriched and purified by eliminating / separating fibroblasts, smooth muscle, and other cells. Glial cell enrichment and purification were achieved by labeling the isolated cells with magnetic microbeads linked to anti-D7-Fib specific antigen and passing them through a magnetic bead separation column following the manufacturer’s instructions (Miltenyi Biotec Inc., San Diego, CA). This purification protocol was performed twice (P1 and P2) to reach a cell enrichment of up to 10,000-fold. Cells (> 95%) are strongly immunoreactive for the glial protein s100β and cells rarely label for α-smooth muscle actin (α-SMA).
Isolated networks of intact human myenteric ganglia:
Isolation of intact human networks of human myenteric plexus ganglia was done according to methods published by Grundmann et al.51 Networks were loaded with 5μM fluo-4/AM for 45 min and rinsed with Krebs buffer for 45 min for Ca2+ imaging using the same Nikon Eclipse FN1 microscope imaging system described above.
Mouse Postoperative ileus model of muscularis externa inflammation:
The method for surgical gut manipulation is similar to that described previously35,52 with a few in house modifications. Briefly, mice received a subcutaneous injection of 30 mg/kg Tramadol HCl 1h prior to surgery. The animal was placed on a heated pad (370C) and was anesthetized by inhalation of isoflurane (induced at 3%, 3 L/min flow and maintained at 2%, 2 L/min flow). A 1 cm midline incision was made to open the skin and peritoneum. The entire small bowel was gently removed/exteriorized from the peritoneal cavity, placed on sterile cotton gauze, and lightly manipulated by using two sterile moist cotton swabs two times from duodenum to terminal ileum. After intestinal manipulation (IM), the small bowel was carefully placed back in the cavity and the abdomen was closed by two layers of continuous sutures using 5.0 silk thread. The animal was awake and freely moving around the cage within 15 min. The operated mouse received a second dose injection of Tramadol HCl (30mg/kg) 2 h after the surgery and 1 mg/ml Tramadol HCl in drinking water was provided until they were sacrificed 3 h (3 h IM) or 24 h later (24 h IM). Control mice (no surgery), gut surgical manipulation (IM) or sham-operated animals (incision + anesthesia) were studied. Intestinal inflammation in the ME was identified by neutrophil infiltration (MPO+ cells)35 or inflammatory markers by Nanostring analysis38.
In vivo intestinal transit with FITC-dextran:
Intestinal transit was evaluated in vivo by assessing the distribution of a 70 kDa FITC conjugated dextran marker (Sigma, St Louis, MO, USA) in the small intestine and colon of control, gut manipulate (IM), or sham-operated mice. Mice were fasted for 12 hours and then given 0.1 ml of 5mM FITC-dextran orally by gavage; after 90 minutes, mice were euthanized, and the small intestine was divided into 10 segments of equal length (S1–S10) and the colon into 4 equal segments labeled as C1–C4 from oral to distal colon and rectum. Each segment was flushed with 3 ml of 50 mM Tris buffered saline solution and samples were then centrifuged at 1200 rpm for 5min. The fluorescent activity of the supernatant was quantified using a fluorimeter at excitation 485nm and emission at 525nm. Intestinal transit was analyzed according to the intestinal mean geometric center (MGC) of the distribution of FITC-dextran throughout the intestines.35,53
Propulsive motility and spatiotemporal imaging:
Mouse colon segments were used to test the effect of distension with luminal fluids on peristaltic contractions. Colons were removed, mesentery trimmed, and placed in 20 ml perplex baths perfused with warmed, oxygenated Krebs buffer. Video cameras were placed over the segments which were transilluminated. After 30 min equilibration, peristalsis was initiated by intraluminal instillation of 5 μl Krebs buffer/mm of length. Video recordings were made for 1000 sec after which the intraluminal fluid was removed, and the preparation allowed to recover for 30 min with constant extraluminal perfusion with fresh Krebs buffer. After this period, the bath fluid was replaced with 20 ml Krebs containing 1 μM BQ788 or 50 nM SaTX or other drugs and video recordings were repeated. The data was analyzed, and spatiotemporal maps were made from all video recordings using the software associated with the GastroIntestinal Motility Monitoring system (GIMM; Catamount Research & Development, St Albans, VT). The width of the segment was represented in grey scale with a smaller diameter represented by lighter shades and wider diameter represented by darker shades. The number of peristaltic waves per 1000 s was calculated as waves moving in the oral-anal direction and the velocity of individual waves calculated in mm/s from the slope of each wave.54
Isometric Tension Recordings of circular muscle:
In vitro isometric muscle tension recordings in the circular muscle (CM) direction were recorded using a Radnoti tissue organ bath system (Radnoti LLC, Covina, CA) using 5 ml volume baths. Mouse colon LMMP-CM preparations were used with mucosa and submucosa carefully dissected away under a microscope. LMMP-CM tissue is cut into strips of ~3mm x 8mm in the circular muscle direction. The tissue is tied-off at both ends with a suture and hung in the circular muscle direction. It is then stretched to 0.5g of tension and allowed to equilibrate for 1h, draining and refilling the bath every 15 min. before starting studies. Electrical field stimulation was applied at frequencies ranging from 0.5 to 30Hz (60V, 0.5ms pulse duration). A 10 sec stimulation is applied using a Grass 48S stimulator (Grass Medical Instruments, Quincy, MA) at 5 min intervals. EFS elicits a CM contraction. The ETBR antagonist BQ788 (3uM) is incubated alone for 30 min to test whether ET-1 exerts a physiological effect on CM contractions. Carbachol (100μM) or substance P (1μM) responses at the end of the experiment are used to normalize EFS responses. Atropine (10μM) or TTX (1μM) are applied for 15 min to determine the effects on EFS responses.
ET-1/ETBR expression in the digestive tract:
For ETBR expression, Tg(Ednrb-EGFP)EP59Gsat /Mmucd reporter mice were used to identify the cellular distribution and expression of ETBR in the intestinal wall. EGFP expression is linked to ETBR expression. Localization of ETBR in different types of cells was identified by co-labeling studies for ET-1, HuC/D, S100β, GFAP, α-SMA, and chromogranin A. An antiserum for EGFP was used to confirm which cells express detectable levels of EGFP-immunoreactivity in Tg(Ednrb-EGFP)EP59Gsat/Mmucd reporter mice that may have low level EGFP expression.
Co-labeling studies for ET-1 and/or ETBR were done in whole mount microdissected LMMP-CM intestinal tissues from wild-type mice, Tg(Ednrb-EGFP)EP59Gsat/Mmucd reporter mice for ETBR using EGFP fluorescence expression, or Sox10CreERT2;GCaMP5gtdT mice with tdT+ enteric glia. Isotopic antibodies for primary antisera or pre-absorption with control peptides for the immunogenic site of the antibody, if available, were used as controls; omission of primary antibodies was used as a control for secondary antibodies. Neither primary antibody nor secondary antibody dilutions were reused.
The following antibodies were used for immunofluorescent staining and Western blot studies (Supplement Table 1). The primary antibodies used were : Endothelin B receptor (Alomone, Cat # AER-002, RRID: AB_203984); Endothelin B receptor (Abcam, Cat # ab117529, RRID: AB_1090207); Endothelin B receptor (GeneTex, Cat # GTX17408, RRID: AB_374462); Rabbit Isotype control (Invitrogen, Cat # 31235, RRID: AB_243593); Chicken Isotype control (Abcam, Cat. # ab50579, RRID: not available); Anti-GFP (Abcam, Cat # ab13970, RRID: AB_300798); Smooth muscle actin, Clone EPR5368 (Abcam, Cat # ab124964, RRID: AB_11129103); Endothelin 1 (Abcam, Cat # ab113697, RRID not availabe); HuC/HuD, Clone EPR19098 (Abcam, Cat # ab184267, RRID: AB_2864321); S100 beta, Clone 4C4.9 (Abcam, Cat # ab4066, RRID: AB_304258); S100 beta, Clone EP1576Y (Abcam, Cat # ab52642, RRID: AB_882426); MHCII (Novus, Cat # NBP2–45312, RRID not available); MPO (Abcam, Cat # ab9535, dil: 1:100, RRID: AB_307322); CD68, Clone FA-11 (Bio-Rad, Cat # MCA1957T, RRID: AB_322219): Peripherin (Novus, Cat # NBP1–05423, RRID: AB_1556333); GFAP (Abcam, Cat # ab4674, RRID: AB_304558), and Chromogranin A (Abcam, Cat # ab15160, RRID: AB_301704). The following secondary antibodies were used immunofluorescent staining (diluted 1:400): donkey anti-rabbit, Alexa 488 (Invitrogen, Cat # A21206, RRID: AB_2535792); donkey anti-mouse, Alexa 488 (Invitrogen, Cat # A21202, RRID: AB_141607); donkey anti-mouse, Alexa 568 (Invitrogen, Cat # A10037, RRID: AB_2534013); donkey anti-rat, Alexa 488 (Invitrogen, Cat # A21208, RRID: AB_2535794); goat anti-chicken, Alexa 568 (Invitrogen, Cat # A11041, RRID: AB_2534098); goat anti-rabbit, Cy5 (Invitrogen, Cat # A10523, RRID: AB_2534032), and NucBlue Fixed Cell Ready Probe Reagent (DAPI) (ThermoFisher, Cat # R37606, 2drops/1 ml). The following secondary antibodies were used for Western blots (dilution 1:5000): donkey anti-mouse, IRDye 680RD (Li-Cor, Cat # 926–68072, RRID: AB_10953628); donkey anti-rabbit, IRDye 800CW (Li-Cor, Cat # 926–32212; RRID: AB_621847); donkey anti-goat, IRDye 680RD (Li-Cor, Cat # 926–68074, RRID: AB_10956736); donkey anti-chicken, IRDye 680RD (Li-Cor, Cat # 926–68075, RRID: AB_10974977). Note: The 3 different ETBR antibodies tested were not suitable for immunofluorescent labeling in the mouse gut; however, they were suitable for western blots for ETBR (see Fig. 1). Another antibody raised in sheep was used to label ETBR in trigeminal ganglion neurons23, but this antibody is no longer available from the company.
Figure 1. Expression of ETBR in muscularis externa (ME) of wild-type mice and glia of RiboTag (Sox10-EGCs) mice.

(a) Quantitative PCR analysis identified mRNA transcripts in ME of wild-type mice for ETBR, ETAR, ET1, ET3, ENTPD2, GFAP, s100β, GDNF, Nestin, PLP and Sox10; n=5 mice; differences between groups are significant at *p<0.01. Note: ETBR expression >> ETAR expression. For Fig. 2a, one-way ANOVA, followed by multiple comparisons using Tukey’s test, *p<0.01. (b) In RiboTag (Sox10-EGCs) mice, mRNA levels for ETBR >> ETAR (**p<0.001) (c) Protein expression of ETBR reveals 2 immunogenic bands at ~52kDa and 42kDa (ETBR1, arbitrary label) in the ME of jejunum or colon. (d) In CM, ETBR protein is not expressed; α-smooth muscle actin (SMA) is highly expressed in the CM of the same lysate samples. (e) Quantitative analysis of ETBR protein in ME. (f) ETBR1 is expressed in ME but not CM. (g) ETBR is not expressed in CM identified by α-SMA; n=6 mice.
3-D imaging of co-labeled cells:
A Nikon A1R confocal imaging system was used for z-stack imaging and 3-D reconstructions of co-labeled cells in intact LMMP preparations of the mouse. Cells were imaged on the stage of a Ti2e fully motorized inverted microscope with a motorized XY stage visualized through a 60X oil immersion objective (1.20n.a.) with a working distance of 0.15–0.18 mm. The LU-NV series laser unit provided the excitation / emission spectra for GFP (ex.487; em.500–550), Texas Red (ex. 561, em.570–620), Alexa 647 (ex.639, em.663–738), and DAPI (ex.402, em.425–475). A Galvano scanner was used to scan images, and z-stack images were acquired at 0.3μm steps; optical slice thickness ranged from 10–30μm depending on paraffin or tissue preparation, and layers being imaged. Image resolution was at 1024 × 1024 pixels, images were averaged 2x, and the pinhole was set at 0.8–1.2. Images were processed using NIS-Elements AR software.
Protocol for immunofluorescence co-labeling studies in tissues:
Microdissected LMMP-CM tissues were fixed in 4% PFA overnight and remaining CM was removed the next day. Tissues were washed with 1X PBS, 3 times, at 15 min intervals, on a horizontal shaker at room temperature, and then blocked with 0.5% Triton and 10% NDS at room temperature for 1 h. The blocking solution was discarded, and primary antibody was added (diluted in 1% NDS and 0.5% Triton). Tissue was incubated for 48 h at 4oC. The excess primary antibody was washed off with 1X PBS, 3 times at 15 min intervals as noted before. Secondary antibody was added (diluted in 1% NDS and 0.5% Triton) and incubated at room temperature for 2 h in the dark. Tissues was washed as before and then incubated with DAPI for 10 min at room temperature in the dark followed by a 1 min wash in 1X PBS. The tissues were then mounted on slides and coverslips applied with Fluoromount (#0100–01, SouthernBiotech, Birmingham, AL).
Immunofluorescent co-labeling of Ednrb-EGFP mouse in paraffin sections:
To rehydrate and de-paraffinize tissue, sections were immersed in Citrisolv twice for 3 min each, then transferred to 100%, 95%, 70% ethanol consecutively for 3 min each. Sections were transferred to deionized water twice, for 3 min each. Once the rehydration steps were completed, the slides containing the sections were transferred to a Coplin jar containing sodium citrate buffer (pH 8.0) and heated to 970C in an oven for 30 min. After the incubation, the slides were cooled in the buffer for 20 min. For tissue permeabilization, Kimwipes and Q-tips were used to dry the area around the tissue sections on the slides. A square area was drawn around each of the sections with a hydrophobic PAP pen. The tissues were washed with 1X PBS, 3 times for 15 minutes each. Permeabilization buffer was added to the tissues (0.5% Triton in 1X PBS) and kept at room temperature for 30 min. Tissues were incubated at room temperature with the blocking buffer (10 % NDS, 0.5% Triton in 1X PBS) for 1 h. Primary antibodies were added to the antibody solution (1% NDS, 0.5% Triton, 1X PBS). Antibodies were incubated with tissue sections overnight at 4°C. The sections were washed 3x with 1X PBS for 15 min each. Secondary antibodies were incubated for 2 h in the dark and followed by washing the sections 3 time with 1X PBS, 15 min each in the dark. DAPI is added as a counterstain for nuclei.
Western Blot protocol
Samples were thawed on ice and then ground with mortar and pestle, keeping the mortar on ice. A volume of 200 μl of RIPA buffer (Catalog Number- 89901, Thermo Scientific, Rockford, IL) plus protease inhibitor (Catalog Number-78430, Thermo Scientific, Rockford, IL);100:1) was added to the ground sample and the whole homogenized mixture was transferred to an Eppendorf tube. The tube was kept on ice for 30 min and then centrifuged at 13,000 rpm for 20 min at 4ºC. The supernatant was collected for further analysis or stored at −80ºC.
The OD for each sample was measured in a Perkin Elmer Victor 3 1420 Multilabel counter. Samples were mixed with 4X Laemli Buffer (4:1) and then boiled in a water bath for 10 minutes and kept on ice. Either 15μl or 50μl capacity wells (Catalog Number- 4561096, BIO-RAD) SDS gel was used; a 5μl volume of protein marker/ ladder (Catalog Number- 1610374, BIO-RAD) was loaded onto one lane. The gel was run at a constant voltage of 65V for 1.5 h or until the dye font reached the bottom of the gel, at room temperature, in 1X Tris/Glycine/ SDS running buffer (Catalog Number- 1610732, BIO-RAD). After the gel was run, the Western Blot protein transfer apparatus was assembled. The PVDF membrane (Immobilon-FL, Catalog number-IPFL00010, BIO-RAD) was placed in 100% methanol for 5 min and then transferred to the 1X Western Blot Tris/Glycine running buffer (Catalog Number- 1610734, BIO-RAD) for 5 min. The apparatus was sandwiched as follows: A sponge on the black (cathode) side, filter paper on top, SDS gel with the proteins, PVDF membrane, filter paper, sponge. All the above were pre-wetted with the 1X Western Blot Tris/Glycine transfer buffer prior to stacking. The stack was placed in the gel apparatus, with the red side of the cassette facing the anode and the black side facing the cathode and filled with the transfer buffer. The protein transfer was run at a constant voltage of 20V overnight. For antibody staining, the membrane was blocked for 1 h at room temperature and then incubated with primary antibody overnight at 40C; a 5% milk (Blotting-Grader Blocker, Catalog number-1706404, BIO_RAD) in TBST was used as blocking reagent and the primary antibody was diluted in blocking reagent. The next day, the membrane was washed with PBST, 3 times, 5 min each and then incubated with secondary antibody in blocking buffer at room temperature for 2 h in the dark. The membrane was washed with PBST, 3 times, 10 min each.
Post image analysis:
Images were acquired using the LI-COR Odyssey DLx imaging system. Densitometry was calculated using the blots compared to the GAPDH bands in the ImageJ (FIJI) software. Expression of ETBR or other proteins are expressed as a percent of GAPDH expression in the same samples and plotted as a histogram.
Real-time PCR analysis:
Real-time PCR mRNA analysis for endothelin transcripts was done from ME samples. Suppl. Table 2 lists the Taqman assays for endothelin signaling and glial markers. To perform the Real-Time PCR analysis, 1.05 μg of total RNA was retro-transcripted using the High Capacity cDNA Reverse Transcription kit (Life Technologies). According to manufacturing protocol, 1 μl of cDNA was combined with 9 μl of a premade mix that included the TaqMan® Fast Advanced Master Mix and the TaqMan gene expression assay (predesigned by Applied Biosystems). The Comparative real-time PCR was performed in triplicate, including no-template controls and analyzed using Quant Studio 12K Flex system. The Ct Average of each triplicate was used to perform the relative quantification analysis. RNA input was normalized using Mouse GAPDH (Mm99999915_g1) as a reference gene and the relative expression was calculated using the comparative Ct method.
RNA isolation method:
Samples are transferred in 5 ml Polystyrene Round-Bottom tubes with 1 ml Trizol and tissues are disrupted using a homogenizer mixer. This step was performed on ice. The samples were forced to pass through a 26G needle using an insulin syringe to complete the homogenization. The homogenized product was then incubated 5 min at room temperature and 0.2 ml of chloroform was added. The samples were mixed vigorously for 15 sec, incubated 3 min at room temperature and centrifuged 15 min at 12,000 x g at 4°C in a refrigerated centrifuge. The clear upper phase was recovered in a fresh tube. An equal volume of 70% ethanol was added to each sample, mixed vigorously for 10 sec and applied to an RNA clean-up and concentration column (Norgen Biotek Corp, product # 23600). According to the protocol, columns were spun 1 min at 3,500 x g followed by 1 min at 14,000 x g. The columns were washed 3 times using 400 μl of Wash A solution (provided in the kit and previously diluted with 100% Ethanol as per manufacturer’s specifications) and spun 2 min at 14,000 x g to dry the column resin; a 50 μl volume of Elution Solution A was applied to the columns and, after 5 min at room temperature, they were spun 1 min at 200 x g followed by 2 min at 5,800 x g and 30 sec at 14,000 x g to collect total RNA. For maximum recovery, the eluted RNAs were transferred back to the column and subjected to the same protocol again.
RiboTag-based mRNA immunoprecipitation:
Cell-specific mRNA from glia and neurons was obtained from Sox10CreERT2;Rpl22-HAflx or ChATCre; Rpl22-HAflx mice small bowel ME according to previously published protocols [Technote]. Briefly, the small bowel was removed, the ME mechanically removed from the mucosal layer and placed in RNAlater (Thermo Fisher Scientific, product # AM7021). ME lysis was performed with a Precellys homogenizer (Bertin Instruments) at three times for 45 s at 5000 rpm followed by a 10 min spin down at 10000 x g, at 4°C. Cleared lysate was incubated with anti-HA antibody (Biolegend, product # 901503) for 4 h at 4°C, 7 rpm, followed by conjugation with 200 μl A/G dynabeads (Thermo Fisher Scientific, product # 88802) and incubated overnight at 4°C, 7 rpm. Beads were rinsed three times, ribosomes with mRNA eluted from the beads and mRNA extracted with a Qiagen micro kit according to the manufacturer’s manual.
Data analysis:
Raw Ca2+ imaging files were analyzed with NIS Elements Advanced Research software where regions of interest (ROIs) were drawn around enteric glial cells and neurons within a ganglion and the relative fluorescence intensity was measured. Analysis and generation of traces were performed using GraphPad Prism 8 (GraphPad Software, La Jolla, CA). Averaged traces represent the average change in fluorescence (ΔF/Fo) over time for all glial cells and neurons within a single ganglion. ΔF/F0 indicates the peak intensity of the Ca2+response. Responsive glia/ganglion or neurons/ganglion indicate the number of cells involved in the Ca2+wave in the intact neural network. For qPCR (or western blots), GAPDH was used to normalize data for gene transcripts (or proteins) and data are presented as 2^-ΔCt. For organ bath studies, data were normalized to % of carbachol (or substance P) response added at the end of the experiments. ST imaging maps for fluid induced peristalsis were analyzed for frequency of peristaltic waves and velocity of peristaltic waves (see motility section). Image-J software was used to evaluate co-localization of neuronal markers by immunofluorescence.
Data Analysis and Statistics:
Data were analyzed using GraphPad Prism 8 (GraphPad, San Diego, CA) and are reported as mean ± SEM. A p value of <0.01 was considered statistically significant; ‘n’ values (i.e. ‘n’ refers to the number of animals, numbers of ganglia or numbers of cultures analyzed in separate experiments) and statistical tests used are reported in the figure legends and results. Unpaired or paired t-tests were used to analyze data between 2 groups depending on the experimental protocol. A one-way ANOVA followed by multiple comparisons using Tukey’s test was used to make multiple comparisons. In multi-group studies with parametric variables, post hoc tests were conducted only if F in ANOVA achieved a significance level of 0.001. Concentration-response curves to ET-1 or SaTX were analyzed by one-way ANOVA. Two-way ANOVA was used to analyze differences between multiple interventions at different frequencies of stimulation, and Sidak’s multiple comparison test (i.e. Figs 7, 8, 9); a 2-way ANOVA using a mixed effects model was used when appropriate. Sample sizes were determined from previous experimental data using a power of 0.8 and a significance level of 0.01. A P value of 0.01 is the threshold for statistical significance for determining whether groups differ. Statistical analysis was undertaken only for studies where each group size was at least n=5. The declared group size is the number of independent values, and that statistical analysis was done using these independent values. Outliers were included in data analysis and presentation. Where western blotting or immunohistochemistry has been conducted the experimental detail provided conforms with BJP Guidelines (Alexander et al,2018:175(3):407–411). The manuscript complies with BJP’s recommendations and requirements on experimental design and analysis (Curtis et al, 2018: BJP 175:987–993).
Figure 7. The physiological action of the selective ETBR antagonist BQ788 is to enhance neuromuscular responses of the circular muscle (CM) to electrical field stimulation (EFS).

(a) Representative organ bath experiment showing that the EFS response is attenuated with 100nM SaTX at 20Hz, and the response fully recovers in the continued presence of SaTX. The response to EFS is abolished by blocking nerve conduction with 1 μM TTX. (b) Pooled data of the effects of SaTX on neuromuscular contractions induced by 20Hz EFS stimulation for data shown in (a). In separate experiments, SaTX is shown to inhibit 1Hz and 3Hz EFS stimulation. (c-d) two representative experiments showing the frequency-dependent effect of 3μM BQ788 EFS responses. (e-f) BQ788 significantly enhances the frequency-dependent CM contractions to EFS; n=8 animals. 2-way ANOVA and post hoc analysis using Sidak’s multiple comparison test, *p<0.01; **p<0.001; ***p<0.0001). (g-i) The influence of 3μM BQ788 on CM contractions is prevented by pretreatment with the gliotoxin FC (fluorocitrate at 300μM for 30 min) to disrupt glial functions; n=6 (or more) animals; 2-way ANOVA and post hoc analysis using Sidak’s multiple comparison test, *p<0.01; **p<0.001; ***p<0.0001).
Figure 8. The physiological action of the selective ETBR antagonist BQ788 is to enhance EFS-induced glial Ca2+ waves.

(a-i) EFS induced Ca2+ waves were studied in Sox10CreERT2;GCaMP5g-tdT glial Ca2+reporter mice. (a-c) A representative experiment in 1 animal showing that 1μM BQ788 superfusion of preparations for 30 min enhances the EFS (20Hz) Ca2+wave response in glia of the intact myenteric plexus; individual cells are shown in (a) and (b) and the average response from all the glia/ganglionic field is shown in (c). (d, e) Blockade of ETBR with BQ788 causes an increase in both the peak intensity of the Ca2+response and the number of glia/ganglion responding in the EFS-induced Ca2+wave. (f) The response to EFS is abolished by 1μM TTX. (g) The response to EFS is partially blocked by the P2 receptor antagonist PPADS (30μM) confirming that purinergic signaling contributes to the EFS response 56. (h) The ectonucleotidase inhibitor ARL67156 (200μM, 15 min superfusion) significantly augments EFS responses. (i) Exogenous ATP (100μM) that activates P2 receptors triggers a Ca2+wave in enteric glia. *p<0.01.
Figure 9. The physiological action of the ETBR antagonist BQ788 is to enhance both ENS activation and excitatory cholinergic CM contractions.

(a-b) EFS induced Ca2+ waves in neurons were studied in Wnt1Cre2;GCaMP5g-tdT Ca2+reporter mice. (a) The peak intensity of the Ca2+response was enhanced by BQ788 incubation for 30 min. (b) In contrast, the number of neurons/ganglion responding in the intact neural circuits was not influenced by BQ788. (c) The action of BQ788 is mitigated by the muscarinic antagonist atropine (10μM) used to block excitatory cholinergic CM contractions. (d) In contrast, BQ788 could not enhance or affect the direct muscle contraction caused by the muscarinic agonist carbachol (30μM, *p<0.01). For Fig. 9c, *p<0.01; 2-way ANOVA using mixed effect model, n=8 or more animals for each group. For Fig. 9d; n=8 animals/group; ns, not significant). (e) Working model of the physiologic effect revealed by BQ788 on ET-1/ETBR signaling in the ENS and motility. EFS nerve stimulation activates two distinct signaling pathways. First, it activates a stimulatory pathway in neurons to release transmitter(s) to trigger a glial Ca2+ wave. Purinergic signaling contributes to the neuron-to-glial communication as shown in previous reports56. Second, EFS activates the release of endogenous ET-1 from varicose nerve fibers to activate ETBR in glia to inhibit glial Ca2+waves. Glial Ca2+ waves modulate ENS activation of excitatory cholinergic motor pathways to muscle that regulate intestinal peristalsis. Evidence from the current study suggests that endogenous ET-1/ETBR signaling inhibits excitatory neural motor circuits in the ENS involved in CM contractions and fluid induced peristaltic waves. Nitric oxide (NO) signaling could also be involved in the inhibitory mechanism. Overall, endogenous ET-1 may provide inhibitory modulation of excitatory glial motor pathways that can be revealed by pharmacological blockade of glial ETBR with BQ788.
Nomenclature of Targets and Ligands
Key protein targets and ligands in this article are hyperlinked to corresponding entries in https://www.guidetopharmacology.org and are permanently archived in the Concise Guide to Pharmacology 2021/22 (Alexander et al, 2021).
3. Results:
The expression, distribution and localization of ETBR (Ednrb) was determined in WT, Tg (Ednrb-EGFP) EP59Gsat/Mmucd mice and / or RiboTag (Sox10-EGC) mice.
1. Distribution and localization of ETBR:
qPCR and protein expression of ETBR:
Quantitative PCR (qPCR) analysis identified mRNA transcripts in ME for ETBR, ETAR, ET-1, ET-3, ENTPD2, GFAP, s100β, GDNF, nestin, PLP and Sox10 (Fig. 1a). Expression of ETBR is much greater than ETAR (or glial makers, *p<0.01). RiboTag (Sox10-EGCs)55 mice confirmed that ETBR ribosomal mRNA expression is much greater than ETAR (Fig. 1b, **p<0.001).
Protein analysis:
An anti-ETBR antibody revealed bands at 52kDa and 42kDa. Both bands were expressed in colon and jejunum ME (Fig. 1c). The 52kDa band represents ETBR. The 42kDa band was arbitrarily given the name ETBR1 since it is recognized by the anti-ETBR antibody. Note: mucosa and HEK-293 cells also express the 52kDa band (data not shown as focus is ETBR signaling in ME). ETBR is not expressed in CM (Fig. 1d). Quantitative data for ETBR protein expression is shown in Fig. 1e-g. ETBR1(42kDa band) is absent from CM but is expressed in ME (Fig. 1f).
2. Tg(Ednrb-EGFP)EP59Gsat/Mmucd mice:
ETBR expression was analyzed by quantifying the EGFP fluorescence in LMMP-CM from Tg(Ednrb-EGFP)EP59Gsat/Mmucd mice (Fig. 2). EGFP+ cells were 31.1±2.14 cells/ganglion versus 1.47±1.22 cells/field outside the ganglia (Fig. 2a). Co-labeled EGFP+/s100β+ co-labeled cells made up 85.19±5.38% cells/ganglion (Fig. 2b, n=5–7 mice). The EGFP reporter is restricted to s100β+glia in myenteric ganglia of the colon (Fig. 2a, b), jejunum and ileum (Suppl. Fig. 1). EGFP reporter is absent from HuC/D+ neurons (Fig. 2b). Images showing EGFP expression are shown in Fig. 2c-k. EGFP reporter is co-localized with GFAP (Fig. 2e) or s100β (Fig. 2f-h) but not HuC/D (Fig. 2i). Using an antibody to EGFP, we could confirm that in ME, EGFP-immunoreactivity in Tg(Ednrb-EGFP)EP59Gsat/Mmucd mice is expressed only in glia. In gut mucosa, a few epithelial cells express EGFP (Fig. 2j, k).
Figure 2. Cellular expression and distribution of EGFP reporter protein in the intestinal tract of Tg(Ednrb-EGFP)EP59Gsat/Mmucd ETBR mice.

(a) EGFP is expressed in myenteric ganglia and is absent in extra-ganglionic cells of the ME in intact LMMP-CM preparations. (b) EGFP reporter is exclusively expressed in glia (s100β+ cells) and is absent from neurons (HuC/D+ cells) in myenteric ganglia of the ME; for a and b, n=35 image fields (5 image fields/animal and counts of all EGFP cells; n=7 animals) (c) Black and white LSM image of ETBR+ glial cells in myenteric ganglia visualized by EGFP expression. (d) Another LSM image of ETBR+ glial cells in myenteric ganglia visualized by EGFP. (e) Co-localization of ETBR+ cells (green) with the glial marker GFAP (red); yellow denotes colocalization. (f-h) Co-localization of ETBR+ cells with the glial marker s100β; (f) image of ETBR+(EGFP) cells; (g) image of s100β+ glia; (h) overlay image for co-labeling of EGFP and s100β+ cells. (i) ETBR (green) is co-localized in s100β+glia (red) but not neurons (blue, HuC/D); co-localized cells in the overlay image are yellow. (j) GFP-immunoreactivity (ir) in de-paraffinized cross-sections of the colon (10μm sections, 3-D z-stack constructed at 0.5μm sections) is highly expressed in s100+glia and a few cells in the mucosa. (k) GFP-ir is not expressed in CgA+ enteroendocrine cells of the mucosa, but is expressed in myenteric ganglia (arrows) of the ME.
WBs with either an anti-EGFP (Fig. 3a) or an anti-Ednrb (ETBR) antibody (Fig. 3b) recognize the same protein in lysates of jejunum ME. The protein has a M.W. of ~90kDa which is higher than that of the Ednrb (ETBR) in WT mice with a M.W. of 52kDa (Fig. 1c). The EGFP antibody does not recognize any protein in WT mice (Fig. 3c). 3-D imaging using the anti-GFP (EGFP) antibody confirmed that EGFP is expressed in glia (Fig. 3d-f, h) not neurons (Fig. 3g, h) or smooth muscle (Figs 3j-l).
Figure 3. Ednrb (ETBR) expression in glia is revealed in LMMP-CM preparations from Tg (Ednrb-EGFP) EP59Gsat/Mmucd mice.
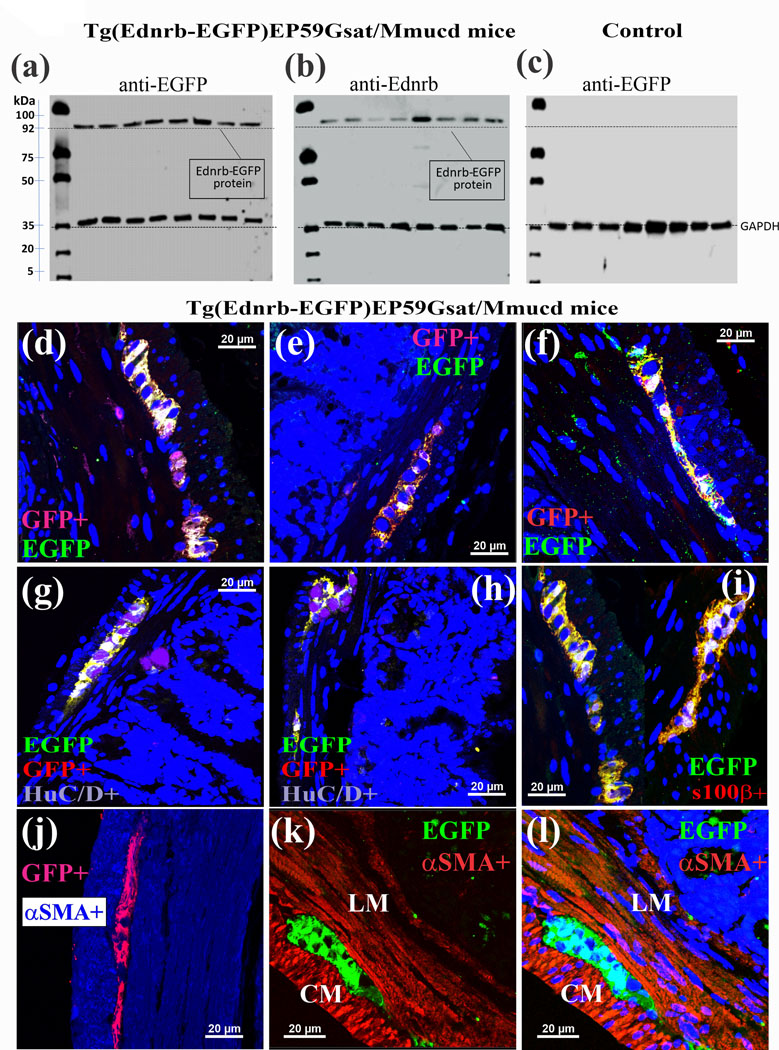
(a-b) Western blot analysis identified a protein with a molecular weight ~90kDa in Tg mice that was recognized by (a) an anti-EGFP antibody or (b) an anti-Ednrb antibody in lysates of jejunum muscularis externa. (c) In a control animal (wild type), EGFP is not expressed. (d-f) GFP (EGFP)-immunoreactivity is co-localized with the EGFP reporter protein. (g,h) GFP-immunoreactivity is not co-localized with HuC/D+ neurons. (i) GFP-immunoreactivity is co-localized with s100β+glia. (i-l) GFP-immunoreactivity is not co-localized with αSMA in smooth muscle layers. Z-stack images were captured by laser confocal imaging of GFP-immunoreactivity (ir) in de-paraffinized cross-sections of the colon (10μm sections, 0.5μm sections were used for z-stack analysis).
3. Ca2+waves are triggered by ETBR activation in Sox10CreERT2; GCaMP5g-tdT mice:
ETBR signaling in enteric glia was investigated on glial Ca2+waves in Sox10CreERT2; GCaMP5g-tdT mice. The selective ETBR agonist SaTX triggers a Ca2+wave in tdT+ glia (Fig. 4a-f). An example of individual glial cell Ca2+transients in the Ca2+wave for a single myenteric ganglion is shown in Fig. 4e. The average response of individual Ca2+ transients is used for quantitative analysis of peak Ca2+intensity (ΔF/Fo). The Ca2+ wave triggered by SaTX does not appear to be sensitive to 1μM TTX. The TTX resistant response to SaTX is consistent with a direct effect on glia. (Fig. 4g-k). The Ca2+response occurs in ~35 glia/ganglion in the colon (n= 5 animals; 25 ganglia analyzed; Fig. 4k). The Ca2+response spreads to 75–80% of glia in intestine (Fig. 4l).
Figure 4. SaTX triggers a glial Ca2+ wave in intact myenteric plexus preparations (LMMP).

(a-d) The selective ETBR agonist SaTX (50nM) triggers a Ca2+ response in glia; pseudocolor images according to intensity of Ca2+ response; glia are identified by tdT+cells (d). (e) The Ca2+ wave response to SaTX in the ganglion shown in images ‘a-d’ represents individual Ca2+transients occurring in each tdT+ glia. (f) Another example of a Ca2+ wave in a different ganglion. Note: the mean Ca2+ response obtained by averaging all the Ca2+ transients in each ganglion is shown, and it is used for quantitative analysis of the mean Ca2+ response/ganglion. (g-i) The Ca2+ response induced by 50nM SaTX persists in the presence of 1μM TTX; (g) the mean Ca2+ response to SaTX in a myenteric ganglion is shown before and after a 10 min perfusion of TTX; (h,i) images showing that the SaTX response in a ganglion still occurs after TTX treatment of the ganglion. (j) The Ca2+ response to SaTX does not appear to be sensitive to TTX treatment. (k) Number of glia/myenteric ganglion responding to SaTX with a Ca2+ wave in jejunum. (l) SaTX Ca2+ responses occur in glia of the myenteric plexus of the ileum, jejunum and colon. Ca2+imaging was done using Sox10CreERT2;GCaMP5g-tdT mice.
SaTX triggers a concentration-dependent Ca2+response in glia (Suppl. Fig. 3a,b; ANOVA,*p<0.01). Pre-incubation with the ETBR antagonist BQ788 (1μM) for 30 min blocks the Ca2+wave triggered by SaTX (Suppl. Fig.3c,d,e, *p<0.01); BQ788 has no effect on resting Ca2+levels ([Ca2+i]) (Suppl. Fig. 3c), and washout of BQ788 restores SaTX responses. The SaTX response occurs faster in a smaller 0.5ml perfusion chamber (Suppl. Fig. 3f). SaTX triggers a Ca2+wave in a culture network of human myenteric glia (Suppl. Fig. 3g-h) or networks of human myenteric ganglia (Suppl. Fig. 3i-j).
4. ET-1 release from the ENS activates ETBR signaling in enteric glia:
ET-1 Ca2+responses via ETBR: Endothelin-1 (ET-1) triggers a concentration dependent Ca2 response in glia from Sox10CreERT2; GCaMP5g-tdT mice. (Fig. 5a-e; p<0.01, 1 way - ANOVA). The selective ETBR antagonist BQ788 (1μM) blocks the Ca2+wave triggered by 50nM ET-1. Pre-incubation of the LMMP-preparation with BQ788 for 30 min prevents the ET-1 Ca2+response. The ET-1 effect recovers with washout of BQ788 (Fig. 5f, g).
Figure 5. Endothelin (ET-1) activates ETBR signaling in enteric glia from Sox10CreERT2;GCaMP5g-tdT mice.

(a-b). Exogenous ET-1 triggers a concentration–dependent Ca2+response in glia. (c-e) Pseudocolor images showing an example of a control baseline Ca2+response in the absence of ET-1 and the peak response to 50nM ET-1 in tdT+ glia; concentration-response curves, n=5, one-way ANOVA, p<0.01. (f) The selective ETBR antagonist BQ788 (1μM) blocks the Ca2+wave triggered by 50nM ET-1. BQ788 alone has no effect on baseline Ca2+responses. After exposure to BQ788 (30 min superfusion), ET-1 does not trigger a Ca2+response. Washout of BQ788 by switching to Kreb’s buffer perfusion for 20 min, and re-exposure to ET-1 triggers a Ca2+response; the Ca2+ response in ‘f’ represents the average response in all glia in the ganglion (referred to as mean Ca2+response/ganglion). (g) Response to ET-1 after BQ788 washout in ‘f’ shown for individual glial Ca2+transients in the Ca2+wave used to generate the mean Ca2+ response for the ganglion. (h-j) High K+ depolarization (75mM) of neurons triggers two different Ca2+waves/responses separated by time. (h) The individual glial Ca2+ responses in each ganglion were averaged as shown in ‘h’ for analysis of data in different ganglia for effects of TTX. The first Ca2+wave response is blocked by TTX whereas the second wave response is not sensitive to TTX as shown for a single ganglion (‘h’) and for pooled data (‘i, j’). (k) The Ca2+ wave responses in each ganglion were averaged as shown in ‘k’ for analysis of data in different ganglia for effects of BQ788. The ETBR antagonist BQ788 blocks the first Ca2+wave and reduces both the peak Ca2+intensity and numbers of glia responding as shown for a single ganglion (‘k’) and for pooled data (‘l, m’). For the second Ca2+wave, incubation pre-incubation with BQ788 causes a modest reduction only in the number of glia responding to high K+ depolarization; for Figs 5i, j, l, m, *p<0.01; ns, not significant; n=9 separate ganglion experiments in LMMP preparations. (n) Our working model of high K+ depolarization is illustrated, showing that activation of the cell soma of the neurons triggers a TTX-sensitive Ca2+wave (involving Nav-channels) involving the release of ET-1 from varicose nerve fibers in the ganglia (see Suppl. Fig. 2), whereas a delayed direct activation of varicose nerve fibers triggers a TTX-insensitive wave, although BQ788 could reduce the response. (*p<0.01; ns, not significant).
High K+ Depolarization of neurons:
High K+ depolarization (75mM) of neurons was used to stimulate ET-1 release. High K+ depolarization triggers two different Ca2+waves separated by time (Fig. 5h) The Ca2+transients in each ganglion were averaged for analysis of data in different ganglia (Fig. 5h,k). The first Ca2+wave is blocked by TTX whereas the second wave is not sensitive to TTX (Fig. 5h). Pooled data is shown in Fig. 5i-j. BQ788 significantly blocks the first Ca2+wave response (Fig. 5k-m). In the second Ca2+ wave, BQ788 only reduces the number of glia responding/ganglion. Our working model of the high K+ depolarization response is illustrated in Fig. 5n.
ET-1 neuronal expression in the mouse muscularis externa of the mouse small intestine:
The source of ET-1 in the ME was investigated by ET-1 immunoreactivity, RiboTag(ChAT)-Neurons55 and neural networks of human myenteric ganglia.
ET-1-immunoreactivity is abundant in intra-ganglionic varicose fibers in myenteric ganglia (Suppl. Fig. 2). ET-1+ nerve fibers are in close contacts with tdT+ glia in myenteric ganglia (Suppl. Fig. 2a, yellow staining over tdT+ glia). ET-1 is not expressed in HuC/D+ neurons (Suppl. Fig. 2b). ET-1 immunoreactivity is expressed in both SP+ and peripherin+ varicose nerve fibers (Suppl. Fig. 2c-f). 3-D imaging of ET-1-ir in a thicker z-stack to image through the entire thickness of LMMP-CM shows ET-1 is mainly expressed in intra-ganglionic varicose fibers (Suppl. Fig.2g-i). Edn1 (ET-1) mRNA expression was confirmed in RiboTag ChAT-Neurons55 (Suppl. Fig. 2j; n=8 animals/group). ET-1 protein was detectable in isolated human neural networks of myenteric ganglia (Suppl. Fig. 2k, l; n=8)56.
ETBR signaling inhibits peristaltic waves, phasic activity, and CM contractions, and induces CM relaxations:
(i). ET-1 modulation of fluid induced peristalsis:
SaTX inhibits fluid induced peristaltic waves in the distal colon of the mouse (Fig. 6). Fig. 6b shows that 50 nM SaTX can reversibly inhibit peristaltic waves induced by increasing pressure in the lumen with fluid. (c) SaTX (15 min) and BQ788 (15 min) have opposite effects on fluid induced peristalsis. Pooled data indicate that SaTX inhibits both the frequency of the peristaltic wave and the velocity of propagation of the peristaltic wave (Fig. 6d, e).
Figure 6. SaTX inhibits fluid induced peristaltic waves in the distal colon of the mouse.

(a) diagram showing the organ bath setup for elevating intraluminal fluid for spatiotemporal (ST) imaging of peristaltic waves. (b) representative example showing that SaTX (50 nM) can reversibly inhibit peristaltic waves induced by increasing pressure in the lumen with fluid. (c) SaTX has the opposite effect of BQ788 (1 μM) on fluid induced peristalsis. (d-e) SaTX inhibits both the frequency of the peristaltic wave and the velocity of propagation; (f-g) The gliotoxin fluoroacetate (90 min incubation, 0.1mM FA) partially reduces the magnitude of the Ca2+response (i.e. ΔF/Fo) and the number of glia/ganglion responding in the glial Ca2+wave (%glia/ganglion) elicited by SaTX. For Fig. 6d-e, n=5 (or more) animals, *p<0.01, ***p<0.0001; For f and g, data represent the number of separate tissue experiments done in Sox10CreERT2; GCaMP5g-tdT mice (n=11 different myenteric ganglia analyzed, *p<0.01). Data represents paired t-test analysis (with or without the intervention in the same preparations).
(ii). Gliotoxin disrupts SaTX-induced glial Ca2+waves:
We used a gliotoxin (90 min treatment, 0.1mM fluoroacetate) to disrupt glial function to show that it can inhibit SaTX-induced glial Ca2+waves (Fig. 6f,g; p<0.01). This is in keeping with the concept that SaTX inhibition of peristalsis (or EFS-CM contractions) involves glial ETBR activation.
(iii). Gliotoxin effects on fluid induced peristaltic waves:
The gliotoxin fluoroacetate (FA, 90 min) causes a concentration–dependent inhibition of the peristaltic waves, mimicking the effect of SaTX. Therefore, it was not possible to use FA to study interactions between FA and SaTX to further clarify if disrupting glial functions can alter SaTX-responses on peristaltic waves. In mouse colon, FA (0.1mM) decreases the frequency of peristaltic waves from 5.1±0.3 waves / 1000 s to 3.75±0.49 waves/1000 s (p=0.0463); 1.0 mM FA decreases it to 2.3±1.0 waves/1000 s (**p=0.001) and 5mM FA reduced it to 1.7±1.0 waves / 1000 s (**p=0.0002, n=5 (or more) animals.
(iv). BQ788 enhances CM contractions to EFS by interacting with glial ETBR:
The physiological action of the selective ETBR antagonist BQ788 is to enhance neuromuscular responses of the circular muscle (CM). In vitro experiments on CM contractions to EFS showed that 100nM SaTX could cause a significant, but modest, inhibition of 20Hz EFS-induced off-contractions of the CM (Fig. 7a-b). As shown, the response to SaTX becomes desensitized. The response to EFS is abolished by blocking nerve conduction with TTX (1μM). In separate experiments, SaTX inhibited 1Hz and 3Hz EFS responses (p<0.01, Fig. 7b). In contrast, BQ788 causes enhancement of the EFS response at frequencies ranging from 0.1Hz to 30Hz (Fig. 7c-f).
(v). Gliotoxin prevents BQ788 enhancement of EFS responses:
To test whether the effect of BQ788 involves enteric glia, we used gliotoxin to disrupt glial functions in the ENS. The response to BQ788 (Fig. 7g) is prevented by gliotoxin treatment (see Fig. 7g-i). Gliotoxin alone augments the control EFS response in CM (Fig. 7h) and after gliotoxin treatment, the effect of BQ788 is no longer evident (Fig. 7i).
(vi). SaTX – induced transient CM relaxations:
As shown in Suppl. Fig. 4a-d, SaTX (100nM) could induce transient CM relaxations. The mean time to initial response is 32.5±1.8 sec (n=10). Peak relaxation occurs after 48.5±4.1 sec (n=5). The response to SaTX was blocked by BQ788 (1μM, n=5) or TTX (1μM, n=5) (Suppl. Fig. 4e,f). In contrast, ET-1 induced direct CM contractions (Suppl. Fig. 4g, h, l) which could not be blocked by TTX (Suppl. Fig. 4i, n=5) or BQ788 (Suppl. Fig. 4k, n=5). Data is consistent with activation of ETBR by SaTX in glia of the ENS to cause CM relaxations.
(vii). Influence of BQ788 on resting tension and phasic contractions:
In 22 LMMP-CM preparations from 12 mice, BQ788 (1μM) had no effect on resting tension (Suppl. Fig. 5a-b). However, BQ788 could enhance phasic contractile activity in CM (Suppl. Fig. 5c-e) in 20/22 tissues. In 20/22 tissues, BQ788 increased phasic activity from 36.5±9.2 contractions / 5min sampling period to 86.2 ±8.9 contractions / 5 min (paired t-test, p<0.01). In 20/22 tissues, it significantly increased the amplitude of contractions from 0.079±.003 g tension to 0.146±.003 (p<0.01).
BQ788 reveals an inhibitory glial–neural motor pathway modulating excitatory cholinergic transmission to CM:
(i). BQ788 causes amplification of the EFS-induced glial Ca2+waves:
EFS-induced Ca2+ waves were studied in Sox10CreERT2;GCaMP5g-tdT glial Ca2+reporter mice as shown in Fig. 8. BQ788 enhanced the EFS Ca2+wave response in glia of the intact myenteric plexus (Fig. 8a-e, p<0.01, n=10 ganglia, and 138 cells analyzed). The response to EFS is abolished by TTX (1μM, p<0.01) confirming neuron-to-glial communication (Fig. 8f, n=10 ganglia).
Neuron-to-glial communication involves purinergic signaling.55 We tested if purinergic signaling accounts for the entire EFS response ranging from 0.1Hz – 25Hz EFS. The P2 receptor antagonist PPADS (30μM) significantly reduces the EFS response (Fig. 8g; n=10 ganglia) but does not block it entirely. Preventing the inactivation of endogenous ATP by ARL67156 (100μM) augments EFS responses (Fig. 8h; n=10 ganglia, p<0.01). ATP (100μM) triggers a Ca2+ wave response (Fig. 8i).
(ii). The ETBR antagonist BQ788 enhances ENS activation:
The precise link between glial ETBR activation and enteric neuronal firing (glia-to-neuron communication) is not known. To probe this question, EFS induced Ca2+waves in neurons were studied in Wnt1Cre2;GCaMP5g-tdT Ca2+reporter mice with BQ788. The peak intensity of the Ca2+response in neurons was enhanced by BQ788 (p<0.01, Fig. 9a), whereas the number of responsive neurons per ganglion in the Ca2+wave remained the same (Fig. 9b; n=9 separate experiments, ns).
(iii). BQ788 amplification of excitatory cholinergic transmission and inhibitory nitrergic transmission to CM:
At the CM level, the BQ788 (1μM) amplification of EFS-induced CM contractions is mitigated by the muscarinic antagonist atropine (10μM) used to block excitatory muscarinic cholinergic responses (Fig. 9c). In contrast, BQ788 had no direct influence on muscle contraction caused by carbachol (Fig. 9d, 100μM). EFS responses are abolished by TTX indicating that BQ788 is enhancing excitatory cholinergic neuromuscular transmission. L-NAME treatment reveals that a major component of the BQ788 effect on cholinergic CM contractions is due to modulation of NO-dependent signaling (Suppl. Fig. 6a,b).
6. Muscularis externa inflammation in POI causes amplification in ETBR signaling:
(i). Postoperative ileus model:
Endothelins are implicated in the pathogenesis of a variety of diseases linked to intestinal inflammation.1,3–7,28 To begin to address the role of ET-1/ETBR signaling in the context of inflammation, we tested the hypothesis that ET-1/ETBR signaling in ‘reactive’ glia2,35–38,40,49 is altered after gut inflammation in a well characterized POI mouse model of muscularis externa inflammation induced by gut surgical manipulation (IM) 35–37 (Suppl. Figs. 7 & 8). In the POI model, inflammation (Figs 7&8) and disruption of motility (slower GI transit) are hallmarks of the disease. GFAP immunoreactivity (marker of enteric gliosis) is upregulated and there is immune cell activation (Suppl. Fig. 8a-l). Up regulation in various pro-inflammatory mediators also occurs in ME of the mouse jejunum in POI after gut manipulation (IM versus sham, during acute phase at 3h IM) (Suppl. Fig.8m-v, p<0.01). GI transit is decreased from 10.0±0.8 to 3.0±0.8 (MGC, fluorescence units) (p<0.01, n=5 animals/group).35
iii). Hypersensitivity to SaTX response in enteric glia:
Ca2+imaging in Sox10CreERT2;GCaMP5g-tdT Ca2+reporter mice demonstrated that in the context of inflammation, there is hypersensitivity to the selective ETBR agonist SaTX in enteric glia (Fig. 10a-d, p<0.01). The peak intensity of the Ca2+response (Fig. 10c) and the number of glia/ganglion responding to SaTX in the Ca2+wave (Fig. 10d) were both augmented in POI.
Figure 10. In a POI model of muscularis externa inflammation, ET-1 / ETBR signaling is altered and upregulated after gut surgical trauma and manipulation.

(a-d) Hypersensitivity to the selective ETBR agonist SaTX in enteric glia. (a) A concentration of 3nM SaTX causes a huge enhancement in the glial Ca2+ wave response. (b) Pseudocolor images show the enhanced Ca2+response to SaTX in glia at 3h after intestinal manipulation (IM); tdT+ glia in the Sox10CreERT2;GCaMP5g-tdT Ca2+ reporter mice are used to identify responsive glia. (c-d) Pooled data showing SaTX hypersensitivity in both the number of glia/ganglion responding in the Ca2+wave and the peak intensity of the Ca2+response (*p<0.01); n=20 ganglia analyzed in separate perfusion experiments). (e-f) Intestinal manipulation (IM 24h) caused increase in EGFP reporter fluorescence for the Ednrb-EGFP protein expression in the small intestine of the Tg(Ednrb-EGFP)EP59Gsat/Mmucd reporter mouse; (*p<0.01). (g-h) The expression of ETBR in western blots of the muscularis externa is upregulated at 3h IM and 24h IM compared to sham-controls in wild-type mice. ETBR1 is a lower molecular weight immunogenic band detected by the ETBR antibody that is no longer present with IM. (i) Pooled data for the expression of ETBR and ETBR1 (arbitrary label) showing upregulation of ETBR and absence of ETBR1 after IM. (*p<0.01, n=5 animals/group). (j-o) Effects of BQ788 on high K+ depolarization induced Ca2+waves in Sox10CreERT2;GCaMP5g-tdT Ca2+ reporter mice in sham and IM. (j) IM increases the peak Ca2+ response (ΔF/Fo) induced by high K+ depolarization (*p<0.01) of the first wave (shown in ‘p’). (k, l) BQ788 reduces the response in sham and IM – animals. (m) IM increases the peak Ca2+ response (ΔF/Fo) induced by high K+ (*p<0.01) of the second wave. BQ788 reduces the second wave response to high K+ in IM – animals (*p<0.01) but not sham animals. (p) Example of the Ca2+response to high K+depolarization in a single ganglion in sham versus IM (Inflamed) preparation; IM/Inflammation enhances the peak Ca2+response (average glial Ca2+response in a myenteric ganglion) of the first and second wave (n=10–12 ganglion experiments / group, *p<0.01). (q) Model of the effect of gut surgical manipulation (IM) on ET-1/ETBR signaling in response to high K+ depolarization. In sham-controls, high K+ depolarization triggers 2 different Ca2+ waves separated by time. The Ca waves induced by high K+ depolarization, are augmented by gut surgical manipulation (IM) and inflammation and responses are sensitive to blockade by the ETBR antagonist BQ788, suggesting that there is a greater contribution of ET-1/ETBR signaling to the Ca2+wave produced by high K+ depolarization in the inflamed state. Activity-dependent regulation of ETBR signaling is revealed in POI.
(iv). Upregulation of ETBR:
In POI, there is upregulation of the EGFP reporter visualized in glia of the Tg(Ednrb-EGFP)EP59Gsat/Mmucd mice in duodenum (Fig. 10e) and ileum (Fig. 10f) of the small intestine. This was confirmed by western blots for ETBR protein for 3h and 24h IM (Fig. 10g-i). ETBR1 is absent in IM animals in contrast to sham-controls (Fig. 10g-i). Pooled data for the expression of ETBR (52kDa) and ETBR1 (42kDa) show upregulation of ETBR and absence of ETBR1 after IM (Fig. 10i, p<0.01, n=5 animals/group). Data indicate that ET-1/ETBR signaling is upregulated in POI.
(v). Amplification in ETBR signaling is revealed with high K+ depolarization in the POI model:
To test whether ET-1/ETBR signaling is altered in POI, we determined the effects of BQ788 on high K+ depolarization induced Ca2+waves in Sox10CreERT2;GCaMP5g-tdT Ca2+mice in POI (Fig. 10j-o). There is amplification of the first and second Ca2+waves triggered by High K+ (i.e. increase in ΔF/Fo) in POI (Fig. 10j-o). For the first wave, BQ788 reduces the responses in sham and IM animals (Fig. 10k, l). BQ788 reduces the second wave response to high K+ in IM, but not sham animals (Fig. 10 n, o). Overall, there is amplification in the high K+ depolarization induced Ca2+ responses and these are sensitive to BQ788, implying that ET-1 signaling is augmented in POI. The proposed mechanism of amplification of ETBR signaling by inflammation is illustrated in Fig. 10 q.
(vi). Upregulation of ETBR in POI is restricted to glia in muscularis externa.
The EGFP reporter is upregulated in Tg(Ednrb-EGFP)EP59Gsat/Mmucd mice in POI (Suppl. Fig.9a-d). There is also upregulation of the protein recognized by both anti-EGFP (Suppl. Fig 9e-g) and anti-Ednrb (ETBR) antibody (Suppl. Fig. 9h-j). 3-D imaging through the entire thickness of an LMMP-CM preparation confirmed that in the inflamed state the EGFP reporter is expressed (upregulated) in glia (Suppl. Fig. 9k-n). There is no co-localization of EGFP reporter with HuC/D-immunoreactivity in neurons (Image J, Suppl. Fig. 9o-p). EGFP reporter is highly co-localized with GFAP-immunoreactivity (Suppl. Fig. 9q-r). Overall, glial Ednrb (ETBR) expression is upregulated in POI.
7. In vivo BQ788 administration inhibits inflammation in mouse POI
In vivo i.p. administration of 1mg/Kg BQ788 daily for 7 days significantly inhibited leukocyte infiltration in the ME of the jejunum in the mouse POI model (Suppl. Fig. 7d-f; n=5 mice each; p<0.01 between IM and IM + BQ788).
4.0. Discussion:
Endothelins interact with G-protein coupled ETAR and ETBR to exert a variety of effects in normal and disease states, and are implicated in IBD, necrotizing enterocolitis, IBD, acute pancreatitis, neurological diseases and sepsis.1,3–5,7,27,57 ETBR signaling is critical in the development of the ENS and loss of ETBR is linked to aganglionosis and HD.12,13 Little was known about ETBR signaling and its role in intestinal motility in adult mammals in normal or inflamed gut. The current study targeted the ETBR in the ENS or ‘little brain in the gut’, that is essential for life and intestinal motility. Novel findings support the concept that glial ETBR signaling is an important pathway in gut glial-neural motor pathways of motility and gut inflammation.
Earlier pharmacological studies on endothelin in guinea pig or rat suggested that ET-1 was involved in modulating motility, although the cellular distribution and function of ETBR in neurons, glia or muscle were unclear.9,11,19,20,58,59. Tg-Ednrb-EGFP reporter mice 46 for Ednrb (ETBR) were instrumental in the identification of ETBR in the gut since antisera were not suitable for labeling ETBR in gut tissues. EGFP is a quantitative reporter of gene expression or activity46 in cells.60–62 Enhanced Green fluorescent protein (EGFP) is visible with FITC in cells expressing ETBR. Expression of Ednrb (ETBR) in Tg(Ednrb-EGFP)EP59Gsat/Mmucd]46 was shown in astrocytes and it matches in situ data from the GENSAT Project46. For ME, EGFP reporter imaging (or EGFP-immunoreactivity) in Tg-mice confirmed that EGFP is only expressed in glia. Our data from RiboTag-Sox10-EGC mice55confirmed that ETBR is the predominant endothelin-receptor in enteric glia. In Tg-mice, an anti-EGFP or an anti-Ednrb (ETBR) antibody recognizes the same larger (~90kDa) protein compared to the ETBR protein at 52kDa in WT-mice, implying that the larger protein is associated with both Ednrb and EGFP.
This discovery facilitated study of glial ET-1/ETBR signaling in the regulation of motility. ETBR is highly expressed in glia relative to the glial markers GFAP, s100β and PLP, and may represent a novel biomarker for enteric glia in adult mouse ENS. In other peripheral ganglia, there is variable expression of ETBR in glia6,21,63 and neurons20. Potential species or regional differences in ETBR expression and function in the gut11,19,20,59 deserve further investigation. Activation of ETBR has also been shown to trigger Ca2+waves in human enteric glia.35,38,49
ET-1 is the predominant endothelin activating ETBR. In our study, ET-1 was shown to be specifically expressed in the mouse ENS, although it remains unknown whether ET-1 is expressed in both intrinsic and extrinsic nerve fibers.3,64 There is co-labeling for ET-1 and SP+ or peripherin+ varicose nerve fibers in myenteric ganglia, neurons in RiboTag(ChAT)-neurons and isolated human networks of purified myenteric ganglia. This establishes the ENS as the primary source of endogenous ET-1 for glial ETBR activation. The direct physiologic release of ET-1 remains to be proven. ET1-immunoreactivity was reported for human colon ENS.10
ET-1 immunoreactive nerve fibers are in close proximity to enteric glia, suggesting that if ET-1 is released, it could activate glial ETBR. To test this hypothesis, we utilized high K+ depolarization of neurons to induce glial activation. Neuron-to-glial transmission, triggered by high K+ depolarization is blocked by the selective ETBR antagonist BQ788, indicating that endogenous ET-1 release activates glial ETBR to trigger a Ca2+wave. Exogenous ET-1 or the selective ETBR agonist SaTX triggers a robust Ca2+wave by direct activation of glial ETBR since the effect is blocked by BQ788, but not TTX. Potassium depolarization studies in glial-specific Ca2+reporter mice suggest that neuronal release of ET-1 activates glial ET-1/ETBR signaling to trigger glial Ca2+waves.
Findings support the concept that neural ET-1 triggers activity-dependent regulation of glial Ca2+waves since high K+ depolarization or electrical stimulation elicit different and opposing effects on ETBR signaling on glial Ca2+waves. In contrast to high K+ depolarization, the glial Ca2+response evoked by electrical stimulation is amplified by BQ788, suggesting that endogenous ET-1 provides inhibitory modulation of the response.
Mechanistically, high K+ depolarization and EFS act differently. High K+ depolarization provides a slow sustained depolarization of neurons to increase intracellular Ca2+levels leading to transmitter release to activate glia. Electrical stimulation exerts a phasic pattern of activation that is intermittent and frequency dependent, oscillating between activation and no activity. Potassium depolarization produces a non-physiologic membrane depolarization and tonic elevation of intracellular calcium, a condition that does not mimic cellular responses to physiologic patterns of phasic neuronal activity. Electrical stimulation is used to produce physiologic patterns of phasic neuronal activity.65Activity-dependent regulation of ionic conductance(s), gene expression and other neuronal functions occurs in response to these different patterns of stimulation.66–67 These two modes of stimulation may reveal activity dependent regulation of glial ET-1/ETBR signaling in mouse ENS. Information in the nervous system is coded in the temporal pattern of neural impulse firing. Depolarizing neurons with potassium chloride fails to produce the natural mode of information processing in neurons.66–67 Activity-dependent regulation may also operate in disease states as discussed later for POI.
Our working hypothesis of the physiologic role of glial ETBR signaling on intestinal motility is illustrated in Fig. 9e. BQ788 revealed an increase in phasic activity in CM, augmentation of CM contractions, and enhanced peristalsis. These effects suggest inhibitory modulation by endogenous ET-1 at ETBR. Exogenous effects of SaTX (or ET-1) further corroborated our findings showing that ET-1/ETBR activation causes transient relaxation of CM, inhibitory modulation of CM off-contractions to electrical nerve stimulation, and inhibition of peristalsis. Transient relaxation is likely to start with SaTX activation of ETBR in glia. Our experiments were designed to test actions through ETBR. Gliotoxins could prevent the effects of BQ788 on neuromuscular contractions and disrupt SaTX responses in glia. The glial ET-1/ETBR pathway is involved in inhibitory modulation of excitatory cholinergic (and perhaps non-cholinergic22,72) neural motor circuits of intestinal motility.
At the ENS level, BQ788 alone caused amplification in glial and neuronal activation in response to EFS, although the precise mechanisms or pathways remain unknown.73 Studies using Wnt-1 Ca2+reporter mice indicate that BQ788 facilitates neural activity induced by electrical stimulation. BQ788 caused a robust increase in the peak intensity of the Ca2+wave response in neurons but had little effect on number of neurons/ganglion responding in the ganglia of the intact neural circuits of the ENS. Data is consistent with the concept of inhibitory modulation of an excitatory cholinergic neural motor circuit of motility. Circuit-specific enteric glia regulates intestinal motor neurocircuits.29 Glial ET-1/ETBR signaling could be linked to circuit specific excitatory motor pathways. Overall, the effect of BQ788 suggests that ETBR are normally active and provide some inhibitory tone. In brain, astrocyte ETBR activation was shown to either increase or decrease supraoptic nucleus firing activity via excitatory or inhibitory neurotransmitter pathways.74
Modulation of inhibitory nitrergic signaling pathways is another mechanism operating in the BQ788 amplification effect of cholinergic CM contractions:
L-NAME disruption of inhibitory nitrergic signaling reveals that a major component of the BQ788 effect on cholinergic CM contractions is due to modulation of NO-dependent signaling. There is also an L-NAME-insensitive component of the BQ788 effect (see Suppl. Fig. 6). Our working model of glial ET-1/ETBR signaling in glia, ENS and motility is illustrated in Fig. 9e. Enteric glial ET-1/ETBR signaling provides dual modulation of neural-motor circuits to inhibit motility. Endogenous ET-1 release from varicose nerve fibers activates glial ETBR to inhibit Ca2+waves56. Overall, ET-1 provides dual modulation of two distinct neural-motor circuits, resulting in glial inhibitory modulation of excitatory glial neural-motor pathways (cholinergic pathway) or activation of an inhibitory glial neural-motor pathway (nitrergic pathway).
To evaluate ETBR signaling in ‘reactive’ glia32, 24,34–38, we used a mouse model of POI linked to ME inflammation and disruption of motility35–37,55. We found there is hypersensitivity to glial ETBR signaling and glial Ca2+waves. Up regulation of ETBR in glia likely contributes to the hypersensitivity and persists during 24h IM that is associated with dysmotility and POI. We provide evidence from the POI model that the larger protein that is recognized by both anti-EGFP and anti-Ednrb antibodies is highly upregulated in Tg(Ednrb-EGFP)EP59gsat/Mmucd mice. There is also amplification of the ET-1/ETBR signaling in POI. In vivo pharmacological blockade of ETBR with BQ788 reduces inflammation in POI, indicating that the ET-1/ETBR signaling pathway is a potential pathogenic mechanism of dysmotility and POI. Enteric glia serve an essential role in intestinal function25,26,75, motility and diseases.24,25,28,34–38,42,75,76 Disruption of glial functions leads to abnormal intestinal motility.58,76 Alterations in glial ET-1/ ETBR signaling is a property of ‘reactive’ glia in the inflamed gut of POI as demonstrated in our study.
It remains unclear what the two different molecular forms of the protein are that are recognized by the anti- ETBR antibody. It recognizes bands at 52kDa and at 42kDa. Different size proteins are expressed in different species68,69 and different cells70,71. In mouse POI, it is interesting that only a single protein for ETBR is expressed in ME at 52kDa. The 52kDa protein is upregulated in POI, and it is tempting to speculate that inflammation in the disease state, may prevent the ETBR protein from further modifications to produce the truncated version of the ETBR1 (42kDa protein) recognized by the antibody66,67. In diseases, perhaps post-translational modification66,67 is inhibited and a single ETBR protein at 52KDa is expressed, but the molecular mechanisms remain speculative.
Summary and Conclusions:
In ME, ETBR is expressed only in glia and is sensitive to gut inflammation. It may represent a marker for glia and ‘reactive’ myenteric glia associated with upregulation of ETBR in the adult mouse POI model. Activity-dependent regulation of glial ETBR signaling may occur in the mouse intestine. BQ788 revealed a novel pathway of glial ET1/ETBR inhibitory modulation of excitatory cholinergic neural–motor pathways and activation of inhibitory nitrergic neural-motor pathways to inhibit intestinal motility. There is amplification of glial ETBR signaling in POI. In vivo BQ788 attenuates intestinal inflammation. Enteric glial ETBR signaling is a potential novel pharmacological target for intestinal motility disorders that can be probed further using inducible GFAP-CreER-ETBR-cKO mice44, rat mutants77 or Piebald lethal mutant mice of ETBR that survive to adulthood78.
Supplementary Material
(a) The EGFP reporter is expressed in s100β+ glia. (b) EGFP is not expressed in HuC/D+ neurons.
(a) L-NAME (100μM) enhances the EFS – induced neuromuscular contraction of the circular muscle by inhibiting nitric oxide production. (b) In the presence of L-NAME, BQ788 still enhances the EFS response; data analyzed by 2-way RM ANOVA (and mixed effects model treatment); Sidak’s post hoc multiple comparisons were used to test differences at specific frequencies between interventions; n=6 separate experiments; *p<0.01; **p<0.001, ***p<0.0001. BQ788 or L-NAME were pre-incubated for 30 min for the EFS study.
x(a-b) BQ788 (3μM) treatment does not influence resting tension. (c) example in one animal to show that treatment with BQ788 (3μM) does not influence CM responsiveness. (d) example in a separate animal showing that BQ788 (3μM) can lead to an increase in phasic activity. (e) same response as in ‘d’ with an expanded time scale for the period of activity identified by dotted lines. Responses were recorded for 30 min throughout the BQ788 incubation incubation to test effects on resting tension and phasic activity.
(a) the photograph shows gut manipulation of the small bowel in the anesthetized mouse. (b-c) Expression of myeloperoxidase (MPO+) and MHC II+ leukocytes and tissue macrophages are increased after IM 24 h (*p<0.01). (d-f) In vivo administration (i.p.) of 1mg/Kg BQ788 for 7 consecutive days reduces leukocyte infiltration (*p<0.01).
(a-d) SaTX (200nM) induces transient relaxation of CM. (e-f) The SaTX evoked response is blocked by BQ788 (3μM) or TTX (1 μM) that inhibit nerve conduction. (g-h,l) ET-1 (100nM) causes contraction of CM. (j) BQ788 alone has no effect on CM contractions. (i,k) TTX or BQ788 do not block excitatory responses to ET-1. Red arrow indicates where chemical was added. EFS responses were recorded before and after drug treatment. TTX was incubated for 10 min and BQ788 was incubated for 30 min to test effects on EFS stimulation.
(a,b) SaTX triggers a concentration-dependent Ca2+response. (c) The selective ETBR antagonist BQ788 (1μM) blocks the Ca2+wave triggered by 50nM SaTX. BQ788 alone has no effect on baseline Ca2+ responses. In the presence of BQ788 after a 30 min pre-incubation, SaTX does not trigger a Ca2+ response. Washout of BQ788 by switching to Kreb’s buffer perfusion for 20 min, and re-exposure to SaTX triggers a Ca2+ response; the response represents the averaged Ca2+response in glia in the recorded ganglion. (d) Ca2+ wave response for ‘c’ showing the individual glial Ca2+transients used to generate the averaged Ca2+ response. (e) Pooled data for peak Ca2+ responses (ΔF/Fo) and %glial responding in the Ca2+wave for SaTX in the presence or absence of BQ788. (f) The kinetic response to SaTX is much faster in a smaller 0.4ml perfusion chamber compared to a much larger perfusion chamber (4 ml chamber) used in ‘c’. (g) 50nM SaTX triggers a slow developing Ca2+wave in a culture network of human enteric glia (hEGC). (h) Quantitative analysis of the SaTX response in hEGCs. (i) 50nM SaTX also triggers a glial Ca2+wave in intact isolated networks of human myenteric ganglia; a similar response was observed in 4 other network experiments. (j) transmitted light photomicrograph of an isolated network of myenteric ganglia loaded with fluo-4/AM for Ca2+imaging; n=5 mice, one way ANOVA, p<0.01 in ‘a’ and ‘b’; in ‘f’ n=10 hEGC cultures.
(a-d) The EGFP reporter is upregulated in the Tg-mice with gut surgical manipulation (IM 24h); (d) Quantitative analysis of the EGFP reporter expression for WT (control), sham 24h and IM 24h. There is an increase in EGFP fluorescence intensity with IM compared to sham animals; 3-D imaging of 23μm optical slices (0.5μm z-steps) were used for quantitative analysis. (e-j) Western blot analysis shows upregulation of the protein recognized by both anti-EGFP and anti-Ednrb (ETBR) antibody. (k-n) 3-D imaging and reconstructions of the LMMP-CM preparation (i.e. 41μm thick z-stack) from CM to LM demonstrates that the EGFP reporter is also restricted to glial cells in the inflamed state of POI (IM 24h). (o-p) Co-localization analysis using image-J shows lack of expression of the EGFP in HuC/D+ neurons. (q-r) In contrast, EGFP is >90% co-localized with GFAP+ glia (***p<0.0001; ns, not significant; n=6 (or more) samples/group.
(a-c) Laser confocal z-stack images (12μm optical slice, 0.5μm intervals) of GFAP immunoreactivity in myenteric ganglia of the mouse jejunum for control, sham and IM wild-type mice. There is visible increase in GFAP immunoreactivity with IM. (d) The glial GFAP protein (marker of gliosis) is upregulated by IM 24h (p<0.0001). (e-g) Z-stack images of MPO immunoreactivity (inflammation / leukocyte marker) in control, sham and IM Tg(Ednrb-EGFP)EP59Gsat/Mmucd reporter mice. IM increases MPO cells surrounding the ganglia. (h) IM increases MPO levels in the muscularis externa (*p<0.0001). (i-l) CD68 immunoreactivity (immune cell activation marker) is increased by sham (**p<0.001) and IM (***p<0.0001) in Tg(Ednrb-EGFP)EP59Gsat/Mmucd ETBR reporter mice (n=8 samples/group). Thickness of z-stacks for is 20μm; images s at 0.5μm z-steps. (m-v) Up regulation of mRNA expression of pro-inflammatory mediators in muscularis externa of the mouse jejunum in POI after gut manipulation (IM versus sham, during acute phase at 3h IM). Increase in expression occurred in chemokines, cytokines and Fos (unpaired t-test, *p<0.01, n=7 animals/group).
ET-1-ir is abundant in varicose fibers of the myenteric plexus in and outside the ganglia. (a) As shown in overlay images, varicose fibers are in close contacts with tdT+ glia in myenteric ganglia (i.e. refer to yellow staining over the tdT+ glia). (b) ET-1-ir was not shown to be expressed in HuC/D+ neurons analyzed. (c, d) Examples of ET-1 co-labeling with a subset of Substance P+(SP) varicose fibers in myenteric ganglia; arrow indicates co-localization. (e, f) Examples of ET-1 co-labeling with peripherin in varicose nerve fibers (i.e. yellow fibers show co-localization of ET-1 and peripherin). (g-i) 3-D laser confocal imaging and visualization of ET-1-ir through the circular muscle (CM) layer (g), myenteric plexus ganglia network layer (MP, h) and longitudinal muscle (LM, ‘i’, 12–15μm z-stacks constructed at 0.5μm z-steps) layers of the same LMMP-CM preparation. SMA-ir was used to visualize smooth muscle layers. As shown, ET-1-ir is not expressed in CM or LM, but is abundant in MP in varicose fibers in the ganglia, and some varicose fibers in the CM. ET-1 is restricted to the varicose nerve fibers primarily in myenteric ganglia of the muscularis externa. (j) Edn1 (ET-1) was confirmed in ribosomal mRNA of RiboTag ChAT-Neurons (n=8 animals/group) and (k) isolated neural networks of myenteric ganglia devoid of smooth muscle (prepared from human surgical specimens)50 (l) Normalized ET-1 expression in neural networks of ganglia (n=8 human neural network preparations). Thickness of confocal z-stacks is 20μm; images s at 0.5μm intervals. DAPI is used to counterstain cell nuclei.
Summary:
What is already known:
Endothelin may interact with ETAR and ETBR to modulate motility, but the role of ETBR is unclear
Endothelin signaling is implicated in tissue inflammation, neurological diseases, pulmonary hypertension, sepsis, pancreatitis, IBD, and necrotizing enterocolitis
What this study adds:
Enteric glial ET-1/ETBR signaling provides modulation of two distinct enteric neural-motor pathways to inhibit motility
Glial ETBR signaling is linked to intestinal inflammation in a postoperative ileus model
Clinical Significance:
Enteric glial ETBR is a potential novel pharmacological target for intestinal motility disorders
Amplification of glial ETBR is linked to muscularis externa inflammation and pathogenic mechanisms of postoperative ileus
Acknowledgements:
We would like to acknowledge the efforts of two student trainees: Nick Paeglis was an undergraduate student volunteer at The Ohio State University in the Neuroscience Program. Kyle Hopkins was a summer medical student volunteer from Ohio Wesleyan University. They trained in immunofluorescent co-labeling techniques using the Tg(Ednrb-EGFP)EP59Gsat/Mmucd mice. We are grateful to the department of Anesthesiology for providing additional resources, MOU support for Biostatistics and a supporting environment to facilitate the NIH funded studies. Thank you to Dr. Kent Williams for providing some ETBR reporter mice. Our appreciation goes out to the entire clinical research team in Anesthesiology for supporting our human patient IRB(s) studies.
This Declaration acknowledges that this paper adheres to the principles for transparent reporting and scientific rigour of preclinical research as stated in the BJP guidelines for Design and Analysis, Immunoblotting and Immunochemistry, and Animal Experimentation, and as recommended by funding agencies, publishers and other organisations engaged with supporting research.
Funding Statement:
FLC is the recipient of grants R01DK113943 and R01DK125809 from the National Institutes of Diabetes, Digestive and Kidney Diseases (NIDDK) on glial ETBR signaling and glial modulation of postoperative ileus. BDG is the recipient of R01DK120862 and R01DK103723. JRG is the recipient of grants R01DK34153 and R01DK113943. KS Murthy is the recipient of grants R01DK15564 and R01DK28300.
Abbreviations:
- CM
circular muscle
- ATP
adenosine-5’-triphospate
- SaTX
Sarafotoxin S6c
- ET-1
endothelin-1
- ET-2
endothelin-2
- ET-3
endothelin-3
- SP
substance P
- ACh
Acetylcholine
- CgA
chromogranin A
- CM
circular muscle
- EFS
electrical field stimulation
- ENS
enteric nervous system
- PCR
polymerase chain reaction
- WB
western blot
- ETAR
Endothelin-A receptor
- ETBR
Endothelin-B receptor
- KO
knock-out
- ME
muscularis externa
- FA
sodium fluoroacetate
- FC
fluorocitrate
- hEGC
human enteric glial cells
- FBS
fetal bovine serum
- IM
intestinal manipulation
- MGC
mean geometric center
- MPO
myeloperoxidase
- NO
nitric oxide
- POI
post-operative ileus
- LMMP-CM
longitudinal muscle-myenteric plexus-circular muscle
- TTX
tetrodotoxin
Footnotes
COI statement: The authors have no conflicts of interest to declare. This paper adheres to the BJP guidelines for Design and Analysis for transparent reporting and scientific rigor of preclinical research.
We have followed the recommendations set out in the BJP editorials where they are relevant.
Ethics Approval Statement: Studies were approved under IACUC animal protocols 2020A00000041. Human tissue studies were approved under human IRB protocol 2020H0273 for enteric glial ETBR signaling in postoperative ileus.
Permission to Reproduce Materials from other Sources: N/A
Data Availability Statement:
The data included in this study will be made available from the corresponding author upon reasonable request. Some data from human subjects may be protected under the privacy/HIPPA regulations.
6. References
- 1.Angeli F, Verdecchia P, Reboldi G. (2021). Aprocitentan, A Dual Endothelin Receptor Antagonist Under Development for the Treatment of Resistant Hypertension. Cardiol Ther, 10(2):397–406. doi: 10.1007/s40119-021-00233-7. [DOI] [PMC free article] [PubMed] [Google Scholar]
- 2.Bhave S, Gade A, Kang M, Hauser KF, Dewey WL, Akbarali HI (2017). Connexin-purinergic signaling in enteric glia mediates the prolonged effect of morphine on constipation. FASEB J, 31(6):2649–2660. doi: 10.1096/fj.201601068R. [DOI] [PMC free article] [PubMed] [Google Scholar]
- 3.D’Orléans-Juste P, Akide Ndunge OB, Desbiens L, Tanowitz HB, Desruisseaux MS (2019). Endothelins in inflammatory neurological diseases. Pharmacol Ther, 194:145–160. doi: 10.1016/j.pharmthera.2018.10.001. [DOI] [PMC free article] [PubMed] [Google Scholar]
- 4.Groesdonk HV, Raffel M, Speer T, Bomberg H, Schmied W, Klingele M, Schäfers HJ (2015). Elevated endothelin-1 level is a risk factor for nonocclusive mesenteric ischemia. J Thorac Cardiovasc Surg,149(5):1436–1442.e2. doi: 10.1016/j.jtcvs.2014.12.019. [DOI] [PubMed] [Google Scholar]
- 5.Hostenbach S, D’haeseleer M, Kooijman R, De Keyser J. (2016). The pathophysiological role of astrocytic endothelin-1. Prog Neurobiol, 144:88–102. doi: 10.1016/j.pneurobio.2016.04.009. [DOI] [PubMed] [Google Scholar]
- 6.Pomonis JD, Rogers SD, Peters CM, Ghilardi JR, Mantyh PW (2001). Expression and localization of endothelin receptors: implications for the involvement of peripheral glia in nociception. J Neurosci, 21(3):999–1006. doi: 10.1523/JNEUROSCI.21-03-00999.2001. [DOI] [PMC free article] [PubMed] [Google Scholar]
- 7.Unlüer EE, Alican I, Yeğen C, Yeğen BC (2000). The delays in intestinal motility and neutrophil infiltration following burn injury in rats involve endogenous endothelins. Burns, 26(4):335–340. doi: 10.1016/s0305-4179(99)00135-7. [DOI] [PubMed] [Google Scholar]
- 8.Wei A, Gu Z, Li J, Liu X, Wu X, Han Y, Pu J. (2016). Clinical Adverse Effects of Endothelin Receptor Antagonists: Insights from the Meta-Analysis of 4894 Patients From 24 Randomized Double-Blind Placebo-Controlled Clinical Trials. J Am Heart Assoc, 5(11):e003896. doi: 10.1161/JAHA.116.003896. [DOI] [PMC free article] [PubMed] [Google Scholar]
- 9.Egidy G, Juillerat-Jeanneret L, Korth P, Bosman FT, Pinet F. (2000). The endothelin system in normal human colon. Am J Physiol Gastrointest Liver Physiol, 279(1):G211–222. doi: 10.1152/ajpgi.2000.279.1.G211. [DOI] [PubMed] [Google Scholar]
- 10.Inagaki H, Bishop AE, Escrig C, Wharton J, Allen-Mersh TG, Polak JM (1991). Localization of endothelin-like immunoreactivity and endothelin binding sites in human colon. Gastroenterology, 101(1):47–54. doi: 10.1016/0016-5085(91)90458-w. [DOI] [PubMed] [Google Scholar]
- 11.Shahbazian A, Holzer P. (2000). Regulation of guinea pig intestinal peristalsis by endogenous endothelin acting at ET(B) receptors. Gastroenterology, 119(1):80–88. doi: 10.1053/gast.2000.8549. [DOI] [PubMed] [Google Scholar]
- 12.Gariepy CE, Williams SC, Richardson JA, Hammer RE,Yanagisawa MY (1998). Transgenic expression of the endothelin-B receptor prevents congenital intestinal aganglionosis in a rat model of Hirschsprung disease. J Clin Invest,102(6):1092–1101. doi: 10.1172/JCI3702. [DOI] [PMC free article] [PubMed] [Google Scholar]
- 13.Hosoda K, Hammer RE, Richardson JA, Baynash AG, Cheung JC, Giaid A, Yanagisawa M. (1994). Targeted and natural (piebald-lethal) mutations of endothelin-B receptor gene produce megacolon associated with spotted coat color in mice. Cell, 79(7):1267–1276. doi: 10.1016/0092-8674(94)90017-5. [DOI] [PubMed] [Google Scholar]
- 14.Milla PJ (1999). Endothelins, pseudo-obstruction and Hirschsprung’s disease. Gut, 44(2):148–149. doi: 10.1136/gut.44.2.148. [DOI] [PMC free article] [PubMed] [Google Scholar]
- 15.Edery P, Attié T, Amiel J, Pelet A, Eng C, Hofstra RM, Martelli H, Bidaud C, Munnich A, Lyonnet S. (1996). Mutation of the endothelin-3 gene in the Waardenburg-Hirschsprung disease (Shah-Waardenburg syndrome). Nat Genet, 12(4):442–444. doi: 10.1038/ng0496-442. [DOI] [PubMed] [Google Scholar]
- 16.Hofstra RM, Osinga J, Tan-Sindhunata G, Wu Y, Kamsteeg EJ, Stulp RP, van Ravenswaaij-Arts C, Majoor-Krakauer D, Angrist M, Chakravarti A, Meijers C, Buys CH (1996). A homozygous mutation in the endothelin-3 gene associated with a combined Waardenburg type 2 and Hirschsprung phenotype (Shah-Waardenburg syndrome). Nat Genet, 12(4):445–457. doi: 10.1038/ng0496-445. [DOI] [PubMed] [Google Scholar]
- 17.Kusafuka T, Wang Y, Puri P. (1996). Novel mutations of the endothelin-B receptor gene in isolated patients with Hirschsprung’s disease. Hum Mol Genet. 5(3):347–349. doi: 10.1093/hmg/5.3.347. [DOI] [PubMed] [Google Scholar]
- 18.Puffenberger EG, Hosoda K, Washington SS, Nakao K, deWit D, Yanagisawa M, Chakravart A. (1994). A missense mutation of the endothelin-B receptor gene in multigenic Hirschsprung’s disease. Cell, 30;79(7):1257–1266. doi: 10.1016/0092-8674(94)90016-7 [DOI] [PubMed] [Google Scholar]
- 19.Lin WW, Lee CY (1992). Intestinal relaxation by endothelin isopeptides: involvement of Ca(2+)-activated K+ channels. Eur J Pharmacol, 219(3):355–360. doi: 10.1016/0014-2999(92)90475-j. [DOI] [PubMed] [Google Scholar]
- 20.Yoshimura M, Yamashita Y, Kan S, Niwa M, Taniyama K. (1996). Localization of endothelin ETB receptors on the myenteric plexus of guinea-pig ileum and the receptor-mediated release of acetylcholine. Br J Pharmacol, 118(5):1171–1176. doi: 10.1111/j.1476-5381.1996.tb15520.x. [DOI] [PMC free article] [PubMed] [Google Scholar]
- 21.Peters CM, Rogers SD, Pomonis JD, Egnaczyk GF, Keyser CP, Schmidt JA, Ghilardi JR, Maggio JE, Mantyh PW. (2003). Endothelin receptor expression in the normal and injured spinal cord: potential involvement in injury-induced ischemia and gliosis. Exp Neurol, 180(1):1–13. doi: 10.1016/s0014-4886(02)00023-7. [DOI] [PubMed] [Google Scholar]
- 22.Mule NK, Singh JN, Shah KU, Gulati A, Sharma SS (2018). Endothelin-1 Decreases Excitability of the Dorsal Root Ganglion Neurons via ET B Receptor. Mol Neurobiol, 55(5):4297–4310. doi: 10.1007/s12035-017-0640-1. [DOI] [PubMed] [Google Scholar]
- 23.Yamamoto T, Ono K, Hitomi S, Harano N, Sago T, Yoshida M, Nunomaki M, Shiiba S, Watanabe S, Nakanishi O, Inenaga K. (2013). Endothelin receptor-mediated responses in trigeminal ganglion neurons. J Dent Res, 92(4):335–339. doi: 10.1177/0022034513478428. [DOI] [PubMed] [Google Scholar]
- 24.Gulbransen BD, Christofi FL (2018). Are We Close to Targeting Enteric Glia in Gastrointestinal Diseases and Motility Disorders? Gastroenterology,155(2):245–251. doi: 10.1053/j.gastro.2018.06.050. [DOI] [PMC free article] [PubMed] [Google Scholar]
- 25.Grubišić V, Gulbransen BD (2017). Enteric glial activity regulates secretomotor function in the mouse colon but does not acutely affect gut permeability. J Physiol, 595(11):3409–3424. doi: 10.1113/JP273492. [DOI] [PMC free article] [PubMed] [Google Scholar]
- 26.MacEachern SJ, Patel BA, Keenan CM, Dicay M, Chapman K, McCafferty DM, Savidge TC, Beck PL, MacNaughton WK, Sharkey KA (2015). Inhibiting Inducible Nitric Oxide Synthase in Enteric Glia Restores Electrogenic Ion Transport in Mice With Colitis. Gastroenterology, 149(2):445–455.e3. doi: 10.1053/j.gastro.2015.04.007. [DOI] [PMC free article] [PubMed] [Google Scholar]
- 27.Murch SH, Braegger CP, Sessa WC, MacDonald TT (1992). High endothelin-1 immunoreactivity in Crohn’s disease and ulcerative colitis. Lancet, 339(8790):381–385. doi: 10.1016/0140-6736(92)90077-g. [DOI] [PubMed] [Google Scholar]
- 28.McClain J, Grubišić V, Fried D, Gomez-Suarez RA, Leinninger GM, Sévigny J, Parpura V, Gulbransen BD (2014). Ca2+ responses in enteric glia are mediated by connexin-43 hemichannels and modulate colonic transit in mice. Gastroenterology, 146(2):497–507.e1. doi: 10.1053/j.gastro.2013.10.061. [DOI] [PMC free article] [PubMed] [Google Scholar]
- 29.Ahmadzai MM, Seguella L, Gulbransen BD (2021). Circuit-specific enteric glia regulate intestinal motor neurocircuits. Proc Natl Acad Sci U S A, 118(40):e2025938118. doi: 10.1073/pnas.2025938118. [DOI] [PMC free article] [PubMed] [Google Scholar]
- 30.Delvalle NM, Fried DE, Rivera-Lopez G, Gaudette L, Gulbransen BD (2018). Cholinergic activation of enteric glia is a physiological mechanism that contributes to the regulation of gastrointestinal motility. Am J Physiol Gastrointest Liver Physiol. 315(4):G473–G483. doi: 10.1152/ajpgi.00155.2018. [DOI] [PMC free article] [PubMed] [Google Scholar]
- 31.McClain JL, Fried DE, Gulbransen BD (2015). Agonist-evoked Ca2+ signaling in enteric glia drives neural programs that regulate intestinal motility in mice. Cell Mol Gastroenterol Hepatol. 1(6):631–645. doi: 10.1016/j.jcmgh.2015.08.004. [DOI] [PMC free article] [PubMed] [Google Scholar]
- 32.Seguella L, Gulbransen BD (2021). Enteric glial biology, intercellular signalling and roles in gastrointestinal disease. Nat Rev Gastroenterol Hepatol.18(8):571–587. doi: 10.1038/s41575-021-00423-7. [DOI] [PMC free article] [PubMed] [Google Scholar]
- 33.Mazzotta E, Villalobos-Hernandez EC, Fiorda-Diaz J, Harzman A, Christofi FL (2020). Postoperative Ileus and Postoperative Gastrointestinal Tract Dysfunction: Pathogenic Mechanisms and Novel Treatment Strategies Beyond Colorectal Enhanced Recovery After Surgery Protocols. Front Pharmacol, 11:583422. doi: 10.3389/fphar.2020.583422. [DOI] [PMC free article] [PubMed] [Google Scholar]
- 34.Ochoa-Cortes F, Turco F, Linan-Rico A, Soghomonyan S, Whitaker E, Wehner S, Cuomo R, Christofi FL (2016). Enteric Glial Cells: A New Frontier in Neurogastroenterology and Clinical Target for Inflammatory Bowel Diseases. Inflamm Bowel Dis, 22(2):433–449. doi: 10.1097/MIB.0000000000000667. [DOI] [PMC free article] [PubMed] [Google Scholar]
- 35.Schneider R, Leven P, Glowka T, Kuzmanov I, Lysson M, Schneiker B, Miesen A, Baqi Y, Spanier C, Grants I, Mazzotta E, Villalobos-Hernandez E, Kalff JC, Müller CE, Christofi FL, Wehner S. (2021). A novel P2X2-dependent purinergic mechanism of enteric gliosis in intestinal inflammation. EMBO Mol Med, 13(1):e12724. doi: 10.15252/emmm.202012724. [DOI] [PMC free article] [PubMed] [Google Scholar]
- 36.Schneider R, Leven P, Mallesh S, Breßer M, Schneider L, Mazzotta E, Fadda P, Glowka T, Vilz TO, Lingohr P, Kalff JC, Christofi FL, Wehner S. (2022). IL-1-dependent enteric gliosis guides intestinal inflammation and dysmotility and modulates macrophage function. Commun Biol, 5(1):811. doi: 10.1038/s42003-022-03772-4. [DOI] [PMC free article] [PubMed] [Google Scholar]
- 37.Stoffels B, Hupa KJ, Snoek SA, van Bree S, Stein K, Schwandt T, Vilz TO, Lysson M, Veer CV, Kummer MP, Hornung V, Kalff JC, de Jonge WJ, Wehner S. (2014). Postoperative ileus involves interleukin-1 receptor signaling in enteric glia. Gastroenterology, 146(1):176–187.e1. doi: 10.1053/j.gastro.2013.09.030. [DOI] [PubMed] [Google Scholar]
- 38.Liñán-Rico A, Turco F, Ochoa-Cortes F, Harzman A, Needleman BJ, Arsenescu R, Abdel-Rasoul M, Fadda P, Grants I, Whitaker E, Cuomo R, Christofi FL (2016). Molecular Signaling and Dysfunction of the Human Reactive Enteric Glial Cell Phenotype: Implications for GI Infection, IBD, POI, Neurological, Motility, and GI Disorders. Inflamm Bowel Dis, 22(8):1812–1934. doi: 10.1097/MIB.0000000000000854. [DOI] [PMC free article] [PubMed] [Google Scholar]
- 39.McClain JL, Mazzotta EA, Maradiaga N, Duque-Wilckens N, Grants I, Robison AJ, Christofi FL, Moeser AJ, Gulbransen BD (2020). Histamine-dependent interactions between mast cells, glia, and neurons are altered following early-life adversity in mice and humans. Am J Physiol Gastrointest Liver Physiol, 319(6):G655–G668. doi: 10.1152/ajpgi.00041.2020. [DOI] [PMC free article] [PubMed] [Google Scholar]
- 40.Gulbransen BD, Bashashati M, Hirota SA, Gui X, Roberts JA, MacDonald JA, Muruve DA, McKay DM, Beck PL, Mawe GM, Thompson RJ, Sharkey KA (2012). Activation of neuronal P2X7 receptor-pannexin-1 mediates death of enteric neurons during colitis. Nat Med,18(4):600–604. doi: 10.1038/nm.2679. [DOI] [PMC free article] [PubMed] [Google Scholar]
- 41.Fujikawa Y, Tominaga K, Tanaka F, Tanigawa T, Watanabe T, Fujiwara Y, Arakawa T. (2015). Enteric glial cells are associated with stress-induced colonic hyper-contraction in maternally separated rats. Neurogastroenterol Motil, 27(7):1010–1023. doi: 10.1111/nmo.12577. [DOI] [PubMed] [Google Scholar]
- 42.Lilli NL, Quénéhervé L, Haddara S, Brochard C, Aubert P, Rolli-Derkinderen M, Durand T, Naveilhan P, Hardouin J-B., De Giorgio R, Barbara G, Bruley des Varannes S, Coron E, Neunlist M. (2018). Glioplasticity in irritable bowel syndrome. Neurogastroenterol Motil, 30(4):e13232. doi: 10.1111/nmo.13232. [DOI] [PubMed] [Google Scholar]
- 43.Laranjeira C, Sandgren K, Kessaris N, Richardson W, Potocnik A, Vanden Berghe P, Pachnis V. (2011). Glial cells in the mouse enteric nervous system can undergo neurogenesis in response to injury. J Clin Invest, 121(9):3412–3424. doi: 10.1172/JCI58200. [DOI] [PMC free article] [PubMed] [Google Scholar]
- 44.LeComte MD, Shimada IS, Sherwin C, Spees JL (2015). Notch1-STAT3-ETBR signaling axis controls reactive astrocyte proliferation after brain injury. Proc Natl Acad Sci U S A, 112(28):8726–8731. doi: 10.1073/pnas.1501029112. [DOI] [PMC free article] [PubMed] [Google Scholar]
- 45.Rogers SD, Peters CM, Pomonis JD, Hagiwara H, Ghilardi JR, Mantyh PW (2003). Endothelin B receptors are expressed by astrocytes and regulate astrocyte hypertrophy in the normal and injured CNS. Glia, 41(2):180–190. doi: 10.1002/glia.10173. [DOI] [PubMed] [Google Scholar]
- 46.Gong S, Zheng C, Doughty ML, Losos K, Didkovsky N, Schambra UB, Nowak NJ, Joyner A, Leblanc G, Hatten ME, Heintz N. (2003). A gene expression atlas of the central nervous system based on bacterial artificial chromosomes. Nature, 425(6961):917–925. doi: 10.1038/nature02033. [DOI] [PubMed] [Google Scholar]
- 47.Linan-Rico A, Grants I, Needleman BJ, Williams KC, Soghomonyan S, Turco F, Cuomo R, Grider JR, Kendig DM, Murthy KS, Harzman A, Ochoa-Cortes F, Christofi FL (2015). Gliomodulation of Neuronal and Motor Behavior in the Human GI Tract. Gastroenterology, 148(4):S-18, doi: 10.1016/S0016-5085(15)30063-9. [DOI] [Google Scholar]
- 48.Gee JM, Smith NA, Fernandez FR, Economo MN, Brunert D, Rothermel M, Morris SC, Talbot A, Palumbos S, Ichida JM, Shepherd JD, West PJ, Wachowiak M, Capecchi MR, Wilcox KS, White JA, Tvrdik P. (2014). Imaging activity in neurons and glia with a Polr2a-based and cre-dependent GCaMP5G-IRES-tdTomato reporter mouse. Neuron 83, 1058–1072. 10.1016/j.neuron.2014.07.024 [DOI] [PMC free article] [PubMed] [Google Scholar]
- 49.McClain JL, Gulbransen BD (2017). The acute inhibition of enteric glial metabolism with fluoroacetate alters calcium signaling, hemichannel function, and the expression of key proteins. J Neurophysiol, 117(1):365–375. doi: 10.1152/jn.00507.2016. [DOI] [PMC free article] [PubMed] [Google Scholar]
- 50.Grubišić V, McClain JL, Fried DE, Grants I, Rajasekhar P, Csizmadia E, Ajijola OA, Watson RE, Poole DP, Robson SC, Christofi FL, Gulbransen BD (2020). Enteric Glia Modulate Macrophage Phenotype and Visceral Sensitivity following Inflammation. Cell Rep, 32(10):108100. doi: 10.1016/j.celrep.2020.108100. [DOI] [PMC free article] [PubMed] [Google Scholar]
- 51.Grundmann D, Klotz M, Rabe H, Glanemann M, Schäfer KH (2015). Isolation of high-purity myenteric plexus from adult human and mouse gastrointestinal tract. Sci Rep, 5:9226. doi: 10.1038/srep09226. [DOI] [PMC free article] [PubMed] [Google Scholar]
- 52.Mallesh S, Schneider R, Schneiker B, Lysson M, Efferz P, Lin E, de Jonge WJ, Wehner S. (2021). Sympathetic Denervation Alters the Inflammatory Response of Resident Muscularis Macrophages upon Surgical Trauma and Ameliorates Postoperative Ileus in Mice. Int J Mol Sci, 22(13): 6872. doi: 10.3390/ijms22136872. [DOI] [PMC free article] [PubMed] [Google Scholar]
- 53.Ren T, Grants I, Alhaj M, McKiernan M, Jacobson M, Hassanain HH, Frankel W, Wunderlich J, Christofi FL (2011). Impact of disrupting adenosine A₃ receptors (A₃⁻/⁻ AR) on colonic motility or progression of colitis in the mouse. Inflamm Bowel Dis, 17(8):1698–713. doi: 10.1002/ibd.21553. [DOI] [PMC free article] [PubMed] [Google Scholar]
- 54.Kendig DM, Hurst NR, Grider JR (2016). Spatiotemporal Mapping of Motility in Ex Vivo Preparations of the Intestines, JOVE, Jan 27(107):e53263. doi: 10.3791/53263. [DOI] [PMC free article] [PubMed] [Google Scholar]
- 55.Leven P, Schneider R, Siemens KD, Jackson WS, Wehner S. (2022). Application of a RiboTag-based approach to generate and analyze mRNA from enteric neural cells. Neurogastroenterol Motil, 34(7):e14309. doi: 10.1111/nmo.14309. [DOI] [PubMed] [Google Scholar]
- 56.Gulbransen BD, Sharkey KA (2009). Purinergic neuron-to-glia signaling in the enteric nervous system. Gastroenterology, 136(4):1349–1358. doi: 10.1053/j.gastro.2008.12.058. [DOI] [PubMed] [Google Scholar]
- 57.Khodorova A, Zou S, Ren K, Dubner R, Davar G, Strichartz G. Dual Roles for Endothelin-B Receptors in Modulating Adjuvant-Induced Inflammatory Hyperalgesia in Rats. Open Pain J. 2009;2:30–40. doi: 10.2174/1876386300902010030. [DOI] [PMC free article] [PubMed] [Google Scholar]
- 58.Ługowska-Umer H, Umer A, Kuziemski K, Sein-Anand Ł, Korolkiewicz RP. (2019). The protective effect of endothelin receptor antagonists against surgically induced impairment of gastrointestinal motility in rats. J Smooth Muscle Res, 55(0):23–33. doi: 10.1540/jsmr.55.23. [DOI] [PMC free article] [PubMed] [Google Scholar]
- 59.Yoshinaga M, Chijiiwa Y, Misawa T, Harada N, Nawata H. (1992). Endothelin B receptor on guinea pig small intestinal smooth muscle cells. Am J Physiol, 262(2 Pt 1):G308-G311. doi: 10.1152/ajpgi.1992.262.2.G308. [DOI] [PubMed] [Google Scholar]
- 60.Soboleski MR, Oaks J, Halford WP (2005). Green fluorescent protein is a quantitative reporter of gene expression in individual eukaryotic cells. FASEB J, 19(3):440–442. doi: 10.1096/fj.04-3180fje. [DOI] [PMC free article] [PubMed] [Google Scholar]
- 61.Snapp E. (2005). Design and use of fluorescent fusion proteins in cell biology. Curr Protoc Cell Biol, 27(1):21.4.1–21.4.13. doi: 10.1002/0471143030.cb2104s27. [DOI] [PMC free article] [PubMed] [Google Scholar]
- 62.Q LV, Guo K, Xu H, Wang T, Zhang Y. (2015). Identification of Putative ORF5 Protein of Porcine Circovirus Type 2 and Functional Analysis of GFP-Fused ORF5 Protein. PLoS One. 10(6):e0127859. doi: 10.1371/journal.pone.0127859. [DOI] [PMC free article] [PubMed] [Google Scholar]
- 63.Feldman-Goriachnik R, Hanani M. (2011). Functional study of endothelin B receptors in satellite glial cells in trigeminal ganglia. Neuroreport, 22(10):465–469. doi: 10.1097/WNR.0b013e3283472487. [DOI] [PubMed] [Google Scholar]
- 64.Milner P, Loesch A, Burnstock G. (2000). Endothelin immunoreactivity and mRNA expression in sensory and sympathetic neurones following selective denervation. Int J Dev Neurosci. 18(8):727–734. doi: 10.1016/s0736-5748(00)00054-x. [DOI] [PubMed] [Google Scholar]
- 65.Lee PR, Fields RR (2021). Activity-Dependent Gene Expression in Neurons. Neuroscientist, 27(4):355–366. doi: 10.1177/1073858420943515. [DOI] [PMC free article] [PubMed] [Google Scholar]
- 66.Brosenitsch TA, Katz DM (2001). Physiological patterns of electrical stimulation can induce neuronal gene expression by activating N-type calcium channels. J Neurosci, 21(8):2571–2579. doi: 10.1523/JNEUROSCI.21-08-02571.2001. [DOI] [PMC free article] [PubMed] [Google Scholar]
- 67.LeMasson G, Marder E, Abbott LF (1993). Activity-dependent regulation of conductances in model neurons. Science, 259(5103):1915–1917. doi: 10.1126/science.8456317. [DOI] [PubMed] [Google Scholar]
- 68.Barr TP, Kornberg D, Montmayeur J-P, Long M, Reichheld S, Strichartz GR (2015). Validation of endothelin B receptor antibodies reveals two distinct receptor-related bands on Western blot. Anal Biochem, 468:28–33. doi: 10.1016/j.ab.2014.09.004. [DOI] [PMC free article] [PubMed] [Google Scholar]
- 69.Boyd R, Rätsep MT, Ding LL, Wang HD (2011) ETA and ETB receptors are expressed in vascular adventitial fibroblasts. Am J Physiol Heart Circ Physiol, 301(6):H2271–H2278. doi: 10.1152/ajpheart.00869.2010. [DOI] [PubMed] [Google Scholar]
- 70.Islamov RR, Chintalgattu V, McMurray RJ, Pak ES, Murashov AK, Katwa LC (2003). Differential expression of endothelin receptors in regenerating spinal motor neurons in mice. Brain Res Mol Brain Res, 116(1–2):163–167. doi: 10.1016/s0169-328x(03)00258-4. [DOI] [PubMed] [Google Scholar]
- 71.Quaschning T, Voss F, Relle K, Kalk P, Vignon-Zellweger N, Pfab T, Bauer C, Theilig F, Bachmann S, Kraemer-Guth A, Wanner C, Theuring F, Galle J, Hocher B. (2007). Lack of endothelial nitric oxide synthase promotes endothelin-induced hypertension: lessons from endothelin-1 transgenic/endothelial nitric oxide synthase knockout mice. J Am Soc Nephrol, 18(3):730–740. doi: 10.1681/ASN.2006050541. [DOI] [PubMed] [Google Scholar]
- 72.De Schepper HU, De Winter BY, Seerden TC, Herman AG, Pelckmans PA, De Man JG (2005). Functional characterisation of tachykinin receptors in the circular muscle layer of the mouse ileum. Regul Pept, 130(3):105–115. doi: 10.1016/j.regpep.2005.04.003. [DOI] [PubMed] [Google Scholar]
- 73.Gardner A, Westfall TC, Macarthur H. (2005). Endothelin (ET)-1-induced inhibition of ATP release from PC-12 cells is mediated by the ETB receptor: differential response to ET-1 on ATP, neuropeptide Y, and dopamine levels. J Pharmacol Exp Ther, 313(3):1109–1117. doi: 10.1124/jpet.104.081075. [DOI] [PubMed] [Google Scholar]
- 74.Filosa JA, Naskar K, Perfume G, Iddings JA, Biancardi V.c., Vatta M.s., Stern JE (2012). Endothelin-mediated calcium responses in supraoptic nucleus astrocytes influence magnocellular neurosecretory firing activity. J Neuroendocrinol, 24(2):378–392. doi: 10.1111/j.1365-2826.2011.02243.x. [DOI] [PubMed] [Google Scholar]
- 75.Rao M, Rastelli D, Dong L, Chiu S, Setlik W, Gershon MD, Corfas G. (2017). Enteric Glia Regulate Gastrointestinal Motility but Are Not Required for Maintenance of the Epithelium in Mice. Gastroenterology, 153(4):1068–1081.e7. doi: 10.1053/j.gastro.2017.07.002. [DOI] [PMC free article] [PubMed] [Google Scholar]
- 76.Nasser Y, Fernandez E, Keenan CM, Ho W, Oland LD, Tibbles LA, Schemann M, MacNaughton WK, Rühl A, Sharkey KA (2006). Role of enteric glia in intestinal physiology: effects of the gliotoxin fluorocitrate on motor and secretory function. Am J Physiol Gastrointest Liver Physiol, 291(5):G912–27. doi: 10.1152/ajpgi.00067.2006. [DOI] [PubMed] [Google Scholar]
- 77.Gariepy CE, Cass DT, Yanagisawa M. (1996). Null mutation of endothelin receptor type B gene in spotting lethal rats causes aganglionic megacolon and white coat color. Proc Natl Acad Sci U S A, 93(2):867–872. doi: 10.1073/pnas.93.2.867. [DOI] [PMC free article] [PubMed] [Google Scholar]
- 78.Giller T, Breu V, Valdenaire O, Clozel M. (1997). Absence of ET(B)-mediated contraction in Piebald-lethal mice. Life Sci, 61(3):255–263. doi: 10.1016/s0024-3205(97)00381-0. [DOI] [PubMed] [Google Scholar]
- 79.Alexander SPH, et al. (2021). The Concise Guide to PHARMACOLOGY 2021/22: G-protein coupled receptors. Br J Pharmacol, 178: S27–S156. [DOI] [PubMed] [Google Scholar]
- 80.Alexander SPH et al. (2018). Goals and practicalities of immunoblotting and immunohistochemistry: A guide for submission to the British Journal of Pharmacology. Br J Pharmacol. 175(3):407–411. doi: 10.1111/bph.14112. [DOI] [PMC free article] [PubMed] [Google Scholar]
- 81.Curtis MJ et al. , (2018). Experimental design and analysis and their reporting II: updated and simplified guidance for authors and peer reviewers. Br J Pharmacol. 175(7):987–993. doi: 10.1111/bph.14153. [DOI] [PMC free article] [PubMed] [Google Scholar]
Associated Data
This section collects any data citations, data availability statements, or supplementary materials included in this article.
Supplementary Materials
(a) The EGFP reporter is expressed in s100β+ glia. (b) EGFP is not expressed in HuC/D+ neurons.
(a) L-NAME (100μM) enhances the EFS – induced neuromuscular contraction of the circular muscle by inhibiting nitric oxide production. (b) In the presence of L-NAME, BQ788 still enhances the EFS response; data analyzed by 2-way RM ANOVA (and mixed effects model treatment); Sidak’s post hoc multiple comparisons were used to test differences at specific frequencies between interventions; n=6 separate experiments; *p<0.01; **p<0.001, ***p<0.0001. BQ788 or L-NAME were pre-incubated for 30 min for the EFS study.
x(a-b) BQ788 (3μM) treatment does not influence resting tension. (c) example in one animal to show that treatment with BQ788 (3μM) does not influence CM responsiveness. (d) example in a separate animal showing that BQ788 (3μM) can lead to an increase in phasic activity. (e) same response as in ‘d’ with an expanded time scale for the period of activity identified by dotted lines. Responses were recorded for 30 min throughout the BQ788 incubation incubation to test effects on resting tension and phasic activity.
(a) the photograph shows gut manipulation of the small bowel in the anesthetized mouse. (b-c) Expression of myeloperoxidase (MPO+) and MHC II+ leukocytes and tissue macrophages are increased after IM 24 h (*p<0.01). (d-f) In vivo administration (i.p.) of 1mg/Kg BQ788 for 7 consecutive days reduces leukocyte infiltration (*p<0.01).
(a-d) SaTX (200nM) induces transient relaxation of CM. (e-f) The SaTX evoked response is blocked by BQ788 (3μM) or TTX (1 μM) that inhibit nerve conduction. (g-h,l) ET-1 (100nM) causes contraction of CM. (j) BQ788 alone has no effect on CM contractions. (i,k) TTX or BQ788 do not block excitatory responses to ET-1. Red arrow indicates where chemical was added. EFS responses were recorded before and after drug treatment. TTX was incubated for 10 min and BQ788 was incubated for 30 min to test effects on EFS stimulation.
(a,b) SaTX triggers a concentration-dependent Ca2+response. (c) The selective ETBR antagonist BQ788 (1μM) blocks the Ca2+wave triggered by 50nM SaTX. BQ788 alone has no effect on baseline Ca2+ responses. In the presence of BQ788 after a 30 min pre-incubation, SaTX does not trigger a Ca2+ response. Washout of BQ788 by switching to Kreb’s buffer perfusion for 20 min, and re-exposure to SaTX triggers a Ca2+ response; the response represents the averaged Ca2+response in glia in the recorded ganglion. (d) Ca2+ wave response for ‘c’ showing the individual glial Ca2+transients used to generate the averaged Ca2+ response. (e) Pooled data for peak Ca2+ responses (ΔF/Fo) and %glial responding in the Ca2+wave for SaTX in the presence or absence of BQ788. (f) The kinetic response to SaTX is much faster in a smaller 0.4ml perfusion chamber compared to a much larger perfusion chamber (4 ml chamber) used in ‘c’. (g) 50nM SaTX triggers a slow developing Ca2+wave in a culture network of human enteric glia (hEGC). (h) Quantitative analysis of the SaTX response in hEGCs. (i) 50nM SaTX also triggers a glial Ca2+wave in intact isolated networks of human myenteric ganglia; a similar response was observed in 4 other network experiments. (j) transmitted light photomicrograph of an isolated network of myenteric ganglia loaded with fluo-4/AM for Ca2+imaging; n=5 mice, one way ANOVA, p<0.01 in ‘a’ and ‘b’; in ‘f’ n=10 hEGC cultures.
(a-d) The EGFP reporter is upregulated in the Tg-mice with gut surgical manipulation (IM 24h); (d) Quantitative analysis of the EGFP reporter expression for WT (control), sham 24h and IM 24h. There is an increase in EGFP fluorescence intensity with IM compared to sham animals; 3-D imaging of 23μm optical slices (0.5μm z-steps) were used for quantitative analysis. (e-j) Western blot analysis shows upregulation of the protein recognized by both anti-EGFP and anti-Ednrb (ETBR) antibody. (k-n) 3-D imaging and reconstructions of the LMMP-CM preparation (i.e. 41μm thick z-stack) from CM to LM demonstrates that the EGFP reporter is also restricted to glial cells in the inflamed state of POI (IM 24h). (o-p) Co-localization analysis using image-J shows lack of expression of the EGFP in HuC/D+ neurons. (q-r) In contrast, EGFP is >90% co-localized with GFAP+ glia (***p<0.0001; ns, not significant; n=6 (or more) samples/group.
(a-c) Laser confocal z-stack images (12μm optical slice, 0.5μm intervals) of GFAP immunoreactivity in myenteric ganglia of the mouse jejunum for control, sham and IM wild-type mice. There is visible increase in GFAP immunoreactivity with IM. (d) The glial GFAP protein (marker of gliosis) is upregulated by IM 24h (p<0.0001). (e-g) Z-stack images of MPO immunoreactivity (inflammation / leukocyte marker) in control, sham and IM Tg(Ednrb-EGFP)EP59Gsat/Mmucd reporter mice. IM increases MPO cells surrounding the ganglia. (h) IM increases MPO levels in the muscularis externa (*p<0.0001). (i-l) CD68 immunoreactivity (immune cell activation marker) is increased by sham (**p<0.001) and IM (***p<0.0001) in Tg(Ednrb-EGFP)EP59Gsat/Mmucd ETBR reporter mice (n=8 samples/group). Thickness of z-stacks for is 20μm; images s at 0.5μm z-steps. (m-v) Up regulation of mRNA expression of pro-inflammatory mediators in muscularis externa of the mouse jejunum in POI after gut manipulation (IM versus sham, during acute phase at 3h IM). Increase in expression occurred in chemokines, cytokines and Fos (unpaired t-test, *p<0.01, n=7 animals/group).
ET-1-ir is abundant in varicose fibers of the myenteric plexus in and outside the ganglia. (a) As shown in overlay images, varicose fibers are in close contacts with tdT+ glia in myenteric ganglia (i.e. refer to yellow staining over the tdT+ glia). (b) ET-1-ir was not shown to be expressed in HuC/D+ neurons analyzed. (c, d) Examples of ET-1 co-labeling with a subset of Substance P+(SP) varicose fibers in myenteric ganglia; arrow indicates co-localization. (e, f) Examples of ET-1 co-labeling with peripherin in varicose nerve fibers (i.e. yellow fibers show co-localization of ET-1 and peripherin). (g-i) 3-D laser confocal imaging and visualization of ET-1-ir through the circular muscle (CM) layer (g), myenteric plexus ganglia network layer (MP, h) and longitudinal muscle (LM, ‘i’, 12–15μm z-stacks constructed at 0.5μm z-steps) layers of the same LMMP-CM preparation. SMA-ir was used to visualize smooth muscle layers. As shown, ET-1-ir is not expressed in CM or LM, but is abundant in MP in varicose fibers in the ganglia, and some varicose fibers in the CM. ET-1 is restricted to the varicose nerve fibers primarily in myenteric ganglia of the muscularis externa. (j) Edn1 (ET-1) was confirmed in ribosomal mRNA of RiboTag ChAT-Neurons (n=8 animals/group) and (k) isolated neural networks of myenteric ganglia devoid of smooth muscle (prepared from human surgical specimens)50 (l) Normalized ET-1 expression in neural networks of ganglia (n=8 human neural network preparations). Thickness of confocal z-stacks is 20μm; images s at 0.5μm intervals. DAPI is used to counterstain cell nuclei.
Data Availability Statement
The data included in this study will be made available from the corresponding author upon reasonable request. Some data from human subjects may be protected under the privacy/HIPPA regulations.