

Abstract
Background
The Colorectal Cancer Subtyping Consortium established four Consensus Molecular Subtypes (CMS) in colorectal cancer: CMS1 (microsatellite-instability [MSI], Immune), CMS2 (Canonical, epithelial), CMS3 (Metabolic), and CMS4 (Mesenchymal). However, only MSI tumour patients have seen a change in their disease management in clinical practice. This study aims to characterise the proteome of colon cancer CMS and broaden CMS’s clinical utility.
Methods
One-hundred fifty-eight paraffin samples from stage II-III colon cancer patients treated with adjuvant chemotherapy were analysed through DIA-based mass-spectrometry proteomics.
Results
CMS1 exhibited overexpression of immune-related proteins, specifically related to neutrophils, phagocytosis, antimicrobial response, and a glycolytic profile. These findings suggested potential therapeutic strategies involving immunotherapy and glycolytic inhibitors. CMS3 showed overexpression of metabolic proteins. CMS2 displayed a heterogeneous protein profile. Notably, two proteomics subtypes within CMS2, with different protein characteristics and prognoses, were identified. CMS4 emerged as the most distinct group, featuring overexpression of proteins related to angiogenesis, extracellular matrix, focal adhesion, and complement activation. CMS4 showed a high metastatic profile and suggested possible chemoresistance that may explain its worse prognosis.
Conclusions
DIA proteomics revealed new features for each colon cancer CMS subtype. These findings provide valuable insights into potential therapeutic targets for colorectal cancer subtypes in the future.
Subject terms: Molecular medicine, Colon cancer, Proteomics, Systems analysis, Machine learning
Background
Colorectal cancer (CRC) is the fourth more frequent tumour with 1,148,515 new cases and 576,858 deaths worldwide in 2020 [1]. 70% of patients with CRC present localised disease at diagnosis, being surgery followed by adjuvant chemotherapy the standard clinical practice. Adjuvant chemotherapy with 5-fluorouracil reduces the risk of death by 3-5% in high-risk stage II colon cancer and by 10–15% in stage III, with a further improvement of 4–5% with oxaliplatin combinations [2]. Some clinic-pathologic features may help to refine the prognosis of patients with stage II-III disease [3, 4]. Nevertheless, most of the patients are going to receive unnecessary adjuvant treatment. Therefore, most of the patients with II-III stage tumours are going to receive an unnecessary adjuvant treatment and the associated toxicity [5]. On the other hand, response to adjuvant treatment and clinical outcomes are heterogeneous [6] and, despite treatment, between 30-50% of all patients with stage II/III localised disease will relapse and eventually die [7].
In this scenario, molecular characterisation of the disease may help to improve patient management. The International Colorectal Cancer Subtyping Consortium (CRCSC) established four Consensus Molecular Subtypes (CMS) in colorectal cancer: CMS1 (microsatellite-instability [MSI], Immune, 14%), CMS2 (Canonical, epithelial characteristics, 37%), CMS3 (Metabolic, 13%), and CMS4 (Mesenchymal, 23%) [8]. CMS4 has been associated with a worse DFS in stages II-III [9]. Using The Cancer Genome Atlas (TCGA) CRC data, our group established two extra classifications of colorectal tumours based on immune and adhesion features respectively [10]. Nevertheless, in the clinical setting, only MSI classification has currently a real impact on clinical practice. It is established that patients with MSI-high CRC tumours do not benefit from 5-fluororuracil monotherapy [11], and do benefit from immunotherapy in the neoadjuvant and metastatic setting [12–14].
Proteomics offers complementary information to genomics, providing a dynamic structural and functional framework [15]. However, proteomics studies in CRC are scarce. Zhang et al. analysed 95 samples from TCGA colorectal cancer cohort by liquid chromatography-tandem mass-spectrometry (LC-MS/MS) and did integrative omics analyses [16]. They found that mRNA-protein correlation is low and established five proteomics subtypes, one of them with an enrichment in epithelial-to-mesenchymal transition (EMT), ligated to a poor prognosis. Vasaikar et al. analysed 110 colon cancer samples by label-free quantification and next-generation sequencing, and described several mutations and protein profiles [17]. Another study re-analysed Zhang data and identified three proteomics subtypes characterised by: 1. a high metabolism, low cell cycle, and negative microsatellite-instability (MSI); 2. high immune response, low metabolism and MSI negative; 3. low immune response, low inflammation, and low adhesion [18]. Finally, in the CMS study, a proteomics characterisation using Zhang’s LC-MS/MS analyses and reverse-phase protein arrays (RPPA) was done, establishing some differences in protein expression between the CMS [8]. All of these studies analysed clinically heterogeneous CRC cohorts, comprehending all tumour stages and even neoadjuvant-treated samples.
The rise of proteomics analyses based on data-independent acquisition methods (DIA) allows an increase in reproducibility of peptide quantification and DIA has become the method of choice in large patient cohorts [19, 20]. DIA consists of the use of windows to fragment all detectable peptides in a sample sequentially [21]. Recent studies have been done in CRC using DIA approaches in serum samples to define screening biomarkers for early detection [22] and progression of the disease [23]. Steffen et al. also used DIA to determine molecular characteristics associated with lymph node metastases in CRC formalin-fixed paraffin-embedded (FFPE) samples, establishing the role of EMT in this process [24].
The main objective of this study is a deeper proteomics characterisation of CMS using DIA LC-MS/MS in a cohort of high-risk II/III colon cancer FFPE samples with the aim of widening their use in clinical practice in order to adjuvant chemotherapy decision-making.
Methods
EPIC-XS colon cancer patient cohort
Samples and data from patients included in this study were provided by the Biobank of La Paz University Hospital, integrated in the Spanish National Biobanks Network and they were processed following standard operating procedures with the appropriate approval of the Ethics and Scientific Committees. For this study, 375 colon cancer patients at stages II-III were recruited between January 2004 and December 2009 in La Paz University Hospital following these inclusion criteria: completely resected colon adenocarcinoma without any evidence of metastatic disease, stages II/III, and receiving adjuvant chemotherapy after surgery. The criteria for receiving adjuvant treatment after surgery were: stage III or high-risk stage II colon cancer with at least one of the following clinic-pathological features: T4, inadequate lymph node sampling (less than 14 lymph nodes at the time of surgery), tumour presentation with bowel obstruction or perforation, lymphovascular or perineural invasion, poorly differentiated histology, or a high preoperative serum carcinoembryonic antigen (CEA) level. Both clinical data and tumour FFPE samples were available for one-hundred and fifty-eight patients. Approval for the study was obtained from the La Paz University Hospital Ethical Committee (PI-1019) and informed written consent was obtained for each participant in the study.
Sample processing and protein isolation
Tumour sections were selected from formalin-fixed paraffin-embedded (FFPE) tumour tissue blocks containing at least 80% of tumour tissue. A 10 µm section from each FFPE sample was deparaffinized in xylene and washed twice in absolute ethanol. Protein extracts were prepared in 2% SDS using a heat-induced antigen retrieval-based protocol [25]. MicroBCA Protein Assay Kit (Pierce-Thermo Scientific) was used for protein quantification. Protein extracts were digested by trypsin (1:50) and SDS was removed using Detergent Removal Spin Columns (Pierce). After mass-spectrometry (MS) experiments, peptides were cleaned using C18 stage tips, re-solubilized in MS sample buffer, and spiked with indexed retention time (iRT)-peptides.
DIA LC-MS/MS proteomics experiments
For the DIA step, each sample was run individually. MS analysis was performed on an Orbitrap Fusion (Thermo Scientific) equipped with a Digital PicoView source (New Objective) and coupled to an M-Class UPLC (Waters), operated in trapping mode. Peptides were loaded onto a commercial MZ Symmetry C18 Trap Column (5 µm, 180 µm x 20 mm, Waters) followed by nanoEase MZ C18 HSS T3 Column (1.8 µm, 75 µm x 250 mm, Waters). The peptides were eluted at a flow rate of 300 nL/min. After a 3 min initial hold at 5% B, a gradient from 5 to 22% B in 80 min and 22 to 35% B in an additional 10 min was applied. The column was cleaned after the run by increasing to 95% B and holding 95% B for 10 min prior to re-establishing the loading condition. The DIA runs were acquired in Orbitrap-Orbitrap mode with isolation windows of 24 m/z covering a range from 385 to 1015 m/z (DIA) with 1 Da overlap. All relevant data were deposited in the ProteomeXchange Consortium via the PRIDE (http://www.ebi.ac.uk/pride) partner repository with the data set identifier PXD044935.
Spectronaut 15.7 was used for DIA analysis with default parameter settings. Spectra were searched against a canonical SwissProt database for human and common protein contaminants (NCBI taxonomy ID9606, release date 20211001). Protein quantification was performed in Spectronaut using default settings and quantitative data were extracted using the BGS Factory Report (default) and used for follow-up analyses. To perform statistical modelling, fragment intensities were aggregated into precursor and peptide intensities. Log2 transformation and filtering according to 50% of valid values were done using Perseus software [26].
Classification of EPIC-XS colon cancer samples into CMS groups
Proteomics-based CMS assignation was performed as follows. Classification of TCGA colon cancer samples into the CMS can be found at Synapse (https://www.synapse.org/#!Synapse:syn2623706/wiki/67246). We built a customised gene expression database from the TCGA colon cancer RNAseq data [8], including the genes that codified the 1886 proteins quantified in our EPIC-XS cohort. Then, we defined differential genes in that 1886 list in the TCGA colon cohort between CMS groups using a Significance Analysis of Microarrays (SAM). Centroids of these differential genes were calculated for each CMS group and used to classify tumour samples from our EPIC-XS proteomics cohort into the four CMS using the higher Pearson correlations among CMS. Samples with similar correlations with two different CMS were rendered as non-assignable. The R code used to perform this assignment is available on GitHub under the name “Classification of EPIC-XS cohort cancer samples into CMS groups”.
Functional systems biology analyses
Network analyses using probabilistic graphical models (PGM) in the obtained proteomics data were used to functionally characterise the CMS groups [27]. A PGM is a graph that reflects the conditional dependencies between random variables [28]. The result of this analysis is an undirected graph, with local minimum Bayesian Information Criterion (BIC) [28], built in two steps: first, a Markov tree structure, built using the extension of the Chow-Liu solution to find the spanning tree with the maximum likelihood [29, 30], was determined, and then BIC was used to penalise more complex models [28]. This analysis was done in the open-source language R using the gRapHD package [31].
To determine the functional structure of the obtained network, the network was divided into branches, and gene ontology analyses were performed to establish the overrepresented biological functions of the proteins from each branch, using the DAVID webtool with “Homo sapiens” as background and GOTERM-FAT, Biocarta, and KEGG as categories [32].
Functional node activities were calculated as the mean expression of those proteins related to the overrepresented biological function in each branch as shown previously [27, 33], and then differences among CMS were evaluated. A possible relation with known drugs was studied using the DAVID webtool and selecting “DrugBank” as a category.
Statistical analyses
Proteins differentially expressed between groups of samples were identified using a Significance Analysis of Microarrays (SAM), which calculates a score for each protein based on the change in expression relative to the standard deviation of repeated measurements. Permutations of the repeated measurements were used to estimate the false discovery rate (FDR) [34]. These analyses were carried out in TM4 MeV software [35].
Comparisons between distributions were assessed using a Chi-squared test. Functional node activities comparisons between CMS were assessed using the Kruskal–Wallis non-parametric test. p-values were two-sided and considered statistically significant under 0.05. Survival analyses using disease-free survival (DFS) or overall survival (OS) as endpoints were assessed by a Kaplan–Meier and log-rank test using Graph Pad Prism version 6. Disease-free survival (DFS) was defined from the date of intended curative resection to the date of the first recurrence. Overall survival (OS) was defined from the date of surgery until death.
Classification of cancer cell lines into CMS
RNAseq data from colorectal cancer cell lines were downloaded from the Cancer Cell Line Encyclopaedia (CCLE) (https://depmap.org/portal/ccle/) [36, 37]. Colon cancer cell lines were assigned to each CMS according to previous literature [38–41]. Then, CMS2 cell lines were classified into the two groups identified in this study using the centroids of the differential genes between them identified by SAM. Data about drug sensitivity available in Depmap (https://depmap.org/portal/) were used to check the effect of the drugs proposed by DrugBank.
Results
Clinical characteristics of the EPIC-XS colon cancer cohort
For this study, 375 patients with colon cancer fulfilling the inclusion criteria were recruited between January 2004 and December 2009 in La Paz University Hospital. From those, one-hundred and fifty-eight patients had FFPE tumour samples and clinical data available and were included in this study. All patients presented stage II/III colon cancer and received either capecitabine-oxaliplatin (CAPOX) or 5-fluorouracil-folinic acid-oxaliplatin (FOLFOX) adjuvant chemotherapy schemes. After a median follow-up of 66 months, forty-eight relapses and 33 deaths were observed. The clinical characteristics of the cohort are summarised in Table 1.
Table 1.
EPIC-XS colon cancer patients’ characteristics.
| Patient cohort = 158 (100%) | |
|---|---|
| Gender (M:F) | 93 (59%): 65 (41%) |
| Age (median) | 26-85 (67) |
| Tumour location | |
| Right colon | 59 (37%) |
| Left colon | 99 (63%) |
| TNM stage | |
| II | 49 (31%) |
| III | 109 (69%) |
| Grade | |
| 1 | 8 (5.1%) |
| 2 | 130 (82.3%) |
| 3 | 19 (12%) |
| Unknown | 1 (0.6%) |
| Venous invasion | |
| No | 87 (55%) |
| Yes | 70 (44.4%) |
| Unknown | 1 (0.6%) |
| Lymphatic invasion | |
| No | 119 (75.4%) |
| Yes | 38 (24%) |
| Unknown | 1 (0.6%) |
| Neural invasion | |
| No | 98 (62%) |
| Yes | 59 (37.4%) |
| Unknown | 1 (0.6%) |
| Obstruction | |
| No | 125 (79%) |
| Yes | 33 (21%) |
| Perforation | |
| No | 127 (80%) |
| Yes | 31 (20%) |
| Chemotherapy | |
| CAPOX | 127 (80%) |
| FOLFOX | 31 (20%) |
CAPOX capecitabine-oxaliplatin, FOLFOX 5-fluorouracil-folinic acid-oxaliplatin, TNM Tumour-node-metastasis classification.
Proteomics experiments
Two samples were excluded from the proteomics analyses due to a low amount of protein. Finally, one-hundred and fifty-six samples were analysed by DIA LC-MS/MS proteomics. 2698 human proteins were identified in these samples. After applying a quality criterion of 50% of valid values, 1940 proteins were used for the subsequent analyses.
Assignation of EPIC-XS colon samples to CMS
Using the available TCGA colorectal expression data [8], a custom gene expression database was built including 1886 genes codifying for the proteins quantified in our MS experiments. Then, 449 genes differentially expressed between the four CMS groups were identified by SAM in this TCGA colon cancer cohort. Centroids based on these 449 genes were calculated for each CMS group. Correlations between each sample in the EPIC-XS cohort with each CMS centroid were calculated, and samples were assigned to the CMS with higher correlation. In the EPIC-XS proteomics cohort, twenty-two (14%) samples were assigned to CMS1, fifty-nine (38%) to CMS2, fifteen (9.6%) to CMS3, thirty-nine (25%) to CMS4, and twenty-one (13.4%) were non-assignable. Regarding TCGA colorectal cancer data, the Synapse database showed that 49 (13%) samples were designated to CMS1, 133 (35.7%) to CMS2, 51 (13.7%) to CMS3, 105 (28.2%) to CMS4, and 35 (9.4%) were non-determined. CMS distribution in both cohorts was compared using a contingency analysis and no significant differences were found (p = 0.44) (Sup Fig. 1).
Differences between CMS at the protein level
Differences in protein expression between CMS groups were assessed by SAM analyses, comparing tumours from each CMS with all remaining tumours. CMS1 showed an overexpression of proteins related to the immune system, specifically related to neutrophils, phagocytosis, and antimicrobial response, but also lower expression of proteins related to cytoskeleton and focal adhesion. As expected, CMS3 presented an overexpression of proteins related to metabolic pathways. CMS4 had a protein profile completely different from the other CMS groups, with 687 differential proteins compared to the other CMS. The proteins underexpressed in CMS4 were mainly involved in the nucleoplasm, translation, mitochondria, cadherin binding, and splicing, whereas overexpressed proteins were related to extracellular matrix, focal adhesion (annexins A1 and A6, nexilin, actinin alpha1, vimentin, caveolin 1, filamin A, CORO1C, etc.) complement activation, cytoskeleton, and angiogenesis (Sup Table 1). CMS2 showed no differences when compared with the other three groups, suggesting that CMS2 is a heterogeneous group.
There were significant differences in DFS and OS between CMS groups in the colon EPIC-XS proteomics cohort (p = 0.05 and p = 0.022, respectively) (Sup Fig. 2). CMS1 presented the best prognosis, whereas CMS4 had the worst. The DFS at 5 years was 95.45% in CMS1, 64.53% in CMS2, 73.33% in CMS3, and 58.66% in CMS4. The OS at 5 years was 95.45% in CMS1, 89.15% in CMS2, 86.15% in CMS3, and 69.18% in CMS4. Clinical characteristics of each CMS are summarised in Sup Table 2. Distribution of gender, grade and tumour location showed differences between CMS. CMS1 had more tumours located on the right side and CMS1 and CMS4 had a higher proportion of high-grade tumours. These differences were confirmed in the case of tumour location in TCGA cohort (p < 0.0001). In the TCGA cohort, gender did not show differences in distribution across CMS and data about grade was not available.
Functional proteomics characterisation of CMS groups
A PGM was built using data from the 1940 identified human proteins in the colon EPIC-XS proteomics samples. The obtained network was divided into eleven functional nodes, one without any overrepresented function (Fig. 1 and Sup Table 3).
Fig. 1. Functional network of the EPIC-XS colon cancer proreins.

Functional network built by probabilistic graphical models using the proteomics data of EPIC-XS colon cancer samples.
Functional node activities were calculated for each sample to make comparisons between CMS. CMS1 had a higher glycolysis functional node activity. This node contained nine proteins involved in glycolysis and gluconeogenesis: GPI, ENO1, PGAM1, AKR1A1, LDHA, GAPDH, TPI1, ALDOC, and ALDOA. CMS2 had a higher adhesion and translation 2 activities, but also a higher metabolism and mitochondria activities. This mitochondria node was formed by proteins with a role in mitochondrial metabolism such as MFDH2, OGDH, FH, ACOA, ETFB, or ETFA, and mitochondrial ribosomal proteins such as MRPL38, MRPL16, or MRPL49, among others. Most of the proteins included in the functional category “mitochondria” had been also included in the category “metabolism”, but “metabolism” included also some extra proteins such as CYP2S1, COX5A, or FASN. CMS4 had higher adhesion 2 and extracellular matrix activities (Fig. 2).
Fig. 2. Functional node activities according to CMS groups.

ns: no significant; *p ≤ 0.05; **p ≤ 0.01; ***p ≤ 0.001; ****p ≤ 0.0001; a.u. arbitrary units.
Identification of two proteomics-based subtypes in CMS2 tumours
CMS2 protein profile is heterogeneous, suggesting the existence of different proteomics-based subtypes within this group. To test this hypothesis, a hierarchical cluster (HCL) and a SAM using CMS2 samples were performed. HCL identifies two different subtypes of CMS2 samples (Sup Fig. 3). SAM was used to identify differential proteins between these two CMS2 subtypes (Fig. 3). Overexpressed proteins in HCL2 were mainly related to splicing and transcription, whereas some of the HCL1 differential proteins were GNAI3, PXDN or HACD3. HCL1 was characterised by a higher functional node activity of translation & adhesion, translation2 & glycolysis, adhesion, spliceosome, and mitochondria and metabolism while HCL2 was characterised by a high activity of translation 3 functional nodes (Fig. 4). Mitochondria and metabolism functional node contained some actionable proteins such as P31939 (ATIC), P22102 (GART), P07900 (HSP90AA1) or P08238 (HSP90AB1). P07900 (HSP90AA1) and P08238 (HSP90AB1) were related to SNX-5422 according to DrugBank and P31939 (ATIC) and P22102 (GART) with pemetrexed (Sup Table 4).
Fig. 3. Significance Analysis of Microarrays of the two CMS2 proteomics-based subtypes.
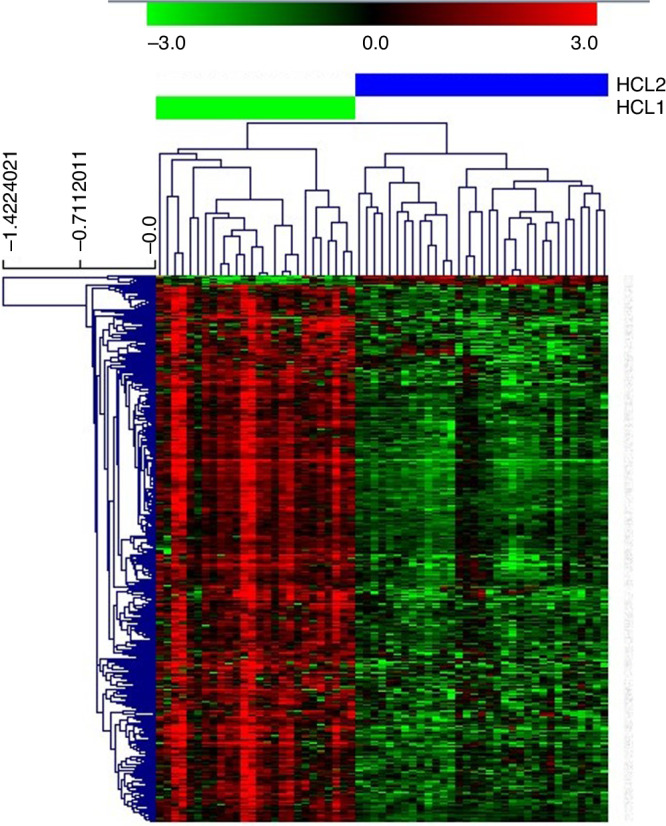
Green = underexpressed. Red = overexpressed.
Fig. 4. Functional node activities comparing the two CMS2 proteomics-based subtypes.
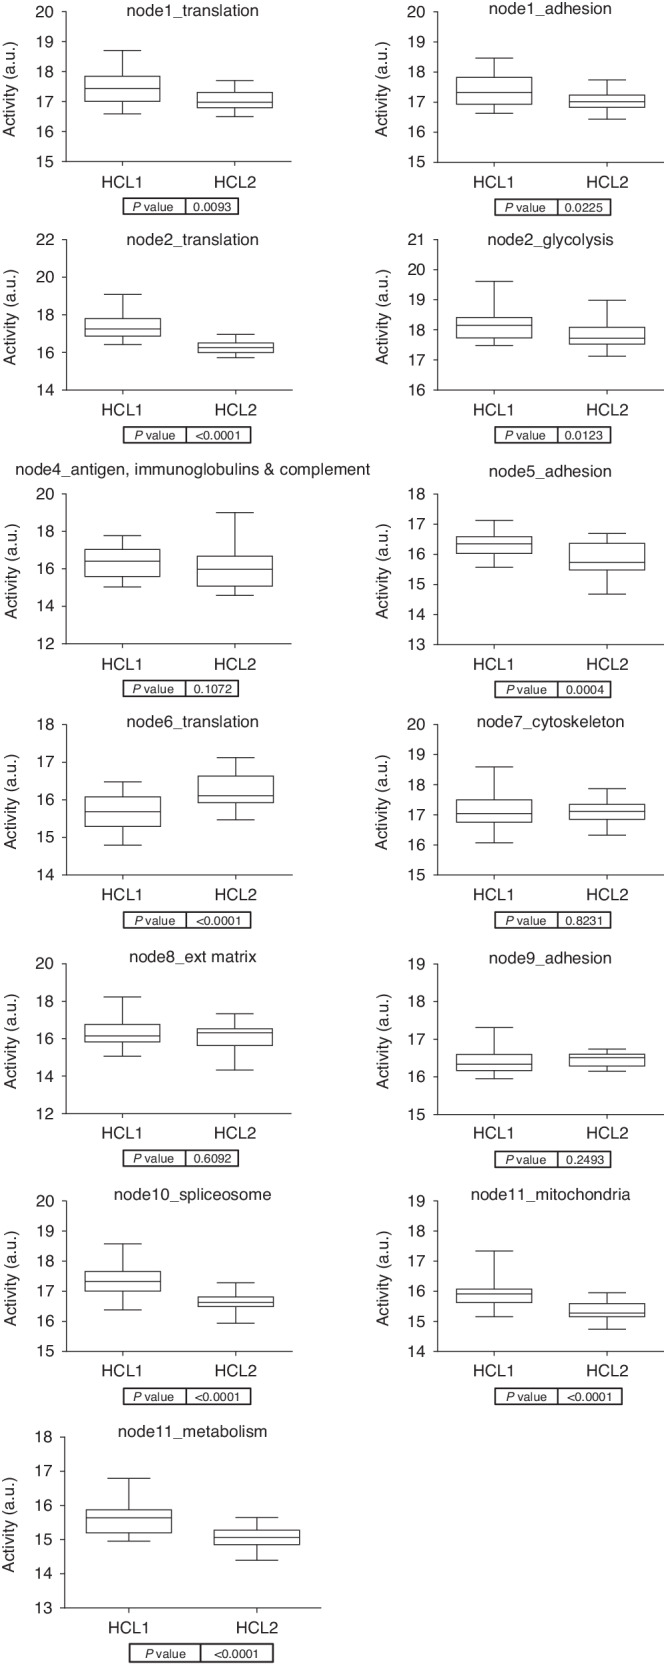
Boxplots comparing the functional node activities of the two CMS2 proteomics subtypes defined in this work. a.u. arbitrary units.
RNA-seq data from CCLE [36, 37] were used to assign CMS2 colon cancer cell lines to each CMS2 group defined in this study. Then, sensitivity to pemetrexed and SNX-5422 in the cell lines of each group was evaluated using depmap information. Colon cancer cell lines classified as HCL1 showed a higher sensitivity to pemetrexed compared to HCL2 cell lines, however, no differences were found in SNX-5422, being all the cell lines sensitive to SNX-5422 (Sup Fig. 4).
DFS at 5 years was 75.55% and 55.33%, and the OS at 5 years was 96.15% and 83.33%, in the HCL1 and HCL2 CMS2 groups respectively. HCL1 seemed to have a better DFS than HCL2 but it was not statistically significant (p = 0.13, HR = 1.96, 95%CI = 0.82–4.56). On the contrary, HCL2 had a worse OS than HCL1 (p = 0.092, HR = 3.47, 95%CI = 0.85-11.6) (Sup Fig. 5). Distribution of the clinical parameters between the two CMS2 proteomics-based subtypes was summarised in Sup Table 5. HCL2 showed a higher proportion of stage III tumours.
A summary of the molecular features of each CMS can be found in Fig. 5.
Fig. 5. Flowchart highlighting the main characteristics of each CMS.

Newly defined characteristics are in red.
Discussion
In 2015, the International Colorectal Cancer Subtyping Consortium (CRCSC) established a consensus molecular classification of colorectal tumours using a multi-omics integrative analysis [8]. These CMS paved the way to future studies, relating these groups with clinical parameters and prognosis [9]. However, proteomics studies using DIA approaches in CRC are scarce and previous proteomics studies used clinically heterogeneous cohorts, being difficult to extrapolate clinically meaningful results. The standard of care in high-risk II and III stages tumours is surgery following adjuvant chemotherapy [2]. However, between 30-50% of patients will relapse [7] and an improvement in patient management and treatment is still needed. Therefore, the objective of this study was the characterisation of the CMS groups using a DIA LC-MS/MS approach in a cohort of stages II/III colon cancer patients with the aim of widening their use in the clinic.
There are some tools and R packages to classify colon samples into CMS groups such as CMScaller [8]. However, most of the genes on which this classification is based were not measured by proteomics. To solve this limitation, an identical database of the proteomics data was created in the TCGA colon RNA-seq data.
The original CMS study, using both RPPA-based proteomics, and LC-MS/MS proteomics, pointed out that CMS1 had an enrichment of proteins related to immune Infiltration and cell cycle, CMS2 of Wnt pathway, and glutathione and arachnoid acid metabolism, CMS3 in fructose metabolism, and CMS4 in stromal and matrix remodelling and complement activation [8, 16].
Using a DIA LC-MS/MS approach, we identified and quantified, after applying stringent quality criteria, 1940 proteins. Using this protein data, analyses to identify proteins differentially expressed between CMS were done. SAM and PGM identified proteins and biological processes with a differential expression between the CMS, identifying biological processes previously described but also new ones.
CMS1 was characterised by an overexpression of proteins related to the immune system, as previously described [8], specifically related to the neutrophil action, phagocytosis and antimicrobial response. Surprisingly, CMS1 also showed a higher glycolysis functional activity. Glycolysis/gluconeogenesis node contained proteins involved in the glycolysis pathway such as phosphoglicerate mutase 1, gliceraldehyde-3-phosphate-dehydrogenase, enolase 1, lactate dehydrogenase A (LDHA) or aldolases ALDOA and C. Vasaikar et al. has already established an increase in glycolytic enzymes in MSI tumours, i.e., CMS1 tumours, hypothetisizing that lactate production inhibits CD8 T cells as an immune evasion mechanism in these tumours and that glycolysis inhibition may render MSI tumours, more sensitive to checkpoint blockade [17]. An effort characterising CD8 T-cell populations in MSI and MSS colorectal tumours and their relation to response to immunotherapy has been done, linking the differences in CD8 T-cell populations to environmental alterations such as microbiota and T-cell receptor diversity [42]. Differential microbiota profiles that may be related to the response to immunotherapy between MSI and MSS tumours have been described [43]. Therefore, a combination of immune checkpoint inhibitors and glycolitic inhibitors may be an efficient therapeutic strategy for these CMS1 tumours and further studies focused on microbiota profiles could give a clue about the behaviour of these tumours.
CMS2 had higher adhesion and translation2 functional node activities. CMS2 has been characterised by a strong epithelial differentiation [8], the proteins in the adhesion node were involved in focal adhesion, specifically in cadherin binding and microtubules. CMS2 functional proteomics analyses showed that this group was characterised by an active mitochondrial metabolism. It has been recently described that the dosage level of Wnt activation has an impact on the metabolic equilibrium and mitochondrial phenotype in CRC [44]. CMS2 is characterised by a Wnt activation that may be related to this higher mitochondria functional node activity. CMS2 can be split into two different proteomics-based subtypes, one of them with an overexpression of proteins related to splicing and translation, and the other one with an overexpression of proteins such as PXDN, which is essential for endothelial cell survival and growth [45]. One of the CMS2 subtypes was characterised by a higher functional activity of the translation node while the other CMS2 subtype was characterised by higher activity of translation & adhesion, translation2 & glycolysis, adhesion, spliceosome, and mitochondria and metabolism. Mitochondria and metabolism nodes contained several proteins related to previously described drugs. P07900 and P08238 were associated with SNX-5422, a Hsp90 inhibitor confirmed as safe in phase I studies [46]. P31939 and P22102 were related to pemetrexed, a drug with positive preliminary results in metastatic colorectal cancer [47]. Data about sensitivity to pemetrexed in colon cancer cell lines supported the sensitivity of HCL1 to this drug. In addition, a possible relation to prognosis was identified in these two subtypes.
In the original CMS study, CMS3 presented an enrichment of all the analysed metabolic pathways (sugar and aminoacid, glucose pentose, fructose, sucrose, galactose, glutamine, glutathione, nitrogen, tyrosine, glycerophospholipid, lysophospholipid, fatty acid, arachidonic, and linoleic acid metabolism) [8]. As expected, CMS3 was characterised by an overexpression of proteins involved in metabolism. However, CMS1 showed a higher glycolysis functional activity than CMS3, while CMS2 showed a higher metabolism and mitochondrial activities than CMS3, suggesting different metabolism alterations within CMS groups.
Proteins overexpressed in CMS4 were mainly related to angiogenesis, complement activation, and extracellular matrix, something previously described in the CMS original study using transcriptomics data [8], but also focal adhesion proteins such as annexins A1 and A6, nexilin, actinin alpha1, vimentin, caveolin 1, CORO1C, or filamin A. ANXA1 and filamin A has been associated with resistance to chemotherapy in CRC cells [48, 49]. In addition, in the molecular classification defined by Sadanandam et al. a subtype characterised by an overexpression of filamin A and associated with no response to cetuximab in metastatic CRC was defined [50]. ANXA6 has been postulated as a biomarker for early detection of high-risk CRC [51]. Vimentin was associated with proliferation in CRC cells [52]. CORO1C was associated with poor prognosis and metastasis promotion in CRC [53]. A worse response to chemotherapy along with a high metastatic profile could be the reason for the CMS4 worse prognosis. CMS4 had a significantly different protein profile compared to the other CMS groups, with 687 differential proteins. CMS4 had a higher adhesion 2 and extracellular matrix functional node activities which agrees with the TCGA study which described CMS4 as a mesenchymal group, characterised by stromal invasion [8]. All of these data suggested a worse response to chemotherapy and a high metastatic profile of CMS4.
It has been previously described that CMS groups have different prognoses. In our EPIC-XS proteomics cohort, CMS4 had a significantly worse DFS than the other CMS groups. This result agrees with previous studies in stage II tumours [9].
The study has some limitations. CMS is based on genetic alterations that cannot be measured by proteomics. For this reason, we need to translate the differences in gene expression in the TCGA colorectal cohort to the proteomics database in order to assign the proteomics EPIC-XS samples into a CMS. A recent report systematically compared mRNA-protein correlations across 14 different human cancer types, showing that the mean Spearman correlation was 0.41 [54], as previously observed in smaller datasets for bladder tissue [55]. Although 0.41 seems poor in terms of correlation, as Ghoshdastider’s work comprised 1899 samples, the critical Spearman’s correlation value for a significance value α = 0.01 is 0.059. Thus, statistical significance is way bigger for most of the mRNA/protein pairs tested. Although mRNA expression does not fully explain protein quantities, results from Ghoshdastider’s work suggest that it is not independent either. On the other hand, we based our classification on 449 different proteins. If we extrapolate Ghoshdastider’s results to this protein set, we should expect that the mRNA/protein expression correlation will be over 0.41 for approximately half of them. Additionally, we validated the EPIC-XS cohort CMS assignation checking different features. First, the proportions of the CMS groups from the TCGA study and the CMS assignation in our EPIC-XS study indicate that there are no differences between them (p = 0.44), being therefore equivalent. Second, clinical data supports the obtained results. For instance, it has been previously described that CMS4 has a worse prognosis in stages II and III [9], as happens in the group identified as CMS4 in our EPIC-XS cohort. Additionally, the group identified as CMS1 was comprehended mostly by right colon-located tumours, a fact that has been also previously described [8]. Finally, biological characteristics found in each EPIC-XS group match with the molecular characteristics described by TCGA for each CMS group. Once corroborated the assignation, proteomics allows to proposal of several new relevant processes for each CMS group.
In this study, a proteomics characterisation of CMS in stages II/III colon cancer FFPE samples using a DIA LC-MS/MS approach was done, establishing new features for each CMS, such as higher mitochondrial activity in CMS2 or an overexpression of proteins related to phagocytosis in CMS1, but also confirming findings previously described using transcriptomics such as an overexpression of proteins related to angiogenesis in CMS4. CMS1 had an overexpression of proteins related to the immune system and also a high glycolytic activity, suggesting a combination of immunotherapy and glycolitic inhibitors as a possible treatment for these tumours. In addition, the overexpression of certain proteins related to focal adhesion in CMS4 suggested a worse response to chemotherapy and a high metastatic profile that could explain the worse prognosis in this subtype. Finally, two different CMS2 proteomics-based subtypes with different prognoses were identified. These proccesses may be used as therapeutic targets in the future.
Supplementary information
Acknowledgements
We want to particularly acknowledge the patients and the Biobank of Hospital La Paz integrated into the Spanish National Biobanks Network for their collaboration.
Author contributions
DM-P, PP-W, DV, NR-S, AC, and JF participated in the data curation. RL-V, LK, and AD contributed to the methodology. DM-L, AG-P, JAFV, JF, and LT-F did the formal analyses. JF and LT-F designed the study. LT-F wrote the original draft. JF and AG-P revised the manuscript.
Funding
This work was supported by EPIC-XS, project number 823839, funded by the Horizon 2020 programme of the European Union.
Data availability
Proteomics raw data are available in the ProteomeXchange Consortium via the PRIDE (http://www.ebi.ac.uk/pride) partner repository with the data set identifier PXD044935.
Competing interests
The authors declare no competing interests.
Ethical approval and consent to participate
The work described has been carried out in accordance with the Declaration of Helsinki. Approval for the study was obtained from the La Paz University Hospital Ethical Committee (PI-1019) and informed written consent was obtained for each participant in the study.
Consent for publication
Not applicable.
Footnotes
Publisher’s note Springer Nature remains neutral with regard to jurisdictional claims in published maps and institutional affiliations.
Contributor Information
Jaime Feliu, Email: jaimefeliu@hotmail.com.
Lucía Trilla-Fuertes, Email: lucia.lt30@gmail.com.
Supplementary information
The online version contains supplementary material available at 10.1038/s41416-024-02650-6.
References
- 1.Sung H, Ferlay J, Siegel RL, Laversanne M, Soerjomataram I, Jemal A, et al. Global Cancer Statistics 2020: GLOBOCAN estimates of incidence and mortality worldwide for 36 cancers in 185 countries. CA Cancer J Clin. 2021;71:209–49. doi: 10.3322/caac.21660. [DOI] [PubMed] [Google Scholar]
- 2.Argilés G, Tabernero J, Labianca R, Hochhauser D, Salazar R, Iveson T, et al. Localised colon cancer: ESMO Clinical Practice Guidelines for diagnosis, treatment and follow-up. Ann Oncol. 2020;31:1291–305. doi: 10.1016/j.annonc.2020.06.022. [DOI] [PubMed] [Google Scholar]
- 3.Viñal D, Martinez-Recio S, Martinez-Perez D, Ruiz-Gutierrez I, Jimenez-Bou D, Peña-Lopez J, et al. Clinical score to predict recurrence in patients with stage II and stage III colon cancer. Cancers (Basel) 2022;14:5891. doi: 10.3390/cancers14235891. [DOI] [PMC free article] [PubMed] [Google Scholar]
- 4.Weiser MR, Hsu M, Bauer PS, Chapman WC, González IA, Chatterjee D, et al. Clinical calculator based on molecular and clinicopathologic characteristics predicts recurrence following resection of stage I-III colon cancer. J Clin Oncol. 2021;39:911–9. doi: 10.1200/JCO.20.02553. [DOI] [PMC free article] [PubMed] [Google Scholar]
- 5.Marshall JL, Haller DG, de Gramont A, Hochster HS, Lenz HJ, Ajani JA, et al. Adjuvant therapy for stage II and III colon cancer: Consensus Report of the International Society of Gastrointestinal Oncology. Gastrointest Cancer Res. 2007;1:146–54. [PMC free article] [PubMed] [Google Scholar]
- 6.Rodriguez-Salas N, Dominguez G, Barderas R, Mendiola M, García-Albéniz X, Maurel J, et al. Clinical relevance of colorectal cancer molecular subtypes. Crit Rev Oncol Hematol. 2017;109:9–19. doi: 10.1016/j.critrevonc.2016.11.007. [DOI] [PubMed] [Google Scholar]
- 7.Sargent D, Sobrero A, Grothey A, O’Connell MJ, Buyse M, Andre T, et al. Evidence for cure by adjuvant therapy in colon cancer: observations based on individual patient data from 20,898 patients on 18 randomized trials. J Clin Oncol. 2009;27:872–7. doi: 10.1200/JCO.2008.19.5362. [DOI] [PMC free article] [PubMed] [Google Scholar]
- 8.Guinney J, Dienstmann R, Wang X, de Reyniès A, Schlicker A, Soneson C, et al. The consensus molecular subtypes of colorectal cancer. Nat Med. 2015;21:1350–6. doi: 10.1038/nm.3967. [DOI] [PMC free article] [PubMed] [Google Scholar]
- 9.Valenzuela G, Canepa J, Simonetti C, Solo de Zaldívar L, Marcelain K, González-Montero J. Consensus molecular subtypes of colorectal cancer in clinical practice: A translational approach. World J Clin Oncol. 2021;12:1000–8. doi: 10.5306/wjco.v12.i11.1000. [DOI] [PMC free article] [PubMed] [Google Scholar]
- 10.López-Camacho E, Prado-Vázquez G, Martínez-Pérez D, Ferrer-Gómez M, Llorente-Armijo S, López-Vacas R, et al. A novel molecular analysis approach in colorectal cancer suggests new treatment opportunities. Cancers (Basel) 2023;15:1104. doi: 10.3390/cancers15041104. [DOI] [PMC free article] [PubMed] [Google Scholar]
- 11.Boland CR, Goel A. Microsatellite instability in colorectal cancer. Gastroenterology. 2010;138:2073–87.e3. doi: 10.1053/j.gastro.2009.12.064. [DOI] [PMC free article] [PubMed] [Google Scholar]
- 12.Overman MJ, McDermott R, Leach JL, Lonardi S, Lenz HJ, Morse MA, et al. Nivolumab in patients with metastatic DNA mismatch repair-deficient or microsatellite instability-high colorectal cancer (CheckMate 142): an open-label, multicentre, phase 2 study. Lancet Oncol. 2017;18:1182–91. doi: 10.1016/S1470-2045(17)30422-9. [DOI] [PMC free article] [PubMed] [Google Scholar]
- 13.Overman MJ, Lonardi S, Wong KYM, Lenz HJ, Gelsomino F, Aglietta M, et al. Durable clinical benefit with nivolumab plus ipilimumab in DNA mismatch repair-deficient/microsatellite instability-high metastatic colorectal cancer. J Clin Oncol. 2018;36:773–9. doi: 10.1200/JCO.2017.76.9901. [DOI] [PubMed] [Google Scholar]
- 14.André T, Shiu KK, Kim TW, Jensen BV, Jensen LH, Punt C, et al. Pembrolizumab in microsatellite-instability-high advanced colorectal cancer. N. Engl J Med. 2020;383:2207–18. doi: 10.1056/NEJMoa2017699. [DOI] [PubMed] [Google Scholar]
- 15.Cho WC. Proteomics technologies and challenges. Genomics Proteom Bioinforma. 2007;5:77–85. doi: 10.1016/S1672-0229(07)60018-7. [DOI] [PMC free article] [PubMed] [Google Scholar]
- 16.Zhang B, Wang J, Wang X, Zhu J, Liu Q, Shi Z, et al. Proteogenomic characterization of human colon and rectal cancer. Nature. 2014;513:382–7. doi: 10.1038/nature13438. [DOI] [PMC free article] [PubMed] [Google Scholar]
- 17.Vasaikar S, Huang C, Wang X, Petyuk VA, Savage SR, Wen B, et al. Proteogenomic analysis of human colon cancer reveals new therapeutic opportunities. Cell. 2019;177:1035–49.e19. doi: 10.1016/j.cell.2019.03.030. [DOI] [PMC free article] [PubMed] [Google Scholar]
- 18.Frejno M, Zenezini Chiozzi R, Wilhelm M, Koch H, Zheng R, Klaeger S, et al. Pharmacoproteomic characterisation of human colon and rectal cancer. Mol Syst Biol. 2017;13:951. doi: 10.15252/msb.20177701. [DOI] [PMC free article] [PubMed] [Google Scholar]
- 19.Gillet LC, Navarro P, Tate S, Röst H, Selevsek N, Reiter L, et al. Targeted data extraction of the MS/MS spectra generated by data-independent acquisition: a new concept for consistent and accurate proteome analysis. Mol Cell Proteom. 2012;11:O111.016717. doi: 10.1074/mcp.O111.016717. [DOI] [PMC free article] [PubMed] [Google Scholar]
- 20.Bruderer R, Muntel J, Müller S, Bernhardt OM, Gandhi T, Cominetti O, et al. Analysis of 1508 plasma samples by capillary-flow data-independent acquisition profiles proteomics of weight loss and maintenance. Mol Cell Proteom. 2019;18:1242–54. doi: 10.1074/mcp.RA118.001288. [DOI] [PMC free article] [PubMed] [Google Scholar]
- 21.Guo T, Aebersold R. Recent advances of data-independent acquisition mass spectrometry-based proteomics. Proteomics. 2023;23:e2200011. doi: 10.1002/pmic.202200011. [DOI] [PubMed] [Google Scholar]
- 22.Zheng X, Xu K, Zhou B, Chen T, Huang Y, Li Q, et al. A circulating extracellular vesicles-based novel screening tool for colorectal cancer revealed by shotgun and data-independent acquisition mass spectrometry. J Extracell Vesicles. 2020;9:1750202. doi: 10.1080/20013078.2020.1750202. [DOI] [PMC free article] [PubMed] [Google Scholar]
- 23.Rao J, Wan X, Tou F, He Q, Xiong A, Chen X, et al. Molecular characterization of advanced colorectal cancer using serum proteomics and metabolomics. Front Mol Biosci. 2021;8:687229. doi: 10.3389/fmolb.2021.687229. [DOI] [PMC free article] [PubMed] [Google Scholar]
- 24.Steffen P, Li J, Chandra J, Ahadi MS, Gill AJ, Engel AF, et al. Molecular features of lymph node metastasis in T1/2 colorectal cancer from formalin-fixed paraffin-embedded archival specimens. J Proteome Res. 2021;20:1304–12. doi: 10.1021/acs.jproteome.0c00693. [DOI] [PubMed] [Google Scholar]
- 25.Gámez-Pozo A, Ferrer NI, Ciruelos E, López-Vacas R, Martínez FG, Espinosa E, et al. Shotgun proteomics of archival triple-negative breast cancer samples. Proteom Clin Appl. 2013;7:283–91. doi: 10.1002/prca.201200048. [DOI] [PubMed] [Google Scholar]
- 26.Tyanova S, Temu T, Sinitcyn P, Carlson A, Hein MY, Geiger T, et al. The Perseus computational platform for comprehensive analysis of (prote)omics data. Nat Methods. 2016;13:731–40. doi: 10.1038/nmeth.3901. [DOI] [PubMed] [Google Scholar]
- 27.Gámez-Pozo A, Berges-Soria J, Arevalillo JM, Nanni P, López-Vacas R, Navarro H, et al. Combined label-free quantitative proteomics and microRNA expression analysis of breast cancer unravel molecular differences with clinical implications. Cancer Res. 2015;75:2243–53. doi: 10.1158/0008-5472.CAN-14-1937. [DOI] [PubMed] [Google Scholar]
- 28.Lauritzen S. Graphical models. Oxford, UK.: Oxford University Press;1996.
- 29.Chow C, Liu C. Approximating discrete probability distributions with dependence trees. IEEE Trans Inf Theor. 1968;14:462–7. doi: 10.1109/TIT.1968.1054142. [DOI] [Google Scholar]
- 30.Kruskal J. On the shortest spanning subtree of a graph and the traveling salesman problem. Proc Am Math Soc. 1956;7:48–50. doi: 10.1090/S0002-9939-1956-0078686-7. [DOI] [Google Scholar]
- 31.Abreu G, Edwards D, Labouriau R. High-dimensional graphical model search with the gRapHD R Package. J Stat Softw. 2010;37:1–18. doi: 10.18637/jss.v037.i01. [DOI] [Google Scholar]
- 32.Huang DW, Sherman BT, Lempicki RA. Systematic and integrative analysis of large gene lists using DAVID bioinformatics resources. Nat Protoc. 2009;4:44–57. doi: 10.1038/nprot.2008.211. [DOI] [PubMed] [Google Scholar]
- 33.Gámez-Pozo A, Trilla-Fuertes L, Berges-Soria J, Selevsek N, López-Vacas R, Díaz-Almirón M, et al. Functional proteomics outlines the complexity of breast cancer molecular subtypes. Sci Rep. 2017;7:10100. doi: 10.1038/s41598-017-10493-w. [DOI] [PMC free article] [PubMed] [Google Scholar]
- 34.Tusher VG, Tibshirani R, Chu G. Significance analysis of microarrays applied to the ionizing radiation response. Proc Natl Acad Sci USA. 2001;98:5116–21. doi: 10.1073/pnas.091062498. [DOI] [PMC free article] [PubMed] [Google Scholar]
- 35.Saeed AI, Sharov V, White J, Li J, Liang W, Bhagabati N, et al. TM4: a free, open-source system for microarray data management and analysis. Biotechniques. 2003;34:374–8. doi: 10.2144/03342mt01. [DOI] [PubMed] [Google Scholar]
- 36.Ghandi M, Huang FW, Jané-Valbuena J, Kryukov GV, Lo CC, McDonald ER, et al. Next-generation characterization of the Cancer Cell Line Encyclopedia. Nature. 2019;569:503–8. doi: 10.1038/s41586-019-1186-3. [DOI] [PMC free article] [PubMed] [Google Scholar]
- 37.Barretina J, Caponigro G, Stransky N, Venkatesan K, Margolin AA, Kim S, et al. The Cancer Cell Line Encyclopedia enables predictive modelling of anticancer drug sensitivity. Nature. 2012;483:603–7. doi: 10.1038/nature11003. [DOI] [PMC free article] [PubMed] [Google Scholar]
- 38.Berg KCG, Eide PW, Eilertsen IA, Johannessen B, Bruun J, Danielsen SA, et al. Multi-omics of 34 colorectal cancer cell lines—a resource for biomedical studies. Mol Cancer. 2017;16:116. doi: 10.1186/s12943-017-0691-y. [DOI] [PMC free article] [PubMed] [Google Scholar]
- 39.Fichtner M, Bozkurt E, Salvucci M, McCann C, McAllister KA, Halang L, et al. Molecular subtype-specific responses of colon cancer cells to the SMAC mimetic Birinapant. Cell Death Dis. 2020;11:1020. doi: 10.1038/s41419-020-03232-z. [DOI] [PMC free article] [PubMed] [Google Scholar]
- 40.Linnekamp JF, Hooff SRV, Prasetyanti PR, Kandimalla R, Buikhuisen JY, Fessler E, et al. Consensus molecular subtypes of colorectal cancer are recapitulated in in vitro and in vivo models. Cell Death Differ. 2018;25:616–33. doi: 10.1038/s41418-017-0011-5. [DOI] [PMC free article] [PubMed] [Google Scholar]
- 41.Ronen J, Hayat S, Akalin A. Evaluation of colorectal cancer subtypes and cell lines using deep learning. Life Sci Alliance. 2019;2:e201900517. doi: 10.26508/lsa.201900517. [DOI] [PMC free article] [PubMed] [Google Scholar]
- 42.Borràs DM, Verbandt S, Ausserhofer M, Sturm G, Lim J, Verge GA, et al. Single cell dynamics of tumor specificity vs bystander activity in CD8. Cell Discov. 2023;9:114. doi: 10.1038/s41421-023-00605-4. [DOI] [PMC free article] [PubMed] [Google Scholar]
- 43.Hale VL, Jeraldo P, Chen J, Mundy M, Yao J, Priya S, et al. Distinct microbes, metabolites, and ecologies define the microbiome in deficient and proficient mismatch repair colorectal cancers. Genome Med. 2018;10:78. doi: 10.1186/s13073-018-0586-6. [DOI] [PMC free article] [PubMed] [Google Scholar]
- 44.Imkeller K, Ambrosi G, Klemm N, Claveras Cabezudo A, Henkel L, Huber W, et al. Metabolic balance in colorectal cancer is maintained by optimal Wnt signaling levels. Mol Syst Biol. 2022;18:e10874. doi: 10.15252/msb.202110874. [DOI] [PMC free article] [PubMed] [Google Scholar]
- 45.Lee SW, Kim HK, Naidansuren P, Ham KA, Choi HS, Ahn HY, et al. Peroxidasin is essential for endothelial cell survival and growth signaling by sulfilimine crosslink-dependent matrix assembly. FASEB J. 2020;34:10228–41. doi: 10.1096/fj.201902899R. [DOI] [PubMed] [Google Scholar]
- 46.Infante JR, Weiss GJ, Jones S, Tibes R, Bauer TM, Bendell JC, et al. Phase I dose-escalation studies of SNX-5422, an orally bioavailable heat shock protein 90 inhibitor, in patients with refractory solid tumours. Eur J Cancer. 2014;50:2897–904. doi: 10.1016/j.ejca.2014.07.017. [DOI] [PubMed] [Google Scholar]
- 47.Yu Z, Wang J, Cai X, Gao Z, Wang S, Gu Y. Analysis of pemetrexed-based chemotherapy in the treatment of advanced colorectal cancer. Ann Transl Med. 2020;8:1368. doi: 10.21037/atm-20-1095. [DOI] [PMC free article] [PubMed] [Google Scholar]
- 48.Onozawa H, Saito M, Saito K, Kanke Y, Watanabe Y, Hayase S, et al. Annexin A1 is involved in resistance to 5-FU in colon cancer cells. Oncol Rep. 2017;37:235–40. doi: 10.3892/or.2016.5234. [DOI] [PubMed] [Google Scholar]
- 49.Cheng M, Jiang Y, Yang H, Zhao D, Li L, Liu X. FLNA promotes chemoresistance of colorectal cancer through inducing epithelial-mesenchymal transition and smad2 signaling pathway. Am J Cancer Res. 2020;10:403–23. [PMC free article] [PubMed] [Google Scholar]
- 50.Sadanandam A, Lyssiotis CA, Homicsko K, Collisson EA, Gibb WJ, Wullschleger S, et al. A colorectal cancer classification system that associates cellular phenotype and responses to therapy. Nat Med. 2013;19:619–25. doi: 10.1038/nm.3175. [DOI] [PMC free article] [PubMed] [Google Scholar]
- 51.Komor MA, Bosch LJ, Coupé VM, Rausch C, Pham TV, Piersma SR, et al. Proteins in stool as biomarkers for non-invasive detection of colorectal adenomas with high risk of progression. J Pathol. 2020;250:288–98. doi: 10.1002/path.5369. [DOI] [PMC free article] [PubMed] [Google Scholar]
- 52.Wang Q, Zhu G, Lin C, Lin P, Chen H, He R, et al. Vimentin affects colorectal cancer proliferation, invasion, and migration via regulated by activator protein 1. J Cell Physiol. 2021;236:7591–604. doi: 10.1002/jcp.30402. [DOI] [PubMed] [Google Scholar]
- 53.Wang Z, Jia L, Sun Y, Li C, Zhang L, Wang X, et al. CORO1C is associated with poor prognosis and promotes metastasis through PI3K/AKT pathway in colorectal cancer. Front Mol Biosci. 2021;8:682594. doi: 10.3389/fmolb.2021.682594. [DOI] [PMC free article] [PubMed] [Google Scholar]
- 54.Ghoshdastider U, Sendoel A. Exploring the pan-cancer landscape of posttranscriptional regulation. Cell Rep. 2023;42:113172. doi: 10.1016/j.celrep.2023.113172. [DOI] [PubMed] [Google Scholar]
- 55.Kosti I, Jain N, Aran D, Butte AJ, Sirota M. Cross-tissue analysis of gene and protein expression in normal and cancer tissues. Sci Rep. 2016;6:24799. doi: 10.1038/srep24799. [DOI] [PMC free article] [PubMed] [Google Scholar]
Associated Data
This section collects any data citations, data availability statements, or supplementary materials included in this article.
Supplementary Materials
Data Availability Statement
Proteomics raw data are available in the ProteomeXchange Consortium via the PRIDE (http://www.ebi.ac.uk/pride) partner repository with the data set identifier PXD044935.