

Abstract
Cancer stem/tumor-initiating cells display stress tolerance and metabolic flexibility to survive in a harsh environment with limited nutrient and oxygen availability. The molecular mechanisms underlying this phenomenon could provide targets to prevent metabolic adaptation and halt cancer progression. Here, we showed in cultured cells and live human surgical biopsies of non-small cell lung cancer that nutrient stress drives the expression of the epithelial cancer stem cell marker integrin αvβ3 via upregulation of the β3 subunit, resulting in a metabolic reprogramming cascade that allows tumor cells to thrive despite a nutrient-limiting environment. While nutrient deprivation is known to promote acute, yet transient, activation of the stress sensor AMP-activated protein kinase (AMPK), stress-induced αvβ3 expression via Src activation unexpectedly led to secondary and sustained AMPK activation. This resulted in the nuclear localization of peroxisome proliferator-activated receptor-gamma coactivator 1α (PGC1α) and upregulation of glutamine metabolism, the tricarboxylic acid cycle, and oxidative phosphorylation (OXPHOS). Pharmacological or genetic targeting of this axis prevented lung cancer cells from evading the effects of nutrient stress, thereby blocking tumor initiation in mice following orthotopic implantation of lung cancer cells. These findings reveal a molecular pathway driven by nutrient stress that results in cancer stem cell reprogramming to promote metabolic flexibility and tumor initiation.
Keywords: Nutrient stress, integrin αvβ3, Src, AMPK, PGC1α, OXPHOS, metabolic reprogramming, cancer stemness
Introduction
Within the tumor microenvironment, cancer cells are often exposed to cellular stresses resulting from nutrient deprivation, hypoxia, reactive oxygen species, and exposure to therapeutics. Cancer cells that can adapt to such stresses gain an aggressive phenotype and display the properties of cancer stem/tumor-initiating cells (1–3). Accordingly, cancer cells must adapt to variations in nutrient and oxygen availability (4,5). Thus, metabolic flexibility represents a key benefit that cancer stem/tumor-initiating cells can invoke not only during tumor initiation at the primary site but also as they establish new colonies at metastatic sites. Therefore, targeting this metabolic adaptation might help control cancer progression (6). However, the molecular mechanism(s) through which cancer stem/tumor-initiating cells adapt to nutrient stress has not been fully defined.
Integrins are a family of adhesion receptors that enable cells to sense and respond to their microenvironment (7,8). As the tumor is an evolving tissue that undergoes periods of regional nutrient deprivation, tumor cells must be able to sense and appropriately respond to this form of cellular stress to survive and contribute to tumor formation and progression. Previous studies have shown that integrin αvβ3 is both necessary and sufficient to induce tumor initiation, establishing it as both a marker and a driver of tumor stemness (3,9). Here, we show that cultured non-small cell lung cancer (NSCLC) cells and fresh surgical biopsies from patients respond to nutrient stress by upregulating integrin β3 expression, leading to increased αvβ3 cell surface expression. This, in turn, triggers the anchorage-independent activation of a Src signaling module that not only induces sustained activation of AMPK but also converts the primary metabolic dependency from glycolysis to OXPHOS, enabling cells to adapt to nutrient stress and gain tumor-initiating properties in vivo. Evidence suggests that targeting this signaling module not only reverses the metabolic adaptation brought on by integrin β3, but also blocks tumor initiation. These studies help explain how tumor cells can acquire a stem-like phenotype in response to stress via the upregulation of an integrin subunit.
Methods and Protocols
MATERIAL DETAILS
Reagents
The following reagents were purchased from Selleckchem: OXPHOS complex l inhibitor, IACS-010759 (S8731); AMPK inhibitor, dorsomorphin (S7306); AMPK stimulator, AICAR (S1802); PGC1α inhibitor, SR-18292 (S8528); PGC1α stimulator, ZLN005 (S7447); Src inhibitor, saracatinib (S1006).
Cells
Non-small cell lung cancer cell lines HCC827 (grown in RPMI), H1650 (grown in RPMI), LLC (grown in DMEM), H1975 (grown in RPMI), and H1792 (grown in RPMI) were obtained from the American Type Culture Collection (ATCC). Upon receipt, each cell line was expanded, cryopreserved as low-passage stocks, and tested for mycoplasma using a MycoScope PCR Mycoplasma Detection Kit (Genlantis, MY01050). All the cell lines were used for 30 passages. For ectopic expression and genetic knockdown, cells were transfected with a vector control, full-length integrin β3, integrin β3/β1 chimera, mutant β3 (β3–759X), and/or luciferase using a lentiviral system, as previously described (9,10). shRNAs were obtained from Horizon: non-targeting (shCTRL, RHS4743) and β3 knockdown (sh-β3.1: RHS4696–200690101, sh-β3.2: −200698575, and sh-β3.3: −201895199). For genetic knockout, Gibson assembly was performed to make gRNA, and β3 gRNA and Cas9 (Addgene, 44719) were transfected using Lipofectamine 3000 (Thermo, L3000001). The gRNA sequences are listed in Table S1. ON-TARGETplus SMARTPool siRNAs were obtained from Horizon: non-targeting (D-001810-10-05), STK11 (L-005035-00-0005), CAMKK2 (L-004842-00-0005), PRKAA1 (L-005027-00-0005), and PRKAA2 (L-005361-00-0005). Cells were transfected with siRNA using jetPRIME (Polyplus, 101000015) according to manufacturer’s protocol.
All the cell-based assays were performed in suspension unless stated.
METHOD DETAILS
Quantitative RT-PCR
RNA was isolated using an RNeasy RNA Purification Kit (Qiagen, 75144) following the manufacturer’s instructions. cDNA was synthesized using a High-Capacity cDNA Reverse Transcription Kit (Thermo Fisher Scientific, 4368814), and RT-PCR was performed using CFX96 (Bio-Rad) with SYBR Green (Bio-Rad, 1725272). The primer sequences are listed in Table S2.
Immunoblotting
Immunoblotting was performed as previously described (11). Briefly, cells were washed twice with 1X HBSS before lysing with 1X RIPA buffer containing protease and phosphatase inhibitors. Nuclear and cytoplasmic fractionation was performed using a Nuclear and Cytoplasmic Extraction Reagents kit (Thermo, 78833) according to the manufacturer’s protocol. A BCA assay (Thermo, 23227) was performed, and the lysates were normalized. Sample buffer (NuPAGE LDS Sample Buffer (4X), Sigma, Catalog#NP0007) and reducing agent (NuPAGE™ Sample Reducing Agent, Sigma, NP0009) were added to the lysate and then heated at 95°C for 5 min. Proteins (20 μg) were loaded onto an SDS-PAGE gel. Blocking was performed in 5% BSA in TBS, and probing was performed in 5% BSA in TBST buffer. LI-COR fluorescent secondary antibodies were used to visualize the protein bands using the Odyssey CLX machine and software (LI-COR). The antibodies used in this study are listed in Table S3.
Flow cytometry
Cell pellets were washed with PBS, blocked with 1% BSA in PBS for 30 min at room temperature, and stained with or without indicated primary antibodies with fluorescently labeled secondary antibodies. Cells were incubated with propidium iodide (Sigma, P4864). Flow cytometry was performed on a BD Fortessa X-20 (BD) analyzer, and the data were analyzed using FlowJo (Treestar) software.
Tissue slice culture
Written informed consent from patients were received. The study was conducted in accordance with U.S. Common Rule. The study was approved by an institutional review board of UC San Diego.
Lung cancer tissues obtained at surgical resection were cut using a vibratome, as previously described (12). Briefly, the cancer tissues were embedded in 5% agar and sequentially sliced using a vibratome (200-μm thick). The tissue slices were cultured in 0.4 μm PET transwells with 10% FBS RPMI for 24 h before being exposed to nutrient stress. After the exposure to the indicated stress for 96 h, the slices were fixed in 10% formalin for immunohistochemistry or stained with MitoTracker (Cell Signaling, 9082), as described below.
Immunohistochemistry
Immunohistochemical staining was performed on formalin-fixed paraffin-embedded slides using an ImmPRESS Excel Staining Kit (Vector, MP-7602) following the manufacturer’s instructions. For both integrin β3 and ATP synthase B1, low-pH antigen retrieval was performed for 20 minutes at 95°C. The slides were imaged using an Olympus VS200 Slide Scanner (Olympus). For scoring integrin β3 and ATP synthase B1 staining, scanned images were scored for each protein expression by a blinded observer (score 0–4). To measure the ATP synthase B1-positive area, the area fraction of ATP synthase B1 with respect to the tumor tissue was calculated using ImageJ (NIH). Lung cancer microarray slides were purchased from Biomax (LC10011a and LC641).
MitoTracker staining
For tissue slice staining, after the indicated exposure to nutrient stress for 96 h, tissue slices were stained with MitoTracker Red CMXRos (Cell Signaling, 9082), as previously described (13). Briefly, tissue slices were incubated with Hoechst (5 μg/mL) and MitoTracker (200 nM) in HBSS at 4 °C for 20 min. The tissue slices were then mounted on glass slides using VECTASHIELD (Vector, H-1700).
Cells in suspension were washed and incubated with Accutase (Sigma, SCR005) for 3 min at 37 °C. The cells were washed and stained with MitoTracker (200 nM) in HBSS for 20 min at 4 °C. The cells were washed and blocked in 1% BSA in PBS for 30 min at room temperature, incubated with the anti-αvβ3 antibody for 1 h at 4 °C, and incubated with an anti-mouse IgG antibody and Hoechst (1 μg/mL) for 30 min at 4 °C. The stained cells were plated on poly L-lysine-coated 8-well chamber plates, and images were taken using a Nikon Eclipse C2 confocal microscope (Nikon).
MitoTracker signal intensity per cell was measured using ImageJ (NIH).
Viability assay
All cells used in this assay were transduced with luciferase lentivirus (Addgene, 17477). Cells with equivalent luciferase activity levels were used as the controls. At the end of the indicated incubation period, cells were subjected to 1:1 Steady-Glo (Promega, E2510) and incubated for 15 min before reading luminescence using Infinite 200 (TECAN).
Sphere formation assay
After exposure to the indicated stress for 96 h, the cells were washed with HBSS and incubated with Accutase (Sigma, SCR005) for 3 min at 37 °C to create a single-cell suspension. Then, 1 mL of methylcellulose stock media was added (R&D Systems, HSC001) to a 24-well non-treated plate. Then, 1 mL of the indicated media containing 4000 cells were added. After 14 days, images of tumor colonies were captured and quantified using ImageJ (NIH).
RNA-sequencing (RNA-seq)
RNA samples from LLC cells with and without ectopic integrin β3 expression incubated in suspension in 5% charcoal stripped FBS RPMI were submitted to Novogene for RNA-sequencing. RNA was extracted using the RNeasy RNA Purification Kit (Qiagen, 74104), following the manufacturer’s instructions. A total of 1 μg of RNA per sample was used to generate RNA-seq libraries using the NEBNext Ultra II RNA Library Prep Kit (NEB, E7770) following the manufacturer’s protocol. Libraries were sequenced using the Illumina NovaSeq platform, according to the manufacturer’s protocol. Paired-end reads were aligned to the mouse genome (GRCm38/mm10) using STAR 2.7.10b package. Aligned reads were subsequently counted using the subread feature counts package. Differentially expressed genes (DEGs) were identified using R package DESeq2 (v.1.28.0). Benjamini and Hochberg corrections were used to calculate the adjusted P values (p.adj) for DEGs. Gene ontology analysis was performed using the Gene Set Enrichment Analysis (GSEA) platform.
Targeted metabolomics
Metabolites extracted from LLC cells with empty vector (+EV) and ectopic integrin β3 (+β3) incubated in suspension in 5% charcoal stripped FBS RPMI were subjected to targeted metabolomics at UCSD Biochemical Genetics and Metabolomics Laboratory (n=5 per group). Negative and positive ionization panels and intracellular panels were run. Fold changes in metabolites in LLC+β3 vs. LLC+EV were analyzed.
Glutamate measurements
Lung cancer cells were pre-incubated under the indicated conditions in suspension. The cells were collected and washed with phosphate-buffered saline (PBS). Intracellular glutamate concentrations were measured using a Glutamine/Glutamate-Glo Assay kit (Promega, J7021) following the manufacturer’s instructions.
Oxygen consumption rate (OCR) measurements
OCR was measured using an XF24 Seahorse Biosciences Extracellular Flux Analyzer (Seahorse Bioscience, Billerica, MA) as previously described (14). Briefly, after the indicated incubation in suspension, the cells were seeded in XF24-well plates (40,000 cells/well) for 2 h before the assay. The XF-24 sensor cartridge was hydrated overnight at 37 °C with 1 ml calibration buffer per well. The sensor cartridge was loaded with assay media (ports A, B, and C) to measure the basal OCR or with oligomycin (1 μM, port A), carbonyl cyanide 4-(trifluoromethoxy) phenylhydrazone (FCCP, 0.5 μM, port B), and rotenone (1 μM, port C) to measure the bioenergetic profile. OCR and extracellular acidification rate (ECAR) were measured under basal conditions.
Mouse study approval
All experiments involving mice were conducted under protocol S05018, approved by the UC San Diego Institutional Animal Care and Use Committee. All experiments were performed in accordance with the NIH Guide for the Care and Use of Laboratory Animals.
Lung orthotopic xenograft model
HCC827 cells with and without integrin β3 ectopic expression (5 × 10⁶ cells in 50 μL of PBS) were injected into the lungs of athymic nude mice (8–10-week-old) from the Charles River. Three months after the injection, the lungs with tumors were fixed in 10% formalin.
The indicated numbers of luciferase-expressing H1975 cells with and without integrin β3 knockout (in 50 μL of PBS) were injected into the lungs of athymic nude mice (8–10-week-old). The mice were injected with the vehicle or an OXPHOS inhibitor, IACS-10759 (5 mg/kg, 5 days on/2 days off, oral gavage, 100 μL/injection, 1.25 mg/mL in 0.5% methylcellulose in water). Tumor uptake and growth were monitored using the IVIS Spectrum (Revvity). The number of tumor-initiating cells per 10 million cells for each group was calculated using ELDA software (15).
Allograft model
LLC cells with and without integrin β3 ectopic expression (1 × 10⁶ cells in 100 μL of PBS) were injected subcutaneously into the flanks of C57BL/6 mice (8–10-week-old) from Charles River. Tumor uptake was monitored.
STATISTICAL ANALYSIS
Student’s t-test, one-sample t-test, or ANOVA was performed to compare independent sample groups. Excel (Microsoft), Prism (GraphPad), and SPSS (IBM Analytics) were used for analysis.
DATA AVAILABILITY
The RNA-seq data generated in this study are publicly available in Sequence Read Archive (SRA) at PRJNA1074809. All other raw data generated in this study are available upon request from the corresponding authors.
Results
NSCLC cells upregulate integrin αvβ3 to overcome nutrient stress
Integrin αvβ3 is a marker and driver of tumor initiation and drug resistance of NSCLC cells (3). Given that integrins sense microenvironmental changes, we investigated whether αvβ3 expression could be induced by nutrient stress. Subjecting cells in suspension to either low glucose or serum deprivation increased the mRNA expression of ITGB3 and, to a lesser extent, ITGB6 and ITGA5 integrin subunits previously linked to epithelial-to-mesenchymal transition (EMT, Fig. 1A and S1A) (7,16). We further confirmed that exposing cells to nutrient stress induced a time-dependent increase in integrin β3 protein, as detected by immunoblotting (Fig. 1B and S1B), and that cell surface expression of the integrin αvβ3 heterodimer following nutrient stress could be detected by flow cytometry at levels comparable to those observed in NSCLC cells with endogenous αvβ3 expression (Fig. 1C and S1C). Since the αv subunit is widely expressed, presence of the αvβ3 heterodimer is dictated by expression of β3 subunit (17,18). To assess whether nutrient stress upregulates integrin β3 expression in living human lung cancer tissues, we prepared thick sections from fresh lung cancer biopsies and exposed them to nutrient stress ex vivo (12). These living tissues were challenged with glucose deprivation and analyzed for integrin β3 expression by immunohistochemistry. Consistent with our observations in established human NSCLC cells, integrin β3 expression was elevated in patient tissues deprived of glucose relative to tissues maintained at normal glucose levels (Fig. 1D), indicating that cells within a living human tumor respond to nutrient stress by upregulating αvβ3 expression.
Fig. 1: NSCLC cells upregulate integrin αvβ3 to overcome nutrient stress.
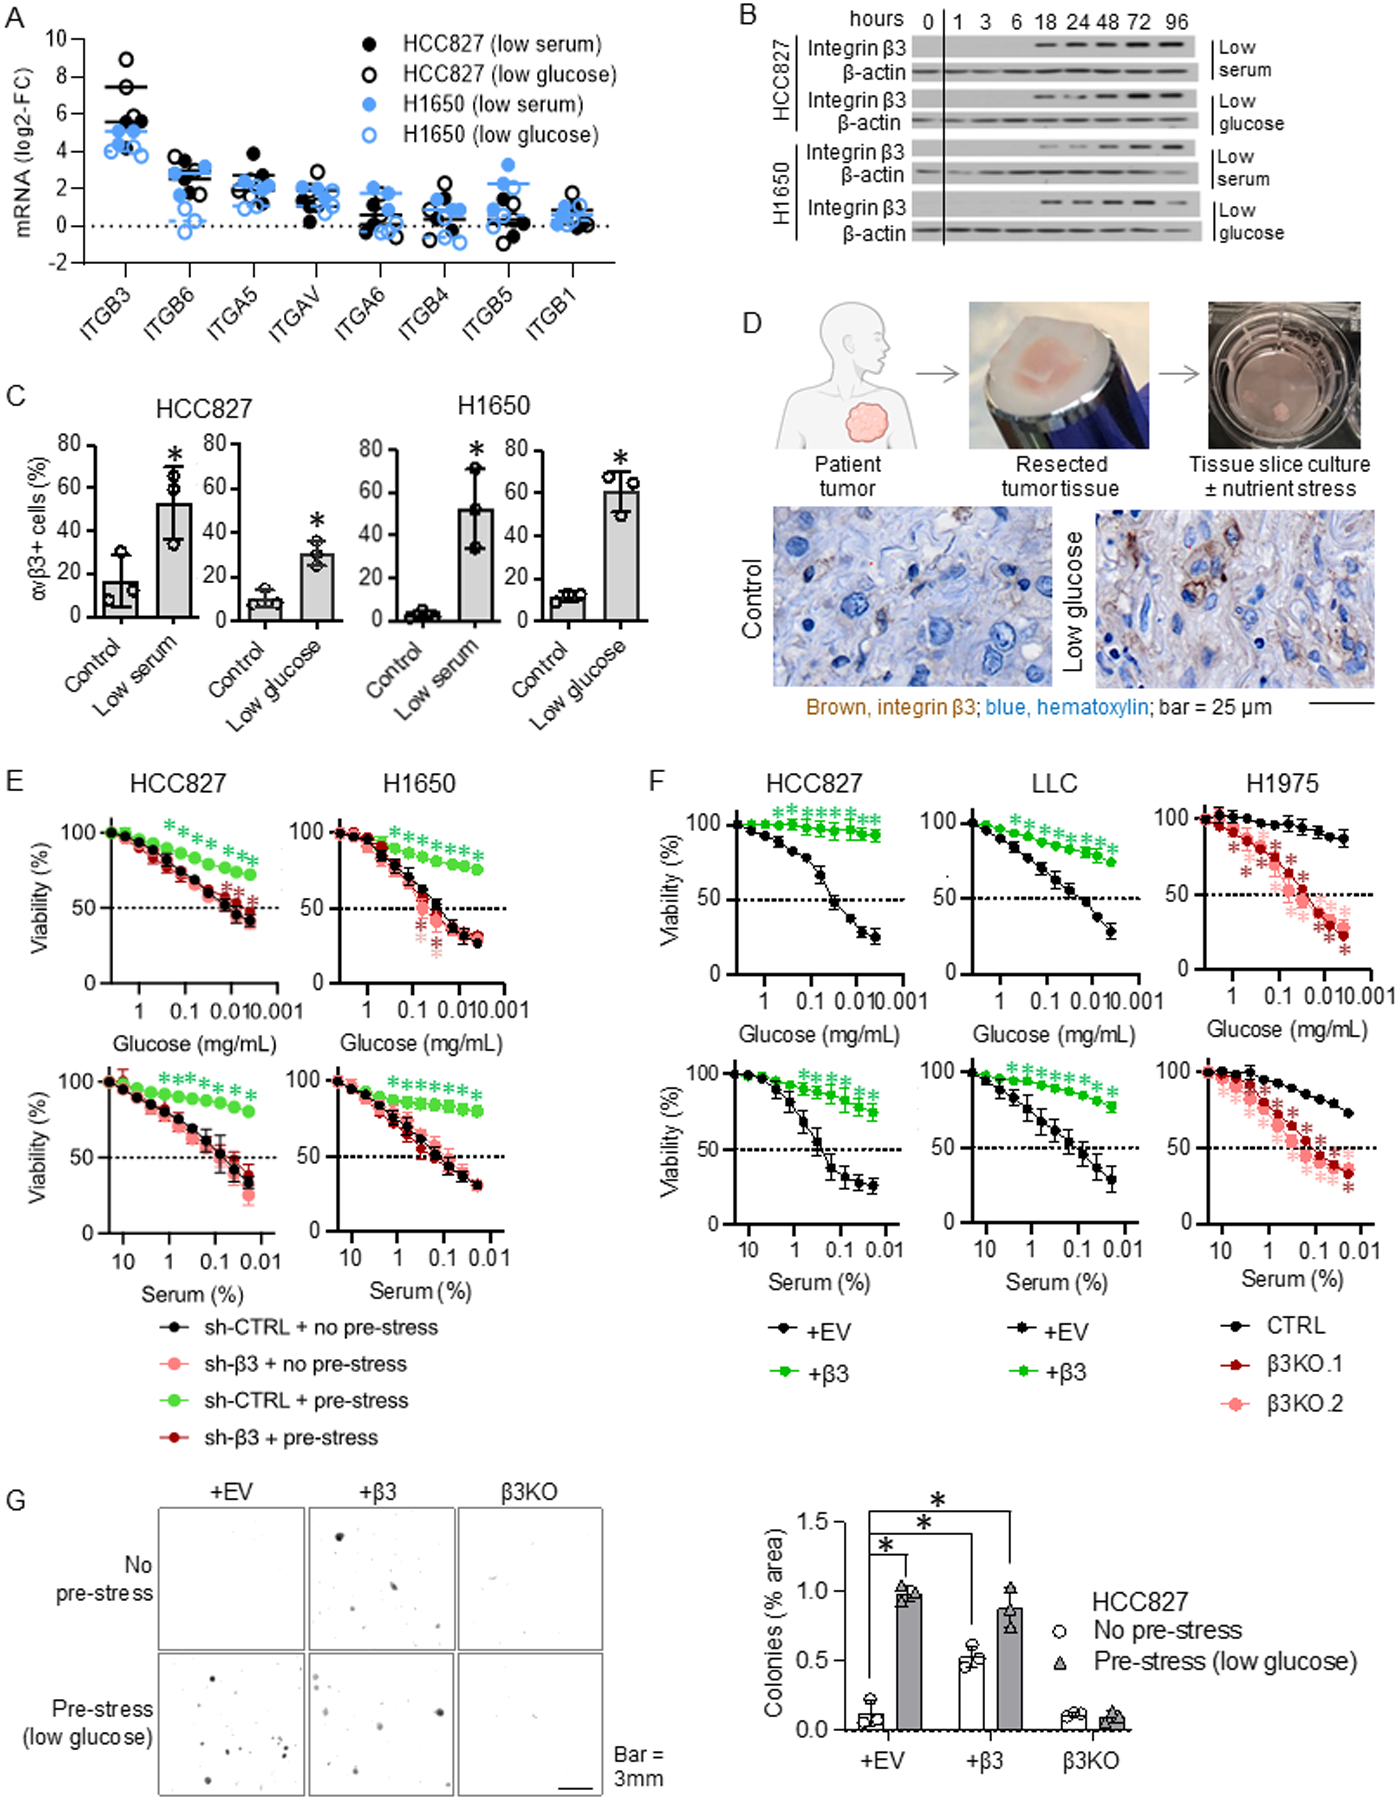
A. HCC827 and H1650 cells were incubated in 10% serum and 2.2 mg/mL glucose (control), 0.5 mg/mL glucose (low glucose), or 0.5% serum (low serum) media for 96 hours. Fold changes comparing to the control group for each integrin subunit are shown. Each dot indicates a biological replicate. The p-values are shown in Fig. S1A. n = 3 technical replicates from 3 biological replicates for each group.
B. HCC827 and H1650 cells were grown in media containing 10% serum and 2.2 mg/mL glucose (timepoint zero), switched to that containing 0.5% serum (low serum) or 0.5 mg/mL glucose (low glucose), and then extracts were collected at the timepoints indicated 1–96 hours later. Integrin β3 protein levels are shown. The blots are representative of three biological replicates.
C. HCC827 and H1650 cells were incubated in 10% serum and 2.2 mg/mL glucose (control), 0.5% serum (low serum), or 0.5 mg/mL glucose (low glucose) media for 96 hours. Surface integrin αvβ3 was detected using flow cytometry. % αvβ3-positive cells were calculated for each group. *P<0.05, compared to the control using the Student’s t-test. Error bars indicate the standard deviations of three biological replicates. n = 3 technical replicates from 3 biological replicates for each group.
D. Patient lung cancer tissue slices were cultured ex vivo in 2.2 mg/mL glucose (control) or 0.5 mg/mL glucose (low-glucose) media for 96 h. Representative images of integrin β3 immunohistochemical staining are shown (N=3 per group).
E. HCC827 and H1650 cells with and without integrin β3 knockdown (sh-β3 and sh-CTRL, respectively) were incubated in 2.2 mg/mL glucose (no pre-stress) or 0.5 mg/mL glucose (pre-low glucose) media for 72 hours. The cells were then incubated in media containing the indicated concentrations of glucose and serum for 24 h. The cell viability was measured at the end of the incubation period. *P<0.05, compared with sh-CTRL+no pre-stress using ANOVA. Error bars indicate the standard deviations of three biological replicates. n = 3 technical replicates from 3 biological replicates for each group.
F. HCC827 and LLC cells with and without ectopic integrin β3 (+β3 and +EV, respectively) and H1975 (endogenous β3 positive) cells with and without integrin β3 knockout (β3KO and CTRL, respectively) were incubated with the indicated concentrations of glucose or serum for 24 h. The cell viability was measured at the end of the incubation period. *P<0.05, compared with +EV or CTRL using ANOVA. Error bars indicate the standard deviations of three biological replicates. n = 3 technical replicates from 3 biological replicates for each group.
G. HCC827 cells with ectopic integrin β3 (+β3), β3 knockout (β3KO), or no modification (+EV) were incubated in 2.2 mg/mL glucose (no pre-stress) or 0.5 mg/mL glucose (pre-stress) for 72 hours. The cells were incubated with methylcellulose for 14 days. % area of tumor colonies was measured. *P<0.05, compared to +EV with no pre-stress, using ANOVA. Error bars indicate the standard deviations of three biological replicates. n = 3 technical replicates from 3 biological replicates for each group.
To assess whether the nutrient stress-induced gain of integrin αvβ3 represents an adaptive response to mitigate nutrient stress, αvβ3-negative NSCLC cells were subjected to normal glucose vs. low glucose (pre-stress) in suspension, and cell viability was measured after 24-hour challenge with decreasing concentrations of glucose or serum. Cells lacking endogenous β3 expression that were not pre-stressed showed a significant loss of viability with decreasing concentrations of glucose or serum (Fig. 1E and S1D). In contrast, pre-stressed cells expressing scramble control shRNA showed only a moderate decrease in viability due to serum or glucose depletion, whereas cells expressing β3 shRNA, which prevented its upregulation during the pre-stress period, were as sensitive to nutrient stress as cells that were not subjected to pre-stress (Fig. 1E). These results demonstrate that cancer cells upregulate integrin αvβ3 as an adaptive response to overcome the effects of stress. Ectopic integrin β3 expression rescued the inherent “stress sensitivity” of αvβ3-negative cells, while β3 knockout compromised the inherent “stress tolerance” of αvβ3-positive cells, when evaluated using either cell viability (Fig. 1F and S1E) or spheroid formation assays (Fig. 1G). These findings demonstrate that the ability of cancer cells to upregulate integrin β3 in response to nutrient stress allows them to convert to a stress tolerant state.
Integrin αvβ3 mitigates nutrient stress by shifting cellular metabolic phenotype from glycolysis to glutamine metabolism/ tricarboxylic acid (TCA) cycle/OXPHOS.
The ability to tolerate the effects of serum or glucose deprivation indicates that integrin β3 may provide tumor cells with metabolic flexibility. Thus, we investigated whether one or more metabolic pathways were reprogrammed in response to integrin β3 expression using combined transcriptomics and targeted metabolomics in NSCLC cells with and without integrin β3 knockin. Targeted metabolomic analysis linked integrin β3 expression to a significant increase in TCA cycle metabolites and glutamine metabolism, while producing a concomitant decrease in purine metabolism, fatty acid metabolism, glycolysis/PPP, and pyrimidine metabolism pathways (Fig. 2A–B). Consistent with the metabolomics data, gene set enrichment analysis of RNA sequencing data identified OXPHOS as the most significantly enriched energy metabolism pathway linked to integrin β3 expression (Fig. 2C), with increased expression of multiple OXPHOS complex subunits (Fig. 2B and S2). Furthermore, supporting the metabolomics data, ectopic expression of integrin β3 or nutrient stress (low glucose) inducing β3 expression increased the levels of cellular glutamate, a major carbon source for the TCA cycle (Fig. 2D). These results indicate that integrin β3 expression facilitates compensation for limited access to nutrients such as glucose or fatty acids contained in serum by providing cells with an alternative carbon source, glutamine metabolism, to drive the TCA cycle and promote OXPHOS.
Fig. 2: Integrin β3 mitigates nutrient stress by shifting cellular metabolic phenotype from glycolysis to glutamine metabolism/TCA cycle/oxidative phosphorylation (OXPHOS).

A. The table shows pathways with multiple metabolites that were significantly increased or decreased in integrin β3+ cells. Tricarboxylic acid cycle; TCA, pentose phosphate pathway; PPP, guanosine monophosphate; GMP, uridine monophosphate; UMP, cytidine monophosphate; CMP. Metabolites in red: increased; metabolites in blue: decreased in β3+ cells.
B. The top 10 enriched pathways in LLC cells with ectopic integrin β3 vs. empty vector are shown (sorted by FDR q-values). Normalized enrichment score (NES).
C. Pathway map showing upregulated or downregulated metabolic pathways Red, increased; blue, decreased; squares, metabolites; circles, enzymes. Heat map of the OXPHOS genes in the comparison of LLC cells with ectopic integrin β3 (β3+) vs. empty vector (+EV).
D. Glutamate levels in LLC cells with and without ectopic integrin β3 (+β3 and +EV, respectively) or HCC827 exposed to low serum (0.5%) for 96 h were measured.
Next, we tested whether integrin β3 was necessary and/or sufficient to account for the upregulation of OXPHOS in NSCLC cells. Indeed, ectopic expression of integrin β3 in NSCLC cells not only increased the expression of OXPHOS complexes I-V (Fig. 3A and S3A), but also indicators of OXPHOS function, including basal respiration, ATP production, and maximal respiration rates, measured using a Seahorse XF cell metabolic analysis (Fig. 3B, S3B). Accordingly, the knockout or knockdown of endogenous β3 expression in αvβ3-positive NSCLC cells had the opposite effect (Fig. 3A–B). Furthermore, mitochondrial mass and membrane potential, evaluated using the mitochondrial probe MitoTracker, were increased in αvβ3-positive cells compared to those in αvβ3-negative cells (Fig. 3C). These findings indicate that upregulation of integrin αvβ3 in response to nutrient stress is necessary and sufficient to increase the expression of OXPHOS complex proteins. Given that this metabolic shift was seen in both KRAS mutant lung cancer cells (LLC and H1792) and human EGFR mutant lung cancer cells (HCC827 and H1975), the activation of OXPHOS by integrin αvβ3 appears to be independent of the primary mutation (EGFR vs. KRAS) and occurs in murine and human tumors.
Fig. 3: Integrin αvβ3 mitigates nutrient stress by shifting cellular metabolic phenotype from glycolysis to OXPHOS.

A. Protein levels of integrin β3 and OXPHOS complex l-V in HCC827 and LLC cells with and without ectopic integrin β3 (+β3 and +EV, respectively), H1975 (endogenous β3 positive) cells with and without integrin β3 knockout (β3KO and CTRL, respectively), and H1792 (endogenous β3 positive) cells with and without doxycycline-inducible integrin β3 knockdown (sh-β3 and sh-CTRL, respectively) are shown. Cells were subjected to 1μg/mL doxycycline 3 days prior to the start of the experiment and during the experiment. The blots are representative of three biological replicates.
B. The OCR of HCC827+EV and +β3 and H1975 cells with and without β3 knockout are shown. *P<0.05, compared to +EV or CTRL using the Student’s t-test. Error bars indicate the standard deviation of three technical replicates.
C. Representative immunofluorescence images of HCC827+EV and +β3 and H1975 cells with and without β3 knockout are shown. The graphs indicate the average corrected total cell fluorescence (CTCF) for the MitoTracker signal per cell for each group (+EV, n=105; +β3, n=116; CTRL, n=80; β3KO.1, n=101; β3KO.2, n=103). *P<0.05, compared with EV or CTRL using Student’s t-test.
D. HCC827 cells with and without ectopic integrin β3 (+β3 and +EV, respectively) and H1975 (endogenous β3 positive) cells with and without integrin β3 knockout (β3KO and CTRL, respectively) were incubated with the indicated concentrations of glucose with or without an OXPHOS inhibitor, IACS-10759 (10 nM), for 24 h. The cell viability was measured at the end of the incubation period. *P<0.05, compared with +EV or CTRL using ANOVA. Error bars indicate the standard deviations of three biological replicates. n = 3 technical replicates from 3 biological replicates for each group.
E. HCC827 cells were incubated in 10% FBS and 2.2 mg/mL glucose media (CTRL), 0.5 mg/mL glucose media (low glucose), or 0.5% FBS media (low serum) for 24 h. Representative immunofluorescence images of the cells are shown. The graph indicates the average CTCF for the MitoTracker signal per cell for each group (CTRL, n=58; low glucose, n = 60; low serum, n = 68). *P<0.05, compared to CTRL using the Student’s t-test.
F. HCC827 and H1650 cells with and without doxycycline inducible integrin β3 knockdown (sh-β3 and sh-CTRL respectively) were incubated in 10% FBS and 2.2 mg/mL glucose media (–), 0.5 mg/mL glucose media (low glucose), or 0.5 % FBS media (low serum) for 96 hours. Cells were incubated in 1 μg/mL doxycycline three days prior to the start of the experiment and during the experiment. The blots are representative of three biological replicates.
G. HCC827 and H1650 cells with and without doxycycline inducible integrin β3 knockdown (sh-β3 and sh-CTRL, respectively) were incubated in 10% FBS and 2.2 mg/mL glucose media (–), 0.5 mg/mL glucose media (low glucose), or 0.5 % FBS media (low serum) for 96 hours before OCR measurement. Cells were treated with 1 μg/mL doxycycline three days prior to the start of the experiment and during the experiment. *P<0.05, compared with sh-CTRL+ no stress using ANOVA. Error bars indicate the standard deviations of three technical replicates.
Supporting these results, pharmacological inhibition of OXPHOS in αvβ3-positive cells re-sensitized them to glucose depletion in suspension (Fig. 3D), indicating that the upregulation of integrin αvβ3 induced by nutrient stress promotes stress tolerance through its capacity to activate OXPHOS. Nutrient stress not only increased the MitoTracker signal (Fig. 3E), but also upregulated the expression of OXPHOS complex proteins (Fig. 3F and S3C). Stress-induced gain of integrin αvβ3 was required for this metabolic adaptation, as β3 knockdown prevented the gain of OXPHOS complex proteins (Fig. 3F) and OXPHOS activity (Fig. 3G and S3D) in NSCLC cells challenged with low glucose or low serum. Together, these findings demonstrate that endogenous or stress-induced integrin αvβ3 expression switches cellular metabolic dependencies to mitochondrial respiration by increasing the expression of OXPHOS complex proteins, revealing an adaptive stress response pathway that tumor cells can utilize to mitigate the effects of nutrient deprivation.
Evidence linking integrin αvβ3 and OXPHOS in human NSCLC surgical biopsies and mouse models
Consistent with the in vitro findings, serial sections of patient NSCLC tissues showed a positive correlation between the expression of integrin β3 and the OXPHOS complex V protein, ATP synthase B1 (Fig. 4A), and mice bearing human NSCLC xenografts with ectopic expression of integrin β3 showed increased ATP synthase B1 expression relative to xenografts lacking β3 (Fig. 4B). Moreover, fresh lung cancer patient biopsies maintained in culture for up to nine days and challenged with low-glucose media displayed increased integrin β3 expression and MitoTracker staining (indicating mitochondrial mass and activity) compared to the tissues incubated in growth media containing normal glucose levels (Fig. 4C). These findings provide evidence linking integrin αvβ3 expression and enhanced OXPHOS metabolism in intact human or mouse tumor tissues.
Fig. 4: Evidence linking integrin β3 and OXPHOS in human NSCLC and mouse models.

A. Serial sections of the human lung cancer tissue array slides were stained for integrin β3 and ATP synthase B1. Blue, hematoxylin, brown, integrin β3, and ATP synthase B1. The graph indicates the averages of ATP synthase B1 scores (0–4 high) for integrin β3 negative (β3-) and positive (β3+) tissues. *P<0.05, Student’s t-test. Error bars indicate standard error. The images show representatives of the same areas for integrin β3 and ATP synthase B1 staining.
B. Orthotopic xenografts of HCC827 cells, with and without ectopic integrin β3 expression (+β3, n = 4 and +EV, n = 7, respectively), were stained for ATP synthase B1. Blue: hematoxylin; brown: ATP synthase; B1. The graph shows the average percentage of the ATP synthase B1 positive area. *P<0.05, Student’s t-test. Error bars indicate standard error.
C. Patient lung cancer tissue slices were cultured ex vivo in 2.2 mg/mL glucose (control) or 0.5 mg/mL glucose (low glucose) media for 96 h. Representative images of integrin β3 immunohistochemical staining are shown (left panel, N=3 per group). Representative images of MitoTracker staining are shown (right panel, N=3 per group).
D. A tumor initiation assay was performed using an orthotopic H1975 lung cancer xenograft model. The mice were divided into three groups:1) H1975 CTRL, vehicle (CTRL); 2) H1975 CTRL, OXPHOS inhibitor, IACS-10759 (OXPHOS inhibitor); and 3) H1975 β3 knockout (β3KO). The left graph shows the percentage of tumor uptake, and the right graph shows the number of tumor-initiating cells per 10 million cells for each group. *P<0.05, compared with CTRL. Error bars indicate 95% confidence interval.
E. A tumor initiation assay was performed using a subcutaneous LLC mouse lung cancer allograft model. The mice were divided into two groups:1) control (integrin β3 negative) and 2) +β3 (integrin β3 positive). The graph shows the number of tumor-initiating cells per 10 million cells in each group. *P<0.05, compared with the control. Error bars indicate 95% confidence interval.
We previously established that tumor cells undergoing tumor initiation can overcome isolation stress and limitations in nutrients and oxygen (19). To evaluate whether tumor initiation was associated with the activation of OXPHOS in an αvβ3-dependent manner, tumor cells with endogenous αvβ3 expression were implanted orthotopically into the mouse lungs under limiting dilution conditions to impose isolation stress. While implantation of 0.2M - 5M cells initiated detectable lung tumors in most control mice, systemic treatment with an OXPHOS inhibitor impaired tumor initiation, with a larger effect as fewer cells were injected (Fig. 4D). Furthermore, knockin of integrin β3, which induced metabolic reprogramming (Fig. 2C), was sufficient to increase tumor initiation capacity in mouse LLC cells (Fig. 4E). These findings indicate that αvβ3-positive NSCLC cells depend on OXPHOS to mitigate the isolation stress encountered during tumor initiation in vivo. Indeed, the knockout of endogenous β3 expression completely prevented tumor initiation for all cell numbers injected (Fig. 4D), further demonstrating the critical role of integrin αvβ3 in this process.
Integrin αvβ3 promotes Src-dependent sustained AMPK activation
Next, we examined the mechanisms by which integrin β3 enhances OXPHOS. Since cellular stress leads to the activation of the stress sensor, AMP-activated protein kinase (AMPK), which enables cells to undergo metabolic adaptation (20), we considered whether integrin β3 expression could lead to AMPK activation. When integrin β3-negative NSCLC cells were challenged with low glucose or low serum, AMPK was first activated (indicated by phosphorylation at T172) before integrin β3 expression was detected (Fig. 5A and S4A). However, AMPK activation appeared in a biphasic manner, showing immediate/transient activity followed by a second sustained wave (Fig. 5A and S4A). Interestingly, integrin β3 expression was observed 18 h following stress, which immediately preceded the second wave of AMPK activation, which was sustained from 24–96 hour (Fig. 5A and S4A). Importantly, cells expressing ectopic αvβ3 in the absence of stress displayed increased phospho-AMPK levels compared with cells lacking αvβ3 (Fig. 5B and S4B). These findings indicate that although stress-induced integrin β3 expression does not induce immediate AMPK activity, it is sufficient to sustain AMPK activation.
Fig. 5: Integrin αvβ3 promotes PGC1α nuclear localization via Src-dependent sustained AMPK activation.

A. HCC827 cells were incubated in 0.5% FBS media in suspension for the indicated hours. The blots are representative of three biological replicates.
B. HCC827 cells (+EV) or HCC827 cells with full length integrin β3 (+β3), chimeric integrin β3 (+β3/β1), mutant β3 (+β3–759X), or β3 knockout (β3KO), H1975 cells (CTRL), and H1975 cells with β3 knockout (β3KO) were incubated in 10% FBS and 2.2 mg/mL glucose media in suspension. The blots are representative of three biological replicates.
C. HCC827 and H1650 cells with and without doxycycline inducible integrin β3 knockdown (sh-β3 and sh-CTRL, respectively) were incubated in 10% FBS and 2.2 mg/mL glucose media (–), 0.5 mg/mL glucose media (low glucose), or 0.5 % FBS media (low serum) for 96 hours. Cells were treated with 1 μg/mL doxycycline three days prior to the start of the experiment and during the experiment. The blots are representative of three biological replicates.
D. HCC827 cells (+EV) or HCC827 cells with full-length integrin β3 (+β3), chimeric integrin β3 (+β3/β1), mutant β3 (+β3–759X), or β3 knockout (β3KO) were incubated in media with the indicated concentrations of glucose or serum for 24 h. The cell viability was measured at the end of the incubation period. *P<0.05, compared to +EV, using ANOVA. Error bars indicate the standard deviations of three biological replicates. n = 3 technical replicates from 3 biological replicates for each group.
E. HCC827 cells (+EV) or HCC827 cells with full length integrin β3 (+β3), chimeric integrin β3 (+β3/β1), mutant β3 (+β3–759X), or β3 knockout (β3KO) were exposed to no stress (control) or 0.5 mg/mL glucose (pre-stress) for 72 hours on poly-HEMA coated plates. These cells were subjected to either an AMPK inhibitor, dorsomorphin (0.25 μM), or an AMPK stimulator, AICAR (0.1 mM), for an additional 24 h. The cells were dissociated into a single suspension and seeded in methylcellulose for 14 days. The images are representative of three biological replicates. The graph depicts the average number of colonies. *P<0.05, compared with +EV, control. Error bars indicate the standard deviations of three biological replicates. n = 3 technical replicates from 3 biological replicates for each group.
F. LKB1 and/or CAMKK2 were knocked down in HCC827+β3 cells using 20 nM each siRNA, 72 h post-transfection. The images are representative of three biological replicates. The graph shows band densitometry with each dot corresponding to a biological replicate.
G. HCC827+EV and +β3 cells were incubated with an AMPK inhibitor, dorsomorphin (0.25 μM), for the indicated hours (left panel). HCC827 cells were incubated in 10% FBS (–) or 0.5% FBS media (low serum) for 96 hours then with the indicated concentrations of dorsomorphin for 24 h. HCC827+β3 cells were transfected with si-CTRL or si-AMPK-α1/2 (60 nM total) for 72 hours. The blots are representative of three biological replicates.
H. HCC827 and H1975 cells were incubated in media containing 10% FBS or 0.5% FBS (low serum) for 96 h then with the indicated concentrations of the Src inhibitor saracatinib for 24 h. The blots are representative of three biological replicates.
I. HCC827+β3 and H1975 cells were pre-incubated in suspension for 72 h and then incubated with DMSO (vehicle), dorsomorphin (0.25 μM), or the PGC1α inhibitor SR-18292 (10 μM) at the indicated concentrations of glucose for 24 h. The cell viability was measured at the end of the incubation period. *P<0.05, compared to vehicle using ANOVA. Error bars indicate the standard deviations of three biological replicates. n = 3 technical replicates from 3 biological replicates for each group.
J. HCC827 and H1975 β3KO cells were pre-incubated in suspension for 72 h and then incubated with DMSO (vehicle), an AMPK stimulator, AICAR (0.1 mM), or PGC1α stimulator, ZLN005 (5 μM), at the indicated concentrations of glucose for 24 h. The cell viability was measured at the end of the incubation period. *P<0.05, compared to vehicle using ANOVA. Error bars indicate the standard deviations of three biological replicates. n = 3 technical replicates from 3 biological replicates for each group.
PGC1α is a master regulator of mitochondrial biogenesis that can be activated by various kinases, including AMPK (21). When integrin β3-negative NSCLC cells were challenged with low glucose or serum for 96 h, the emergence of integrin β3 expression and subsequent phosphorylation of AMPK led to nuclear localization (i.e., activation) of PGC1α (Fig. 5C and S4C). Remarkably, the activation of AMPK and PGC1α was abolished by integrin β3 knockdown, demonstrating that integrin β3 is necessary for the sustained activation of the AMPK/PGC1α axis when cells sense glucose or serum deprivation (Fig. 5C and S4C). Accordingly, AMPK and PGC1α activities were stimulated by ectopic β3 expression and suppressed by the knockout of endogenous β3 expression (Fig. 5B and S4B).
The integrin β3 subunit contains an intracellular C-terminal domain that can recruit and activate Src. Therefore, we assessed whether the C-terminal signaling domain of integrin β3 is required for sustained activation of AMPK/PGC1α by expressing a β3/β1 chimeric integrin subunit (comprising the β3 ectodomain fused to the β1 intracellular domain) in NSCLC cells. While expression of wild type β3 resulted in AMPK/PGC1α activation, the β3/β1 chimera failed to do so (Fig. 5B, S4B, and S4D), implicating the β3 cytoplasmic domain as a key component required for metabolic reprogramming. To further understand how integrin β3 signaling might influence this metabolic pathway, we created NSCLC cells expressing a β3 mutant (β3–759X) lacking the terminal four amino acids, a region we and others have established is specifically required for β3-mediated recruitment/activation of Src kinase in the absence of integrin ligation (Fig. S4E) (9,22,23). Accordingly, we show here that lung cancer cells with this β3 mutation were incapable of activating Src, failed to undergo sustained AMPK/PGC1α activation, and did not display OXPHOS complex protein expression (Fig. 5B, S4B, and S4D) (24). Furthermore, glucose or serum deprivation decreased the viability (Fig. 5D and S4F) and sphere-forming ability (Fig. 5E) of NSCLC cells expressing the β3/β1 chimera, mutant β3 (β3–759X), or β3 knockout, while ectopic expression of full-length wild-type integrin β3 rescued the cells. These findings suggest that the β3/Src signaling axis is both necessary and sufficient to provide NSCLC cells with the ability to switch their metabolic function to OXPHOS, allowing them to overcome nutrient deprivation. Importantly, knockdown of liver kinase B1 (LKB1) or calcium/calmodulin dependent protein kinase kinase 2 (CAMKK2) attenuated integrin β3-mediated phosphorylation of AMPK only partially, while dual knockdown of LKB1 and CAMKK2 completely attenuated AMPK phosphorylation by integrin β3 (Fig. 5F), indicating that both LKB1 and CAMKK2 contribute to AMPK activation downstream from β3/Src.
Finally, we utilized pharmacological inhibitors as a complementary approach to determine the role of the β3/Src/AMPK signaling axis in the sustained activation of OXPHOS when cells sense nutrient depletion. Indeed, the activation of this mitochondrial stress tolerance signaling cascade by nutrient stress or endogenous integrin β3 expression was prevented by treatment with pharmacological inhibitors of AMPK or Src (Fig. 5G–H, S4G–I). Supporting these data, knockdown of AMPK-α1/2 attenuated expression of OXPHOS complex proteins (Fig. 5G and S4G). Accordingly, the ability of ectopic β3 expression to promote stress tolerance could be “negated” by an AMPK inhibitor, while the inability of the β3/β1 chimera, the β3–759X mutant, or β3KO/knockdown to promote stress tolerance could be “rescued” by an AMPK stimulator (Fig. 5E). In terms of biological function, treating αvβ3-positive cells with inhibitors of AMPK or PGC1α negated their ability to withstand glucose deprivation (Fig. 5I), whereas treating αvβ3-negative cells with stimulators of AMPK or PGC1α could promote nutrient stress tolerance in the absence of αvβ3 (Fig. 5J and S4J).
Discussion
Nutrient stress is a significant obstacle that cancer cells must overcome to undergo tumor initiation and progression (25,26). Cancer stem/tumor-initiating cells are known to express activated OXPHOS for survival by coping with reduced nutrients and an increased energy demand (27,28). How cancer stem/tumor-initiating cells respond to nutrient stress by inducing OXPHOS remains unclear. Integrin avβ3 is a marker/driver of cancer stem/tumor-initiating cells in various epithelial cancers (3,9,29). This integrin is typically absent in normal healthy tissues but is transiently upregulated during wound repair/remodeling and cancer progression, where it has been linked to angiogenesis, tumor drug resistance, tumor cell initiation and metastasis (3,30,31). Using NSCLC fresh biopsy tissues from patients as well as cultured cells, we detected stress-induced expression of integrin αvβ3 on the cell surface as an adaptive response to overcome limited access to nutrients such as glucose or serum. Specifically, nutrient stress-induced integrin αvβ3 expression allowed cells to activate the glutamine pathway when other carbon sources (glucose and serum) for TCA cycle were limited, leading to enhanced OXPHOS activity for much needed energy production.
Counterintuitively to the function of an integrin as a mediator of adhesion to the ECM, we found that cell-matrix interactions are not critical for the metabolic flexibility provided by integrin αvβ3, as we observed the switch from glycolysis to OXPHOS when cells were in suspension under serum-deprived conditions or challenged during tumor initiation in vivo. However, in a previous study, integrin αvβ3 engagement with the ECM ligand osteopontin was reported to promote aerobic glycolysis in glioblastoma cells (32), providing an example where ligand-dependent integrin αvβ3 signaling can promote a distinct metabolism pathway (glycolysis) from ligand-independent αvβ3 signaling (OXPHOS).
In non-adherent cells, integrin αvβ3 is unique because of its ability to cluster on the cell surface and form signal-generating complexes (9,33). Typically, cell-matrix signals are transmitted from ECM ligands through integrins to focal adhesion kinase (FAK) to activate Src kinase, the integrin β3 cytoplasmic tail can directly recruit and activate Src in a “ligand-independent” manner (9). Interestingly, Src is known to activate the PI3K/Akt axis, which phosphorylates Ca2+/calmodulin-dependent protein kinase II (CAMKII), a direct upstream activator of AMPK(34,35). Src can also activate AMPK via phosphorylation of transforming growth factor-β (TGF-β)-activated kinase 1 (TAK1), which is immediately upstream of AMPK(36). Using a mutant β3 construct with a defective Src interaction site (β3–759X) and a chimeric construct consisting of the β3 extracellular domain fused to the β1 cytoplasmic tail (β3/β1), we demonstrate that the ability of β3 to activate Src is not required for not the initial activation but rather promotes the sustained activation of AMPK and subsequent upregulation of the electron transport chain proteins that enhance OXPHOS activity. While biphasic activation of AMPK has been reported in certain normal cells, such as skeletal muscle and pancreatic β-islet cells (37,38), to our knowledge, this is the first evidence of biphasic AMPK activation in cancer cells.
If gaining integrin β3 expression allows NSCLC cells to shift their metabolic phenotype toward OXPHOS to tolerate nutrient and isolation stress, targeting this metabolic dependency may provide an opportunity to prevent NSCLC from evading the stresses encountered during cancer progression. Accordingly, pharmacological inhibition of AMPK decreased the levels of OXPHOS complex proteins (Fig. 5G) and diminished the stress-tolerant phenotype of integrin αvβ3-positive cells (Fig. 5E). However, blocking AMPK could have significant effects on the metabolism of normal healthy cells. As such, our finding that the β3 c-terminus is necessary and sufficient to activate the Src/AMPK axis (Fig. 5B) may represent a more selective strategy to target the role of integrin αvβ3 in cancer progression without affecting OXPHOS activity in normal cells that do not express integrin αvβ3. Indeed, treatment of cells with a Src inhibitor attenuated AMPK activation in cells with endogenous β3 expression or that induced by nutrient stress (Fig. 5H).
In summary, the cancer stem/tumor-initiating cell marker, integrin αvβ3, expressed in response to nutrient stress promotes nutrient stress tolerance and tumor initiation that depends on sustained AMPK activation (Fig. 6). The upregulation of electron transport chain proteins provides tumor cells with metabolic flexibility to shift energy production to glutamine metabolism/TCA cycle/OXPHOS when nutrients are limited (Fig. 6). Although blocking this pathway using Src inhibitors may selectively prevent cancer stem/tumor-initiating cells from becoming resistant to nutrient deprivation, such drugs may have a heightened effect when administered in combination with strategies to manipulate nutrient access and/or therapeutics that increase integrin αvβ3 levels, such as EGFR inhibitors (3) and chemotherapeutics (39).
Fig. 6: Nutrient stress induced integrin αvβ3 expression activates the Src/AMPK/PGC1α axis upregulating OXPHOS to mitigate nutrient stress.

In the absence of stress, NSCLC cells primarily utilize glycolysis for energy metabolism. When cells are exposed to nutrient stress, integrin αvβ3 expression is upregulated and sustains AMPK phosphorylation via Src activation. This increases the expression of electron transport chain proteins that enhance the ability of cells to utilize oxidative phosphorylation (OXPHOS) for energy production. As a result, cells can proliferate and survive in nutrient-scarce environments. AMP-activated protein kinase, AMPK; peroxisome proliferator-activated receptor gamma coactivator 1-alpha, PGC1α.
Supplementary Material
Significance.
Upregulation of integrin αvβ3, a cancer stem cell marker, in response to nutrient stress activates sustained AMPK/PGC1α signaling that induces metabolic reprogramming in lung cancer cells to support their survival.
Acknowledgement
We thank Drs. Andrew Lowy and Jonathan Weitz (UC San Diego) for their consultation and expertise in tissue slice culture studies. Chinmayi Kashyap, Diva Sansanwal, Beatriz P. dos G. Peixoto, Rebecca Clague, and Tania Frank provided the technical assistance. This study was funded by T30FT083C (SJ), T32GM007752 (AN), T29FT0343 (CW), K01OD030513 (HIW), DD2204 (HIW), R01CA045726 (DAC), R35CA220512 (DAC), P30NS047101 (UC San Diego Microscopy Core), and P30CA23100 (UC San Diego Tissue Technology). Cody Fine, Mateo Espinoza, and Mitra Banihassan from the UCSD Human Embryonic Stem Cell Core Facility at the Sanford Consortium for Regenerative Medicine provided technical assistance for flow cytometry experiments. This work was made possible by a CIRM Major Facilities grant (FA1-00607) to the Sanford Consortium for Regenerative Medicine. Metabolomic analysis was performed by the UCSD Biochemical Genetics and Metabolomics Laboratory.
Abbreviation List
- AMPK
AMP-activated protein kinase
- OXPHOS
oxidative phosphorylation
- NSCLC
non-small cell lung cancer
- TCA
tricarboxylic acid
- PGC1α
peroxisome proliferator-activated receptor-γ coactivator 1-α
- LKB1
liver kinase B1
- CAMKK2
calcium/calmodulin dependent protein kinase kinase 2
- TAK1
transforming growth factor-β (TGF-β)-activated kinase 1
Footnotes
Conflict of interests
The authors declare no competing interests.
References
- 1.Shnaider PV, Ivanova OM, Malyants IK, Anufrieva KS, Semenov IA, Pavlyukov MS, et al. New Insights into Therapy-Induced Progression of Cancer. Int J Mol Sci 2020;21 [DOI] [PMC free article] [PubMed] [Google Scholar]
- 2.Senft D, Ronai ZA. Adaptive Stress Responses During Tumor Metastasis and Dormancy. Trends Cancer 2016;2:429–42 [DOI] [PubMed] [Google Scholar]
- 3.Seguin L, Kato S, Franovic A, Camargo MF, Lesperance J, Elliott KC, et al. An integrin β₃-KRAS-RalB complex drives tumour stemness and resistance to EGFR inhibition. Nat Cell Biol 2014;16:457–68 [DOI] [PMC free article] [PubMed] [Google Scholar]
- 4.Al Tameemi W, Dale TP, Al-Jumaily RMK, Forsyth NR. Hypoxia-Modified Cancer Cell Metabolism. Front Cell Dev Biol 2019;7:4. [DOI] [PMC free article] [PubMed] [Google Scholar]
- 5.Sullivan MR, Vander Heiden MG. Determinants of nutrient limitation in cancer. Crit Rev Biochem Mol Biol 2019;54:193–207 [DOI] [PMC free article] [PubMed] [Google Scholar]
- 6.Cantor JR, Sabatini DM. Cancer cell metabolism: one hallmark, many faces. Cancer Discov 2012;2:881–98 [DOI] [PMC free article] [PubMed] [Google Scholar]
- 7.Cooper J, Giancotti FG. Integrin Signaling in Cancer: Mechanotransduction, Stemness, Epithelial Plasticity, and Therapeutic Resistance. Cancer Cell 2019;35:347–67 [DOI] [PMC free article] [PubMed] [Google Scholar]
- 8.Aksorn N, Chanvorachote P. Integrin as a Molecular Target for Anti-cancer Approaches in Lung Cancer. Anticancer Res 2019;39:541–8 [DOI] [PubMed] [Google Scholar]
- 9.Desgrosellier JS, Barnes LA, Shields DJ, Huang M, Lau SK, Prevost N, et al. An integrin alpha(v)beta(3)-c-Src oncogenic unit promotes anchorage-independence and tumor progression. Nat Med 2009;15:1163–9 [DOI] [PMC free article] [PubMed] [Google Scholar]
- 10.Seguin L, Kato S, Franovic A, Camargo MF, Lesperance J, Elliott KC, et al. An integrin beta(3)-KRAS-RalB complex drives tumour stemness and resistance to EGFR inhibition. Nat Cell Biol 2014;16:457–68 [DOI] [PMC free article] [PubMed] [Google Scholar]
- 11.Seguin L, Kato S, Franovic A, Camargo MF, Lesperance J, Elliott KC, et al. An integrin beta(3)-KRAS-RalB complex drives tumour stemness and resistance to EGFR inhibition. Nature cell biology 2014;16:457–68 [DOI] [PMC free article] [PubMed] [Google Scholar]
- 12.Weitz J, Hurtado de Mendoza T, Tiriac H, Lee J, Sun S, Garg B, et al. An Ex Vivo Organotypic Culture Platform for Functional Interrogation of Human Appendiceal Cancer Reveals a Prominent and Heterogenous Immunological Landscape. Clin Cancer Res 2022;28:4793–806 [DOI] [PubMed] [Google Scholar]
- 13.Johnson S, Rabinovitch P. Ex vivo imaging of excised tissue using vital dyes and confocal microscopy. Curr Protoc Cytom 2012;Chapter 9:Unit 9 39 [DOI] [PMC free article] [PubMed] [Google Scholar]
- 14.Plitzko B, Loesgen S. Measurement of Oxygen Consumption Rate (OCR) and Extracellular Acidification Rate (ECAR) in Culture Cells for Assessment of the Energy Metabolism. Bio Protoc 2018;8:e2850. [DOI] [PMC free article] [PubMed] [Google Scholar]
- 15.Hu Y, Smyth GK. ELDA: extreme limiting dilution analysis for comparing depleted and enriched populations in stem cell and other assays. J Immunol Methods 2009;347:70–8 [DOI] [PubMed] [Google Scholar]
- 16.Jung AC, Ray AM, Ramolu L, Macabre C, Simon F, Noulet F, et al. Caveolin-1-negative head and neck squamous cell carcinoma primary tumors display increased epithelial to mesenchymal transition and prometastatic properties. Oncotarget 2015;6:41884–901 [DOI] [PMC free article] [PubMed] [Google Scholar]
- 17.Defilippi P, Truffa G, Stefanuto G, Altruda F, Silengo L, Tarone G. Tumor necrosis factor alpha and interferon gamma modulate the expression of the vitronectin receptor (integrin beta 3) in human endothelial cells. J Biol Chem 1991;266:7638–45 [PubMed] [Google Scholar]
- 18.Blaschuk KL, Guerin C, Holland PC. Myoblast alpha v beta3 integrin levels are controlled by transcriptional regulation of expression of the beta3 subunit and down-regulation of beta3 subunit expression is required for skeletal muscle cell differentiation. Dev Biol 1997;184:266–77 [DOI] [PubMed] [Google Scholar]
- 19.Wu C, Rakhshandehroo T, Wettersten HI, Campos A, von Schalscha T, Jain S, et al. Pancreatic cancer cells upregulate LPAR4 in response to isolation stress to promote an ECM-enriched niche and support tumour initiation. Nat Cell Biol 2023;25:309–22 [DOI] [PMC free article] [PubMed] [Google Scholar]
- 20.Chaube B, Bhat MK. AMPK, a key regulator of metabolic/energy homeostasis and mitochondrial biogenesis in cancer cells. Cell Death Dis 2016;7:e2044. [DOI] [PMC free article] [PubMed] [Google Scholar]
- 21.Garcia D, Shaw RJ. AMPK: Mechanisms of Cellular Energy Sensing and Restoration of Metabolic Balance. Mol Cell 2017;66:789–800 [DOI] [PMC free article] [PubMed] [Google Scholar]
- 22.Ablooglu AJ, Kang J, Petrich BG, Ginsberg MH, Shattil SJ. Antithrombotic effects of targeting alphaIIbbeta3 signaling in platelets. Blood 2009;113:3585–92 [DOI] [PMC free article] [PubMed] [Google Scholar]
- 23.Courter DL, Lomas L, Scatena M, Giachelli CM. Src kinase activity is required for integrin alphaVbeta3-mediated activation of nuclear factor-kappaB. J Biol Chem 2005;280:12145–51 [DOI] [PubMed] [Google Scholar]
- 24.Mizrachy-Schwartz S, Cohen N, Klein S, Kravchenko-Balasha N, Levitzki A. Up-regulation of AMP-activated protein kinase in cancer cell lines is mediated through c-Src activation. J Biol Chem 2011;286:15268–77 [DOI] [PMC free article] [PubMed] [Google Scholar]
- 25.Wek RC, Staschke KA. How do tumours adapt to nutrient stress? EMBO J 2010;29:1946–7 [DOI] [PMC free article] [PubMed] [Google Scholar]
- 26.Sebestyen A, Danko T, Sztankovics D, Moldvai D, Raffay R, Cervi C, et al. The role of metabolic ecosystem in cancer progression - metabolic plasticity and mTOR hyperactivity in tumor tissues. Cancer Metastasis Rev 2021;40:989–1033 [DOI] [PMC free article] [PubMed] [Google Scholar]
- 27.Sancho P, Barneda D, Heeschen C. Hallmarks of cancer stem cell metabolism. Br J Cancer 2016;114:1305–12 [DOI] [PMC free article] [PubMed] [Google Scholar]
- 28.Jones CL, Inguva A, Jordan CT. Targeting Energy Metabolism in Cancer Stem Cells: Progress and Challenges in Leukemia and Solid Tumors. Cell Stem Cell 2021;28:378–93 [DOI] [PMC free article] [PubMed] [Google Scholar]
- 29.Vaillant F, Asselin-Labat ML, Shackleton M, Forrest NC, Lindeman GJ, Visvader JE. The mammary progenitor marker CD61/beta3 integrin identifies cancer stem cells in mouse models of mammary tumorigenesis. Cancer Res 2008;68:7711–7 [DOI] [PubMed] [Google Scholar]
- 30.Friedlander M, Theesfeld CL, Sugita M, Fruttiger M, Thomas MA, Chang S, et al. Involvement of integrins alpha v beta 3 and alpha v beta 5 in ocular neovascular diseases. Proc Natl Acad Sci U S A 1996;93:9764–9 [DOI] [PMC free article] [PubMed] [Google Scholar]
- 31.Seguin L, Camargo MF, Wettersten HI, Kato S, Desgrosellier JS, von Schalscha T, et al. Galectin-3, a Druggable Vulnerability for KRAS-Addicted Cancers. Cancer Discov 2017;7:1464–79 [DOI] [PMC free article] [PubMed] [Google Scholar]
- 32.Che P, Yu L, Friedman GK, Wang M, Ke X, Wang H, et al. Integrin alphavbeta3 Engagement Regulates Glucose Metabolism and Migration through Focal Adhesion Kinase (FAK) and Protein Arginine Methyltransferase 5 (PRMT5) in Glioblastoma Cells. Cancers (Basel) 2021;13 [DOI] [PMC free article] [PubMed] [Google Scholar]
- 33.Desgrosellier JS, Cheresh DA. Integrins in cancer: biological implications and therapeutic opportunities. Nat Rev Cancer 2010;10:9–22 [DOI] [PMC free article] [PubMed] [Google Scholar]
- 34.Hennessy BT, Smith DL, Ram PT, Lu Y, Mills GB. Exploiting the PI3K/AKT pathway for cancer drug discovery. Nat Rev Drug Discov 2005;4:988–1004 [DOI] [PubMed] [Google Scholar]
- 35.Yang Y, Wang Y, Zhang Z, Wang S, Li Z. WSF-CT-11, a Sesquiterpene Derivative, Activates AMP-Activated Protein Kinase with Anti-diabetic Effects in 3T3-L1 Adipocytes. ACS Omega 2021;6:31272–81 [DOI] [PMC free article] [PubMed] [Google Scholar]
- 36.Herrero-Martin G, Hoyer-Hansen M, Garcia-Garcia C, Fumarola C, Farkas T, Lopez-Rivas A, et al. TAK1 activates AMPK-dependent cytoprotective autophagy in TRAIL-treated epithelial cells. EMBO J 2009;28:677–85 [DOI] [PMC free article] [PubMed] [Google Scholar]
- 37.Long YC, Zierath JR. AMP-activated protein kinase signaling in metabolic regulation. J Clin Invest 2006;116:1776–83 [DOI] [PMC free article] [PubMed] [Google Scholar]
- 38.Nguyen-Tu MS, Harris J, Martinez-Sanchez A, Chabosseau P, Hu M, Georgiadou E, et al. Opposing effects on regulated insulin secretion of acute vs chronic stimulation of AMP-activated protein kinase. Diabetologia 2022;65:997–1011 [DOI] [PMC free article] [PubMed] [Google Scholar]
- 39.Fox GC, Su X, Davis JL, Xu Y, Kwakwa KA, Ross MH, et al. Targeted Therapy to beta3 Integrin Reduces Chemoresistance in Breast Cancer Bone Metastases. Mol Cancer Ther 2021;20:1183–98 [DOI] [PMC free article] [PubMed] [Google Scholar]
Associated Data
This section collects any data citations, data availability statements, or supplementary materials included in this article.
Supplementary Materials
Data Availability Statement
The RNA-seq data generated in this study are publicly available in Sequence Read Archive (SRA) at PRJNA1074809. All other raw data generated in this study are available upon request from the corresponding authors.