

Abstract
Background and Objectives
Understanding the current status of and temporal trends of stroke epidemiology by age, race, and stroke subtype is critical to evaluate past prevention efforts and to plan future interventions to eliminate existing inequities. We investigated trends in stroke incidence and case fatality over a 22-year time period.
Methods
In this population-based stroke surveillance study, all cases of stroke in acute care hospitals within a 5-county population of southern Ohio/northern Kentucky in adults aged ≥20 years were ascertained during a full year every 5 years from 1993 to 2015. Temporal trends in stroke epidemiology were evaluated by age, race (Black or White), and subtype (ischemic stroke [IS], intracranial hemorrhage [ICH], or subarachnoid hemorrhage [SAH]). Stroke incidence rates per 100,000 individuals from 1993 to 2015 were calculated using US Census data and age-standardized, race-standardized, and sex-standardized as appropriate. Thirty-day case fatality rates were also reported.
Results
Incidence rates for stroke of any type and IS decreased in the combined population and among White individuals (any type, per 100,000, 215 [95% CI 204–226] in 1993/4 to 170 [95% CI 161–179] in 2015, p = 0.015). Among Black individuals, incidence rates for stroke of any type decreased over the study period (per 100,000, 349 [95% CI 311–386] in 1993/4 to 311 [95% CI 282–340] in 2015, p = 0.015). Incidence of ICH was stable over time in the combined population and in race-specific subgroups, and SAH decreased in the combined groups and in White adults. Incidence rates among Black adults were higher than those of White adults in all time periods, and Black:White risk ratios were highest in adults in young and middle age groups. Case fatality rates were similar by race and by time period with the exception of SAH in which 30-day case fatality rates decreased in the combined population and White adults over time.
Discussion
Stroke incidence is decreasing over time in both Black and White adults, an encouraging trend in the burden of cerebrovascular disease in the US population. Unfortunately, however, Black:White disparities have not decreased over a 22-year period, especially among younger and middle-aged adults, suggesting the need for more effective interventions to eliminate inequities by race.
Introduction
Previous data have consistently demonstrated race-based stroke disparities, with Black individuals having more deaths from stroke at the population level, largely driven by higher stroke incidence in Black compared with White individuals.1,2 These disparities present a major ongoing public health concern. Understanding these disparities has been the topic of a great deal of research using both population-based studies2,3 and longitudinal cohorts.4,5 For example, the Reasons for Geographic and Racial Differences in Stroke Study4,5 has investigated contributors to racial and geographic inequities, with an emphasis on why the stroke belt has a higher stroke mortality than the rest of the nation.1,2 Previous data from the Greater Cincinnati Northern Kentucky Stroke Study (GCNKSS) evaluating trends in incident stroke from 1993 through 2005 demonstrated that disparities in stroke incidence not only persisted, but that age- and sex-adjusted stroke incidence among Black individuals did not decrease over time as it did among White individuals, a concerning finding given existing disparities before 2005.3 Data from other studies conflict, however. In the Atherosclerosis Risk in Communities (ARIC) study, a longitudinal cohort of approximately 14,000 individuals from 4 communities across the United States, total stroke incidence decreased similarly in both Black and White individuals over time between 1990 and 2011.6
Age is another key factor to consider given findings of stable or increasing stroke incidence among young adults and known differences in race-based stroke incidence by age.5-8 For example in the Reasons for Geographic and Racial Differences in Stroke Study, a longitudinal cohort study, the elevated stroke incidence rate among Black individuals (compared with White) was most prominent in those aged 45–54 years and decreased with age; among those older than 85 years, the difference in incidence by race was completely attenuated.5 Some have hypothesized that such attenuation of race-based disparities in stroke incidence and mortality in older age groups is related to differences in survival between Black and White individuals,8 but more data are needed to understand this interaction of age and race.
Although few population-based studies are available to evaluate temporal trends in stroke over long periods of time, previously demonstrated changes in stroke incidence and the potential for changes in the race-based disparities over time illustrate the importance of following temporal trends in stroke epidemiology. Specifically, understanding the direction of temporal trends in stroke incidence by race is necessary to inform interventions and strategies that have the potential to reduce and eliminate disparities in overall stroke mortality. To investigate updated trends in stroke disparities between Black and White adults, our primary objective was to evaluate temporal trends in stroke incidence in the GCNKSS by race from 1993 through 2015, our latest completed study period. We had 2 secondary objectives: first, to evaluate race-based disparities in stroke incidence by age over time and second, to investigate 30-day case fatality by race over the same 22-year period.
Methods
The GCNKSS is a population-based stroke surveillance study that has been ascertaining cases of stroke occurring in adults aged 20 years or older living in a 5-county region of southern Ohio and northern Kentucky during a full year every 5 years since 1993 (July 1993 to June 1994, calendar years 1999, 2005, 2010, and 2015). Cases are identified in the 17 acute care hospitals in the region (including the Veteran's Affairs Hospital) and a weighted sample of out-of-hospital settings (outpatient clinics, coroners' offices, and a random sample of physicians' offices). Methodology regarding both the sampling and weighting procedures of out-of-hospital strokes has been previously published.3 The primary analyses used only hospital-ascertained strokes. The GCNKSS population is representative of the greater United States regarding Black race, age, and economic status.9
Potential cases are initially identified using discharge International Classification of Diseases (ICD) codes for stroke (ICD-9, 430–436 and ICD-10, 160–169), and data are obtained from a retrospective chart review by trained study nurses. Cases are then adjudicated and subtyped (ischemic stroke [IS], intracranial hemorrhage [ICH], or subarachnoid hemorrhage [SAH]) by trained study physicians. To be adjudicated as a stroke case, symptoms must be sudden onset, localized to a specific portion of the brain, and last for at least 24 hours. Events with symptoms lasting <24 hours are coded as transient ischemic attacks and were not included in the current analysis. Additional details regarding ascertainment and case adjudication have been published previously.3,9 For analyses that include temporal trends, clinical case definitions are used (i.e., not dependent on MRI10), and case definitions have remained stable over the 22-year period.
Case fatality was defined as death from any cause within 30 days of the incident stroke. We used data from the National Death Index to confirm cases of case fatality.
This study was approved by institutional review boards at all participating hospitals, and informed consent was waived. Statistical analyses were performed using SAS (version 9.4; SAS Institute, Cary, NC).
Data Abstraction
Demographic data for each participant (age, race, and sex) were abstracted from the electronic medical record by trained study nurses. Data on comorbidities (hypertension, diabetes mellitus, atrial fibrillation, smoking status, and heart disease) were also obtained from patient records and included diagnoses present at the time of admission. Data on comorbidities such as hypertension were based on data from the medical records. For example, prior history of hypertension was defined as hypertension or high blood pressure listed in the medical history of the patient (in physician notes, admission or discharge summaries, or other locations in the medical record) or having antihypertensive medications on their prestroke medication list. This definition (and the abstraction procedures) for the comorbidities did not change over time.
Statistical Analysis
For demographic variables and comorbidities, means (with SDs) or raw frequencies (with percentages) were reported for continuous and categorical variables, respectively, for hospital-ascertained strokes. When out-of-hospital strokes were included (data presented in online supplement), weighted means (with weighted SDs) or raw frequencies (with weighted percentages) were used. Estimates were reported by race and study period, and race-specific trends over time were reported.
In the primary analyses of hospital-ascertained strokes, for each of the 5 study periods, incidence rates were reported for the combined group (both Black and White participants) followed by Black participants and White participants separately. Incidence estimates were reported for any type of stroke (IS, ICH, SAH, or unknown) and then for IS, ICH, and SAH separately.
For each estimate of incidence, the numerator was the raw frequency of strokes in each designated subgroup and the denominator was obtained from the US census for the 5-county area from the appropriate year, extracted from the US Census Bureau website. The estimates are based on interpolation and extrapolation of county population between enumerated census years, accounting for births, deaths, and migration. Incidence rates were then age-adjusted, sex-adjusted, and race-adjusted using direct standardization (and the 2010 US census population), and incidence rates per 100,000 with 95% CIs were reported. The 95% CIs for the incidence rates were calculated assuming a Poisson distribution.11
Trends in stroke incidence over time were evaluated using linear regression, weighted with the inverse of the standard error of the estimated incidence rate.12 p Values for trend of incidence by the study period were obtained from the linear regression models. In addition, differences between individual years (e.g., 1999 vs 2005) were tested using a Bonferroni correction. In our secondary analyses including both hospital-ascertained and out-of-hospital strokes, these analyses were repeated.
Next, disparities between incidence rates in Black compared with White individuals were evaluated using risk ratios. Black-to-White risk ratios with 95% CIs were reported in each of the 5 study periods, and the trend over time was evaluated using linear regression using inverse weighting of the standard error. We also calculated Black-to-White risk ratios stratified by the age category (20–34, 35–44, 45–54, 55–64, 65–74, 75–84, and ≥85 years old).
Case fatality rates were reported as percentages with 95% CIs for the overall group followed by race-specific percentages. Trends in case fatality rates over time were tested using generalized linear models, adjusted for age, sex, and race for the overall group, and adjusted for age and sex for the stratified analyses. Race by year interaction terms were also tested.
Data Availability
Data will be shared on request with qualified investigators.
Results
Demographics and comorbidities of patients with stroke in each of the 5 study periods, stratified by race, are summarized in Table 1 for hospital-ascertained cases only and eTable 1 (links.lww.com/WNL/D309) in the supplement for hospital plus out-of-hospital–ascertained strokes. The mean age of people with incident stroke decreased over time for both race groups; between 1993 and 2015, the mean (SD) age of stroke cases went from 66.1 (SD 15.4) to 61.7 (SD 14.6) years for Black individuals (p = 0.0004) and from 72.4 (SD 12.9) to 70.6 (SD 14.9) for White individuals (p < 0.0001). Hypertension and diabetes increased over time in both groups, and the proportion of individuals with hypertension and diabetes was higher in Black individuals than White individuals in all study periods (Table 1). In 2015, 87% of Black individuals had documented hypertension and 43% had documented diabetes, compared with 76% and 30% of White individuals, respectively. The proportion of individuals who were female remained relatively stable over time in both race groups. Documented atrial fibrillation increased over time in White individuals only (<0.001) and was higher in White than Black adults in 2015 (29% vs 10%). Trends in demographics and comorbidities over time when including out-of-hospital strokes (eTable 1) are similar to those described in Table 1. There were no missing data for age or sex in the study sample. A total of 77 participants were excluded because they were not Black or White (n = 67) or because their race was unknown (n = 10). For comorbidities, a lack of notation of comorbidity in the medical record was counted as not having the risk factor.
Table 1.
Demographics and Comorbidities of Incident Stroke Populations Over Time, GCNK Region, Hospital Ascertained Only, and Stratified by Race
| 1993–94 (N = 1,907) | 1999 (N = 1,992) | 2005 (N = 1,884) | 2010 (N = 1,964) | 2015 (N = 1,981) | p Valuea | |||||||
| Black (343 [18]) | White (1,564 [82]) | Black (346 [17]) | White (1,646 [83]) | Black (390 [21]) | White (1,494 [79]) | Black (414 [21]) | White (1,550 [79]) | Black (456 [23]) | White (1,525 [77]) | Black | White | |
| Age, y | 66.1 (15.4) | 72.4 (12.9) | 63.8 (15.6) | 72.4 (13.7) | 62.2 (15.1) | 70.0 (15.2) | 62.4 (15.4) | 70.0 (15.2) | 61.7 (14.6) | 70.6 (14.9) | 0.0004b | <0.0001b |
| Female | 199 (58) | 885 (57) | 207 (60) | 949 (58) | 223 (57) | 815 (55) | 233 (56) | 858 (55) | 240 (53) | 804 (53) | 0.33 | 0.14 |
| Hypertension | 223 (65) | 902 (58) | 262 (76) | 1,050 (64) | 313 (80) | 1,064 (71) | 344 (83) | 1,175 (76) | 397 (87) | 1,152 (76) | <0.0001b | <0.0001b |
| Diabetes | 103 (30) | 398 (25) | 122 (35) | 422 (26) | 144 (37) | 404 (27) | 154 (37) | 436 (28) | 194 (43) | 461 (30) | 0.0014b | 0.021b |
| Atrial fibrillation | 34 (10) | 272 (17) | 36 (10) | 277 (17) | 55 (14) | 328 (22) | 47 (11) | 409 (26) | 46 (10) | 439 (29) | 0.48 | <0.0001b |
| Current smoker | 103 (30) | 296 (19) | 112 (32) | 340 (21) | 131 (34) | 345 (23) | 160 (39) | 376 (24) | 162 (36) | 342 (22) | 0.042b | 0.0008b |
| Heart disease | 90 (26) | 596 (38) | 118 (34) | 627 (38) | 136 (35) | 578 (39) | 147 (36) | 615 (40) | 142 (31) | 566 (37) | 0.012b | 0.88 |
Abbreviation: GCNK = Greater Cincinnati Northern Kentucky.
Data presented as mean (SD) or frequency (%).
A total of 77 participants were excluded because they were not Black or White (n = 67) or because their race was unknown (n = 10) (1993/4: 13, 1999: 13, 2005: 12, 2010: 14, 2015: 25).
Race-specific trends over time for each characteristic using a linear model for age and using the Cochran-Armitage trend test for categorical variables.
Statistically significant (<0.05).
In Table 2, both overall and race-specific stroke incidence estimates in each of the 5 study periods are displayed for hospital-ascertained strokes. For trends over time, strokes of any type and IS decreased in the combined population (p = 0.011, p = 0.009) and in the subgroup of White individuals (p = 0.015, p = 0.013), respectively. In the subgroup of Black individuals, incidence rates for stroke of any type decreased over time (p = 0.015), but the change in incidence of IS was not statistically significant (p = 0.096). The incidence of ICH was stable over time in the combined population and in the race-specific subgroups, and SAH incidence decreased in the combined groups and the White subgroups (Table 2). Pairwise comparisons between individual years (e.g., 1993/4 vs 2015, 1999 vs 2015), detailed in the legend of Table 2, were not significant for those in the Black subgroup after adjustment for multiple comparisons, although the same pairwise comparisons were significant for the combined population and for White individuals. In the supplement (eTable 2, links.lww.com/WNL/D309, data for strokes ascertained from both hospital and out-of-hospital settings), overall trends are similar to the findings already described. Notable differences include a significant decrease in IS among Black individuals over time (p = 0.02) and slight changes in the number of SAH cases in the last study period.
Table 2.
Overall and Race-Specific Stroke Incidence per 100,000 (95% CI) Over Time, Hospital Ascertainment Only, Among Adults ≥20 Years Old in the Greater Cincinnati Northern Kentucky Stroke Study
| Type | Incidence for hospital ascertained only, ≥20 y/100,000 | p Value for trenda | ||||
| 1993/94 | 1999 | 2005 | 2010 | 2015 | ||
| Combined study population | ||||||
| Any typeb | 230 (220–241) | 230 (220–241) | 203 (194–213) | 201 (192–210) | 188 (179–196) | 0.011c |
| IS | 202 (192–212) | 203 (193–213) | 179 (170–187) | 174 (165–182) | 163 (155–170) | 0.009c |
| ICH | 31 (28–35) | 34 (30–38) | 35 (31–38) | 31 (27–34) | 31 (28–34) | 0.57 |
| SAH | 10 (8–12) | 10 (8–13) | 9 (8–11) | 8 (7–10) | 8 (7–10) | 0.024c |
| Black race | ||||||
| Any typeb | 349 (311–386) | 328 (292–363) | 330 (296–363) | 316 (285–347) | 311 (282–340) | 0.015c |
| IS | 291 (257–326) | 285 (252–319) | 294 (263–326) | 267 (239–296) | 265 (238–291) | 0.096 |
| ICH | 61 (45–77) | 63 (47–78) | 51 (38–64) | 53 (40–66) | 66 (53–79) | 0.994 |
| SAH | 15 (8–22) | 15 (8–21) | 19 (12–27) | 15 (9–21) | 13 (7–19) | 0.675 |
| White race | ||||||
| Any typeb | 215 (204–226) | 216 (205–227) | 186 (176–195) | 185 (176–195) | 170 (161–179) | 0.015c |
| IS | 191 (181–201) | 191 (181–201) | 163 (154–172) | 161 (153–170) | 149 (141–157) | 0.013c |
| ICH | 28 (24–31) | 30 (26–34) | 32 (28–36) | 28 (24–31) | 26 (23–29) | 0.523 |
| SAH | 9 (7–11) | 10 (7–12) | 8 (6–10) | 7 (5–9) | 7 (6–9) | 0.035c |
Abbreviations: ICH = intracranial hemorrhage; IS = ischemic stroke; SAH = subarachnoid hemorrhage.
Individual differences between years are adjusted using a Bonferroni correction. p < 0.05 between years for incident stroke of any type in the combined Black and White population and in the White population: 1993/1994 vs 2005, 2010, 2015, 1999 vs 2005, 2010, 2015; p < 0.05 between years for incident IS in the combined Black and White population and in the White population: 1993/1994 vs 2005, 2010, 2015, 1999 vs 2005, 2010, 2015. p > 0.05 for all pairwise comparisons in the Black population.
Estimates are age-adjusted, race-adjusted, and sex-adjusted or age-adjusted and sex-adjusted to the 2010 US population.
Trend evaluated using linear regression using inverse weighting of the standard error.
Any type includes incident IS, ICH, SAH, or stroke of unknown type.
Statistically significant (p < 0.05).
Risk ratios of incidence of stroke of any type in Black individuals to White individuals in all 5 study periods are presented in Table 3 (hospital ascertained only) and eTable 3 (links.lww.com/WNL/D309) (includes out-of-hospital strokes as well). Those in the Black subgroup had higher stroke incidence compared with those of the White subgroup, with risk ratios ranging from 1.52 (95% CI 1.34–1.70) in 1999 to 1.83 (95% CI 1.63–2.02) in 2015 (p = 0.13 for trend over time). In the online supplement (eTable 3), data that include hospital and out-of-hospital strokes demonstrate a similar pattern with no change in the Black-to-White risk ratio of stroke over time (p = 0.22).
Table 3.
RR of Incident Stroke (of Any Type) by Age, Black:White, Hospital Ascertainment Only
| Black to White Incidence RR (95% CI) | p Value for trend over time | |||||
| 1993/4 | 1999 | 2005 | 2010 | 2015 | ||
| Overall | 1.62 (1.43–1.82) | 1.52 (1.34–1.70) | 1.77 (1.57–1.97) | 1.70 (1.51–1.89) | 1.83 (1.63–2.02) | 0.13 |
| 20–34 | 3.47 (0.97–5.97) | 1.93 (0.36–3.50) | 1.46 (0.36–2.57) | 1.58 (0.37–2.79) | 3.85 (1.45–6.24) | 0.95 |
| 35–44 | 4.15 (1.89–6.41) | 3.41 (1.85–4.97) | 2.65 (1.54–3.76) | 3.37 (1.92–4.83) | 3.44 (2.01–4.87) | 0.58 |
| 45–54 | 3.05 (1.92–4.17) | 3.38 (2.36–4.41) | 3.15 (2.32–3.97) | 2.43 (1.85–3.02) | 3.08 (2.24–3.92) | 0.48 |
| 55–64 | 1.72 (1.22–2.23) | 2.30 (1.67–2.93) | 2.47 (1.86–3.09) | 2.30 (1.77–2.84) | 2.53 (2.01–3.05) | 0.08 |
| 65–74 | 1.73 (1.36–2.11) | 1.43 (1.09–1.77) | 1.80 (1.37–2.24) | 1.59 (1.19–1.99) | 1.79 (1.39–2.20) | 0.64 |
| 75–84 | 1.25 (0.95–1.56) | 0.83 (0.59–1.06) | 1.21 (0.89–1.53) | 1.20 (0.86–1.54) | 1.22 (0.88–1.55) | 0.63 |
| 85+ | 1.15 (0.74–1.55) | 1.06 (0.71–1.42) | 0.81 (0.49–1.13) | 1.14 (0.77–1.51) | 0.81 (0.51–1.11) | 0.31 |
Abbreviation: RR = risk ratio.
For overall (all age groups combined, trend over time was evaluated using linear regression using inverse weighting of the standard error, p = 0.13). Adjusted for age and sex to the 2010 US population.
For our secondary objective, investigating racial disparities in incident stroke of any type by age (Table 3, Figure, Supplemental eTable 3, links.lww.com/WNL/D309), risk ratios demonstrating higher incidence rates in Black vs White individuals are highest among 20- to 34-year-olds and 35- to 44-year-olds. Risk ratios decrease with age, with estimates in the 75 to 84 and older than 85-year subgroups showing no significant difference by race. In the supplement (eTable 3), data for strokes ascertained from hospitals and out-of-hospital settings demonstrate similar patterns.
Figure. Risk Ratio (Black:White) for Stroke of Any Type by Age Group, Hospital Ascertainment Only, and Stratified by Time Period.
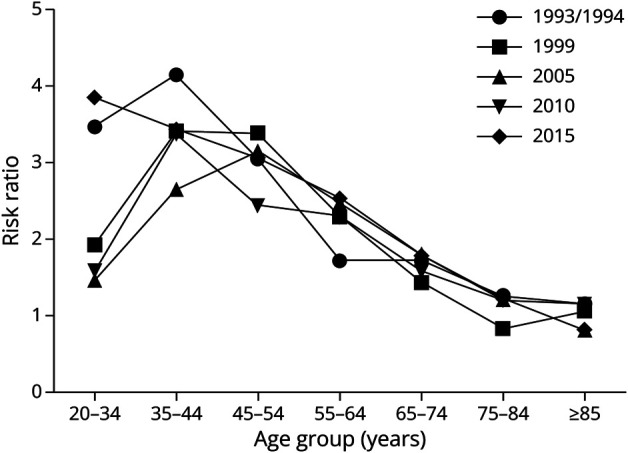
Risk ratios calculated using Black and White stroke incidence (per 100,000). Estimates are age-adjusted and sex-adjusted to the 2010 US population. Any type includes incident IS, ICH, SAH, or stroke of unknown type. ICH = intracranial hemorrhage; IS = ischemic stroke; SAH = subarachnoid hemorrhage.
Finally, 30-day case fatality overall and by race in each of the 5 study periods is presented in Table 4 and eTable 4 (links.lww.com/WNL/D309). Case fatality rates were stable for strokes of any type and for IS in the combined subgroup and for Black and White subgroups in the stratified analyses. For SAH, case fatality rates decreased in the combined group and in the White subgroup (Table 4, eTable 4). For ICH, case fatality rates increased among White adults in the analysis with both hospital and out-of-hospital strokes (eTable 4) and showed a trend toward an increase in the analysis with hospital-ascertained strokes only.
Table 4.
Thirty-Day All-Cause Case Fatality (%) With 95% CI Among Patients With Incident Stroke (Age ≥20 Years; Hospital Ascertained Only) Over Time, GCNK Population
| Type | All races | p Value for temporal trenda | ||||
| 1993/94 | 1999 | 2005 | 2010 | 2015 | ||
| Any type | 13.5 (11.9–15.1) | 14.4 (12.9–16.1) | 14.7 (13.1–16.5) | 13.9 (12.3–15.6) | 12.8 (11.4–14.4) | 0.496 |
| IS | 9.7 (8.3–11.3) | 9.4 (8.1–10.9) | 9.4 (8.0–11.0) | 9.2 (7.8–10.7) | 8.1 (6.9–9.6) | 0.110 |
| ICH | 33.2 (27.4–39.4) | 38.4 (32.6–44.5) | 41.3 (35.5–47.4) | 38.1 (32.3–44.2) | 39.5 (34.0–45.3) | 0.178 |
| SAH | 35.1 (24.8–47.1) | 34.1 (23.9–46.0) | 25.5 (17.0–36.2) | 23.7 (15.3–34.8) | 17.5 (10.8–27.2) | 0.003c |
| Black | White | p Valueb | ||||||||||
| 1993/94 | 1999 | 2005 | 2010 | 2015 | 1993/94 | 1999 | 2005 | 2010 | 2015 | Black | White | |
| Any type | 11.6 (8.7–15.4) | 11.5 (8.5–15.3) | 12.1 (9.2–15.7) | 12.5 (9.6–16.0) | 9.5 (7.2–12.6) | 14.7 (13.1–16.5) | 15.9 (14.2–17.7) | 16.1 (14.3–18.1) | 14.9 (13.2–16.8) | 14.3 (12.6–16.2) | 0.514 | 0.594 |
| IS | 6.1 (4.0–9.3) | 6.7 (4.4–10.0) | 7.7 (5.4–11.0) | 7.1 (4.9–10.3) | 5.9 (4.0–8.7) | 11.4 (9.9–13.1) | 10.9 (9.4–12.5) | 10.6 (9.1–12.4) | 10.5 (9.0–12.2) | 9.4 (7.9–11.1) | 0.982 | 0.082 |
| ICH | 30.7 (20.3–43.3) | 33.3 (22.9–45.6) | 30.9 (20.5–43.6) | 30.9 (21.0–42.8) | 25.3 (17.5–35.0) | 35.9 (29.4–42.9) | 41.9 (35.6–48.6) | 46.3 (40.1–52.7) | 42.2 (35.7–48.9) | 46.4 (39.8–53.1) | 0.387 | 0.051 |
| SAH | 33.5 (14.0–61.0) | 36.5 (16.4–62.7) | 17.9 (7.1–38.2) | 25.8 (10.8–50.0) | 13.6 (4.1–36.7) | 36.4 (25.4–49.1) | 34.1 (23.6–46.5) | 28.1 (18.1–40.8) | 23.0 (14.0–35.5) | 19.6 (11.8–30.8) | 0.128 | 0.012c |
Abbreviations: GCNK = Greater Cincinnati Northern Kentucky; ICH = intracranial hemorrhage; IS = ischemic stroke; SAH = subarachnoid hemorrhage.
Any type includes incident IS, ICH, SAH, or stroke of unknown type. Trends were tested using a generalized linear model, adjusted for age, sex, and race in the top panela and age and sex in the bottom panelb. Race and race by year interaction terms were also tested but were not significant (all p > 0.05).
Overall rates.
Stratified by race.
Statistically significant (p < 0.05).
Discussion
In our updated analysis of trends in stroke incidence in a population representative of the United States with respect to age, race, and socioeconomic status, over a 22-year time period, incidence of any stroke (IS, ICH, SAH, or unknown subtype) decreased in the combined population, in White adults, and in Black adults, despite concerning trends in age at first stroke and prevalence of key stroke risk factors, such as diabetes and hypertension. The decrease in stroke incidence over time seems to be largely driven by decreasing rates of IS, although decreases were also seen in SAH incidence rates. Our findings are encouraging compared with our previous findings in which stroke incidence in Black adults did not decrease between 1993/94 and 2005.3 In the current analysis, however, stroke incidence among Black adults continued to be 50%–80% higher than the stroke incidence rate among White adults over the 22-year time period, even after adjustment for age and sex. The disparity in stroke incidence by race, which is driven by substantially increased risk in younger and middle aged adults, does not seem to be improving.
The decreasing incidence of both overall and IS in White and Black adults over a 22-year time period is an important and encouraging finding and suggests that despite increasing prevalence of key cardiovascular risk factors in the population of patients with stroke, prevention efforts have reduced the overall burden of cerebrovascular disease. Unfortunately, however, our findings demonstrate a persistent inequity between Black and White adults, with risk ratios ranging from 1.52 to 1.83. The race-based disparities in incidence are particularly strong in young and middle-aged adults, emphasizing the urgent need for increased attention to systemic racism in the healthcare system, inequities in access to care, improved primary prevention efforts, and the need for increased attention to social determinants of health. Although some interventions specific to stroke prevention or care are ongoing13 to help mitigate the deleterious health effects of social determinants, more work is needed to address factors at the systems, policy, provider, and patient levels that contribute to race-based disparities in stroke incidence. Reasons for a lack of race-based disparities in older age groups in our study and others are not clear, although survival biases by race may be contributing.
Compared with other literature, our findings of decreasing stroke incidence in both Black and White adults are similar to ARIC, a longitudinal cohort,6 although decreases in ARIC were only significant in those aged 65 years or older.6,14 Recent data comparing stroke incidence rates in White, non-Hispanic individuals with Mexican Americans showed that some of the disparities are improving over time, with data from 2016 to 2017 indicating either equal or lower stroke rates among Mexican Americans depending on the age category,15 contrasting with previous data demonstrating higher stroke incidence rates in Mexican Americans compared with non-Hispanic White individuals.16 Contributors to health disparities, however, differ depending on the race or ethnic group under study and geography, age, sex, and other key social constructs.
In our study, despite decreasing incidence of any stroke and of IS, concerning trends were identified regarding age at first stroke and prevalence of hypertension, diabetes, current smoking, and heart disease, even as the frequency of smoking in our regional population has substantially decreased during the same time period. Although differences in screening, clinical definitions, and documentation practices over time may have contributed to these temporal changes and would have increased opportunities for treatment, further study and improved interventions are needed to both identify and manage key stroke risk factors. In addition, data from other US-based studies do not indicate improved management of risk factors such as hypertension at the population level, again indicating a need for improved interventions.17 The same study of data from the National Health and Nutrition Examination Survey noted an increase in hypertension prevalence over time,17 although we cannot directly compare prevalence of comorbidities in the general population with prevalence rates in a population of patients.
As we have described previously,3 our data demonstrating higher stroke incidence and similar or lower case fatality rates in Black compared with White individuals suggest that the continued problem of elevated stroke mortality rates in Black adults is largely driven by disparities in stroke incidence. The trend in lower case fatality rates among Black individuals likely reflects in part the generally younger age at onset as compared with White individuals, although other contributors to this difference include the possibility of a higher proportion of hypertension-related lacunar strokes, although more data in this area are needed. For ICH and SAH, our data suggest a trend toward rising rates of case fatality following ICH, especially among White individuals, and decreasing case fatality rates following SAH, again only in White individuals. For ICH, our analyses were not adjusted for stroke severity and may represent more severe bleeds over time, potentially due to increasing use of anticoagulation. Prior data on these speculations conflict to some extent,18,19 highlighting an important area for future research. For SAH, our finding of both improving incidence and case fatality rates is a continuation of the trends previously published.3,20 These data represent important progress in stroke epidemiology, and possible contributors to improvements in SAH incidence and case fatality include a decreased smoking rate in the population and improved acute care, respectively.
One limitation to our study is the use of race obtained from medical records and the possibility of misclassification of race due to potential variability in how race data were collected across hospitals. We also acknowledge that although race is the primary exposure variable in this analysis, the key social constructs that contribute to inequities between race groups (e.g., systemic racism and access to preventive care) were not measured. Although these limitations are inherent in large-scale stroke surveillance studies, we acknowledge the importance of understanding the factors that lead to disparities by categories of race, a social construct often used as an imperfect surrogate for other social determinants of health. Another limitation to our study is the presence of small differences in findings between the analyses that include hospital cases only and those that include a weighted sampling of out-of-hospital cases. Although study procedures including physician adjudication are the same between hospital and out-of-hospital cases, out-of-hospital cases often have less available documentation on which to base adjudication and data abstraction. In addition, because a portion of out-of-hospital are sampled (and are thus weighted in analyses), a small number of cases can have a relatively large influence on incidence estimates. Although these limitations are inherent to sampling and weighting procedures, because of this, our primary analyses are based solely on hospital-ascertained events. Finally, our study was not designed to investigate inequities in stroke incidence in minoritized groups such as Hispanic, Asian, Native Hawaiian, and American Indian individuals but was designed to examine inequities in Black compared with White individuals. Future studies should evaluate other inequities using populations with sample sizes to adequately explore and understand such differences.
Stroke incidence over time is decreasing overall and in both Black and White adults, a key finding which illustrates the success of previously implemented prevention strategies. Encouraging trends in SAH incidence and case fatality are also important to highlight. However, the substantial racial disparity in stroke incidence remains unchanged over the study periods and continues to be particularly impactful in younger adults, and few studies are conducting ongoing surveillance of stroke incidence in Black vs White individuals in the United States. Our findings demonstrate the importance of continuing population-based stroke surveillance and the importance of designing and implementing interventions to counter social determinants of health that lead to a high prevalence of untreated stroke risk factors and subsequently to a higher incidence of stroke, a direct contributor to elevated stroke mortality. Future work is also needed to improve incidence and case fatality of ICH.
Glossary
- ARIC
Atherosclerosis Risk in Communities Study
- GCNKSS
Greater Cincinnati Northern Kentucky Stroke Study
- ICD-9
International Classification of Diseases, Ninth Revision
- ICD-10
International Classification of Diseases, 10th Revision
- ICH
intracranial hemorrhage
- IS
ischemic stroke
- SAH
subarachnoid hemorrhage
Appendix. Authors
| Name | Location | Contribution |
| Tracy E. Madsen, MD, ScM, PhD | Department of Emergency Medicine, Alpert Medical School of Brown University; Department of Epidemiology, Brown University School of Public Health, Providence, RI | Drafting/revision of the manuscript for content, including medical writing for content; study concept or design; analysis or interpretation of data |
| Lili Ding, PhD | Division of Biostatistics and Epidemiology, Department of Pediatrics, Cincinnati Children's Hospital Medical Center, University of Cincinnati, OH | Drafting/revision of the manuscript for content, including medical writing for content; analysis or interpretation of data |
| Jane C. Khoury, PhD | Division of Biostatistics and Epidemiology, Department of Pediatrics, Cincinnati Children's Hospital Medical Center, University of Cincinnati, OH | Drafting/revision of the manuscript for content, including medical writing for content; analysis or interpretation of data |
| Mary Haverbusch, BSN | Department of Neurology and Rehabilitation Medicine, University of Cincinnati College of Medicine, OH | Drafting/revision of the manuscript for content, including medical writing for content; major role in the acquisition of data; study concept or design |
| Daniel Woo, MD, MS | Department of Neurology and Rehabilitation Medicine, University of Cincinnati College of Medicine, OH | Drafting/revision of the manuscript for content, including medical writing for content; analysis or interpretation of data |
| Simona Ferioli, MD | Department of Neurology and Rehabilitation Medicine, University of Cincinnati College of Medicine; UC Gardner Neuroscience Institute, Cincinnati, OH | Drafting/revision of the manuscript for content, including medical writing for content; analysis or interpretation of data |
| Felipe De Los Rios La Rosa, MD | Department of Neurology and Rehabilitation Medicine, University of Cincinnati College of Medicine, OH; Miami Neuroscience Institute, Baptist Health South Florida, FL | Drafting/revision of the manuscript for content, including medical writing for content; analysis or interpretation of data |
| Sharyl R. Martini, MD, PhD | Neurology Program, Veterans Health Administration and Department of Neurology, Baylor College of Medicine, Houston, TX | Drafting/revision of the manuscript for content, including medical writing for content; analysis or interpretation of data |
| Opeolu Adeoye, MD, MS | Department of Emergency Medicine, Washington University, St. Louis, MO | Drafting/revision of the manuscript for content, including medical writing for content; analysis or interpretation of data |
| Pooja Khatri, MD, MSc | Department of Neurology and Rehabilitation Medicine, University of Cincinnati College of Medicine; UC Gardner Neuroscience Institute, Cincinnati, OH | Drafting/revision of the manuscript for content, including medical writing for content; analysis or interpretation of data |
| Matthew L. Flaherty, MD | Department of Neurology and Rehabilitation Medicine, University of Cincinnati College of Medicine; UC Gardner Neuroscience Institute, Cincinnati, OH | Drafting/revision of the manuscript for content, including medical writing for content; analysis or interpretation of data |
| Jason Mackey, MD | Department of Neurology, Indiana University School of Medicine, Indianapolis | Drafting/revision of the manuscript for content, including medical writing for content; analysis or interpretation of data |
| Eva A. Mistry, MBBS, MSCI | Department of Neurology and Rehabilitation Medicine, University of Cincinnati College of Medicine; UC Gardner Neuroscience Institute, Cincinnati, OH | Drafting/revision of the manuscript for content, including medical writing for content; analysis or interpretation of data |
| Stacie Demel, DO, PhD | Department of Neurology and Rehabilitation Medicine, University of Cincinnati College of Medicine; UC Gardner Neuroscience Institute, Cincinnati, OH | Drafting/revision of the manuscript for content, including medical writing for content; analysis or interpretation of data |
| Elisheva Coleman, MD | Department of Neurology, University of Chicago, IL | Drafting/revision of the manuscript for content, including medical writing for content; analysis or interpretation of data |
| Adam Jasne, MD | Department of Neurology, Yale School of Medicine, New Haven, CT | Drafting/revision of the manuscript for content, including medical writing for content; analysis or interpretation of data |
| Sabreena Slavin, MD | University of Kansas Medical Center, Kansas City | Drafting/revision of the manuscript for content, including medical writing for content; analysis or interpretation of data |
| Kyle B. Walsh, MD, MS | Department of Neurology and Rehabilitation Medicine, University of Cincinnati College of Medicine; UC Gardner Neuroscience Institute, Cincinnati, OH | Drafting/revision of the manuscript for content, including medical writing for content; analysis or interpretation of data |
| Michael Star, MD | Soroka Medical Center, Beersheba, Israel | Drafting/revision of the manuscript for content, including medical writing for content; analysis or interpretation of data |
| Joseph P. Broderick, MD | Department of Neurology and Rehabilitation Medicine, University of Cincinnati College of Medicine; UC Gardner Neuroscience Institute, Cincinnati, OH | Drafting/revision of the manuscript for content, including medical writing for content; analysis or interpretation of data |
| Brett Kissela, MD | Department of Neurology and Rehabilitation Medicine, University of Cincinnati College of Medicine; UC Gardner Neuroscience Institute, Cincinnati, OH | Drafting/revision of the manuscript for content, including medical writing for content; analysis or interpretation of data |
| Dawn O. Kleindorfer, MD | Department of Neurology and Rehabilitation Medicine, University of Cincinnati College of Medicine; UC Gardner Neuroscience Institute, Cincinnati, OH; Department of Neurology, University of Michigan, Ann Arbor | Drafting/revision of the manuscript for content, including medical writing for content; analysis or interpretation of data |
Study Funding
This study was funded by a grant from the National Institutes of Neurological Disorders and Stroke (Grant No. R01 NS 30678).
Disclosure
T.E. Madsen was funded by the NHBLI (K23 HL140081), National Institutes of Neurological Disorders and Stroke (NINDS) R01NS30678. L. Ding was funded by NINDS R01NS30678. J.C. Khoury has no disclosures to report. M. Haverbusch was funded by NINDS R01NS30678. D. Woo has no disclosures to report. S. Ferioli was funded by NINDS R01NS30678. F. De Los Rios La Rosa, S.R. Martini, and O. Adeoye have no disclosures to report. P. Khatri was funded by NINDS R01NS30678. M.L. Flaherty has no disclosures to report. J. Mackey was funded by NINDS R01NS30678. E.A. Mistry was funded by NINDS R01NS30678. S. Demel, E. Coleman, and A. Jasne have no disclosures to report. S. Slavin was funded by NINDS R01NS30678. K.B. Walsh, M. Star, and J.P. Broderick have no disclosures to report. B. Kissela was funded by NINDS R01NS30678. D.O. Kleindorfer was funded by NINDS R01NS30678. Go to Neurology.org/N for full disclosures.
References
- 1.Virani SS, Alonso A, Aparicio HJ, et al. Heart Disease and Stroke Statistics—2021 update: a report from the American Heart Association. Circulation. 2021;143(8):e254-e743. doi: 10.1161/CIR.0000000000000950 [DOI] [PubMed] [Google Scholar]
- 2.Kissela B, Schneider A, Kleindorfer D, et al. Stroke in a biracial population: the excess burden of stroke among blacks. Stroke. 2004;35(2):426-431. doi: 10.1161/01.STR.0000110982.74967.39 [DOI] [PubMed] [Google Scholar]
- 3.Kleindorfer DO, Khoury J, Moomaw CJ, et al. Stroke incidence is decreasing in whites but not in blacks. Stroke. 2010;41(7):1326-1331. doi: 10.1161/strokeaha.109.575043 [DOI] [PMC free article] [PubMed] [Google Scholar]
- 4.Howard VJ, Cushman M, Pulley L, et al. The reasons for geographic and racial differences in stroke study: objectives and design. Neuroepidemiology. 2005;25(3):135-143. doi: 10.1159/000086678 [DOI] [PubMed] [Google Scholar]
- 5.Howard VJ, Kleindorfer D, Judd SE, et al. Disparities in stroke incidence contributing to disparities in stroke mortality. Ann Neurol. 2011;69(4):619-627. doi: 10.1002/ana.22385 [DOI] [PMC free article] [PubMed] [Google Scholar]
- 6.Koton S, Schneider ALC, Rosamond WD, et al. Stroke incidence and mortality trends in U.S. communities, 1987 to 2011. JAMA. 2014;312(3):259-268. doi: 10.1001/jama.2014.7692 [DOI] [PubMed] [Google Scholar]
- 7.Kissela BM, Khoury JC, Alwell K, et al. Age at stroke: temporal trends in stroke incidence in a large, biracial population. Neurology. 2012;79(17):1781-1787. doi: 10.1212/WNL.0b013e318270401d [DOI] [PMC free article] [PubMed] [Google Scholar]
- 8.Mayeda ER, Banack HR, Bibbins-Domingo K, et al. Can survival bias explain the age attenuation of racial inequalities in stroke incidence? Epidemiology. 2018;29(4):525-532. doi: 10.1097/EDE.0000000000000834 [DOI] [PMC free article] [PubMed] [Google Scholar]
- 9.Broderick J, Brott T, Kothari R, et al. The Greater Cincinnati/Northern Kentucky Stroke Study: preliminary first-ever and total incidence rates of stroke among blacks. Stroke. 1998;29(2):415-421. doi: 10.1161/01.str.29.2.415 [DOI] [PubMed] [Google Scholar]
- 10.Kleindorfer D, Khoury J, Alwell K, et al. The impact of magnetic resonance imaging (MRI) on ischemic stroke detection and incidence: minimal impact within a population-based study. BMC Neurol. 2015;15(1):175. doi: 10.1186/s12883-015-0421-2 [DOI] [PMC free article] [PubMed] [Google Scholar]
- 11.Sekar P, Flaherty M, Woo D, Buncher R. A Macro for the Calculation of Age, Gender and Race Adjusted Incidence and Mortality Rates. Accessed June 10, 2021. lexjansen.com/mwsug/2005/Pharmaceutical_Healthcare/PH600.pdf. [Google Scholar]
- 12.Kleindorfer D, Panagos P, Pancioli A, et al. Incidence and short-term prognosis of transient ischemic attack in a population-based study. Stroke. 2005;36(4):720-723. doi: 10.1161/01.STR.0000158917.59233.b7 [DOI] [PubMed] [Google Scholar]
- 13.Levine DA, Duncan PW, Nguyen-Huynh MN, Ogedegbe OG. Interventions targeting racial/ethnic disparities in stroke prevention and treatment. Stroke. 2020;51(11):3425-3432. doi: 10.1161/STROKEAHA.120.030427 [DOI] [PMC free article] [PubMed] [Google Scholar]
- 14.Koton S, Sang Y, Schneider ALC, Rosamond WD, Gottesman RF, Coresh J. Trends in stroke incidence rates in older US adults: an update from the Atherosclerosis Risk in Communities (ARIC) cohort study. JAMA Neurol. 2020;77(1):109-113. doi: 10.1001/jamaneurol.2019.3258 [DOI] [PMC free article] [PubMed] [Google Scholar]
- 15.Lisabeth LD, Brown DL, Zahuranec DB, et al. Temporal trends in ischemic stroke rates by ethnicity, sex, and age 2000-2017: the brain attack surveillance in Corpus Christi Project. Neurology. 2021;97(22):e2164-e2172. doi: 10.1212/WNL.0000000000012877 [DOI] [PMC free article] [PubMed] [Google Scholar]
- 16.Morgenstern LB, Smith MA, Sánchez BN, et al. Persistent ischemic stroke disparities despite declining incidence in Mexican Americans. Ann Neurol. 2013;74(6):778-785. doi: 10.1002/ana.23972 [DOI] [PMC free article] [PubMed] [Google Scholar]
- 17.Muntner P, Hardy ST, Fine LJ, et al. Trends in blood pressure control among US adults with hypertension, 1999-2000 to 2017-2018. JAMA. 2020;324(12):1190-1200. doi: 10.1001/jama.2020.14545 [DOI] [PMC free article] [PubMed] [Google Scholar]
- 18.Flaherty ML, Kissela B, Woo D, et al. The increasing incidence of anticoagulant-associated intracerebral hemorrhage. Neurology. 2007;68(2):116-121. doi: 10.1212/01.wnl.0000250340.05202.8b [DOI] [PubMed] [Google Scholar]
- 19.Robinson D, Van Sanford C, Kwon SY, et al. What is the median volume of intracerebral hemorrhage and is it changing? Int J Stroke. 2022;17(5):576-582. doi: 10.1177/17474930211032594 [DOI] [PubMed] [Google Scholar]
- 20.Mackey J, Khoury JC, Alwell K, et al. Stable incidence but declining case-fatality rates of subarachnoid hemorrhage in a population. Neurology. 2016;87(21):2192-2197. doi: 10.1212/WNL.0000000000003353 [DOI] [PMC free article] [PubMed] [Google Scholar]
Associated Data
This section collects any data citations, data availability statements, or supplementary materials included in this article.
Data Availability Statement
Data will be shared on request with qualified investigators.