

Significance
This study showed that high-fat diet (HFD)-related gut microbiota produces leucine to promote cancer progression by activating polymorphonuclear myeloid-derived suppressor cell (PMN-MDSC) production in breast cancer and melanoma models. The HFD microbiota released abundant leucine to induce PMN-MDSC production by triggering the mTORC1 signaling pathway in myeloid progenitors. Therefore, a “gut–bone marrow–tumor” axis was built in HFD-driven tumorigenesis. Our observations also indicated that the genus Desulfovibrio was enriched in the feces of overweight/obese patients and was positively correlated with tumor growth and fecal leucine and PMN-MDSC levels, suggesting that the genus Desulfovibrio is a critical component of the gut microbiota that drives cancer progression.
Keywords: high-fat diet, gut microbiota, breast cancer, myeloid-derived suppressor cells
Abstract
A high-fat diet (HFD) is a high-risk factor for the malignant progression of cancers through the disruption of the intestinal microbiota. However, the role of the HFD-related gut microbiota in cancer development remains unclear. This study found that obesity and obesity-related gut microbiota were associated with poor prognosis and advanced clinicopathological status in female patients with breast cancer. To investigate the impact of HFD-associated gut microbiota on cancer progression, we established various models, including HFD feeding, fecal microbiota transplantation, antibiotic feeding, and bacterial gavage, in tumor-bearing mice. HFD-related microbiota promotes cancer progression by generating polymorphonuclear myeloid-derived suppressor cells (PMN-MDSCs). Mechanistically, the HFD microbiota released abundant leucine, which activated the mTORC1 signaling pathway in myeloid progenitors for PMN-MDSC differentiation. Clinically, the elevated leucine level in the peripheral blood induced by the HFD microbiota was correlated with abundant tumoral PMN-MDSC infiltration and poor clinical outcomes in female patients with breast cancer. These findings revealed that the “gut–bone marrow–tumor” axis is involved in HFD-mediated cancer progression and opens a broad avenue for anticancer therapeutic strategies by targeting the aberrant metabolism of the gut microbiota.
High-fat intake and obesity rates are increasing globally. Notably, >33% of the adult American population is overweight or obese due to their high fat intake (1, 2). This population is also rapidly increasing in Asia (3). Consistent with this, the incidence of malignancy is gradually increasing, and a high-fat diet (HFD) and obesity are now considered critical but modifiable risk factors for several malignancies, including breast cancer, melanoma, and liver cancer (4–6). For example, obesity associated with dietary fat has been associated with breast cancer development in postmenopausal women (6), and approximately 30% of breast cancers in women are preventable by weight control, indicating an essential role of obesity in tumorigenesis (7). However, the mechanistic link between obesity and cancer development remains unclear.
Emerging data suggest that an HFD or obesity induces cancer by accumulating adipose tissue or alternating gut microbiota, leading to systemic changes in steroid hormones and adipokines production, metabolic disorders, and chronic subclinical inflammation (8–10). In addition, excessive adipose tissue accumulation may alter the immune microenvironment, causing adipose inflammation, immune cell infiltration, and massive production of adipokines, cytokines, and proteases that influence immune cell function (11). Notably, aberrant gut microbiota is also involved in drug resistance to chemotherapy, immune checkpoint inhibitors, and tyrosine kinase inhibitors in several nondigestive cancer types, such as breast cancer, lung cancer, and melanoma (12–15). Typically, patients with advanced-stage breast cancer have a higher abundance of Clostridium and Lachnospiraceae spp. in their feces than those with early-stage breast cancer, supporting the interplay between the gut microbiota and breast cancer progression (16). Furthermore, employing shotgun metagenomics, Terrisse et al. discovered that gut dysbiosis develops as breast cancer advances and is closely linked to an unfavorable prognosis (17). The accumulation of specific flora associated with breast cancer progression is correlated with the adverse effect of chemotherapy (17). However, whether HFD-mediated dysbiosis of the gut microbiota is involved in breast cancer tumorigenesis, the leading cancer type in women, and is strongly linked to obesity and HFD (7) and the underlying mechanisms remain unknown.
Herein, we propose that an HFD is correlated with the rapid progression and poor outcomes of breast cancer and melanoma. The HFD-mediated gut microbiota is involved in obesity-related tumorigenesis in these cancers. Mechanistically, the HFD-mediated gut microbiota produces additional leucine, which increases serum leucine levels. The mTORC1 signaling of myeloid progenitors (MPs) in the bone marrow is activated by additional leucine, which triggers polymorphonuclear myeloid-derived suppressor cell (PMN-MDSC) differentiation, ultimately promotes breast cancer progression through the “gut–bone marrow–tumor” axis.
Results
HFD Promotes Tumor Progression through Dysbiosis of Gut Microbiota.
In total, 5,031 patients with breast cancer were followed for 2 to 144 mo (median, 36 mo). The Kaplan–Meier (KM) curve revealed that patients with body mass index (BMI) ≤ 24 (n = 3,829) had a longer overall survival (OS, Fig. 1A) and disease-free survival (DFS, Fig. 1B) than those with BMI >24 (n = 1,202). In addition, the receiver operating characteristic (ROC) curve analysis revealed that BMI predicted the local recurrence of breast cancer [area under the curve (AUC): 0.59, Fig. 1C]. These observations are consistent with the finding that obesity is significantly associated with a higher breast cancer mortality in pre- and postmenopausal women (18). Notably, in patients with breast cancer undergoing chemotherapy, a BMI > 24 (n = 857) was significantly linked to a shorter OS (SI Appendix, Fig. S1A) and DFS (SI Appendix, Fig. S1B) compared to those with a BMI ≤ 24 (n = 2,833). This suggests that obesity might contribute to accelerating tumor progression or diminish the effectiveness of chemotherapy, ultimately leading to a poorer prognosis. Moreover, a high BMI was observed in patients with a Ki67 index > 14 (n = 4,141) compared with those with a Ki67 index ≤ 14 (n = 890) (SI Appendix, Fig. S1C); Ki67 is an indicator of the tumor growth rate. These results imply that obesity correlates with poor outcomes in patients with breast cancer through enhanced tumor growth.
Fig. 1.

HFD promotes tumor progression through gut microbiota dysbiosis. (A) The KM curve of OS for patients with breast cancer with BMI ≤ 24 (n = 3,829), 24 to 28 (n = 994), and >28 (n = 208). (B) The KM curve of DFS for patients with breast cancer with BMI ≤ 24 (n = 3,829), 24 to 28 (n = 994), and >28 (n = 208). (C) The ROC curve of the BMI for predicting local recurrence of patients with breast cancer (n = 5,031). (D) Linear discriminant analysis effect size (LEfSE) analysis showed statistically differential gut microbes at the genus level between patients with breast cancer with BMI > 24 (n = 20) and those with BMI ≤ 24 (n = 41). Taxa with a significant linear discriminant analysis (LDA) threshold value > 2 are shown. (E) Correlation analysis between differential gut genus and BMI index, Ki67, and tumor size (n (BMI >24) = 20, n (BMI ≤24) = 41). Red represents a positive correlation, and blue indicates a negative correlation. (F) Experimental procedure. For the normal-fat diet (NFD) and HFD model, 4-wk-old MMTV/PyMT mice were fed an NFD or HFD. For mice-derived fecal microbiota transplantation (FMT), 4-wk-old MMTV/PyMT mice were fed with feces from NFD or HFD wild type FVB mice. (G) Image of breast cancer from MMTV/PyMT mice with NFD, HFD, NFD mice-derived FMT (NDFMT), and HFD mice-derived FMT (HDFMT) (n = 6 per group). (H) Tumor growth curve of breast cancer from MMTV/PyMT mice with NFD, HFD, NDFMT, and HDFMT (n = 6 per group). (I) Experimental procedure: 4-wk-old HFD mice were treated with ampicillin (1 g/L), vancomycin (0.5 g/L), neomycin (1 g/L), and metronidazole (1 g/L), or placebo in drinking water as a control. (J) Image of breast cancer from MMTV/PyMT mice with HFD and HFD+A (n = 6 per group). (K) Tumor growth curve of breast cancer from MMTV/PyMT mice with HFD and HFD+A (n = 6 per group). (L) Experimental procedure: 4-wk-old HDFMT mice were treated with antibiotic cocktail or placebo in drinking water as a control. (M) Image of breast cancer from MMTV/PyMT mice with HDFMT and HDFMT+A (n = 6 per group). (N) Tumor growth curve of breast cancer from MMTV/PyMT mice with HDFMT and HDFMT+A (n = 6 per group). Data are presented as mean ± SEM; P values are calculated by Student’s t test or Tukey’s post hoc test. *P < 0.05; **P < 0.01; ***P < 0.001.
Then, the gut microbiota from 61 female patients with breast cancer was detected using 16S rRNA gene sequencing, which revealed that Eubacterium_coprostanoligenes_group, Desulfovibrio, and bacterium_Rhodospirillales increased dramatically in the feces from patients with BMI >24 (n = 20) compared with those with BMI ≤ 24 (n = 41) (Fig. 1D and SI Appendix, Table S1). Notably, most gut genera, including Desulfovibrio and bacterium_Rhodospirillales, elevated in patients with BMI > 24, belonged to the Proteobacteria family and were abundant in obese patients (19). Conversely, the abundance of genera Feacalimonas, Solobacterium, and Gemella was significantly decreased in feces from patients with BMI > 24 compared with those with BMI ≤ 24 (Fig. 1D). Moreover, the abundance of Desulfovibrio was positively correlated with tumor size and Ki67-positivity in these patients (Fig. 1E). These results revealed a correlation between obesity and obesity-related gut microbiota with tumor growth and poor outcomes in patients with breast cancer, suggesting that changes in the intestinal microbiota is vital in obesity-induced cancer development.
Next, normal-fat diet (NFD), HFD, NDFMT, and HDFMT models were constructed using MMTV/PyMT mice to evaluate the role of obesity-related gut microbiota in breast cancer progression (Fig. 1F). Our observations revealed that both HFD and HDFMT significantly expedited breast tumor progression in these mice compared to the NFD and NDFMT (Fig. 1 G and H and SI Appendix, Fig. S1D), aligning with recent study findings (20). However, no notable difference in tumor count was observed between the NFD, HFD, NDFMT, and HDFMT groups (SI Appendix, Fig. S1E). As anticipated, HFD markedly increased body weight compared to NFD (SI Appendix, Fig. S1F). Nevertheless, there was no significant difference in body weight between the NFD and HDFMT groups (SI Appendix, Fig. S1F), indicating that the accelerated tumor growth rate was attributable to obesity and HFD-induced alterations in intestinal microbiota. Therefore, HFD mice were fed an antibiotic cocktail (HFD+A, Fig. 1I) to eliminate HFD-mediated gut microbial changes. It revealed that antibiotic cocktail gavage diminished the HFD-promoted breast tumor growth (Fig. 1 J and K and SI Appendix, Fig. S1G) without affecting body weight (SI Appendix, Fig. S1H). Similarly, an antibiotic cocktail gavage of HDFMT mice (HDFMT+A, Fig. 1L) attenuated HDFMT-promoted breast tumor growth (Fig. 1 M and N and SI Appendix, Fig. S1I), but did not affect body weight (SI Appendix, Fig. S1J). In addition to breast cancers, B16 melanoma xenograft model was used. Notably, HFD and HDFMT markedly accelerated tumor progression (SI Appendix, Fig. S1 K–M). Moreover, antibiotic treatment abolished rapid melanoma tumor growth in the HFD cohort (SI Appendix, Fig. S1 N–P). These results revealed that the HFD promoted tumor progression through gut microbiota dysbiosis.
HFD-Mediated Gut Microbiota Dysbiosis Promotes Tumor Progression Via PMN-MDSCs.
The feces of mice were collected at the end of diet feeding and subjected to 16S rRNA gene sequencing to further explore the genera of the gut microbiota involved in enhancing tumor growth. The data composition showed that at the genus level, the gut microbiota of NFD and HFD mice mainly comprised bacterium_Bacteroidales_S24-7_group, Lachnospiraceae_NK4A136_group, and Bacteroides (Fig. 2A) and displayed a distinct community composition (R2:0.341; P-value = 0.001, and SI Appendix, Fig. S2A). LEfSe analysis revealed that HFD mice showed a significant increase in the genera Blautia, Desulfovibrio, bacterium_Ruminococcaceae, Ruminiclostridium, and Ruminiclostridium_9 and a decrease in the bacterium_f_Bacteroidales_S24_7_group, Lachnospiraccae_NK4A136_group, and Alloprevotella compared with NFD mice (Fig. 2B). Similarly, the abundance of Desulfovibrio was increased in overweight/obese patients with breast cancer (Fig. 1D).
Fig. 2.
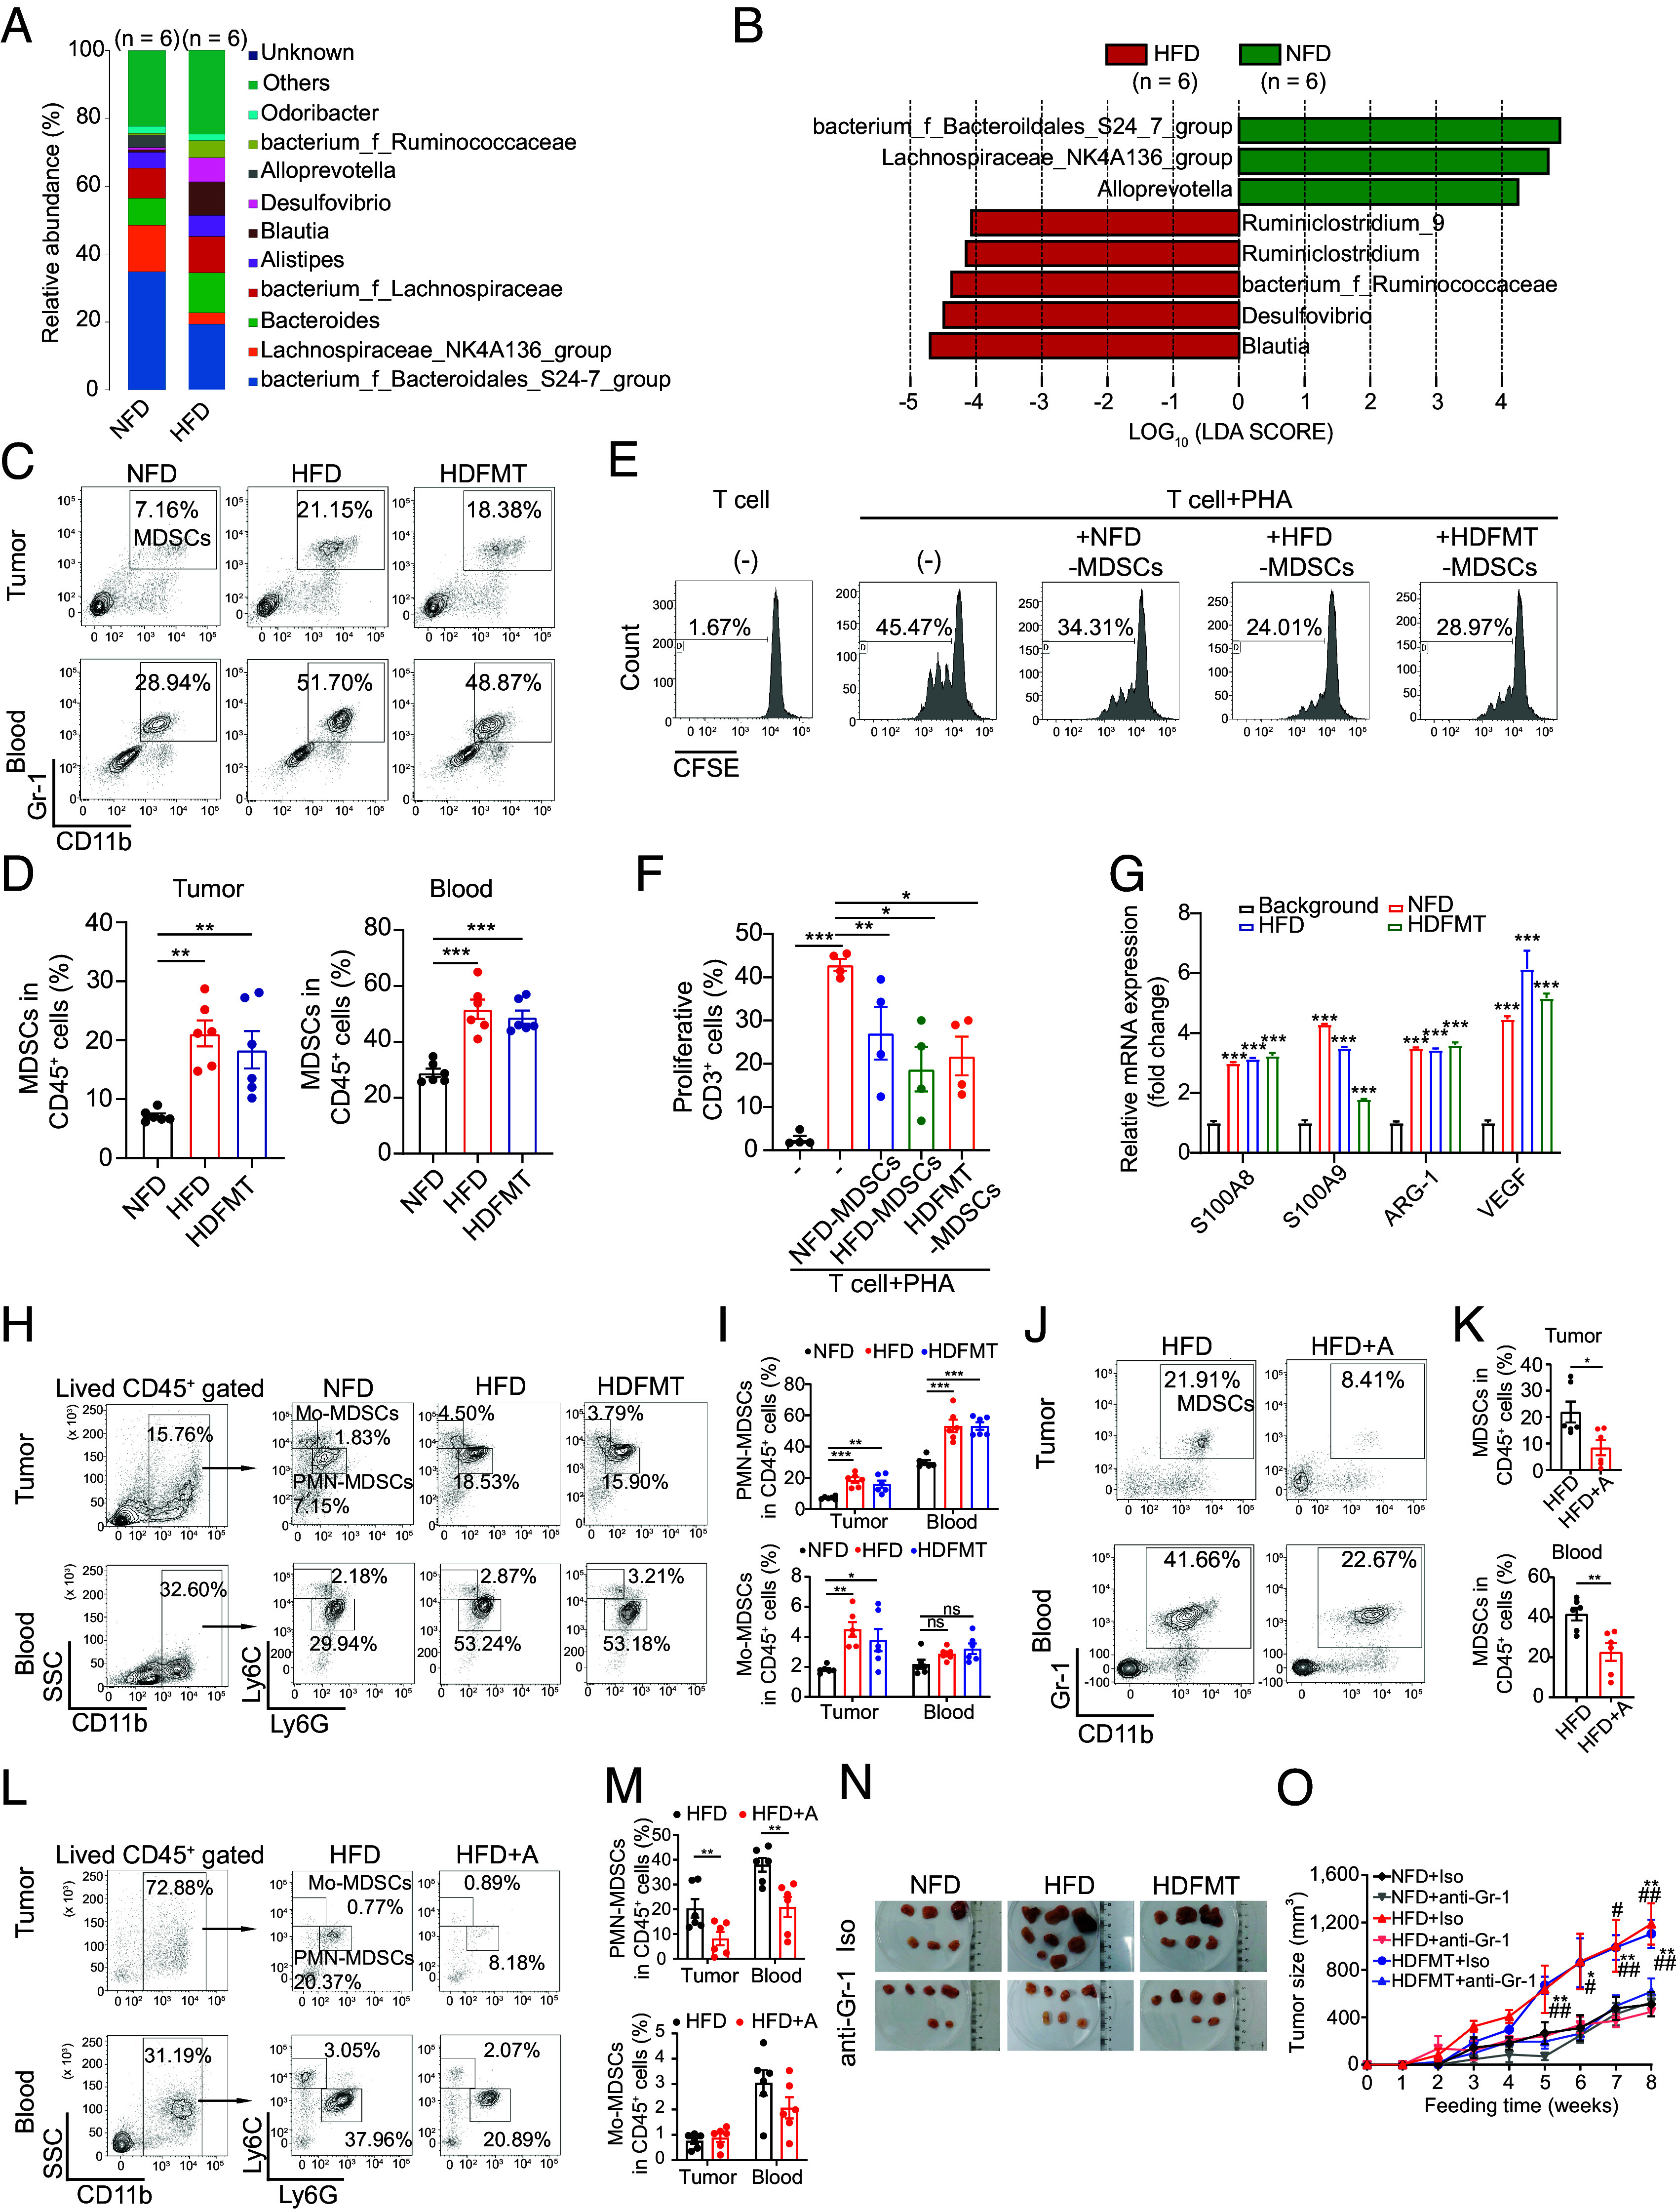
HFD-mediated gut microbiota dysbiosis promotes tumor progression through PMN-MDSCs. (A) Bacterial taxonomic profiling at the genus level of gut microbiota from NFD and HFD (n = 6 per group). (B) LEfSe analysis shows statistically differential gut microbes between NFD and HFD mice at the genus level. Taxa with a significant LDA threshold value > 2 are shown (n = 6 per group). (C) The percentage of MDSCs in breast tumor tissue and circulation from NFD, HFD, and HDFMT groups was determined using flow cytometry (n = 6 per group). (D) Scatter plots represent the percentage of MDSCs in breast tumor tissue (Left) and circulation (Right) (n = 6 per group). (E) MDSCs sorted from NFD, HFD, or HDFMT breast tumor tissue were cocultured with CD3+ T cells, and the proliferation of CD3+ T cells was detected using carboxyfluorescein succinimidyl ester (CFSE) staining examinations through flow cytometry. n = 4 independent experiments of MDSCs from NFD, HFD, and HDFMT mice. (F) The scatter plot represents the percentage of proliferative CD3+ T cells. n = 4 independent experiments. (G) Messenger RNA (mRNA) levels of S100A8, S100A9, ARG-1, and VEGF from sorted CD11b+ Gr-1+ cells from the background, NFD, HFD, or HDFMT breast tumor tissue were determined using qRT-PCR. All values are means ± SEM, n = 3 independent experiments. (H) The percentage of PMN-MDSCs (CD45+ CD11b+ Ly6C− Ly6G+ cells) and Mo-MDSCs (CD45+ CD11b+ Ly6Chigh Ly6G− cells) in breast tumor tissue and circulation from NFD, HFD and HDFMT groups was determined using flow cytometry (n = 6 per group). (I) Scatter plots represent the percentage of PMN-MDSCs (Upper) and Mo-MDSCs (Bottom) in breast tumor tissue and circulation (n = 6 per group). (J) The percentage of MDSCs in the tumor and circulation in the HFD and HFD+A groups was determined using flow cytometry (n = 6 per group). (K) Scatter plots represent the percentage of MDSCs in the tumor (Upper) and circulation (Bottom, n = 6 per group). (L) The percentage of PMN-MDSC and Mo-MDSC in breast tumor tissue and circulation from the HFD and HFD+A groups was determined using flow cytometry (n = 6 per group). (M) Scatter plots represent the percentage of PMN-MDSCs (upper) and Mo-MDSCs (button) in breast tumor tissue and circulation (n = 6 per group). (N) A representative picture of breast tumors from NFD, HFD, and HDFMT groups with anti-Isotype or anti-Gr-1 antibodies (n = 5 per group). (O) Tumor growth curve of breast cancer from NFD, HFD, and HDFMT groups with anti-Isotype or anti-Gr-1 antibody application (n = 5 per group). Data are presented as mean ± SEM; P values are calculated by Student’s t test or Tukey’s post hoc test. *P < 0.05; **P < 0.01; ***P < 0.001.
The HFD-related gut microbiota alters the tumor microenvironment, especially immune cells, influencing cancer progression (21). Screening of immune cells in tumor tissue revealed that the number of MDSCs was predominantly increased in breast tumor tissue and the HFD and HDFMT mice circulation, compared with that in NFD mice (Fig. 2 C and D and SI Appendix, Fig. S2B). MDSCs are generated in the bone marrow and migrate to the tumor foci to shape the immunosuppressive microenvironment (22). Phenotypically, MDSCs are mainly categorized into mononuclear MDSCs (Mo-MDSCs, characterized as CD45+ CD11b+ Ly6Chigh Ly6G− cells in mice) and polymorphonuclear MDSCs (PMN-MDSC, characterized as CD45+ CD11b+ Ly6Clow Ly6G+ cells in mice) (23). We found that MDSCs from NFD, HFD, and HDFMT tumor-bearing mice suppressed CD3+ T cell proliferation (Fig. 2 E and F). Also, MDSCs from NFD, HFD, and HDFMT tumor-bearing mice expressed higher levels of immunosuppressive markers, such as S100A8, S100A9, ARG-1, and VEGF (22), than those of CD11b+ cells from background mice without cancer burden (Fig. 2G), suggesting that these CD11b+Gr-1+ cells from tumor sites could be functionally acknowledged as MDSCs. Specifically, we further explored which MDSC subtypes were elevated in the HFD and HDFMT models. It revealed a significant elevation in PMN-MDSCs both within the tumor and circulating in the HFD and HDFMT groups, in comparison to the NFD groups (Fig. 2 H and I and SI Appendix, Fig. S2C). Notably, the increased levels of tumor-infiltrating and circulating MDSCs, particularly PMN-MDSCs, were reversed with antibiotic treatment in HFD (Fig. 2 J−M) and HDFMT mice (SI Appendix, Fig. S2 D−G). This underscores the pivotal role of gut microbiota dysbiosis in augmenting MDSC numbers in HFD mice. Consistently, elevated levels of tumor-infiltrating and circulating MDSCs, especially PMN-MDSCs were observed in HFD and HDFMT melanoma-transplanted mice compared with those in NFD or HFD+A mice (SI Appendix, Fig. S2 H−K). Consistently, Also, MDSCs from melanoma expressed higher levels of S100A8, S100A9, ARG-1, and VEGF than those of CD11b+ cells from background mice (SI Appendix, Fig. S2L).
Neutralizing anti-Gr-1 antibodies were used to deplete internal MDSCs (SI Appendix, Fig. S2 M−O) to investigate whether the HFD-mediated gut microbiota promotes tumor growth through MDSCs, which significantly hampered breast tumor growth in the HFD and HDFMT mice (Fig. 2 N and O). These results suggest that HFD-related microbiota promotes tumor progression through MDSCs.
HFD-Mediated Microbiota Dysbiosis Triggers PMN-MDSC Production.
Next, we explored why HFD and the associated intestinal microbiota led to increased tumoral and circulating PMN-MDSCs. MDSCs are derived from MPs in the bone marrow stimulated by the colony-stimulating factor (CSF) and recruited to tumors through the circulation in response to chemokines such as CXCL1 and CXCL12 (Fig. 3A) (23). However, no significant differences were observed in CSF, CXCL1, CXCL12, or other cytokines or chemokines between the tumors or intestinal tissues of NFD- vs. HFD- and HDFMT-treated mice (SI Appendix, Fig. S3 A and B). The increased numbers of PMN-MDSCs in the peripheral blood and tumors in the HFD and HDFMT groups could be attributed to the increased generation of MDSCs in HFD and HDFMT mice. Common MPs (CMPs) in the bone marrow give rise to megakaryocyte-erythrocyte progenitors (MEPs) or granulocyte-macrophage progenitors (GMPs), which in turn differentiate into MDSCs, known as immunosuppressive and immature myeloid cells, during cancer onset (Fig. 3A). We found that GMP population (characterized as lineage− ckit+ Sca-1− CD34+ FcγR+ cells) increased in HFD and HDFMT groups compared with that in the NFD groups (Fig. 3 B and C). However, antibiotic treatment reduced the GMP population in the HFD (Fig. 3 D and E) and HDFMT (Fig. 3 F and G) groups. However, no significant difference was observed in the percentage of ki67-positive GMPs among NFD, HFD, and HDFMT mice (SI Appendix, Fig. S3 C and D), suggesting that HFD and associated intestinal microbiota did not affect the proliferative capacity of GMP cells. These results support the hypothesis that HFD-mediated gut microbiota dysbiosis promotes MP differentiation toward GMP in the bone marrow.
Fig. 3.
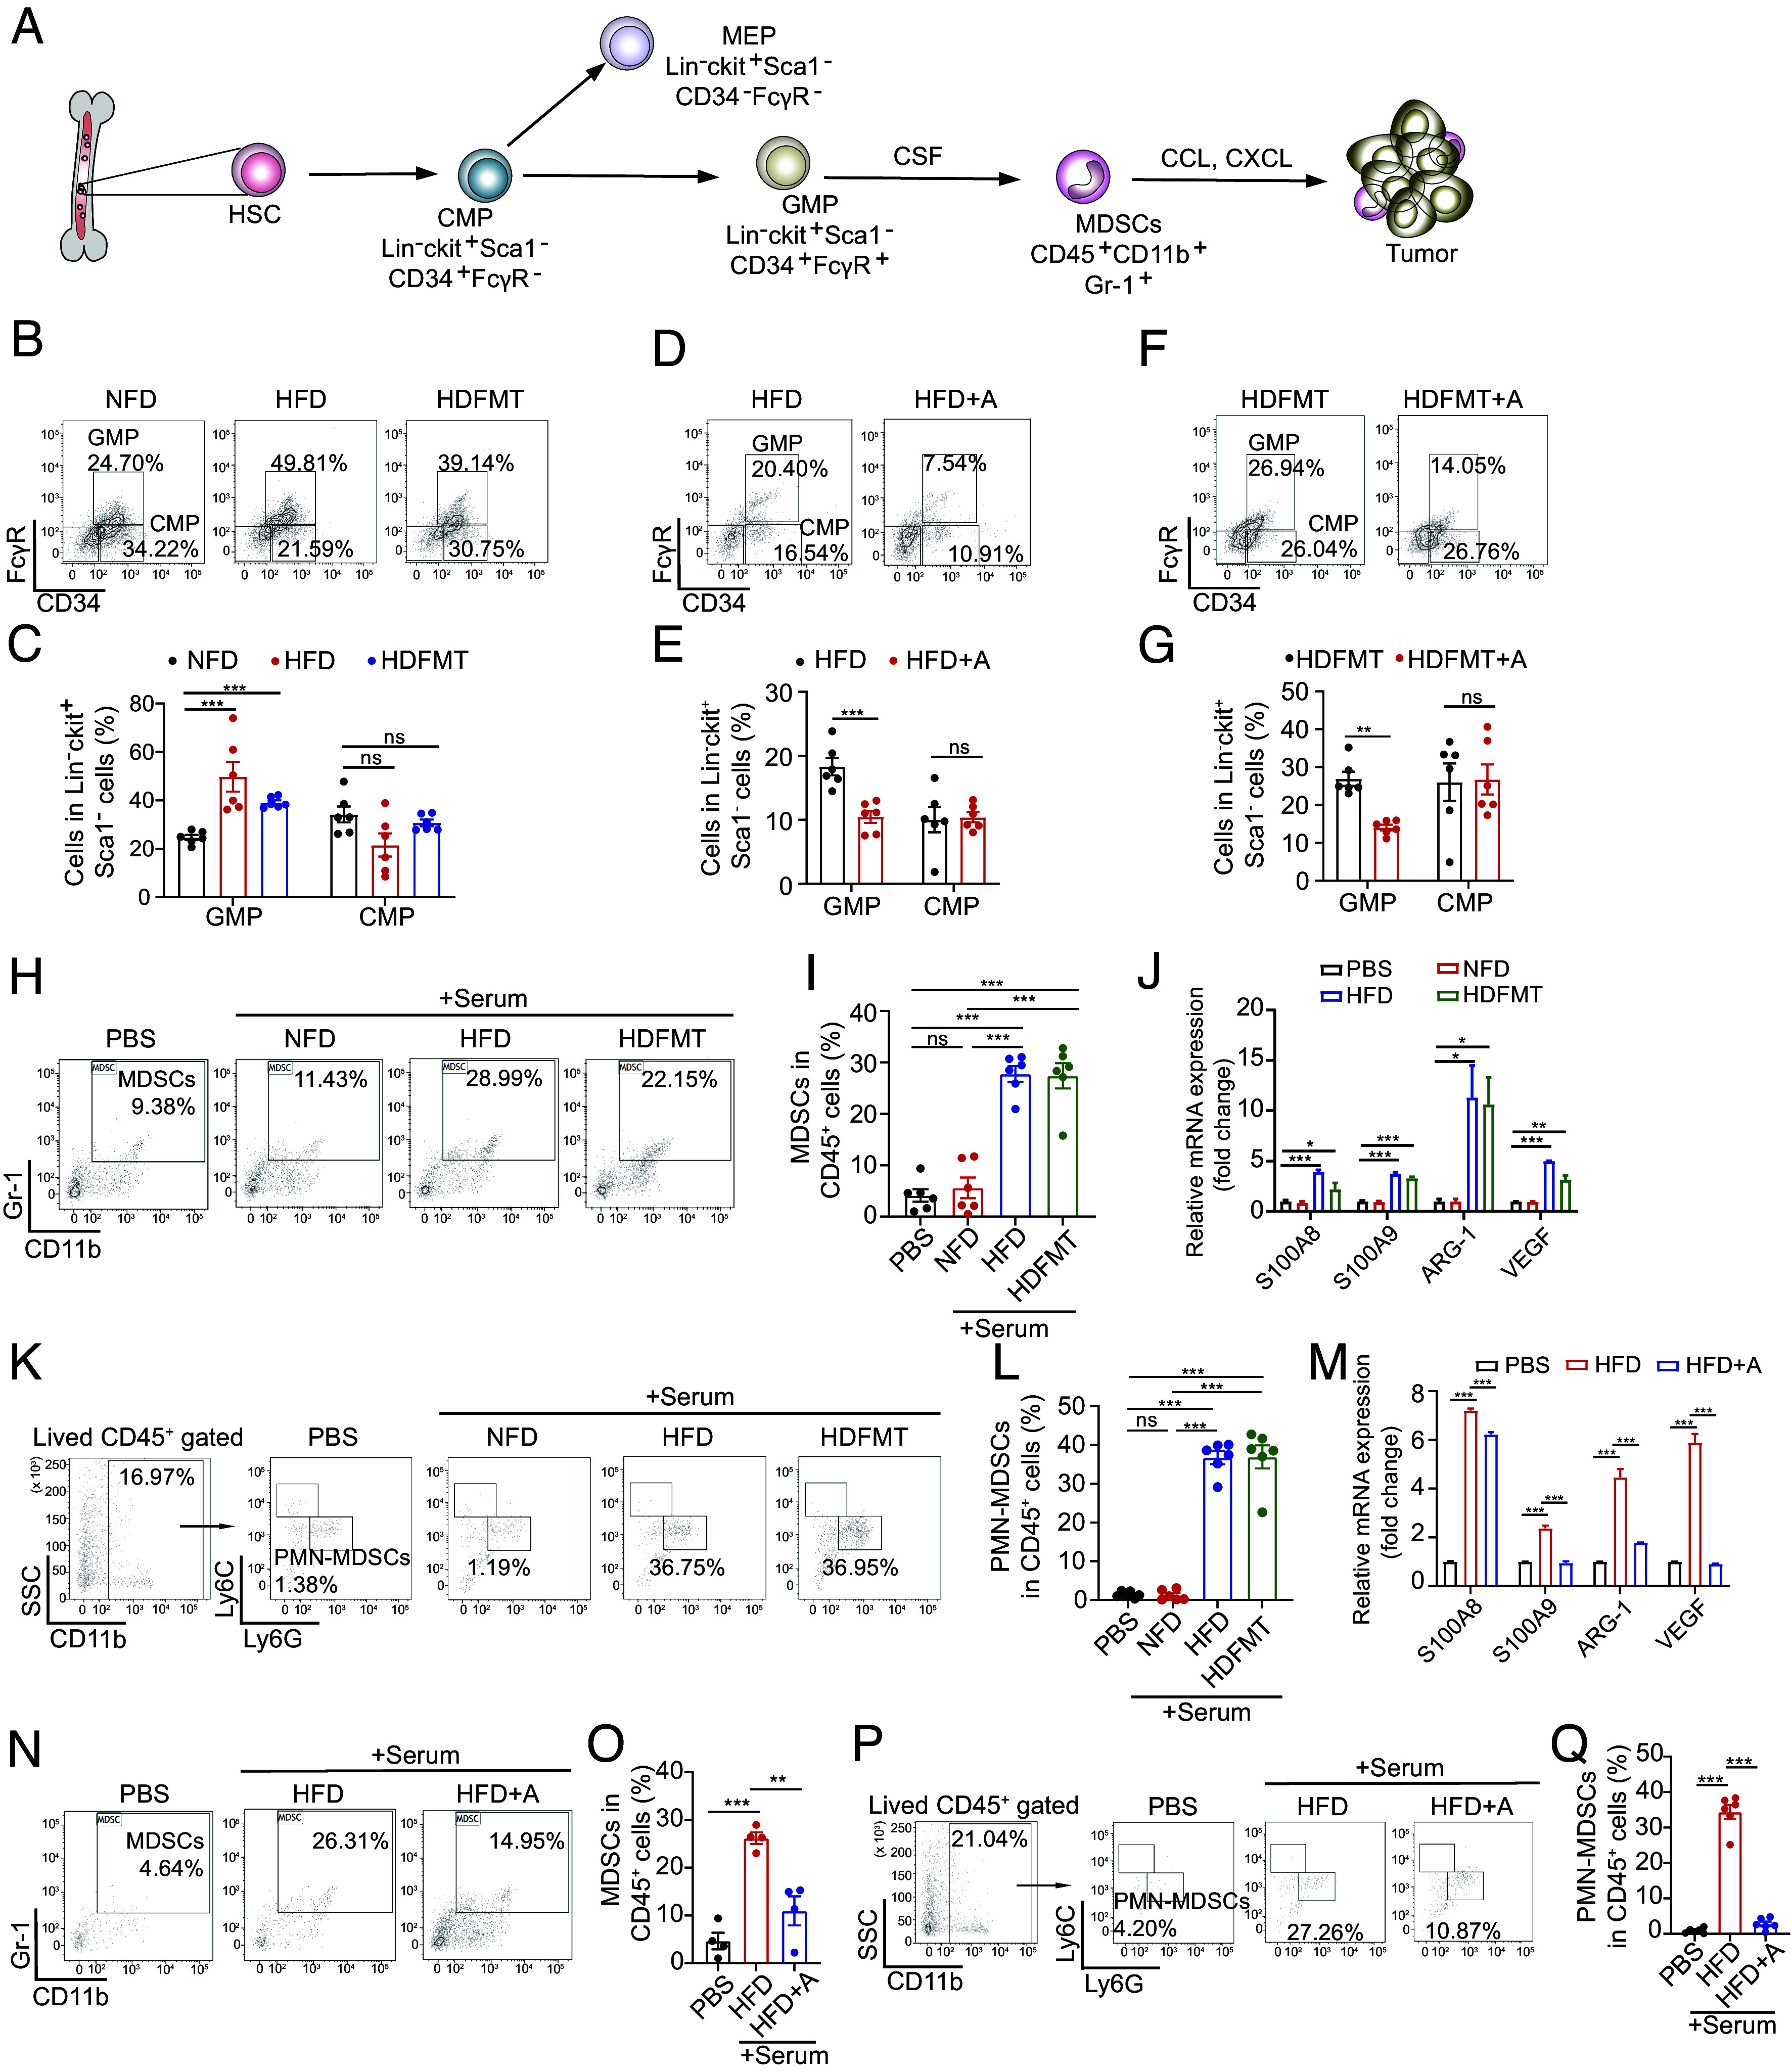
HFD-mediated microbiota dysbiosis triggers PMN-MDSC production. (A) Schematic of MDSCs generation and recruitment. (B) The percentage of CMPs and GMPs in the bone marrow of mice with breast tumor burden from NFD, HFD, and HDFMT groups was determined using flow cytometry (n = 6 per group). (C) The scatter plot represents the percentage of CMPs and GMPs in bone marrow from mice (n = 6 per group). (D) The percentage of CMPs and GMPs in the bone marrow of mice with breast tumor burden from HFD and HFD+A groups was determined using flow cytometry (n = 6 per group). (E) The scatter plot represents the percentage of CMPs and GMPs in the bone marrow of mice (n = 6 per group). (F) The percentage of CMPs and GMPs in the bone marrow of mice with breast tumor burden from HDFMT and HDFMT+A groups was determined using flow cytometry (n = 6 per group). (G) The scatter plot represents the percentage of CMPs and GMPs in the bone marrow of mice (n = 6 per group). (H) MPs were treated with phosphate-buffered saline (PBS) and sera from NFD, HFD, and HDFMT mice (breast cancer burdened). The percentage of generated MDSCs was determined by flow cytometry. (I) The scatter plot represents the percentage of generated MDSCs. n = 6 independent experiments of PBS, sera from NFD, HFD, and HDFMT mice. (J) mRNA levels of S100A8, S100A9, ARG-1, and VEGF of MPs treated with PBS, sera from NFD, HFD, and HDFMT mice (breast cancer burdened) were determined using qRT-PCR. All values are means ± SEM, n = 3 independent experiments. (K) The percentage of PMN-MDSCs induced by PBS, sera from NFD, HFD, and HDFMT mice was determined using flow cytometry. n = 6 independent experiments of PBS, sera from NFD, HFD, and HDFMT mice. (L) A scatter plot represents the percentage of generated PMN-MDSCs. n = 6 independent experiments. (M) mRNA level of S100A8, S100A9, ARG-1, and VEGF of MP cells treated with PBS, sera from HFD, and HFD+A mice (breast cancer burdened) was determined using qRT-PCR. All values are means ± SEM, n = 3 independent experiments. (N) MPs were treated with PBS and sera from HFD and HFD+A mice (breast cancer-burdened). The percentage of generated MDSCs was determined by flow cytometry. n = 6 independent experiments of PBS, sera from HFD and HFD+A mice. (O) A scatter plot represents the percentage of generated MDSCs. n = 6 independent experiments. (P) The percentage of PMN-MDSCs induced by PBS, sera from HFD and HFD+A mice was determined using flow cytometry. n = 6 independent experiments of PBS, sera from HFD and HFD+A mice. (Q) A scatter plot represents the percentage of generated PMN-MDSCs. n = 6 independent experiment. Data are presented as mean ± SEM; P values are calculated by Student’s t test or Tukey’s post hoc test. *P <0.05; **P <0.01; ***P <0.001.
Moreover, sorted MP cells from background mice were treated with sera collected from NFD, HFD, or HDFMT mice. Notably, the sera from either HFD or HDFMT mice promoted MP cell differentiation toward MDSCs (Fig. 3 H and I), especially PMN-MDSCs (Fig. 3 K–L), compared with the sera from NFD mice. In addition, MP cells treated with the sera from either HFD- or HDFMT mice overexpressed MDSC-specific factors compared with NFD mice sera (Fig. 3J). Consistently, sera from HFD+A mice did not induce MP cell differentiation toward MDSCs (Fig. 3 N and O), especially PMN-MDSCs (Fig. 3 P-Q). Notably, PMN-MDSCs induced by the sera from both HFD or HDFMT mice were characterized as CXCR2low, distinguishing them from neutrophils (CXCR2high, SI Appendix, Fig. S3 E and F) (24). Furthermore, neither sera collected from HFD nor HDFMT mice could induce the differentiation of MP cells toward dendritic cells (DCs, CD11b+ CD11c+ cells, SI Appendix, Fig. S3 G and H). Consistently, the level of GMPs was dramatically increased in HFD and HDFMT B16 tumor-bearing mice compared with that in NFD and HFD+A mice (SI Appendix, Fig. S3 I and J). As expected, sera from HFD and HDFMT B16 tumor-bearing mice induced differentiation of MPs toward MDSCs in vitro (SI Appendix, Fig. S3 K–M). These results suggest that the increased population of MDSCs in HFD and HDFMT mice was due to the enhanced differentiation of MP cells toward MDSCs in the bone marrow induced by specific factors in the serum.
HFD-Mediated Dominant Microbes Produce Leucine to Enhance PMN-MDSC Differentiation and Tumor Progression.
We further aimed to determine the factors that promoted MDSC production in the HFD and HDFMT models. CSFs have been reported to trigger MDSC production. However, serum M-CSF, G-CSF, and GM-CSF levels did not differ among the NFD, HFD, and HDFMT groups (SI Appendix, Fig. S4A). Next, we aimed to identify the factors in sera that triggered MP cell differentiation toward MDSCs. Microbiota metabolites are involved in gut microbiota dysbiosis-induced tumorigenesis and can affect the bone marrow cell cladogram (25). Therefore, 96 host and microbiota cometabolite levels in the feces of diet-fed mice were profiled using mass spectrometry. Partial least squares-discriminant analysis (PLS-DA) showed that fecal metabolite composition of HFD mice was significantly different from that of NFD mice (SI Appendix, Fig. S4B), and 30 metabolites were significantly different between NFD- and HFD-derived feces (Fig. 4A). Notably, the levels of branched-chain amino acids (BCAAs), including L-leucine, L-valine, and L-isoleucine, were significantly higher in the HFD-derived feces than in the NFD feces (Fig. 4 A and B). In addition, serum concentrations of leucine, isoleucine, and valine in the HFD and HDFMT groups were significantly higher than those in the NFD group (Fig. 4C). The topology map generated using MetaboAnalyst (www.metaboanalyst.ca) consistently revealed that valine, isoleucine, and leucine biosynthesis were the most significantly up-regulated metabolic pathways (Fig. 4D).
Fig. 4.
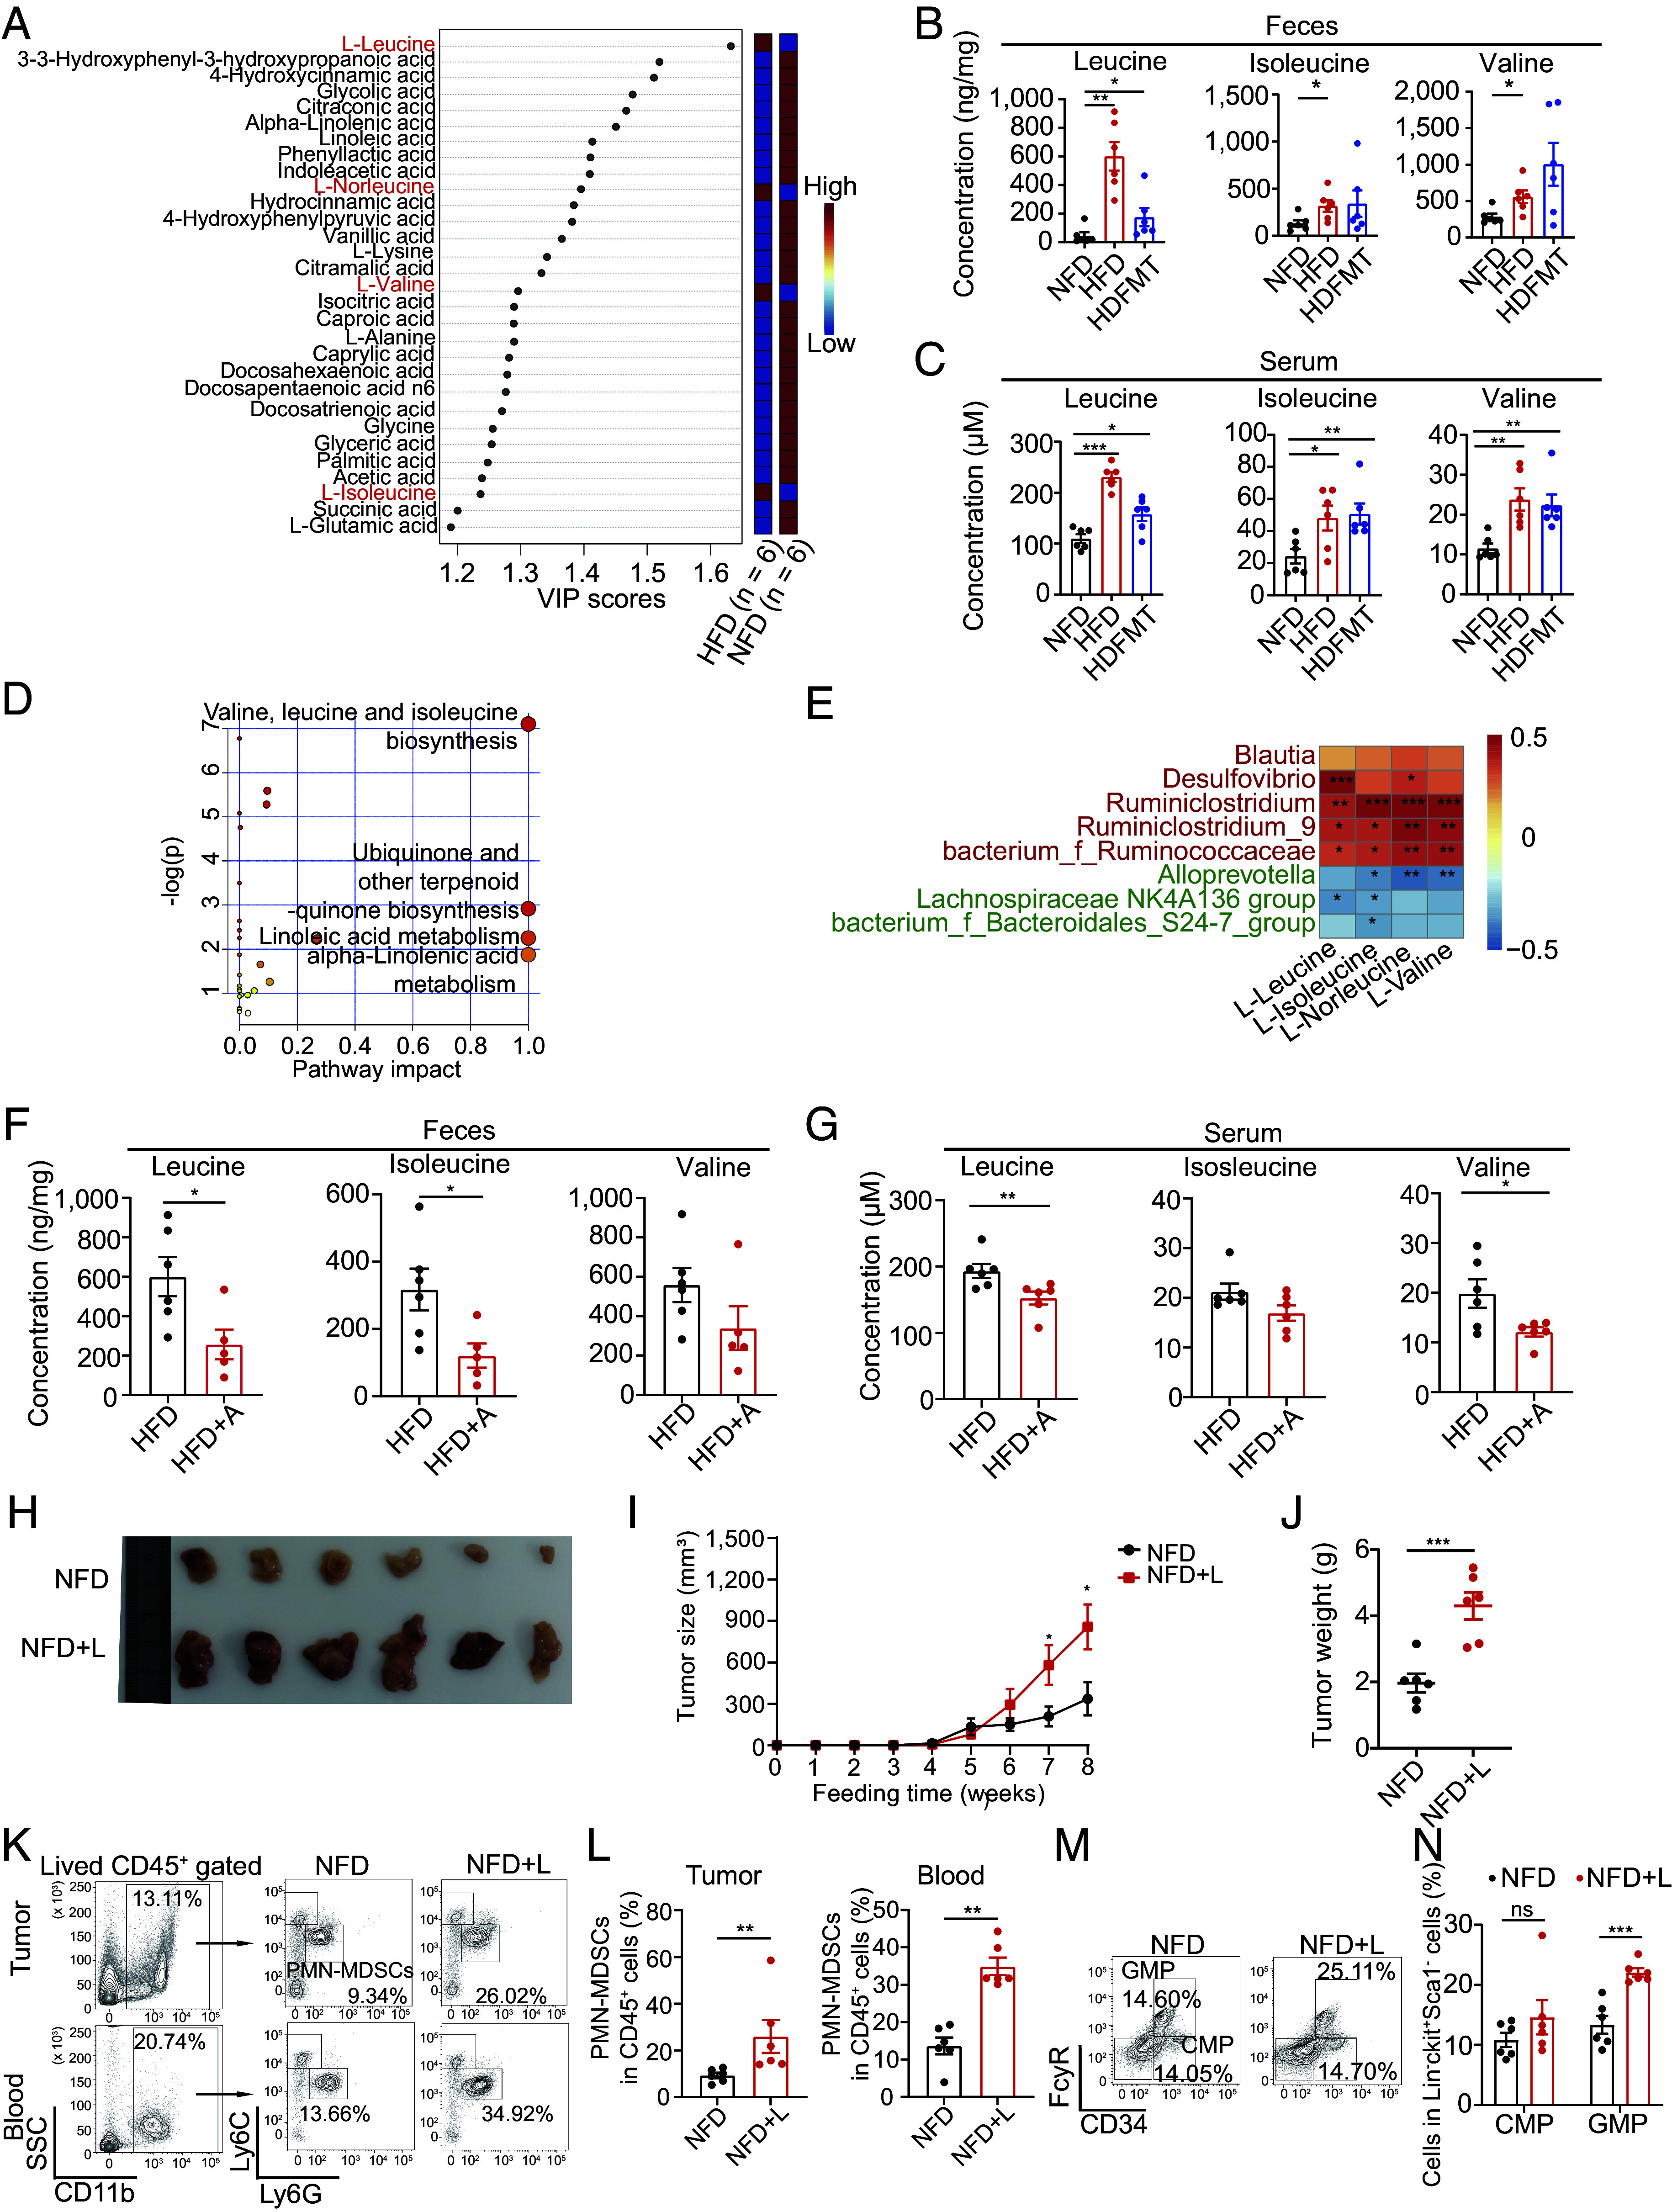
HFD-mediated dominant microbes produce leucine to increase PMN-MDSC reproduction and tumor progression. (A) The variance importance in projection (VIP) score plot displays the 30 critical metabolites differentiating NFD and HFD (n = 6 per group). (B) The concentration of leucine, isoleucine, and valine in feces of NFD, HFD, and HDFMT groups (n = 6 per group). (C) The concentration of leucine, isoleucine, and valine in the serum of NFD, HFD, and HDFMT groups (n = 6 per group). (D) Metabolic pathway analysis plot drawn using MetaboAnalyst 4.0 depicts several metabolic pathway alterations induced by HFD. (E) Heatmap analysis of Spearman’s correlation of fecal BCAAs and differential genus. Red represents a positive correlation, and blue indicates a negative correlation (total: n = 12). (F) Leucine, isoleucine, and valine concentration in the feces of HFD and HFD+A groups (n = 6 per group). (G) Leucine, isoleucine, and valine concentration in the serum of HFD and HFD+A groups (n = 6 per group). (H) A representative picture of breast tumors from NFD and NFD+L groups (n = 6 per group). (I) Breast tumor growth curve from NFD and NFD+L groups (n = 6 per group). (J) A dot plot represents the average weight of breast tumors per mouse from the NFD and NFD+L groups (n = 6 per group). (K) The percentage of PMN-MDSCs in tumor and circulation in the NFD and NFD+L groups was determined using flow cytometry (n = 6 per group). (L) Scatter plots represent the percentage of PMN-MDSCs in breast tumor tissue (Left) and circulation (Right) (n = 6 per group). (M) The percentage of CMP and GMP cells in the bone marrow of mice with breast tumor burden from NFD and NFD+L groups was determined using flow cytometry (n = 6 per group). (N) The scatter plots represent the percentage of CMP and GMP cells in bone marrow from mice with breast tumor burden (n = 6 per group). Data are presented as mean ± SEM; P values are calculated by Student’s t test or Tukey’s post hoc test. *P < 0.05; **P < 0.01; ***P < 0.001.
The increased BCAA levels in the feces and serum of HFD and HDFMT mice may have resulted from an increased supply of gut microbiota, gut intake, or decreased consumption in mice. However, the latter two possibilities were excluded based on the finding that the levels of system B(0) transmembrane protein 1 (B0AT1, a transporter of BCAAs, encoded by SLC6A19) were similar in the intestinal tract (SI Appendix, Fig. S4C). The levels of BCAA catabolism-related enzymes (including BCKDHA, ACADS, and ACADSB) were similar in the livers of the mice in each diet group (SI Appendix, Fig. S4D). Therefore, we propose that the increased BCAAs in the serum and feces might be derived from the HFD-related gut microbiota. Consistent with this, the concentrations of fecal leucine, isoleucine, and valine were significantly positively correlated with the increased abundance of genera in the HFD mice: Desulfovibrio and Ruminiclostridium (Fig. 4E). In addition, antibiotic administration to HFD or HDFMT mice resulted in reduced levels of leucine and isoleucine in the feces (Fig. 4F and SI Appendix, Fig. S4E), leucine and valine (Fig. 4G and SI Appendix, Fig. S4F) in serum. When analyzing the genomes of different genera, we observed that those enriched in HFD-derived feces possessed integrated genes encoding BCAA biosynthesis-related enzymes. However, those down-regulated in HFD-derived feces possessed incomplete genes encoding BCAA biosynthesis-related enzymes (SI Appendix, Tables S3 and S4). These results suggest that elevated levels of BCAA could be attributed to high BCAA production by HFD-mediated dominant gut microbes.
Next, we speculated that the increased population of MDSCs and subsequently enhanced tumor growth in the HFD group were driven by elevated serum BCAAs produced by HFD-mediated dominant gut microbes. Upon assessing BCAA levels in the bone marrow compartment, we observed a significant increase in leucine, isoleucine, and valine in the supernatants derived from the bone marrow of HFD- and HDFMT-treated mice compared to those from NFD-treated mice (SI Appendix, Fig. S4G). Furthermore, leucine, isoleucine, and valine treatments were applied to MPs, which revealed that leucine dramatically triggered the differentiation of MPs toward PMN-MDSC cells (SI Appendix, Fig. S4 H and I). Remarkably, leucine facilitated concentration-dependent differentiation of MPs toward PMN-MDSCs (SI Appendix, Fig. S4 J and K). However, leucine did not induce MP cell differentiation toward neutrophils (SI Appendix, Fig. S4 L and M) or DC cells (SI Appendix, Fig. S4 N and O). In addition, leucine gavage (NFD+L) significantly promoted the progression of breast tumors (Fig. 4 H–J and SI Appendix, Fig. S4P). It increased the levels of tumor-infiltrating and circulating PMN-MDSCs (Fig. 4 K and L) and GMPs in the bone marrow (Fig. 4 M and N). Simultaneously, a similar effect of leucine gavage was observed in the melanoma-bearing mice (SI Appendix, Fig. S4 Q–U). Moreover, anti-Gr-1 neutralizing antibodies hampered tumor progression in mice treated by leucine gavage (SI Appendix, Fig. S4 V and W). These results suggest that HFD induces MDSC production and tumor progression through an elevated leucine supply from HFD-mediated dominant gut microbes.
HFD-Mediated Enrichment of Desulfovibrio Augments PMN-MDSC Production and Cancer Progression through Leucine Production.
To directly detect the regulatory role of HFD-enriched Desulfovibrio, germfree mice were applied to strains of Desulfovibrio desulfuricans (D. desulfuricans) gavage, which was considered a major type of the genus Desulfovibrio and was associated with obesity, followed by an orthotopic 4T1 breast cancer cell implantation (Fig. 5A). As expected, the D. desulfuricans gavage significantly accelerated tumor growth of 4T1 tumor-bearing mice (Fig. 5 B and C and SI Appendix, Fig. S5A) without affecting the body weight of mice (SI Appendix, Fig. S5B). These results suggested that D. desulfuricans is critical in the tumor-promoting process of HFD. In addition, D. desulfuricans gavage elevated the level of MDSC (Fig. 5 D and E), especially PMN-MDSC (Fig. 5 F and G), in tumor and circulation and GMP levels in bone marrow (Fig. 5 H and I). Simultaneously, there was no significant difference in the percentage of ki67-positive GMPs between control and D. desulfuricans gavage mice (SI Appendix, Fig. S5 C and D). As expected, elevated levels of leucine in the feces (Fig. 5J), serum (SI Appendix, Fig. S5E), and bone marrow supernatants (SI Appendix, Fig. S5F) were observed in germfree mice after D. desulfuricans gavage. These results suggest that Desulfovibrio, enriched in the HFD, can produce additional leucine to trigger MDSC production and cancer progression.
Fig. 5.
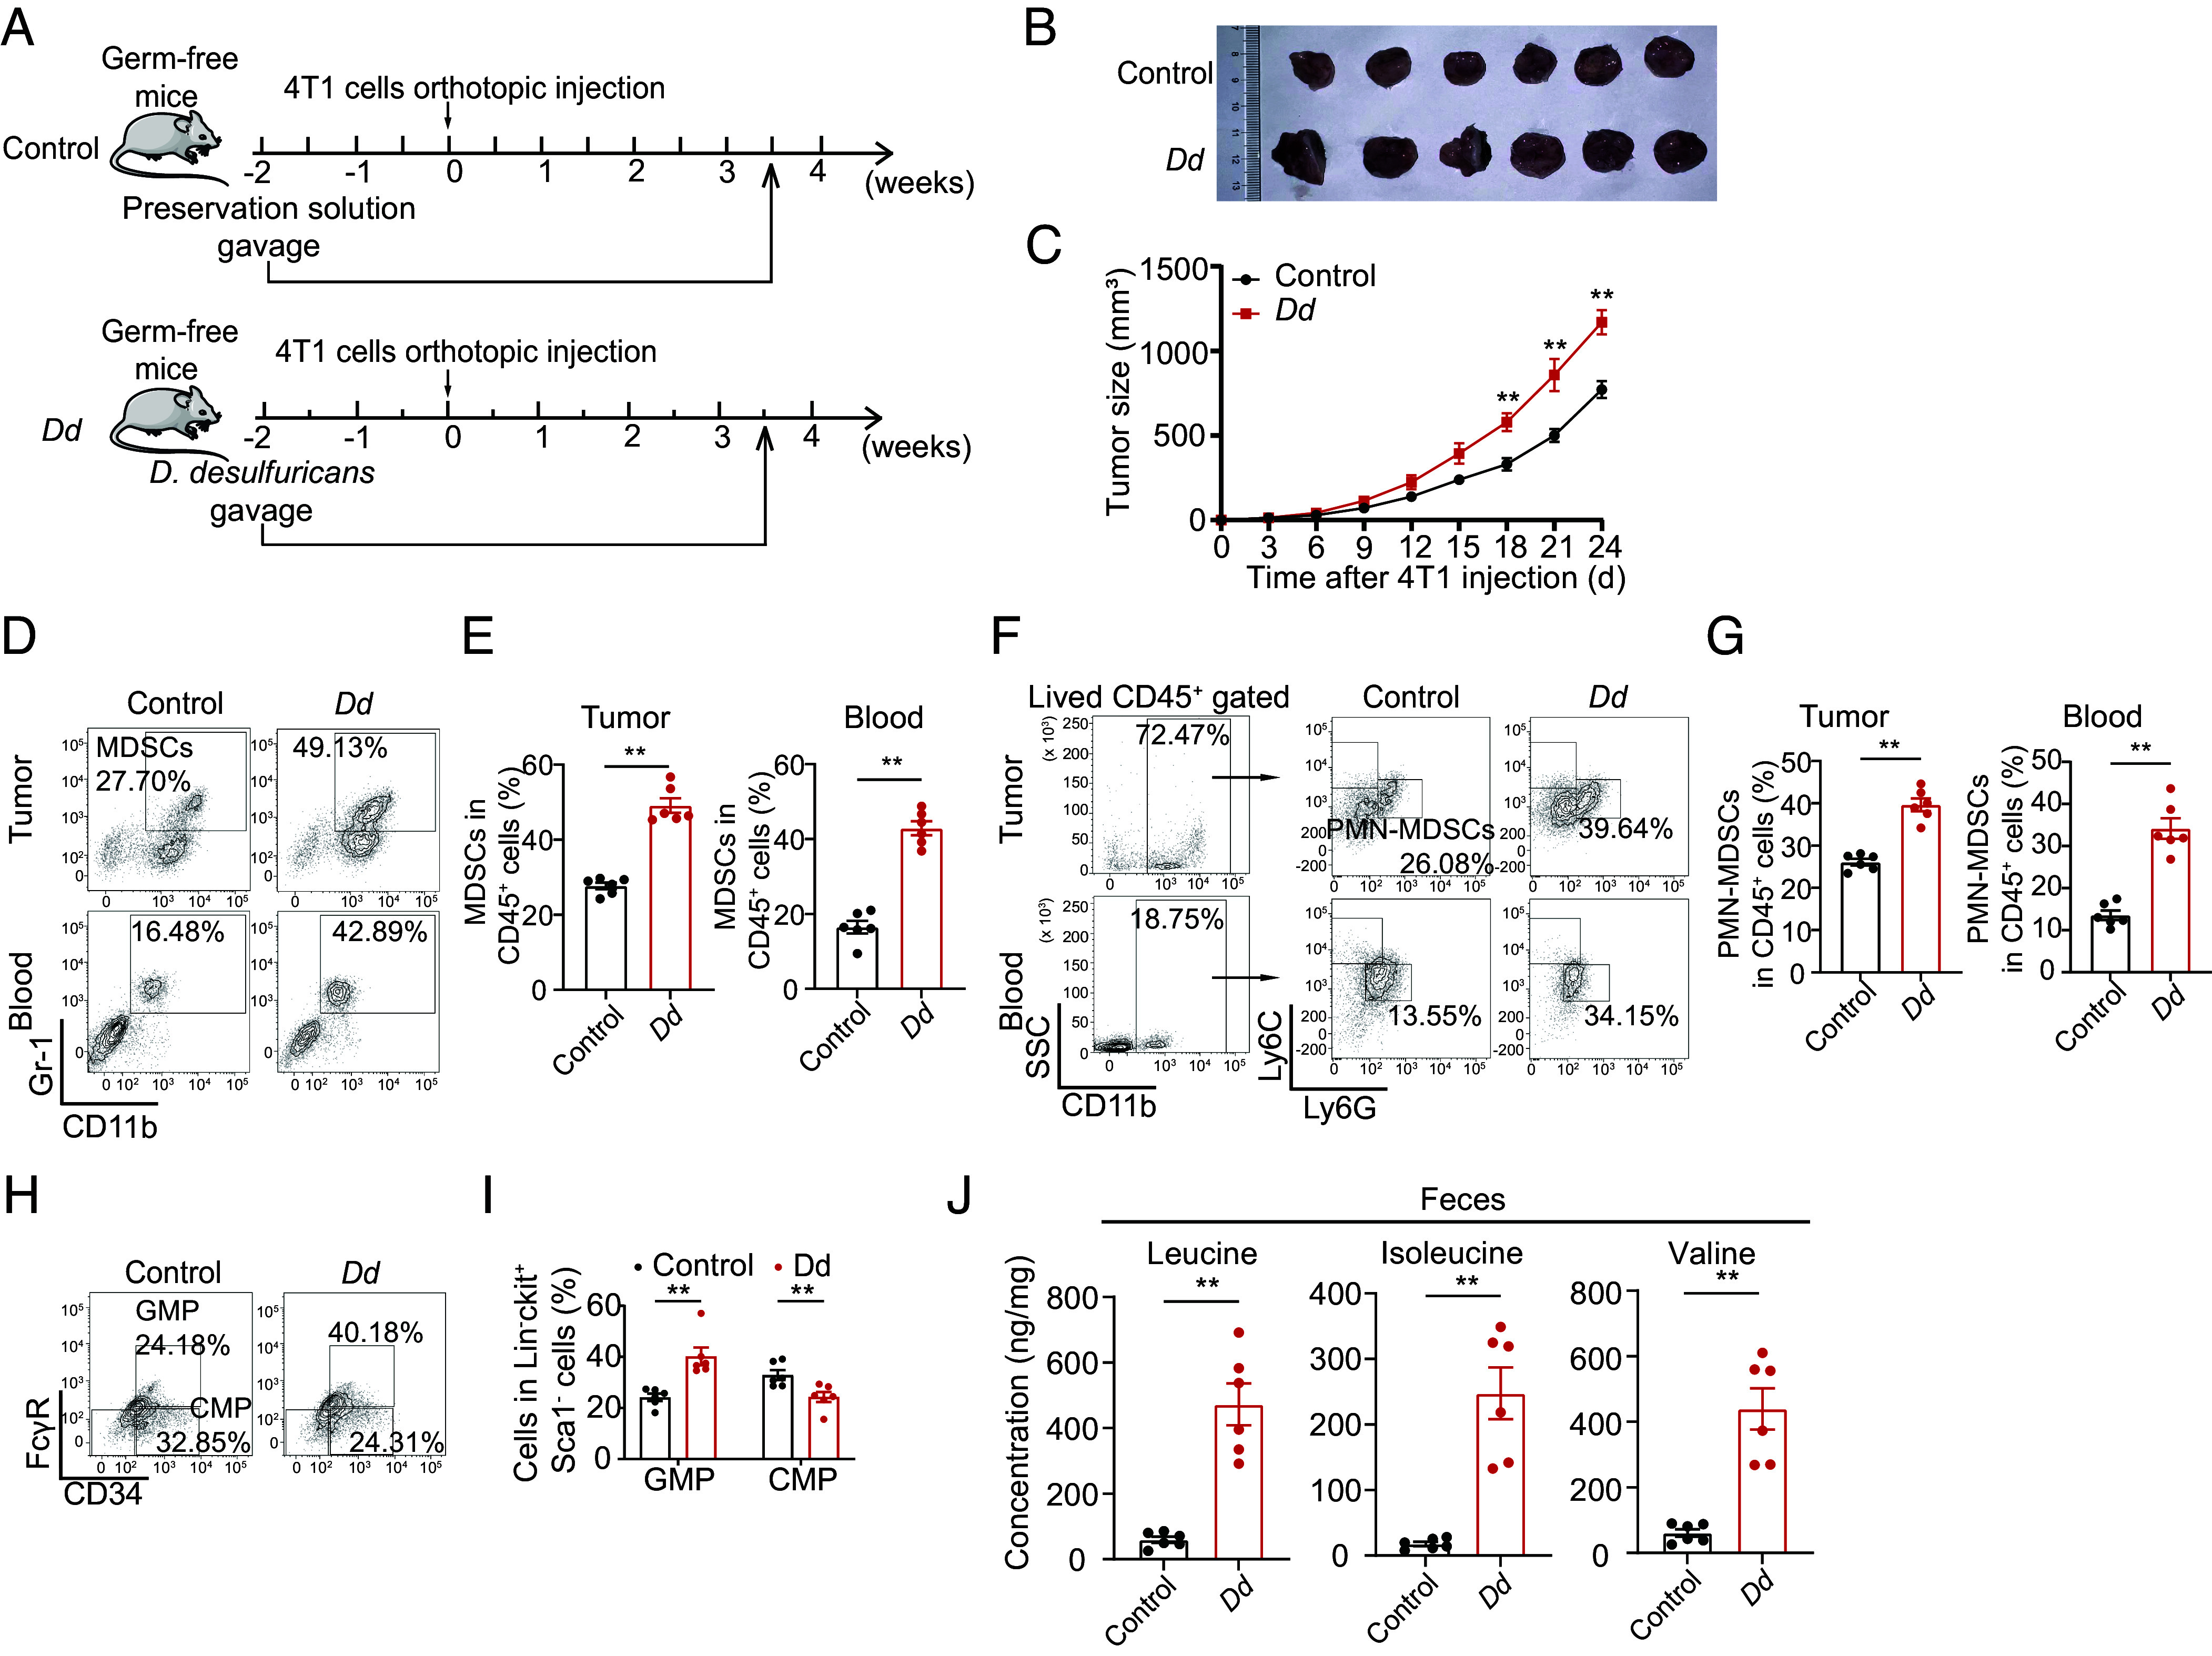
HFD-mediated enrichment of Desulfovibrio augments PMN-MDSC production and cancer progression through leucine production. (A) Experimental procedure. For the D. desulfuricans gavage model, germfree BALB/c mice were raised in a germfree environment, fed with a NFD, and administrated by 200 μL bacterial strain preservation solution (Control) and D. desulfuricans (Dd) gavage twice weekly until dissection. At the 2-wk Dd gavage, mice were inoculated with 100 μL (1 × 10⁶ cells) 4T1 mouse breast cancer cells on the second right mammary fat pad. (B) Image of breast cancer from 4T1 bearing mice of control and Dd gavage groups (n = 6 per group). (C) Tumor growth curve of breast cancer from 4T1 bearing mice of control and Dd gavage groups (n = 6 per group). (D) The percentage of MDSCs in the tumor and circulation in the control and Dd gavage groups was determined using flow cytometry (n = 6 per group). (E) Scatter plots represent the percentage of MDSCs in the tumor (Left) and circulation (Right) (n = 6 per group). (F) The percentage of PMN-MDSCs in breast tumor tissue and circulation from the control and Dd gavage groups was determined using flow cytometry (n = 6 per group). (G) Scatter plots represent the percentage of PMN-MDSCs in breast tumor tissue (Left) and circulation (Right). n = 6 per group. (H) The percentage of CMP and GMP cells in the bone marrow of mice with breast tumor burden from control and Dd gavage groups was determined using flow cytometry (n = 6 per group). (I) The scatter plot represents the percentage of CMP and GMP cells (n = 6 per group). (J) Concentration of leucine, isoleucine, and valine in feces of control and Dd gavage groups (n = 6 per group). Data are presented as mean ± SEM; P values are calculated by Student’s t test. *P < 0.05; **P < 0.01; ***P < 0.001.
Leucine Triggers MP Differentiation Toward PMN-MDSCs by Activating the mTORC1 Signaling Pathway.
Next, we elucidated how microbial leucine triggers MP differentiation toward MDSCs. Leucine activates the mTORC1 signaling pathway and modulates cellular behavior (26). In MPs, mTOR signaling was highly activated in HFD, HDFMT, and NFD+L mice compared with that in the NFD and HFD+A groups (Fig. 6A for breast cancer model, SI Appendix, Fig. S6A for melanoma model). HFD and HDFMT mouse serum treatment significantly activated mTOR signaling in MPs compared with NFD or HFD+A mouse serum treatment (SI Appendix, Fig. S6B). Leucine activated the mTORC1 signaling pathway in MPs in vitro dose-dependently (Fig. 6B). The L-amino acid transporter inhibitor (BCH) inhibited neutral amino acid transport, including leucine. It suppressed the mTOR signaling pathway in MPs (SI Appendix, Fig. S6C), MP differentiation toward MDSCs (SI Appendix, Fig. S6 D and E), especially PMN-MDSCs (SI Appendix, Fig. S6 F and G), and expression of MDSC-specific factors (SI Appendix, Fig. S6H) by leucine. Moreover, inhibiting mTORC1 by everolimus impeded MDSC generation induced by serum from HFD, HDFMT, and NFD+L mice in vitro (Fig. 6 C and D). Similarly, everolimus treatment in vivo decreased the levels of circulating MDSCs (Fig. 6 E and F), especially PMN-MDSCs (Fig. 6 G and H) and GMPs (Fig. 6 I and J) in the bone marrow and slowed the progression of breast tumors in HFD, HDFMT, and leucine-gavage mice (SI Appendix, Fig. S6 I and J).
Fig. 6.
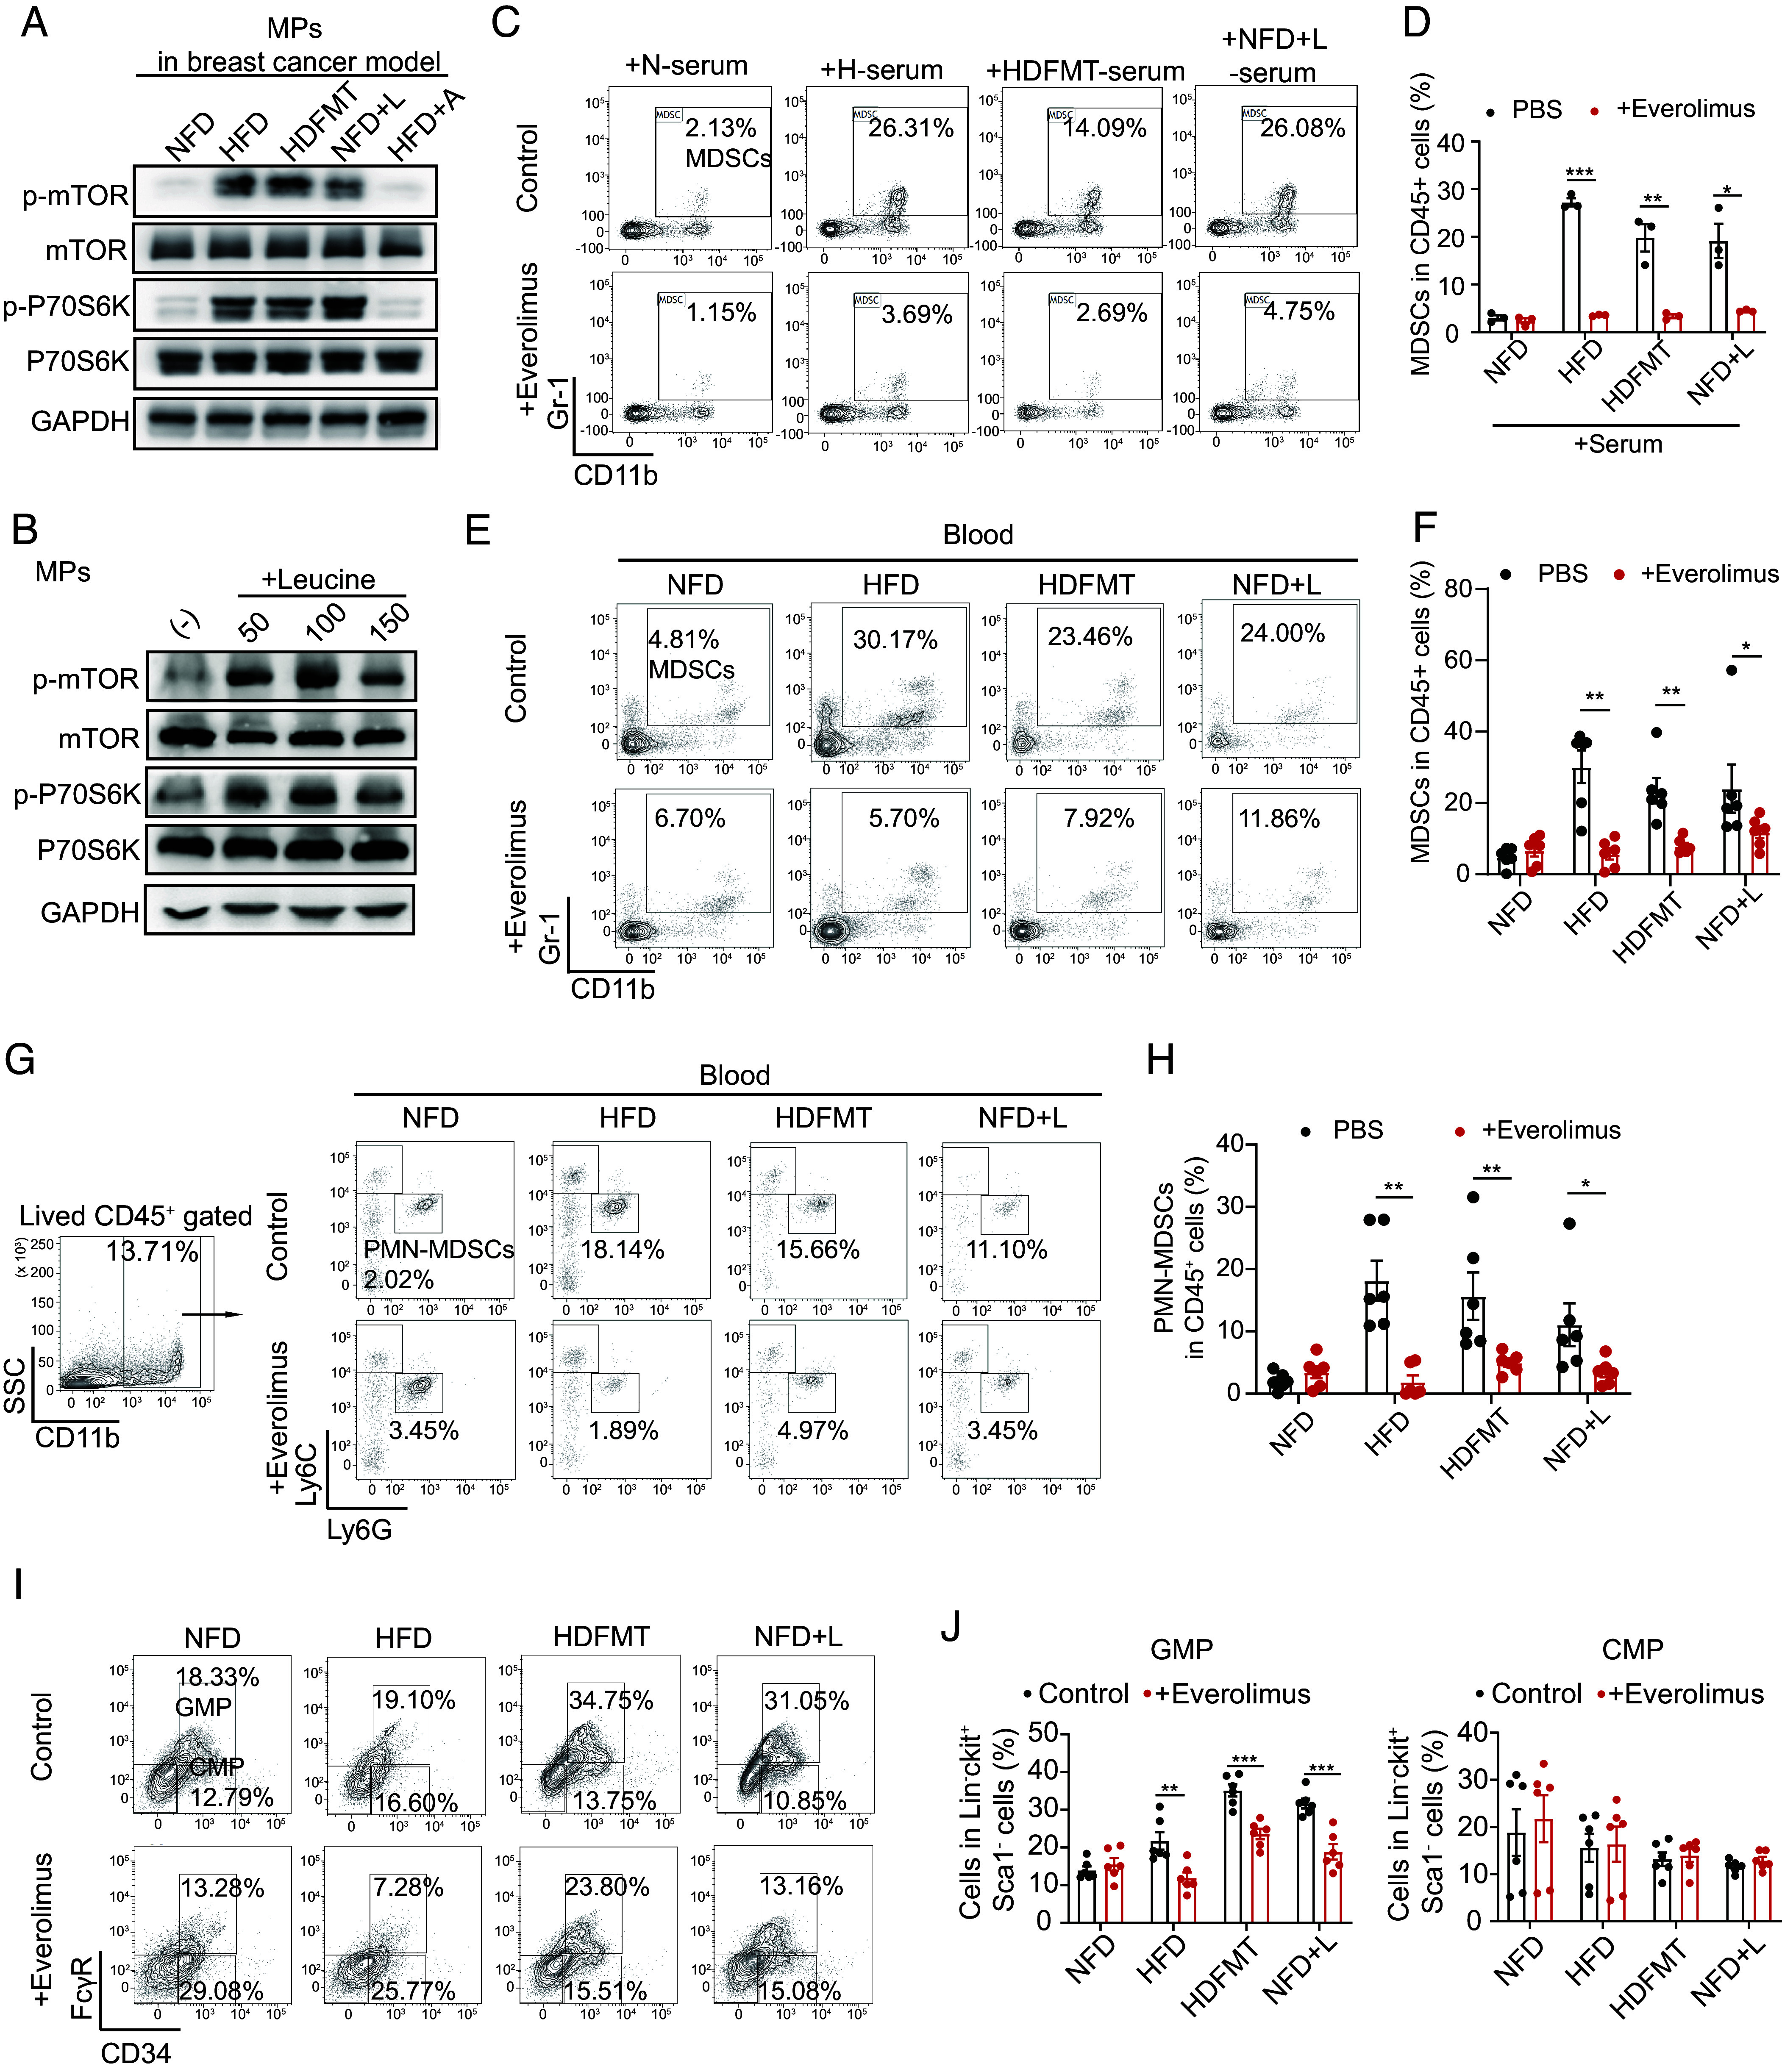
Leucine triggers MP differentiation toward PMN-MDSCs by activating the mTORC1 signaling pathway. (A) Western blotting analysis of MPs from breast tumor-bearing mice from NFD, HFD, HDFMT, NFD+L, and HFD+A groups. Target proteins were mTOR, phospho-mTOR, P70S6K, phospho-P70S6K, and GAPDH. A graph represents the experimental triplicates. (B) Western blotting analysis of MPs treated with PBS and 50, 100, and 150 μg/mL leucine. A graph represents the experimental triplicates. (C) MPs were sorted using flow cytometry and treated with PBS or serum from NFD, HFD, HDFMT, and NFD+L groups with or without everolimus for 6 d. The percentage of MDSCs differentiated from treated MPs was determined using flow cytometry. n = 6 independent experiments. (D) The scatter plot represents the percentage of generated MDSCs. All values are means ± SEM, n = 6 per group. (E) The percentage of MDSCs in circulation in the NFD, HFD, HDFMT, and NFD+L groups with or without everolimus treatment was determined using flow cytometry (n = 6 per group). (F) A scatter plot represents the percentage of MDSCs in circulation (n = 6 per group). (G) The percentage of PMN-MDSCs in circulation in the NFD, HFD, HDFMT, and NFD+L groups with or without everolimus treatment was determined by flow cytometry (n = 6 per group). (H) A scatter plot represents the percentage of PMN-MDSCs in circulation (n = 6 per group). (I) The percentage of GMPs and CMPs in the bone marrow tissue in the NFD, HFD, HDFMT, and NFD+L groups with or without everolimus treatment was determined by flow cytometry (n = 6 per group). (J) The scatter plots represent the percentage of GMPs (Left) and CMPs (Right). n = 6 per group. Data are presented as mean ± SEM; P values are calculated by Student’s t test or Tukey’s post hoc test. *P < 0.05; **P < 0.01; ***P < 0.001.
Sestrin 2 is a leucine sensor of the mTORC1 signaling pathway (27). Therefore, we knocked down sestrin 2 in the sorted MPs (SI Appendix, Fig. S6K). As expected, leucine failed to activate the mTORC1 signaling pathway in sestrin 2 knockdown (SI Appendix, Fig. S6L) or induced differentiation of MPs toward PMN-MDSCs (SI Appendix, Fig. S6 M and N). The results above implied that HFD-mediated microbial leucine triggers MDSC production through mTORC1 signaling in MPs.
Serum Leucine and HFD-Related Microbiota Are Correlated with Tumoral MDSCs and Advanced Clinicopathological Status in Patients with Breast Cancer.
We then attempted to confirm the correlation between HFD-related microbiota and breast cancer progression. Sera from 181 female patients were analyzed, including 58 patients with breast cancer with BMI > 24, 105 patients with breast cancer with BMI ≤ 24, and 18 patients with benign breast tumors (SI Appendix, Table S2). Consistent with previous findings in HFD mice (Fig. 4), serum leucine positively correlated with BMI in patients with breast cancer and tumor Ki67 levels (Fig. 7A and SI Appendix, Fig. S7 A–C). Notably, serum leucine levels were significantly elevated in patients with breast cancer compared with those in benign tumor carriers (Fig. 7B). Moreover, KM-curve and ROC revealed that low serum leucine levels were associated with longer DFS (Fig. 7C for KM-curve, SI Appendix, Fig. S7D for the ROC curve, AUC, 0.74) and lower breast cancer recurrence (local recurrence, AUC, 0.68; Fig. 7D). Univariate and multivariate Cox proportional hazards analyses disclosed that serum leucine levels (P = 0.009) and the M stage (P = 0.039) were independent prognostic predictors of DFS in patients with breast cancer (Table 1). In addition, the levels of fecal leucine from 61 female patients with breast cancer were detected. They were positively correlated with the genus Desulfovibrio, which was increased in the feces of overweight/obese patients, further suggesting that the increased level of leucine was derived from the obesity-related gut microbiota (Fig. 7E).
Fig. 7.

Serum leucine and HFD-related microbiota are correlated with tumoral MDSCs and advanced clinicopathological status in patients with breast cancer. (A) Spearman’s correlation analysis of serum leucine and BMI of patients with breast cancer (n = 163). (B) Concentration of serum leucine from patients with benign (n = 18) and malignant breast tumors (n = 163). (C) KM DFS curve of patients with breast cancer with a low and high level of serum leucine (n = 163). (D) The ROC curve is constructed to estimate the power of serum leucine for predicting the local recurrence of patients with breast cancer (n = 163). (E) Heatmap analysis of Spearman’s correlation of fecal leucine and differential gut taxa from patients with breast cancer (n = 61). Red represents a positive correlation, and blue indicates a negative correlation. (F) Immunofluorescence of CD33+ MDSCs and CD3+ tumor-infiltrating T lymphocytes in tumor tissue from breast cancer patients with BMI > 24 (n = 58) and ≤24 (n = 105). (Scale bar, 20 μm.) (G) A scatter plot represents the number of tumoral MDSCs (CD33+ cells) from patients with normal weight (n = 105) and overweight/obese (n = 58) patients. Total n = 163. (H) Spearman’s correlation analysis of serum leucine and tumoral CD33+ MDSCs of patients with breast cancer (n = 163). (I) Heatmap analysis of Spearman’s correlation of differential gut taxa and tumoral MDSCs and T lymphocytes of patients with breast cancer (n = 61). Red represents a positive correlation, and blue indicates a negative correlation. (J) Flow chart of patient-derived serum and feces applications. (K) Representative picture of breast tumors from mice treated with PBS, feces from lean donors (mixed with three cases), feces from lean donors + leucine, feces from obese donors (mixed with three cases), and feces from obese donors + nimesulide (n = 6 per group). (L) Growth curve of breast tumors from mice (n = 6 per group). (M) Graphical illustration of the working model. Data are presented as mean ± SEM; P values are calculated by Student’s t test or Tukey’s post hoc test. *P < 0.05; **P < 0.01; ***P < 0.001.
Table 1.
Univariate and Multivariate Cox proportional hazard analysis of DFS in 163 patients with breast cancer
| Univariate | Multivariate | |||||||
|---|---|---|---|---|---|---|---|---|
| Variable | P value | HR* | 95% CI† | P value | HR | 95% CI | ||
| Age | 0.309 | 0.975 | 0.929 | 1.023 | – | – | – | – |
| BMI‡ | 0.015 | 1.162 | 1.03 | 1.311 | – | – | – | – |
| T stage | 0.660 | 1.192 | 0.544 | 2.614 | – | – | – | – |
| N stage | 114 | 1.435 | 0.917 | 2.246 | – | – | – | – |
| M stage | 0.011 | 14.142 | 1.826 | 109.544 | 0.039 | 8.704 | 1.114 | 67.989 |
| TMN stage | 0.169 | 1.541 | 0.833 | 2.581 | – | – | – | – |
| Ki67 | 0.382 | 23.955 | 0.019 | 29,677.088 | – | – | – | – |
| Serum leucine | 0.005 | 1.027 | 1.008 | 1.046 | 0.009 | 1.026 | 1.007 | 1.046 |
*HR: hazard ratio.
†95% CI: 95% confidence interval.
‡BMI: body mass index.
Furthermore, to elucidate the relationship between tumor-infiltrating MDSC and obesity and the associated intestinal microbiota in patients with breast cancer, immunofluorescence of MDSCs (CD33+ cells) in human breast cancer tissue was performed. It turned out that CD33+ MDSCs in breast cancer tissue exhibited a significant increase in overweight/obese female patients with breast cancer (n = 58) compared to those with a BMI of ≤ 24 (n = 105) (Fig. 7 F and G). Moreover, these tumoral MDSCs demonstrated a positive correlation with serum leucine levels (Fig. 7H). Additionally, tumoral MDSCs were found to be positively associated with the genus of Desulfovibrio (Fig. 7I). These findings were consistent with the enriched Desulfovibrio in the feces, which correlated with tumor size and Ki67 content in breast cancers (Fig. 1). Notably, the principal immunosuppressive effect of MDSCs is the inhibition of the proliferation and antitumor function of T-lymphocytes (28). Therefore, we also detected tumor-infiltrating T lymphocytes (CD3+ cells). However, the percentage of tumor-infiltrating T lymphocytes was not found to be associated with BMI (SI Appendix, Fig. S7E), tumoral MDSCs (SI Appendix, Fig. S7F), serum leucine levels (SI Appendix, Fig. S7G), or the enriched genus of Desulfovibrio in the feces (Fig. 7I) in patients with breast cancer. Notably, sera from obese donors with high leucine levels significantly activated mTOR signaling in MPs (Fig. 7J and SI Appendix, Fig. S7H) and induced MDSC production in vitro compared with normal-weight donors with low leucine levels (SI Appendix, Fig. S7 J and K). Directly adding leucine to the serum of normal-weight donors promoted serum-enhanced mTOR signaling (SI Appendix, Fig. S7H) to produce MDSCs (SI Appendix, Fig. S7 J and K). Conversely, inhibiting leucine transportation by BCH inhibited mTOR signaling (SI Appendix, Fig. S7H) and MDSC production induced by serum from obese donors with high leucine levels (SI Appendix, Fig. S7 J and K). Finally, FMT of normal-weight donors and obese donors in MMTV-PyMT mice was performed to test the protumor effect of obesity-related gut microbiota (Fig. 7J). As expected, 16s rRNA sequencing unveiled an enrichment of Desulfovibrio in the intestines of mice receiving FMT from obese donors compared to those receiving FMT from normal-weight donors (SI Appendix, Fig. S7I). Transplanting feces from obese donors but not from normal-weight donors promoted breast cancer growth (Fig. 7 K and L) and elevated tumoral and circulating MDSCs (SI Appendix, Fig. S7 L and M) especially PMN-MDSCs (SI Appendix, Fig. S7 N and O) in mice. However, applying nimesulide to inhibit neutral amino acid absorption suppressed breast cancer progression (Fig. 7 K and L), and decreased the tumoral and circulating PMN-MDSCs (SI Appendix, Fig. S7 L–O). Similarly, leucine’s addition augmented breast cancer cell growth (Fig. 7 K and L) and elevated tumoral and circulating PMN-MDSCs in mice with normal-weight case-derived FMT (SI Appendix, Fig. S7 L–O).
These results suggested that HFD-related microbial leucine activates MP mTORC1 signaling in the bone marrow and triggers MP reproduction and PMN-MDSC differentiation, ultimately promoting breast cancer progression through the gut–bone marrow–tumor axis (Fig. 7M).
Discussion
Breast cancer is the most common malignancy among women globally and ranks as the most common cancer. Therefore, a complete understanding of the causes of breast cancer is imperative. Obesity and HFD are closely associated; however, the mechanisms underlying breast cancer induction may not overlap. The intestinal microbiota is a highly complex ecological community that changes with dietary patterns. Here, we found that obesity and the obesity-enriched genus Desulfovibrio are associated with poor prognosis and advanced clinicopathologic status in female breast cancer patients. By establishing various animal models, including HFD, FMT, antibiotic feeding, and bacterial gavage, we confirmed that HFD and enriched genus Desulfovibrio promote cancer progression by generating PMN-MDSCs. Mechanistically, Desulfovibrio releases abundant leucine to activate the mTORC1 signaling pathway in MPs for PMN-MDSC differentiation, ultimately accelerating cancer progression.
Desulfovibrio, which belongs to Proteobacteria, is enriched in overweight/obese patients and HFD mice, consistent with a previous study (19), Moreover, we also found that the abundance of Desulfovibrio was positively correlated with tumor growth in patients. Notably, D. desulfuricans gavage accelerated breast cancer progression, triggering PMN-MDSC production and elevating inner leucine levels in germfree mice. This confirms that Desulfovibrio is a critical component of the gut microbiota that drives cancer progression. Therefore, targeting this genus is a promising intervention for preventing HFD-related cancers.
An alternative intervention is to block the gut–bone marrow–tumor axis derived from the overuptake of leucine. Therefore, nutritional intervention for leucine metabolism is a promising strategy to reduce the public cancer burden. MDSCs are immunosuppressive cells in many chronic diseases, such as cardiovascular and liver diseases (29–31). We speculated the involvement of a “gut–bone marrow–target organ” axis in obesity and high-fat-diet-mediated chronic diseases besides cancers. Therefore, this strategy could block this axis and significantly decrease obesity and the HFD-induced burden of chronic diseases. Similar to HFD, high-fructose diet is also implicated in the development of various diseases. However, the role of high-fructose diet in tumor regulation remains controversial (32–35), which underscores the need for more in-depth research to unravel the complex and context-dependent effects of high-fructose diets on tumor regulation and their potential as clinical targets.
Yet, this study has certain limitations that should be acknowledged. First, the use of an anti-Gr-1 antibody to eliminate MDSCs in mice raises a challenge as the antibody also removes neutrophils expressing Gr-1. Second, this study’s bacterial colonization animal model used only one strain of Desulfovibrio (D. desulfuricans). Isolating and cultivating additional Desulfovibrio strains and colonizing these strains in germfree mice are essential for the further exploration of the tumor-promoting effects of Desulfovibrio.
In conclusion, this study reveals that HFD-mediated gut microbiota produces additional leucine, followed by the activation of MP mTORC1 signaling in the bone marrow and the triggering of PMN-MDSC differentiation, ultimately promoting breast cancer progression through the gut–bone marrow–tumor axis.
Materials and Methods
Statistical Analysis.
Two-tailed Student’s t test, Tukey’s post hoc test, KM curves, log-rank test, Spearman order correlations, and ROC curve analyses were performed using GraphPad Prism 9 (GraphPad Software, Inc., La Jolla, CA). Univariate and multivariate Cox proportional hazards analyses were performed using SPSS version 24 (IBM, Armonk, NY). Data were shown as mean ± SEM. Metabolite analysis was performed using MetaboAnalyst 4.0. Statistical significance was set at P < 0.05.
All the experimental methods performed in this study, such as clinical sample collection, animal models, microbial sequencing, metabolomics, and other related experiments are described in SI Appendix. SI Appendix also contains the information of the equipment and reagents used in this study.
Supplementary Material
Appendix 01 (PDF)
Dataset S01 (XLS)
Dataset S02 (XLS)
Acknowledgments
This work was supported by grants from the Program for Guangdong Introducing Innovative and Enterpreneurial Teams (2019BT02Y198), Natural Science Foundation of China (82330056,82025026, 92159303, 81930081, and 82230091), Basic and Applied Basic Research Foundation of Guangdong Province (2022A1515110069), Guangdong Science and Technology Department (2023B1212060013), Bureau of Science and Technology of Guangzhou (20212200003), and Guang Dong Cheung Kong Philanthropy Foundation (E2018096). We thank Guangdong Institute of Microbiology for kindly providing a strain of Desulfovibrio desulfuricans. We appreciate the assistance of the Disease Registry Department of the Sun Yat-Sen Memorial Hospital, Sun Yat-Sen University.
Author contributions
Y.L., H. Hu, and E.S. designed research; J.C., X. Liu, Y.Z., J.G., Z.G., and W.Z. performed research; X. Lin, H. Huang, and J.Z. contributed new reagents/analytic tools; X. Liu analyzed data; Y.L., H. Hu, and E.S. supervision; and J.C., X. Liu, and P.E.S. wrote the paper.
Competing interests
The authors declare no competing interest.
Footnotes
This article is a PNAS Direct Submission. L.Z. is a guest editor invited by the Editorial Board.
Contributor Information
Yongjun Lu, Email: luyj@mail.sysu.edu.cn.
Hai Hu, Email: huhai@mail.sysu.edu.cn.
Erwei Song, Email: songew@mail.sysu.edu.cn.
Data, Materials, and Software Availability
16S rRNA gene amplicon sequencing data have been submitted to the NCBl database under BioProject No. PRINA978012 (36). All study data are included in the article and/or SI Appendix.
Supporting Information
References
- 1.Flegal K. M., Carroll M. D., Ogden C. L., Curtin L. R., Prevalence and trends in obesity among US adults, 1999–2008. JAMA 303, 235–241 (2010). [DOI] [PubMed] [Google Scholar]
- 2.Mozaffarian D., Hao T., Rimm E. B., Willett W. C., Hu F. B., Changes in diet and lifestyle and long-term weight gain in women and men. N. Engl. J. Med. 364, 2392–2404 (2011). [DOI] [PMC free article] [PubMed] [Google Scholar]
- 3.Ramachandran A., Snehalatha C., Rising burden of obesity in Asia. J. Obes. 2010, 868573 (2010). [DOI] [PMC free article] [PubMed] [Google Scholar]
- 4.Calle E. E., Kaaks R., Overweight, obesity and cancer: Epidemiological evidence and proposed mechanisms. Nat. Rev. Cancer 4, 579–591 (2004). [DOI] [PubMed] [Google Scholar]
- 5.van Kruijsdijk R. C., van der Wall E., Visseren F. L., Obesity and cancer: The role of dysfunctional adipose tissue. Cancer Epidemiol. Biomarkers Prev. 18, 2569–2578 (2009). [DOI] [PubMed] [Google Scholar]
- 6.Rock C. L., Demark-Wahnefried W., Nutrition and survival after the diagnosis of breast cancer: A review of the evidence. J. Clin. Oncol. 20, 3302–3316 (2002). [DOI] [PMC free article] [PubMed] [Google Scholar]
- 7.Petrelli J. M., Calle E. E., Rodriguez C., Thun M. J., Body mass index, height, and postmenopausal breast cancer mortality in a prospective cohort of US women. Cancer Causes Control 13, 325–332 (2002). [DOI] [PubMed] [Google Scholar]
- 8.Kolb R., Sutterwala F. S., Zhang W., Obesity and cancer: Inflammation bridges the two. Curr. Opin. Pharmacol. 29, 77–89 (2016). [DOI] [PMC free article] [PubMed] [Google Scholar]
- 9.Mishra A. K., Dubey V., Ghosh A. R., Obesity: An overview of possible role(s) of gut hormones, lipid sensing and gut microbiota. Metabolism 65, 48–65 (2016). [DOI] [PubMed] [Google Scholar]
- 10.Sonnenburg J. L., Backhed F., Diet-microbiota interactions as moderators of human metabolism. Nature 535, 56–64 (2016). [DOI] [PMC free article] [PubMed] [Google Scholar]
- 11.Gregor M. F., Hotamisligil G. S., Inflammatory mechanisms in obesity. Annu. Rev. Immunol. 29, 415–445 (2011). [DOI] [PubMed] [Google Scholar]
- 12.Vetizou M., et al. , Anticancer immunotherapy by CTLA-4 blockade relies on the gut microbiota. Science 350, 1079–1084 (2015). [DOI] [PMC free article] [PubMed] [Google Scholar]
- 13.Sivan A., et al. , Commensal Bifidobacterium promotes antitumor immunity and facilitates anti-PD-L1 efficacy. Science 350, 1084–1089 (2015). [DOI] [PMC free article] [PubMed] [Google Scholar]
- 14.Wang H., et al. , The microbial metabolite trimethylamine N-oxide promotes antitumor immunity in triple-negative breast cancer. Cell Metab. 34, 581–594.e8 (2022). [DOI] [PubMed] [Google Scholar]
- 15.Roy S., Trinchieri G., Microbiota: A key orchestrator of cancer therapy. Nat. Rev. Cancer 17, 271–285 (2017). [DOI] [PubMed] [Google Scholar]
- 16.Luu T. H., et al. , Intestinal proportion of Blautia sp. is associated with clinical stage and histoprognostic grade in patients with early-stage breast cancer. Nutr. Cancer 69, 1532–7914 (2017). [DOI] [PubMed] [Google Scholar]
- 17.Terrisse S., et al. , Intestinal microbiota influences clinical outcome and side effects of early breast cancer treatment. Cell Death Differ. 28, 2778–2796 (2021). [DOI] [PMC free article] [PubMed] [Google Scholar]
- 18.Picon-Ruiz M., Morata-Tarifa C., Valle-Goffin J. J., Friedman E. R., Slingerland J. M., Obesity and adverse breast cancer risk and outcome: Mechanistic insights and strategies for intervention. CA Cancer J. Clin. 67, 378–397 (2017). [DOI] [PMC free article] [PubMed] [Google Scholar]
- 19.Ley R. E., et al. , Obesity alters gut microbial ecology. Proc. Natl. Acad. Sci. U.S.A. 102, 11070–11075 (2005). [DOI] [PMC free article] [PubMed] [Google Scholar]
- 20.Soto-Pantoja D. R., et al. , Diet alters entero-mammary signaling to regulate the breast microbiome and tumorigenesis. Cancer Res. 81, 3890–3904 (2021). [DOI] [PMC free article] [PubMed] [Google Scholar]
- 21.Yang B. G., Hur K. Y., Lee M. S., Alterations in gut microbiota and immunity by dietary fat. Yonsei Med. J. 58, 1083–1091 (2017). [DOI] [PMC free article] [PubMed] [Google Scholar]
- 22.Hegde S., Leader A. M., Merad M., MDSC: Markers, development, states, and unaddressed complexity. Immunity 54, 875–884 (2021). [DOI] [PMC free article] [PubMed] [Google Scholar]
- 23.Veglia F., Perego M., Gabrilovich D., Myeloid-derived suppressor cells coming of age. Nat. Immunol. 19, 108–119 (2018). [DOI] [PMC free article] [PubMed] [Google Scholar]
- 24.Zhou J., Nefedova Y., Lei A., Gabrilovich D., Neutrophils and PMN-MDSC: Their biological role and interaction with stromal cells. Semin. Immunol. 35, 19–28 (2018). [DOI] [PMC free article] [PubMed] [Google Scholar]
- 25.Dang A. T., Marsland B. J., Microbes, metabolites, and the gut-lung axis. Mucosal Immunol. 12, 843–850 (2019). [DOI] [PubMed] [Google Scholar]
- 26.Son S. M., et al. , Leucine signals to mTORC1 via its metabolite acetyl-coenzyme A. Cell Metab. 29, 192–201.e7 (2019). [DOI] [PMC free article] [PubMed] [Google Scholar]
- 27.Wolfson R. L., et al. , Sestrin2 is a leucine sensor for the mTORC1 pathway. Science 351, 43–48 (2016). [DOI] [PMC free article] [PubMed] [Google Scholar]
- 28.Si Y., et al. , Multidimensional imaging provides evidence for down-regulation of T cell effector function by MDSC in human cancer tissue. Sci. Immunol. 4, eaaw9159 (2019). [DOI] [PubMed] [Google Scholar]
- 29.Xing Y. F., et al. , Expansion of monocytic myeloid-derived suppressor cells in patients under hemodialysis might lead to cardiovascular and cerebrovascular events. Front. Immunol. 11, 1664–3224 (2021). [DOI] [PMC free article] [PubMed] [Google Scholar]
- 30.Sun S. N., et al. , G-MDSCs promote aging-related cardiac fibrosis by activating myofibroblasts and preventing senescence. Cell Death Dis. 12, 594 (2021). [DOI] [PMC free article] [PubMed] [Google Scholar]
- 31.Zhou Z.A.-O., et al. , The relationship between hepatic myeloid-derived suppressor cells and clinicopathological parameters in patients with chronic liver disease. BioMed Res. Int. 2021, 6612477 (2021). [DOI] [PMC free article] [PubMed] [Google Scholar]
- 32.Jung S., Bae H., Song W. S., Jang C., Dietary fructose and fructose-induced pathologies. Annu. Rev. Nutr. 42, 45–66 (2022). [DOI] [PMC free article] [PubMed] [Google Scholar]
- 33.Zhou P., et al. , High dietary fructose promotes hepatocellular carcinoma progression by enhancing O-GlcNAcylation via microbiota-derived acetate. Cell Metab. 35, 1961–1975.e6 (2023). [DOI] [PubMed] [Google Scholar]
- 34.Bu P., et al. , Aldolase B-mediated fructose metabolism drives metabolic reprogramming of colon cancer liver metastasis. Cell Metab. 27, 1249–1262.e4 (2018). [DOI] [PMC free article] [PubMed] [Google Scholar]
- 35.Zhang Y., et al. , Dietary fructose-mediated adipocyte metabolism drives antitumor CD8+ T cell responses. Cell Metab. 35, 2107–2118.e6 (2023). [DOI] [PubMed] [Google Scholar]
- 36.Liu X., et al., Studies of gut microbiota on MMTV-PyVT mice and breast tumor patients. NCBI. https://www.ncbi.nlm.nih.gov/bioproject/PRJNA831815. Deposited 25 April 2022.
Associated Data
This section collects any data citations, data availability statements, or supplementary materials included in this article.
Supplementary Materials
Appendix 01 (PDF)
Dataset S01 (XLS)
Dataset S02 (XLS)
Data Availability Statement
16S rRNA gene amplicon sequencing data have been submitted to the NCBl database under BioProject No. PRINA978012 (36). All study data are included in the article and/or SI Appendix.