

Abstract
Podocytes are highly differentiated epithelial cells outlining the glomerular vessels. FOXC2 is a transcription factor essential for inducing podocyte differentiation, development and maturation, and is considered to be the earliest podocyte marker. miRNA prediction analysis revealed a full-length target site for the primate-specific miR-548c-5p at a genomic region > 8 kb upstream of FOXC2. We hypothesised that the transcription rates of FOXC2 during podocyte differentiation might be tuned by miR-548c-5p through this target site. Experiments were performed with cultured human podocytes, transfected with luciferase reporter constructs bearing this target site region within an enhancer element of the native plasmid. The results confirmed a seed region-driven targeting potential by the miRNA, with mimics downregulating and inhibitors enhancing luciferase activity. Introducing mutations into the miRNA target seed region abolished the expected response. In cultured podocytes, FOXC2 mRNA and protein levels responded to miR-548c-5p abundance in a coordinated manner before and after induction of differentiation, with high statistical significance. Ago-ChIP experiments revealed occupancy of the miRNA target site by miRNA/RISC in undifferentiated cells and its release when differentiation is initiated, allowing its interaction with the gene’s promoter region to amplify FOXC2 expression, as shown by chromosome conformation capture and qRT-PCR. Moreover, the expression pattern of FOXC2 during podocyte differentiation seems to be affected by miR-548c-5p, as removal of either endogenous or mimic miR-548c-5p results in increased FOXC2 protein levels and cells resembling those undergoing differentiation. Collectively, results indicate a well-orchestrated regulatory model of FOXC2 expression by a remote upstream target site for miR-548c-5p.
Electronic supplementary material
The online version of this article (10.1007/s00018-019-03294-z) contains supplementary material, which is available to authorized users.
Keywords: microRNA, Differentiation, MADE1, MIR-548 family, Promoter, Enhancer, Repressor, Primate specific
Introduction
MicroRNAs (miRNAs) are a class of short non-coding single-stranded RNA molecules, sized 21–25 nucleotides that comprise one of the most abundant gene families in eukaryotes with a prominent role in the regulation of gene expression [1, 2]. Target recognition and binding properties of miRNAs mostly rely on their seed region: nucleotides 2–8 from the 5′ end of each miRNA [3, 4]. Mature miRNAs become part of the RNA-induced silencing complex (RISC), through Argonaute (Ago) proteins and down-regulate translation by binding onto mRNA 3′UTR target sites or cleave targeted mRNAs via the Slicer endonuclease [5, 6]. miRNAs also play an important role in regulating gene transcription and mature species are natively found in the nucleus together with RISC components [7–10]. It has been shown that nuclear transport of the Argonaute proteins is facilitated by Importin 8, also mediating miRNA transport from the cytoplasm to the nucleus in an Ago2-dependent manner [11, 12]. It has been suggested that miRNAs have the ability to hybridise with complementary DNA sequences and promote or hinder gene expression [13].
The role of miRNAs in kidney disease has been well described [14–17]. Podocytes are highly differentiated visceral epithelial cells and one of the three major cell types shaping up the glomerulus. Podocyte-specific inactivation of Dicer in mice leads to depletion of podocyte foot processes and apoptosis, while animals develop albuminuria, glomerulosclerosis and tubuloinsterstitial fibrosis to eventually die after 6-8 weeks [14, 16, 17]. Renal cell type identity has also been associated with miRNAs, as human parietal epithelial cells were found to be transdifferentiated to podocytes under the influence of miR-193a [18].
FOXC2 (Forkhead box protein C2) is a member of a family of transcription factors, with great importance for cell fate determination, proliferation and differentiation at multiple tissues and organs [19, 20]. It has been shown that FOXC2, in addition to WT1, is a podocyte marker with great importance in early kidney development [19]. In human kidney organoids, FOXC2 was found to be expressed in early podocytes and nephron progenitors [21]. As the earliest podocyte marker, it has a prominent role in the differentiation, development and maturation of podocytes, through the transcriptional regulation of a variety of different genes, such as podocin (NPHS2) [20, 22]. In Foxc2 knockout mice, podocytes failed to develop foot processes and slit diaphragms and were unable to differentiate [22], whereas the absence of both Foxc2 alleles causes severe podocyte injury and dysregulation of genes essential for podocyte integrity [23]. Thus, it can be deduced that the regulated expression of FOXC2 is of utmost importance for podocyte maturation and preservation.
While searching for miRNA target sites, some hits revealed extended complementarity between certain miRNAs and gene promoter regions. A specific miRNA, miR-548c-5p, had a target region corresponding to its full length (22/22 nucleotides) at > 8 kb upstream the FOXC2 gene transcription start point. In cultured podocytes, miR-548c-5p has been characterised as cell-type specific [24], while it has been shown to regulate the expression of PTPRO through a 3′UTR target site, a proteinuria and nephrotic syndrome-associated protein [25]. miR-548c-5p belongs to the primate-specific MIR-548 family (MIPF0000317), believed to have originated from MADE1 (Mariner-Derived Element-1) type transposable elements (TEs) [26, 27]. In this work, we hypothesised that the transcription rates of FOXC2 during podocyte differentiation might be influenced by miR-548c-5p, through its interaction with this site.
Methods
miR-548c-5p target prediction analysis and filtering of results
Target prediction analysis for hsa-miR-548c-5p and other MIR-548 family members was performed by miRWalk2.0 (mirwalk.uni-hd.de) [28]. The 5′ and 3′UTR, coding sequence and promoter region (according to miRWalk2.0, defined as 10 kb upstream of a gene’s transcription start site) of 20,728 genes were considered for predictions. Hits concerning gene promoter sequences were compared to hits on all other regions. Mean values of binding sites among different members of MIR-548 family were firstly compared by analysis of variance (ANOVA) to test the null hypothesis (i.e., H0:all means are equal), followed by multiple comparisons using one-way ANOVA, with 5% level of significance (p ≤ 0.05). miR-548c-5p was selected for further analyses due to optimal scores compared to other family members and specifically a predicted target site upstream of FOXC2. Palindromicity of the target site region was examined using RepeatMasker [29] MADE1-type motif search (results not shown); 43/80nt showed complementarity and it was considered as non-palindromic, hence having a low chance of being transcribed to a miRNA by shaping up an RNA loop.
Cell culture
Both conditionally immortalised human podocytes (hPC), originating from primary cell cultures, and mouse podocytes (mPC), originating from the “immortomouse”, were cultured as previously described [30, 31]. Podocytes are dividing when cultured at 33 °C. By switching to 37 °C, podocytes stop dividing and start to differentiate. HEK293T cells were cultured in DMEM with 10% Fetal Bovine Serum, 1% Penicillin/Streptomycin (Invitrogen, USA), and incubated at 37 °C with 5% CO2. Lipofectamine®2000 Transfection Reagent (Invitrogen, USA) was used for all transfections, with 0.1 ng of vectors and 25 nM of locked nucleic acid (LNA) molecules (mimics, inhibitors, negative control, QIAGEN, UK) per transfection. All cell lines were kept at low passages and discarded after a few splits to prevent alterations in their nature.
Constructs of the luciferase expression reporter system
Target site binding of miR-548c-5p was validated through the Dual-Luciferase® Reporter Assay System (Promega, USA). A fragment containing the predicted target site, plus flanking sequence (386 bp in total), was cloned into the pGL4.27 enhancer region (pGL4.27-wt) (Fig. 3a). Using site-directed mutagenesis mutations were introduced in nucleotides corresponding to seed region of miR-548c-5p at positions 2, 2 + 3, 2 + 3+ 4 and 2 + 3 + 4 + 5 (Supp. Methods). hPCs were transfected with vectors and miR-548c-5p mimic, inhibitor or AllStars Negative Control (NC) (QIAGEN, UK). Cells were harvested 16 h post-transfection and luciferase levels were determined on an automated luminometer (Sirius, Berthold Detection Systems). Results were analysed using one-way ANOVA with Tukey post-testing.
Fig. 3.

Reporter assay experiments demonstrate a regulation of luciferase expression by miR-548c-5p with seed region specificity. a Schematic representation of the pGL4.27 vector. The pGL4.27 vector contains a multiple cloning site within the enhancer element (Enhancer) upstream the minimal promoter of the firefly luciferase gene. A 386 bp genomic fragment containing the miR-548c-5p target site was cloned into the enhancer using the NheI and HindIII restriction sites. b Luciferase expression levels in hPCs transfected with the pGL4.27-wt vector and miR-548c-5p mimics or inhibitors. miR-548c-5p mimics significantly diminished luciferase levels (p = 0.011), whereas inhibitors enhanced them (p = 0.018) when compared to the control. (SEM, n = 6 per LNA). c Luciferase levels after introducing sequential mutations on the nucleotides corresponding to the miRNA’s seed region. In the presence of the vector containing a mutation at position-2 (p.2) of the target site, naturally transcribed endogenous miR-548c-5p is still active and is abolished by the inhibitor resulting in increased luciferase expression compared to the control (p.2 with p = 0.007). miRNA mimics do not cause a significant change in luciferase levels, as the mutation at p.2 affects their binding onto the target sequence. This effect is further attenuated with the introduction of consecutive mutations at nucleotides 3, 4 and 5 (p.2 + 3, p.2 + 3 + 4 and p.2 + 3 + 4 + 5). (SEM, n = 3 per plasmid/LNA)
Endogenous miR-548c-5p, FOXC2 mRNA levels in hPC during differentiation
Undifferentiated hPCs at 60% confluency were led to differentiate at 37 °C (5% CO2). RNA was extracted using TRIzol® Reagent (Life Technologies, USA). Time points studied were: day (− 1) (undifferentiated/dividing cells), day 1, day 2, day 3, day 4, day 7, day 10, day 13 and day 16 (mature differentiated podocytes). Day 1 corresponds to a harvest 24 h after differentiation induction, day 2 to 24 h after day 1 and so forth. The levels of miR-548c-5p and FOXC2 mRNA were assessed through quantitative real-time PCR (qRT-PCR), using SNORA37 and β-Actin as reference genes, respectively.
Effect of miRNA mimics and inhibitors on endogenously expressed FOXC2 in hPCs and mPCs
To evaluate miR-548c-5p effect on FOXC2 mRNA levels, hPCs were transfected on day 1 and day 7 with mimics or inhibitors and harvested 24 h post-transfection (day 2 and day 8, respectively). To study the role of the miRNA in undifferentiated hPCs, cells were transfected twice, once in every 24 h, with miRNA mimics or inhibitors, to enforce and amplify ongoing interactions. Cells were harvested 24 h after the second transfection. Untransfected cells treated with Lipofectamine (Invitrogen, USA) were used as controls. Moreover, as mouse podocytes are a natural knock-out of both the miRNA and its genomic target region (Fig. 1d, e), undifferentiated mPCs were treated in the same way, to investigate the effect of miR-548c-5p on mFOXC2 normalised on β-Actin. Results were compared using one-way ANOVA with Tukey post-testing.
Fig. 1.

Target predictions by MiRWalk2.0 and target site region conservation. a Distribution of predicted lengthier target sites for family MIR-548. Prediction results demonstrated an apparent enrichment of lengthy target sites located within the 10 kb promoter regions. Target sites were defined by their complementarity against the mature sequences of miRNAs and were only included in the results if they had a p value ≤ 0.05 following automatic statistical analysis by the miRWalk2.0 algorithm. b Percentage of total predicted binding sites. Target predictions for MIR-548 family members by miRWalk2.0 at the promoter, 5′UTR, coding sequence (CDS) and 3′UTR of all available genes. Target sites at the distant upstream promoter region were represented in 43.56% of total results, outnumbering hits in every other region, including the 3′UTR. cFOXC2-associated miR-548c-5p target site topography. The predicted site is placed 8.6 kb upstream of the FOXC2 transcription start point in an intergenic region and does not participate in any transcripts. MTHFSD is placed 3.3 kb further upstream from the miRNA target site, encoded in the opposite direction (head-to-head with FOXC2). d Schematic alignment of human vs mouse synteny of the miRNA target region. Head-to-head arrangement of MTHFSD and FOXC2 in mouse chromosome 8 corresponds to (or is syntenic to) human chromosome 16. The intergenic region containing the miRNA-predicted target site remains different in mice. The hatched pattern signifies conservation between human and mouse, while 5367 bp are different and unaligned to the human reference genome. e Multiple alignment of the miRNA target site region, between primates and other mammals. Primates have absolute conservation for the target site and a high degree of conservation for the flanking sequence while the same region is absent from other mammals. Data were retrieved from multiple alignments performed by multiz and other tools displayed in USCS genome browser, considering the default parameters of basewise conservation (phyloP) and element conservation (phastCons). Human (HSA), Chimp (PTR), Gorilla (GGO), Orangutan (PPY), Baboon (PPA), Green monkey (CAE), Mouse (MMU), Rat (RNO), Dog (CAF), Cat (FCA)
Ago-chromatin immunoprecipitation (Ago-ChIP)
Monoclonal anti-Pan-Ago antibodies (Supp. Table 2) were used to immunoprecipitate the RISC complex in crosslinked nuclear fractions of hPCs at various time points. Experiments were carried out as described in the ChIP-assay protocol (PROT11) by the EPIGENOME Network of Excellence [32] with modifications (Supp. Methods). Enrichment of DNA regions and selected miRNAs was performed by qRT-PCR (ChIP qPCR primers, Supp. Table 1). qPCR primers for miRNAs were supplied by QIAGEN, UK. ChIP efficiency was tested by amplifying the GAPDH promoter region in RNA-Polymerase ChIP preps (not shown). Primer pairs were designed to encompass the miRNA target site and then at every ≈ 2 kb, towards FOXC2 (Fig. 5a). The enrichment of miR-548c-5p in ChIP preps of undifferentiated hPCs was compared to podocyte-specific miR-23b, nuclear miR-29c [7, 33] and active in podocytes miR-30d-3p [16, 34, 35]. Moreover, target site enrichment was also tested in a non-differentiating cell line, HEK293T, using the same protocol. Target site specificity was evaluated in mPCs transfected with the same vector plasmids used for luciferase experiments; pGL4.27-wt or the vector with seed region mutations at positions (2 + 3) was co-transfected with either miR-548c-5p mimics or scrambled NC. Results were analysed using one-way ANOVA with Dunnett’s post-testing comparing P0 to all other primer pairs for hPCs at day (− 1) and HEK293T cells, while Tukey post-testing was used for evaluating target site fraction enrichment at progressing differentiation time points and miRNA enrichment.
Fig. 5.

Ago-ChIP experiments in hPCs, mPCs and HEK-293T cell lines. Results are depicted as fold change: on real-time PCR, the cycle thresholds obtained were calculated as enrichment to the input sample (10%). Baseline was defined by further normalising values over mock (mIgG or beads) % input IP values. a The five regions examined for enrichment in ChIP experiments and their position in relation to the miR-548c-5p target site and the FOXC2 gene. Primer set P0 amplifies a region containing the miR-548c-5p target site, whereas PD is specific for a region located within the FOXC2 gene. The schematic is not in scale. b DNA target site relative enrichment after Ago-ChIP experiments in undifferentiated hPCs. P0 was found to be significantly enriched compared to every other region examined while walking closer to the FOXC2 gene (p < 0.05 compared to region PA and p < 0.001 compared to regions PB, PC, PD). (*p < 0.05, **p < 0.01, ***p < 0.001, SEM, n ≥ 3 per primer set in 3 technical replicates), c miR-548c-5p relative enrichment following Ago-ChIP in undifferentiated hPCs. miR-548c-5p was significantly enriched when compared to the podocyte-specific miR-23b (p = 0.03), the predominantly nuclear miR-29c (p = 0.005) and miR-30d-3p (p = 0.005), also found in abundance in podocytes. (SEM, n ≥ 3 per primer set in 3 technical replicates). d Target site relative enrichment after Ago-ChIP experiments in HEK-293T cells. P0 was significantly enriched compared to regions PB (p < 0.01), PC (p < 0.001) and PD (p < 0.05), demonstrating a similar trend with undifferentiated hPCs. (*p < 0.05, **p < 0.01, ***p < 0.001, SEM, n = 3 per primer set in 3 technical replicates). e DNA target site relative enrichment in proliferating hPCs using a different anti-Ago antibody. A different anti-Ago antibody was used for verification purposes. Results are consistent with previous experiments as region P0 was significantly enriched compared to region PC (p = 0.006). (SEM, n = 3 per primer set in 3 technical replicates). f Relative enrichment of the P0 amplicon in selected hPC differentiation time points. P0 was significantly immunoprecipitated in day (− 1) and day 7 hPCs, suggesting an association between FOXC2 expression levels and target site occupancy by the RISC. (SEM, n ≥ 3 per primer set in 3 technical replicates). g Ago-ChIP experiments performed in mPCs transfected with plasmids containing the WT (p-WT-miR-548c-5p) or mutated miR-548c-5p target (p-Mut-miR-548c-5p) site plus flanking sequence upstream of FOXC2 in the presence or absence of miR-548c-5p mimics. mPCs represent a natural knock-out both for miR-548c-5p and its target site. When transfected with the pGL4.27 vector bearing the WT target site and miRNA mimics, an enhanced enrichment of the target site fragment (p = 0.001) was observed. This effect was lost when cells were transfected with a plasmid containing point mutations at positions 2 and 3 of the miRNA seed region (p < 0.0001) (SEM, n = 3 per condition in 3 technical replicates)
Chromosome conformation capture (3C)
The 3C protocol was carried out as previously described [36] to study the mobility of the miRNA target region towards the proximal promoter of FOXC2. Protein-bound DNA in lysed cells was digested with EcoRI and restriction fragments were ligated with the Instant Sticky-end Ligase MasterMix (New England Biolabs, USA). Ligation products were purified and analysed by qRT-PCR using primers with reverse orientation with respect to FOXC2 and a docking primer on the fragment bearing the miRNA target site (3C, Supp. Table 1). The BAC clone RP11-1017A18 (BACPAC Resources Center, USA) was used as the control non-interacting DNA sample for regions tested. The BAC clone contains a region of 16q24 starting from 86434189 bp to 8631166 bp and includes both the miRNA target site region (86558539–86558560 bp) and FOXC2 (86600857–86602537 bp). A random genomic region (ChIP primer-set PC) was amplified to normalise for template quantity. To further explore the effect of miR-548c-5p abundancy on DNA conformation dynamics, hPCs were transiently transfected with mimics or inhibitors and 3C was performed as described above, 24 h post-transfection at day (− 1) and day 1. Moreover, cells were transfected twice, once in every 24 h, with miRNA mimics or inhibitors and harvested at day 2, followed by 3C.
Protein expression
We examined the influence of prolonged treatments with miR-548c-5p mimics on FOXC2 and WT1 protein levels in podocytes entering differentiation and their recovery 2 days post-transfection. Expression levels of nephrin (NPHS1), podocin (NPHS2), p57 and Synaptopodin (SYNPO) were also examined. Results were normalised on β-Tubulin. hPCs were serially transfected at day (− 1) and day 1 with miRNA mimics and harvested 30 h or 48 h after the second transfection directly in 2× Laemli sample buffer (Sigma, USA). Lysates were homogenised with a 2 ml syringe and denatured at 95 °C for 5 min and equal volumes were subsequently analysed by SDS-PAGE gels. Antibodies used are found in Supp. Table 2. Cells transfected with the AllStars Negative Control (NC) (QIAGEN, UK) were used as controls. Band density was defined by ImageJ software (http://imagej.nih.gov/ij) and results were analysed using one-way ANOVA with Tukey post-testing or t test.
FOXC2 localisation in hPCs
FOXC2 localisation and expression during hPC differentiation were recorded in a time-course starting from day (− 1) and following the thermal switch from 33 to 37 °C on day 1 to day 7. Moreover, the effect of prolonged transfections with miRNA inhibitors or mimics on FOXC2 localisation was also investigated to examine whether it can potentially influence hPC differentiation dynamics through FOXC2 localisation. In differentiating hPCs, FOXC2 localisation was studied both on day 5, 12 h after 5 consecutive transfections with miRNA mimics, and day 8, following a recovery period of 3 days. In addition, in undifferentiated hPCs (day − 1), where the miRNA has a higher expression, FOXC2 localisation was examined after 5 serial transfections with miR-548c-5p inhibitors and mimics. In all cases, hPCs were seeded on coverslips and transfected every 24 h, as described above. Cells transfected with the AllStars Negative Control (NC) (QIAGEN, UK) were used as controls. Cells were fixed with 4% paraformaldehyde in PBS for 10 min, followed by 3 × 5 min washes with PBS. Cells were then permeabilised using 0.5% Triton X-100 in PBS for 2 min, followed by 3 × 5 min washes with PBS and blocking in 2% BSA for 1 h. Incubation with the primary antibody for FOXC2 sc-31734 (1:35) (Santa Cruz Biotechnology, TX, USA) at 4 °C took place overnight and was followed by incubation of the secondary antibody in PBS for 1 h at room temperature. Nucleus staining was performed with the use of TO-PRO®-3 Iodide (ThermoFisher Scientific, MA, USA) (1:1000) for 15 min at room temperature according to the manufacturer’s guidelines. Finally, transfected cells were mounted with fluorescence mounting medium (DAKO, USA). A detailed observation of the slides was conducted using a TCSL confocal microscope (Leica SP5, IL USA) and the images were obtained using the Leica LCS Software. To obtain quantitative results (Supp. Methods), the laser power and exposure were adjusted to avoid oversaturation as well as the PMT voltage, frame averaging, pinhole aperture size, scan speed, and zoom magnification remained constant in all images presented. Antibodies and reagents are listed in Supp. Table 2.
Results
miR-548c-5p has a full-length predicted target site upstream FOXC2
We explored the possibility of certain miRNAs having extended target sites on intergenic/promoter DNA sequences. Preliminary prediction analyses revealed notable results for MIR-548 family members in hits returned. Analysis by miRWalk2.0 revealed a high frequency of unusually lengthy target sites (most ≥ 15 nt) for MIR-548 family members (Fig. 1a) within the 10 kb promoter regions. With 43.56% of predicted sites, they outnumber those found in the 3′UTR (34.29%), in the coding sequence (16.54%) or in the 5′UTR (5.61%) (Fig. 1b). Upon comparing the mean values of the total predicted binding sites of 56 miRNAs belonging to MIR-548 family within gene promoter regions, the sites predicted to be targeted by miR-548l were significantly enriched (p < 0.001; One-way ANOVA) in 45 different pairwise comparisons (Supp. Table 3). miR-548c-5p closely followed miR-548l and appeared to have a significantly (p < 0.001) higher mean value of binding sites when compared with the mean values of 44 other members of MIR-548. This reflects a preferential appearance of predicted target sites upstream of candidate genes and suggests a functional significance. Target prediction analysis for miR-548c-5p at promoter sites returned many lengthy hits (Table 1). Among filtered hits, miR-548c-5p appeared to have a full-length target site at a region located > 8 kb upstream the FOXC2 transcription start point, between genes MTHFSD and FOXC2 (Fig. 1c). As FOXC2 is a very important podocyte transcription factor and is highly involved in podocyte differentiation, we sought to prove whether this target site has a functional significance over FOXC2 expression in a human podocyte cell line, which follows a gradual differentiation course, remaining undifferentiated when cultured at 33 °C and starting to differentiate when switched to 37 °C. Notably, while in primates both miR-548c-5p and its predicted target region are highly conserved, they are completely absent from mice, even though the genomic head-to-head arrangement of genes MTHFSD and FOXC2 is maintained (Fig. 1d, e). Hence, mouse podocytes can be considered as a natural knock-out system for both the miRNA and its target site, which we exploited in subsequent experiments.
Table 1.
Predicted target sites for miR-548c-5p on the 10 kb promoter region of different genes
| Associated gene | miRNA | Target complementarity (nt) | Start | End | p value | Seed region start (nt) |
|---|---|---|---|---|---|---|
| FOXC2 | hsa-miR-548c-5p | 22 | 1310 | 1289 | 0 | 1 |
| ANXA3 | hsa-miR-548c-5p | 22 | 9753 | 9732 | 0 | 1 |
| C1orf94 | hsa-miR-548c-5p | 22 | 8984 | 8963 | 0 | 1 |
| CDC23 | hsa-miR-548c-5p | 22 | 3638 | 3617 | 0 | 1 |
| FGF23 | hsa-miR-548o-5p | 22 | 140 | 119 | 0 | 1 |
| GPR141 | hsa-miR-548c-5p | 22 | 1914 | 1893 | 0 | 1 |
| NR0B1 | hsa-miR-548c-5p | 22 | 4273 | 4252 | 0 | 1 |
| NSUN5 | hsa-miR-548c-5p | 22 | 3064 | 3043 | 0 | 1 |
| OR2T8 | hsa-miR-548c-5p | 22 | 2955 | 2934 | 0 | 1 |
| PLAC1 | hsa-miR-548c-5p | 22 | 8757 | 8736 | 0 | 1 |
| PSTPIP2 | hsa-miR-548c-5p | 22 | 9230 | 9209 | 0 | 1 |
| RBP4 | hsa-miR-548c-5p | 22 | 2623 | 2602 | 0 | 1 |
| UBQLN2 | hsa-miR-548c-5p | 22 | 8296 | 8275 | 0 | 1 |
| ZNF418 | hsa-miR-548c-5p | 22 | 9269 | 9248 | 0 | 1 |
| ASB5 | hsa-miR-548c-5p | 21 | 6948 | 6928 | 0 | 1 |
| ATHL1 | hsa-miR-548c-5p | 21 | 7462 | 7442 | 0 | 1 |
| CLYBL | hsa-miR-548c-5p | 21 | 7613 | 7593 | 0 | 2 |
| GRP183 | hsa-miR-548c-5p | 21 | 1569 | 1549 | 0 | 2 |
| LBP | hsa-miR-548c-5p | 21 | 3246 | 3226 | 0 | 1 |
| NLRP11 | hsa-miR-548c-5p | 21 | 3015 | 2995 | 0 | 1 |
| ORM1 | hsa-miR-548c-5p | 21 | 336 | 316 | 0 | 2 |
| C11orf65 | hsa-miR-548c-5p | 20 | 8063 | 8044 | 0 | 1 |
| SSH1 | hsa-miR-548c-5p | 20 | 4831 | 4812 | 0 | 1 |
| ACSM2A | hsa-miR-548c-5p | 19 | 3269 | 3251 | 0 | 1 |
| ACSM2B | hsa-miR-548c-5p | 19 | 3291 | 3273 | 0 | 1 |
| AOX1 | hsa-miR-548c-5p | 19 | 9533 | 9515 | 0 | 1 |
| HRK | hsa-miR-548c-5p | 19 | 212 | 194 | 0 | 1 |
| PTER | hsa-miR-548c-5p | 19 | 9157 | 9139 | 0 | 1 |
Position number 1 is the first nucleotide 10 kb upstream of the transcription start site for each of the displayed genes
The miRNA first and last nucleotides are cited in a 3′–5′ direction. Regarding FOXC2, miR-548c-5p is predicted to target nucleotides 1310-1289, which correspond to 8690–8711 bp away from the FOXC2 transcription start point. Seed region starts at either the 1st or the 2nd nucleotide of the mature miRNA sequence
Expression patterns of FOXC2 and miR-548c-5p in differentiating hPCs suggest a dynamic relationship
The expression levels of FOXC2 and miR-548c-5p were examined in hPCs at nine day points during cell differentiation: day (− 1) (D−1, corresponding to undifferentiated and dividing cells cultured at 33 °C), day 1 (D1, 24 h after switching to 37 °C), day 2 (D2), day 3 (D3), day 4 (D4), day 7 (D7), day 10 (D10), day 13 (D13), and day 16 (D16). Results demonstrate an interchange between FOXC2 and miR-548c-5p pattern of expression. Specifically, FOXC2 is expressed at basal levels in undifferentiated cells. During initiation and early differentiation FOXC2 expression is increased, followed by a decrease to the same baseline as in undifferentiated cells, after a peak at day 2. miR-548c-5p follows the exact opposite pattern of expression; it is highly expressed in undifferentiated hPCs and its levels drop as differentiation initiates and is diminished at day 2 (Fig. 2a). Accordingly, the pattern of FOXC2 protein expression in hPCs during differentiation was also investigated and correlated with data on mRNA expression (Fig. 2b); cells at early days of differentiation show stronger FOXC2 staining. These patterns of expression suggested an inverse correlation during the crucial first days of differentiation, between miR-548c-5p and FOXC2, in response to the increasing needs for FOXC2 as hPCs enter differentiation. Similar measurements were performed for evaluating the response of the MTHFSD gene, located further upstream of the miRNA target site and results did not suggest a meaningful interdependence of expression during differentiation (results not shown; available on request). The expression levels of FLJ30679 and RP11-46309.5 did not seem to be affected by the differentiation timeline (results not shown).
Fig. 2.

FOXC2 and miR-548c-5p presence in hPCs. a Endogenous mRNA expression levels of FOXC2 and miR-548-5p at hPC differentiation time points. At day (− 1) where cells proliferate, FOXC2 levels are kept low and are elevated upon differentiation induction at day 1. By day 4 they return to previous baseline levels. miR-548c-5p is expressed in high levels at day (− 1) and its levels are reduced dramatically as differentiation initiates to reach a low level of expression by day 2. Results are suggestive of an interplay between FOXC2 and the miRNA, as they follow opposite patterns of expression to eventually return to baseline levels. (SEM, n = 3 per condition in 3 technical replicates). b FOXC2 localisation during the differentiation time course of hPCs. Images show representative confocal imaging of merged profiles from nuclei (blue) and FOXC2 (red). FOXC2 is mainly found in the nucleus of proliferating cells. As differentiation initiates FOXC2 nuclear localisation peaks at day 3 and gradually migrates from the nucleus to the cytoplasm as cells become larger and wider by day 7 (63× magnification). Result groups were analysed by one-way ANOVA with Tukey post-testing (*p < 0.05, **p < 0.01, ***p < 0.001, n ≥ 5 from independent slide preparations)
miR-548c-5p recognises the predicted DNA target sequence with seed region specificity
We investigated this potential inter-relationship in cell culture luciferase construct experiments (Fig. 3a). We co-transfected undifferentiated hPCs with miR-548c-5p mimics and the pGL4.27-wt vector, which contained the wild-type miRNA target site and flanking sequences. Luciferase expression was reduced by 30% (see “Methods”). Importantly, luciferase expression was induced by 40% upon co-transfection with miRNA inhibitors, compared to the control (Fig. 3b). When mutating position-2 (p.2) of the seed region, luciferase was still induced by inhibitors, presumably owing to a strong effect of the endogenous miR-548c-5p (Fig. 3c, left). However, the subsequent addition of more mutations in the seed region positions 2–5, results in abolishing entirely this effect. This behaviour is reminiscent to how miRNAs identify target sites on 3′UTRs (Fig. 3c). The control represented transfections with the AllStars NC scrambled sequence LNA.
FOXC2 mRNA levels are influenced by miR-548c-5p in hPCs
Consistent with the luciferase construct transfection results, persistent presence of miRNA mimics in two serial transfections of undifferentiated hPCs reduced FOXC2 mRNA levels by 30%, while inhibitors increased expression by 40% compared to control transfections (Fig. 4a). Importantly, in mouse PCs (mPCs), a natural knock-out for both miR-548c-5p and its target site neither mimics nor inhibitors affect mFoxc2 mRNA levels (Fig. 4b). This finding lends confidence to the results with hPCs.
Fig. 4.

Influence of miR-548c-5p on endogenous FOXC2 mRNA levels. aFOXC2 mRNA levels in undifferentiated hPCs transfected with miRNA mimics or inhibitors. Two sequential transfections were performed in undifferentiated hPCs with either miRNA mimics or inhibitors. FOXC2 levels were decreased by 30% (p = 0.04) with the addition of miRNA mimics and increased by 40% with miRNA inhibitors (p = 0.03). (SEM, n = 3 per condition in 3 technical replicates). bmFoxc2 mRNA levels in undifferentiated mPCs transfected with miRNA mimics or inhibitors. Two sequential transfections were performed in mPCs, which lack both miR-548c-5p and its target site, with either miRNA mimics or inhibitors. Transfections had no effect on the expression levels of mFoxc2 (SEM, n = 3 per condition in 3 technical replicates). cFOXC2 mRNA levels at days 2 and 8 of differentiation following transfections of hPCs with miRNA mimics or inhibitors. Cells at day 1 and day 7 were transfected with miR-548c-5p mimics/inhibitors and harvested 24 h later. miRNA inhibitors cause a significant increase in FOXC2 mRNA levels in both day 2 and day 8 (p = 0.05 and p = 0.02). However, miRNA mimics significantly reduced FOXC2 levels only at day 2 (p = 0.005), whereas at day 8 miR-548c-5p mimics fail to induce a reduction (p = 0.94), possibly due to prior satiety of the target site. (SEM, n = 3 per condition in 3 technical replicates)
During hPC differentiation, cells transfected at day 1 and day 7 with miR-548c-5p mimics/inhibitors and harvested 24 h later (day 2 and day 8, respectively); FOXC2 mRNA levels followed the same pattern in both settings and are in agreement with results at day (− 1), thus demonstrating a specific effect of the miRNA on FOXC2 expression (Fig. 4c). This is suggestive of a dynamic system involving the abundance of miR-548c-5p and FOXC2 mRNA in response to hPC course of differentiation. Specifically, at day 2, when miR-548c-5p expression levels are reduced and FOXC2 levels are increased (Fig. 2a), miRNA mimics repress FOXC2 in a setting resembling undifferentiated cells; i.e., miRNA levels are high while FOXC2 expression is low. Inhibitors, on the other hand, cause a significant increase in FOXC2 levels at day 2. At day 8, even though miRNA inhibitors cause an increase in the levels of FOXC2, miRNA mimics do not act correspondingly. Possibly this is due to a failure to exert an effect when the need for FOXC2 by the cell is low and all endogenous miR-548c-5p is engaged on the target site.
The RISC is bound on the miR-548c-5p DNA target region at day (− 1) and day 7
Ago-ChIP experiments were performed in hPCs at day (− 1) (undifferentiated cells). The DNA sequence encompassing the miR-548c-5p target site was significantly enriched compared to other genomic regions closer to and into the FOXC2 gene. Amplicon P0 (Fig. 5a) showed a highly statistically significant consistent enrichment over all other amplicons (amplicons PA-PD in Fig. 5b). The same samples were tested for the nuclear enrichment of the miR-548c-5p, per se. Compared to control miRNAs that included miR-23b (podocyte specific), miR-29c (mainly active in the nucleus) [7, 33] and miR-30d-3p (active in podocytes) [34, 35], the miR-548c-5p was significantly enriched in immunoprecipitated samples at day (− 1) (Fig. 5c). In another setting, P0 had comparable enrichment in non-differentiating HEK293T cells (Fig. 5d). Quite importantly, repetition of these experiments with a different anti-Ago antibody (Millipore, Germany) produced a similar enrichment when comparing P0 to PC (Fig. 5e). Collectively, these results suggest that the RISC complex is bound at this region in both undifferentiated hPCs and HEK293T, presumably guided by miR-548c-5p, which is highly enriched in hPC nuclei. Different time points in differentiating hPCs demonstrated occupation of the target site fragment P0 by RISC at day (− 1) and day 7 (Fig. 5f), corresponding to the baseline expression pattern of FOXC2 mRNA at the same day points (Fig. 2a).
The target site occupancy by miR-548c-5p and the target sequence specificity were evaluated by Ago-ChIP experiments in undifferentiated mPCs, which is an absolute negative control for both the miRNA and its target site upstream of FOXC2. For this, double transfection experiments were performed using a combination of the pGL4.27 vectors used previously in luciferase experiments (Fig. 3) with miR-548c-5p mimics or negative control (scrambled LNA). The results revealed an enrichment of the target site fragment in mPCs transfected with the pGL4.27-wt construct bearing the wild-type target sequence upstream of FOXC2 (P-WT-miR-548c-5p) and miR-548c-5p mimics (Fig. 5g). Enrichment was lost when a plasmid mutated (P-Mut-miR-548c-5p) at seed region positions 2 and 3 was used.
Evidence for mobility of miR-548c-5p target site region towards the FOXC2 proximal promoter when hPC differentiation initiates
Results as far demonstrated a cross-talk between miR-548c-5p and FOXC2 mRNA expression and supported an interaction of the miRNA with its target site upstream of FOXC2. Equally importantly, Ago-ChIP results demonstrated occupancy of the miR-548c-5p target site region by RISC at two specific time points. Taken together, these results were suggestive of an enhancing effect by the DNA target region under study, possibly exerted due to DNA conformational changes causing its mobility and juxtaposition against the proximal FOXC2 promoter sequences. To investigate the occurrence of such interactions, 3C experiments were performed at four hPC differentiation day points (Fig. 6a). Evidently, cells at day 1 demonstrate a notable enrichment of the resulting fragment α–γ, which signifies the interaction between the miRNA target site region and the promoter region of FOXC2, while the effect attenuates in the remaining fragments. Day (− 1) and day 2 follow a similar but less prominent effect for fragment α–γ, with the effect being completely lost by day 7. In greater detail, the relative crosslinking frequency between α–γ at day (− 1) is lower than the one seen at day 1, which signifies reduced interaction between fragment α containing the target site and fragment γ (FOXC2 promoter). This correlates with the enrichment of fragment P0 in Ago-ChIP experiments at day (− 1) (Fig. 5f) as the RISC appears to be bound on the target site and thus hinders the interaction of fragments α–γ. Considering how FOXC2 mRNA levels rise when differentiation initiates (Fig. 2a), RISC appears to be released from region P0 when the mobility of the target site fragment towards the promoter of FOXC2 is more pronounced at day1 to increase the boost expression levels. At day 7, the target site region appears enriched in Ago-ChIP experiments (Fig. 5f) and no interactions were expected to take place at the chromosomal level, while FOXC2 mRNA levels are at baseline. Moreover, following transfection of hPCs with miR-548c-5p mimics and inhibitors, the relative cross-linking efficiency of fragment α–γ was affected. Mimics introduced at day (− 1) diminished all interactions, while inhibitors demonstrated enrichment of α–γ fragments (Fig. 6b). The same results were observed in hPCs transfected at day 1 (Fig. 6c). To investigate interactions in further, cells were transfected with mimics and inhibitors for two consecutive days (day 1 and day 2) before harvesting. In this case, the pattern of α–γ enrichment was much stronger with inhibitors and appeared to have a distinct difference compared to all other fragments (Fig. 6d). Results are suggestive of a coordinated mobility configuration of the target site region towards the promoter of FOXC2 and chromosomal dynamics seem to be specifically influenced by miR-548c-5p abundancy in the cell. These interactions suggest the presence of a yet unknown enhancer element related to the miR-548c-5p target site region, which seems to remain constrained in undifferentiated hPCs at day (− 1) and differentiating cells at day 7, when FOXC2 remains at baseline expression levels.
Fig. 6.

Target site chromosomal conformation interactions during hPC differentiation. 3C experiments were performed at different hPC differentiation time points. Ligation products were quantified by qRT-PCR. Amplicons were obtained using a reverse docking primer (a) (DOCK) (represented by the black arrow, lower panel in a), at the DNA fragment containing the miR-548c-5p target site (α) and different reverse primers (b–e) each representing a fragment generated after EcoRI digestion at specific sites (E1–E5) of crosslinked DNA. Position of EcoRI restriction sites is noted by numbering relevant to the BAC clone used as a control. Region (α) was designated as the region between positions E1 and E2 of EcoRI digestion, which includes the miR-548c-5p target site, region (β) between positions E2 and E3, region (γ) containing the FOXC2 proximal promoter between E3 and E4, region (δ) between E4 and E5 including part of the FOXC2 gene, region (ε) after position E5. The lower panel schematic is not in scale. The interaction between region α and the four other regions was determined. The relative cross-linking frequency of the fragment α–β was set as the starting point to evaluate interactions due to DNA conformational changes. All results are plotted by SEM, n = 3 per condition in 3 technical replicates. a miR-548c-5p target site region interacts with the FOXC2 promoter upon differentiation induction in hPCs. In four hPC differentiation time points (day (− 1), day 1, day 2, day 7), it was observed that the target site fragment (α) mobility towards fragment (γ) was enriched at day 1 compared to other day points and every interaction was diminished by day 7. b Interactions were altered after transfection of hPCs with miR-548c-5p mimics and inhibitors at day (− 1). Cells transfected with miRNA mimics at day (− 1) presented a marked loss of α–γ enrichment, while inhibitors kept this interaction at high levels. c Dynamics in hPCs at day 1 were altered by miRNA mimics. In line with results of cells transfected at day (− 1), the relative cross-linking efficiency of fragment α–γ appeared also to be compromised by miRNA mimics at day 1 of differentiation. d Sequential transfections of hPCs at days 1 and 2 with miRNA mimics or inhibitors result in similar effects. Mimics introduced in differentiating cells were able to reduce interactions between fragments α and γ, while inhibitors enhanced interactions. The enrichment of fragment α–δ by inhibitors appeared markedly low compared to α–γ to signify a strong interaction of the site with the promoter region of FOXC2
Increased miR-548c-5p affects FOXC2 protein levels
Cells entering differentiation experience a drop in miR-548c-5p expression during the first days, to reach baseline levels at later time-points (Fig. 2a). To study the effect of high miR-548c-5p levels on protein expression of FOXC2, WT1 and other podocyte markers, hPCs were transfected with mimics and scrambled NC and switched to 37 °C to initiate differentiation. Cells were transfected at two consecutive time points, day 1 and day 2, and were either harvested after 30 h to study the effects caused by the elevation of miR-548c-5p, or after 48 h to see how protein levels recover. At 30 h post-transfection, FOXC2 protein levels were significantly reduced compared to controls (Fig. 7). Moreover, as the cells were let to recover for 48 h after the last transfection time point, FOXC2 protein expression was significantly increased compared to controls. In line with data on FOXC2 mRNA expression (Fig. 4c), high levels of miR-548c-5p during the first days of differentiation cause a delay in FOXC2 protein expression, an effect which might imply that the differentiation course of podocytes is delayed by miRNA mimics. Accordingly, the expression of WT1, the most important transcription factor and a specific marker of podocytes, known to succeed FOXC2 in podocyte differentiation, is also down-regulated in transfected cells and does not recover (Fig. 7). The increase in FOXC2 levels 48 h post-transfection and four days into differentiation indicates a delayed initiation of differentiation, also reflected by WT1 reduced levels. Nephrin levels remain lower in both transfected and recovering cells, while podocin expression seems to be unaffected with a slight (but not statistically significant) increase in expression in recovering cells (Fig. 7), Synaptopodin remains stably expressed indicating the preservation of cell type identity. Moreover, a great increase in p57 expression, known to induce cell cycle arrest [14, 37], was observed 30 h post-transfection, possibly demonstrating the end of the proliferating stage, while in recovering cells p57 levels have no difference between cells treated with mimics and the control (Fig. 7).
Fig. 7.
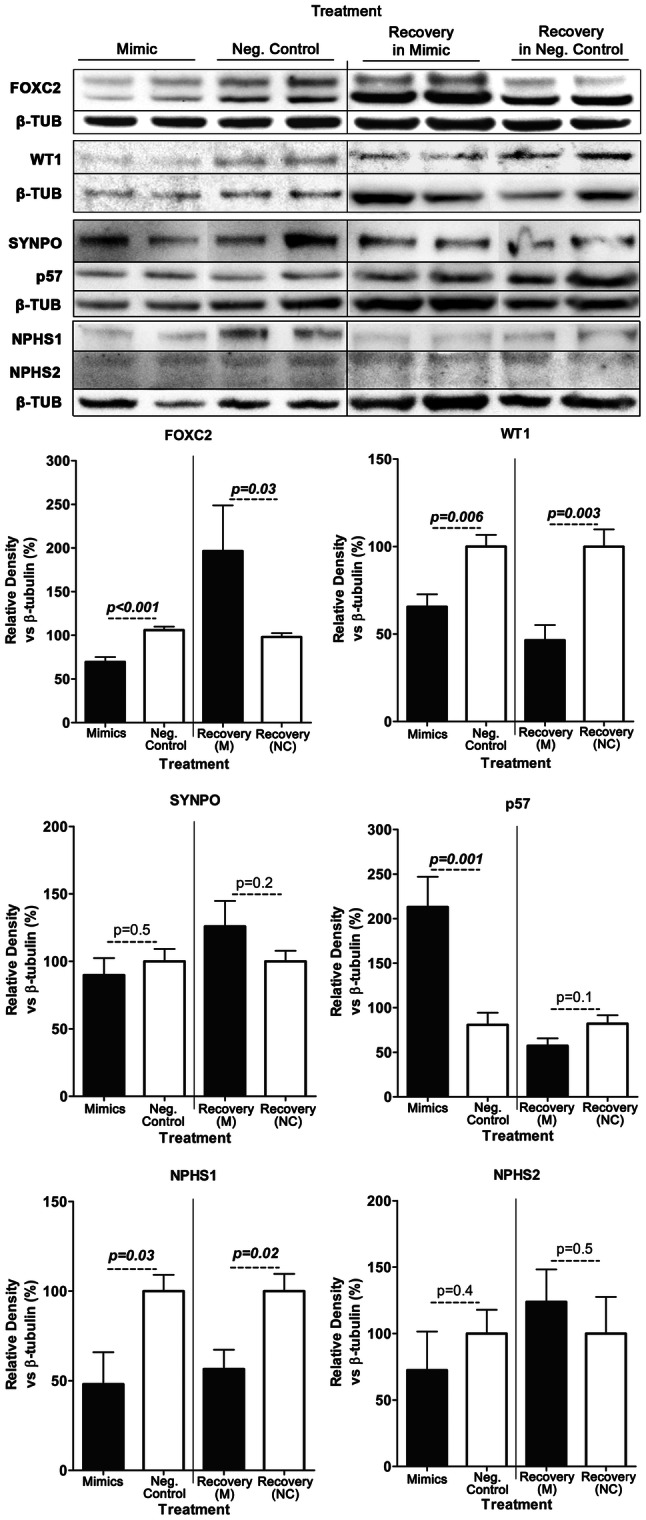
Podocyte protein levels are influenced by miR-548c-5p mimics. hPCs were serially transfected at day (− 1) and day 1 with miR-548c-5p mimics (M) or negative control LNAs (Neg. Control) and harvested 30 h after the second transfection or 48 h post the second transfection (Recovery). FOXC2, WT1 and NPHS1 protein levels were significantly reduced in cells harvested 30 h post-transfection compared to control samples. On the contrary, a substantial increase in the expression of p57 was observed (p = 0.001), whereas NPHS2 and synaptopodin levels did not differ significantly from control samples (SEM, n = 3 per LNA). In recovery cells, harvested 48 h post-transfection, FOXC2 levels were increased, whereas WT1 levels were reduced compared to the control samples. NPHS1 levels remain low, whereas NPHS2, p57 and synaptopodin remained unaffected (SEM, n ≥ 3 per LNA)
Localisation of FOXC2 in differentiating hPCs is affected by miR-548c-5p mimics
In undifferentiated human podocytes, FOXC2 accumulates in the nucleus, while in differentiated cells it becomes mainly perinuclear. On day 3 of differentiation when FOXC2 levels are high, its nuclear localisation is more pronounced (Fig. 2b). This result is in line with the data on FOXC2 mRNA expression (Fig. 2a), where FOXC2 appears to peak at day 1 and day 2 and returns to basal levels later, while high protein levels are retained until day 3, in accordance with its longer half-life. Previous publications also support that podocytes overexpressing FOXC2 have a stronger nuclear staining [37, 38]. More specifically, small-sized undifferentiated hPCs keep FOXC2 in the nucleus, while cells entering differentiation have strong nuclear staining which gradually moves mostly around the nucleus and into the cytoplasm, accompanied by FOXC2 reduction and marking cell differentiation (Fig. 2b).
In parallel to Western blot data, to study the effect of high miR-548c-5p concentration in hPCs on FOXC2 localisation, differentiating hPCs were transfected with miR-548c-5p mimics for 5 consecutive days. Then, they were either harvested 12 h post-transfection (day 5) or after they were left to recover for 72 h (day 8). In controls at day 5, FOXC2 expression in hPCs is low and has a cytoplasmic or perinuclear localisation, as expected. Image analysis corroborates this also for cells transfected with miRNA mimics. However, in recovering cells, when the mimic effect has faded by day 8 (72 h post the last transfection), FOXC2 has a stronger nuclear staining and significantly higher expression, as seen by densitometry analysis (Fig. 8a). Recovering cells resemble those undergoing differentiation at day 3 and demonstrate a delay in FOXC2 expression profile although they appear large and differentiated like, similar to day 7 cells (Fig. 2b). Hence, this mixed phenotype in hPCs suggests that the miRNA abundance, at differentiation time points where the endogenous miR-548c-5p is low, appears to influence FOXC2 expression dynamics.
Fig. 8.

FOXC2 localisation in hPCs in response to miR-548c-5p. Loss of miRNA expression induces expression of FOXC2. Densitometry analysis was performed by ImageJ and all result groups were analysed by one-way ANOVA with Tukey post-testing (**p < 0.01, ***p < 0.001, n ≥ 5 from independent slide preparations). a miR-548c-5p mimics effect on FOXC2 in differentiating podocytes. Representative confocal imaging of differentiating hPCs transfected with miR-548c-5p mimics for 5 consecutive days and harvested 12 h (day 5) and 72 h (day 8) post-transfection. In cells harvested at day 5 (miR-548c-5p mimics day 5), FOXC2 displayed a similar cytoplasmic localisation to the control. In cells let to recover for three days after mimic transfections (miR-548c-5p fades out by day 8, hence cells recover), FOXC2 had a stronger expression compared to controls and was also localised in the nuclei of cells, resembling cells in the early stages of differentiation (63× magnification). b Effect of miR-548c-5p inhibition in undifferentiated hPCs on FOXC2 localisation. Representative confocal imaging of undifferentiated hPCs at day (− 1), transiently transfected with miR-548c-5p inhibitors (miR-548c-5p inhibitors) and mimics (miR-548c-5p mimics) for 5 consecutive days. miRNA inhibitors resulted in stronger FOXC2 staining in the cytoplasm and nuclear localisation of FOXC2 was more pronounced. Contrastingly, FOXC2 expression appears to weaken by miRNA mimics compared to inhibitors (63× magnification)
The abundance of miR-548c-5p was also studied in undifferentiated hPCs at day (− 1), which express the miRNA at high levels (Fig. 2a). By knocking-down miR-548c-5p in proliferating undifferentiated hPCs with inhibitors for 5 consecutive days, FOXC2 was found to be strongly expressed. It appears to stain both inside and around the nucleus, with nuclear staining being significantly higher compared to the control and cells transfected with miRNA mimics (Fig. 8b). Again, this appearance is reminiscent of differentiating cells at day 3, while cells are smaller in size (Fig. 2b).
Discussion
During the last few years, numerous studies have demonstrated the importance of miRNAs in the regulation of gene transcription, a feature complementing their well-established action in fine-tuning mRNA translation. According to miRbase [26], MIR-548 family is composed of 121 mature miRNAs, 81 of which are found in humans and 40 are primate specific. Prediction analyses of MIR-548 members using the miRWalk2.0 platform revealed target sites higher in number and length, located on genomic sequences upstream of the transcription start sites or “promoters”, compared to other regions. Specifically, targets in the region upstream the transcription start sites represent 43.56% (Fig. 1a, b). This can be well explained by their origin; such MADE1-type sequences originating from TEs are spread out in the human genome and are more likely to be placed in non-coding regions. We focused on miR-548c-5p due to the optimal p values it gave when evaluating its putative targeting properties by miRWalk2.0. In this work, we selected to study a site located upstream the transcription start site of FOXC2.
The members of MIR-548 share high sequence similarity, with some being identical while others only differing by one or two bases. Regarding miR-548c-5p, the same mature sequence is shared with miR-548am-5p and miR-548o-5p, both derived from separate loci, signifying the importance in dosage of this miRNA for cells. On the contrary, miR-548z has a complementary mature sequence to that of miR-548c-5p and is transcribed from intron-1 of the RASSF3 gene (Ras-association factor 3), the same transcript that gives rise to miR-548c-5p. This is suggestive of a regulatory relationship between the two miRNAs, probably involving their host gene RASSF3, a possible tumour suppressor that induces apoptosis and cell cycle arrest through p53 [38].
We sought to demonstrate that the expression of FOXC2, the earliest podocyte marker with a prominent role in differentiation, development and maturation of podocytes, is tuned, at least partly, by miR-548c-5p through a target site located > 8 kb upstream the gene’s transcription start site (Fig. 1c). Using luciferase constructs, we showed that miR-548c-5p targets this site through its seed region (Fig. 3b). A similar functional pattern was shown by Meng et al., for small activating RNA molecules that targeted a region 1.6 kb upstream of the progesterone receptor gene promoter [39]. Such interactions are suggestive of preservation in miRNA properties, not only restricted to the cytoplasm, but also expanding to the nucleus to finely regulate gene transcription. This is the first study exhibiting transcriptional regulation of a gene by a miRNA through such a distal DNA target site. It is likely that many other miRNAs and especially other members of the MIR-548 family also have similar properties.
FOXC2 and miR-548c-5p expression levels in differentiating hPCs strongly indicate the presence of a dynamic system involving the abundance of the miRNA and FOXC2 mRNA towards cell differentiation (Fig. 2a). FOXC2 mRNA levels respond to miRNA abundancy in both undifferentiated and differentiating hPCs (Fig. 4a, c). Alternating expression levels of miR-548c-5p and FOXC2 might be the driving force to generate interactions between the miRNA’s target site region and the promoter of the gene. In 3C experiments, this interaction appears to be enhanced upon induction of hPC differentiation and subsequently fades out (Fig. 6a). The effect on DNA conformation dynamics was lost when miR-548c-5p mimics were introduced in hPCs, while inhibitors enhanced this interaction (Fig. 6b–d). The possibility that an enhancer element, still undefined, is present at the target site region cannot be excluded. This interaction seems to occur when the expression of miR-548c-5p drops and FOXC2 mRNA levels are boosted at day 1 and day 2 (Fig. 2a), thus leading to an association between the miRNA/RISC target site occupancy and expression data. In support to this notion, data generated by Ago-ChIP experiments demonstrate a significant enrichment of the target site fragment and miR-548c-5p in undifferentiated dividing hPCs (Fig. 5b). In mouse podocytes transfected with miR-548c-5p mimics and the luciferase reporter vector, the target site is significantly enriched (Fig. 5g), signifying that the effect observed is directly related to the miRNA. Such interactions might naturally occur in other cells as well; a non-differentiating cell system such as the HEK293T line also demonstrated enriched Ago-target site interactions (Fig. 5d). Considering all data presented herein, a mechanism is proposed by which the RISC/miR-548c-5p complex modifies the levels of FOXC2 with regard to hPC course of differentiation (Fig. 9). It is hypothesised that the target site region behaves as a distal regulatory element, occupied by RISC/miR-548c-5p to impede DNA–DNA interactions when FOXC2 has a basal expression and is released in response to high demands in FOXC2. miR-548c-5p keeps with the general notion of miRNA action; it fine tunes gene expression, instead of silencing or drastically increasing the expression levels of its target gene. A different line of investigations is required to further examine this hypothesis in a direct fashion.
Fig. 9.

Proposed mechanism. In undifferentiated podocytes at day (− 1), miR-548c-5p directs the RISC complex to its specific target site and thus the region becomes occupied, moderating its interaction with the FOXC2 promoter. Enhancement of gene expression is hindered, but certainly not expected to be silenced completely. When the RISC/miR-548c-5p complex is no longer bound onto the target site, the region is released and interacts with the gene’s promoter region, thereby increasing FOXC2 transcription rate and inducing differentiation. It is possible that the target site is part of a yet unknown distal enhancer element. As differentiation progresses and FOXC2 is inessential for podocyte differentiation, hence, juxtaposition of the enhancer element with the FOXC2 proximal promoter is no longer needed for gene expression enhancement and thus the site becomes deactivated. By day 7, the RISC complex is found to be bound on the target site, but not as abundantly as in proliferating podocytes, which could indicate an attempt to restrain but not diminish FOXC2 levels in the podocyte
To delve further into the role of the miRNA-FOXC2 relationship in hPC differentiation, the effect of this miRNA in hPCs on the protein levels of FOXC2 was also explored. In every occasion when miR-548c-5p, either endogenous or transfected mimic, was removed from the system, FOXC2 levels increased. More specifically, in immunofluorescence experiments, differentiating cells recovering from mimics (Fig. 8a) and undifferentiated cells serially transfected with inhibitors (Fig. 8b) resembled cells undergoing differentiation that overexpress FOXC2. Moreover, in Western blot experiments WT1 expression was delayed in cells recovering from miRNA transfections, as well as the expression of the podocyte-specific marker nephrin while the expression of the FOXC2-induced podocyte marker podocin had no significant changes in expression but levels seem to be slightly elevated in response to the high FOXC2 levels. In addition, p57 expression is significantly increased at 30 h post-transfection indicating cell cycle arrest and thus the end of proliferation and beginning of differentiation, thus signifying a delay in differentiation induction compared to the control samples (Fig. 7). It was deemed important to investigate the prolonged effect of miR-548c-5p on podocytes and how this might affect the differentiation process. This was done by maintaining miR-548c-5p levels through sequential mimic transfections, while the cells were given the stimulus for differentiation induction and observing changes in FOXC2 and other podocyte marker expression. Results suggest that the presence of miR-548c-5p in hPCs affects FOXC2 levels, which in turn may influence their differentiation course. These results exemplify the already established role for FOXC2 as the starting point of podocyte differentiation and introduce miR-548c-5p as an extra monitoring factor of a well-orchestrated process leading to podocyte differentiation. It does not escape our attention that differentiation in immortalised hPCs is only a simulation of the natural reality; the effect observed might be more prominent due to the ongoing proliferation, but our results suggest that it is not random. Since this cell line emerged from primary podocytes, cells seem to preserve their identity even when undifferentiated, as they express cell-type-specific proteins and present with podocyte-specific characteristics even at an immature state (see synaptopodin and nephrin expression, Fig. 7).
Evidently, both the miRNA and its target site are absent from non-primates and miR-548c-5p has no effect on mFoxc2 expression (Fig. 1d, e, 4b), rendering the miR-548c-5p/FOXC2 interaction primate specific. This implies that miR-548c-5p and presumably other miRNAs are important for tuning cellular processes including differentiation, but are not essential for differentiation to occur, also supported by experiments in dicer knockout mice [16]. Hence, the evolutionary emergence of similar regulatory elements in primates could be attributed to the increased complexity of mammalian cellular systems and, in this case, pinpoints the need for a more defined and controlled gene expression.
Electronic supplementary material
Below is the link to the electronic supplementary material.
Supp. Table 1: Primer sequences and product sizes (XLSX 12 kb)
Supp. Table 2: Antibodies used and IF reagents (DOCX 14 kb)
Supp. Table 3: Mean value comparison of predicted target sites on promoter regions between different miRNA species of family miR-548 (XLSX 23 kb)
Supp. Methods: Supplementary methods (DOCX 16 kb)
Acknowledgements
The authors would like to thank Prof. Moin Saleem and Prof. Tobias Huber for providing the human and mouse podocyte cell lines, respectively. This project was supported by a grant co-funded by the European Regional Development Fund and the Republic of Cyprus through the Research Promotion Foundation (Strategic Infrastructure Project NEW INFRASTRUCTURE/STRATEGIC/0308/24) to CD.
Author contributions
GP, AC, KF and CD designed the study; AC, GP and NM carried out experiments and analysed data; HD, NG and GP worked on predictions and bioinformatics, GP, AC, and CD drafted and revised the paper; all authors approved the final version of the manuscript.
Compliance with ethical standards
Conflict of interest
All authors declare that they have no conflict of interest.
Footnotes
Publisher's Note
Springer Nature remains neutral with regard to jurisdictional claims in published maps and institutional affiliations.
Andrea Christofides and Gregory Papagregoriou contributed equally.
Contributor Information
Gregory Papagregoriou, Email: papagregoriou@ucy.ac.cy.
Constantinos Deltas, Email: deltas@ucy.ac.cy.
References
- 1.Wu L, Fan J, Belasco JG. MicroRNAs direct rapid deadenylation of mRNA. Proc Natl Acad Sci USA. 2006;103(11):4034–4039. doi: 10.1073/pnas.0510928103. [DOI] [PMC free article] [PubMed] [Google Scholar]
- 2.Filipowicz W, Bhattacharyya SN, Sonenberg N. Mechanisms of post-transcriptional regulation by microRNAs: are the answers in sight? Nat Rev Genet. 2008;9(2):102–114. doi: 10.1038/nrg2290. [DOI] [PubMed] [Google Scholar]
- 3.Kiriakidou M, Nelson PT, Kouranov A, Fitziev P, Bouyioukos C, Mourelatos Z, Hatzigeorgiou A. A combined computational-experimental approach predicts human microRNA targets. Genes Dev. 2004;18(10):1165–1178. doi: 10.1101/gad.1184704. [DOI] [PMC free article] [PubMed] [Google Scholar]
- 4.Chen K, Song F, Calin GA, Wei Q, Hao X, Zhang W. Polymorphisms in microRNA targets: a gold mine for molecular epidemiology. Carcinogenesis. 2008;29(7):1306–1311. doi: 10.1093/carcin/bgn116. [DOI] [PubMed] [Google Scholar]
- 5.Mourelatos Z, Dostie J, Paushkin S, Sharma A, Charroux B, Abel L, Rappsilber J, Mann M, Dreyfuss G. miRNPs: a novel class of ribonucleoproteins containing numerous microRNAs. Genes Dev. 2002;16(6):720–728. doi: 10.1101/gad.974702. [DOI] [PMC free article] [PubMed] [Google Scholar]
- 6.Sasaki T, Shiohama A, Minoshima S, Shimizu N. Identification of eight members of the Argonaute family in the human genome. Genomics. 2003;82(3):323–330. doi: 10.1016/s0888-7543(03)00129-0. [DOI] [PubMed] [Google Scholar]
- 7.Liao JY, Ma LM, Guo YH, Zhang YC, Zhou H, Shao P, Chen YQ, Qu LH. Deep sequencing of human nuclear and cytoplasmic small RNAs reveals an unexpectedly complex subcellular distribution of miRNAs and tRNA 3′ trailers. PLoS One. 2010;5(5):e10563. doi: 10.1371/journal.pone.0010563. [DOI] [PMC free article] [PubMed] [Google Scholar]
- 8.Place RF, Li LC, Pookot D, Noonan EJ, Dahiya R. MicroRNA-373 induces expression of genes with complementary promoter sequences. Proc Natl Acad Sci USA. 2008;105(5):1608–1613. doi: 10.1073/pnas.0707594105. [DOI] [PMC free article] [PubMed] [Google Scholar]
- 9.Kim DH, Saetrom P, Snove O, Jr, Rossi JJ. MicroRNA-directed transcriptional gene silencing in mammalian cells. Proc Natl Acad Sci USA. 2008;105(42):16230–16235. doi: 10.1073/pnas.0808830105. [DOI] [PMC free article] [PubMed] [Google Scholar]
- 10.Younger ST, Corey DR. Transcriptional regulation by miRNA mimics that target sequences downstream of gene termini. Mol BioSyst. 2011;7(8):2383–2388. doi: 10.1039/c1mb05090g. [DOI] [PMC free article] [PubMed] [Google Scholar]
- 11.Weinmann L, Hock J, Ivacevic T, Ohrt T, Mutze J, Schwille P, Kremmer E, Benes V, Urlaub H, Meister G. Importin 8 is a gene silencing factor that targets argonaute proteins to distinct mRNAs. Cell. 2009;136(3):496–507. doi: 10.1016/j.cell.2008.12.023. [DOI] [PubMed] [Google Scholar]
- 12.Wei Y, Li L, Wang D, Zhang CY, Zen K. Importin 8 regulates the transport of mature microRNAs into the cell nucleus. J Biol Chem. 2014;289(15):10270–10275. doi: 10.1074/jbc.C113.541417. [DOI] [PMC free article] [PubMed] [Google Scholar]
- 13.Corey DR. Regulating mammalian transcription with RNA. Trends Biochem Sci. 2005;30(12):655–658. doi: 10.1016/j.tibs.2005.09.007. [DOI] [PubMed] [Google Scholar]
- 14.Harvey SJ, Jarad G, Cunningham J, Goldberg S, Schermer B, Harfe BD, McManus MT, Benzing T, Miner JH. Podocyte-specific deletion of dicer alters cytoskeletal dynamics and causes glomerular disease. J Am Soc Nephrol. 2008;19(11):2150–2158. doi: 10.1681/ASN.2008020233. [DOI] [PMC free article] [PubMed] [Google Scholar]
- 15.Papagregoriou G. MicroRNAs in disease. In: Felekkis K, Voskarides K, editors. Genomic elements in health, disease and evolution—junk DNA. New York: Springer; 2015. pp. 17–46. [Google Scholar]
- 16.Ho J, Ng KH, Rosen S, Dostal A, Gregory RI, Kreidberg JA. Podocyte-specific loss of functional microRNAs leads to rapid glomerular and tubular injury. J Am Soc Nephrol. 2008;19(11):2069–2075. doi: 10.1681/ASN.2008020162. [DOI] [PMC free article] [PubMed] [Google Scholar]
- 17.Shi S, Yu L, Chiu C, Sun Y, Chen J, Khitrov G, Merkenschlager M, Holzman LB, Zhang W, Mundel P, Bottinger EP. Podocyte-selective deletion of dicer induces proteinuria and glomerulosclerosis. J Am Soc Nephrol. 2008;19(11):2159–2169. doi: 10.1681/ASN.2008030312. [DOI] [PMC free article] [PubMed] [Google Scholar]
- 18.Kietzmann L, Guhr SS, Meyer TN, Ni L, Sachs M, Panzer U, Stahl RA, Saleem MA, Kerjaschki D, Gebeshuber CA, Meyer-Schwesinger C. MicroRNA-193a regulates the transdifferentiation of human parietal epithelial cells toward a podocyte phenotype. J Am Soc Nephrol. 2015;26(6):1389–1401. doi: 10.1681/ASN.2014020190. [DOI] [PMC free article] [PubMed] [Google Scholar]
- 19.Kreidberg JA, Sariola H, Loring JM, Maeda M, Pelletier J, Housman D, Jaenisch R. WT-1 is required for early kidney development. Cell. 1993;74(4):679–691. doi: 10.1016/0092-8674(93)90515-r. [DOI] [PubMed] [Google Scholar]
- 20.Rascle A, Suleiman H, Neumann T, Witzgall R. Role of transcription factors in podocytes. Nephron Exp Nephrol. 2007;106(2):e60–e66. doi: 10.1159/000101794. [DOI] [PubMed] [Google Scholar]
- 21.Subramanian A, Sidhom E-H, Emani M, Sahakian N, Vernon K, Zhou Y, Kost-Alimova M, Weins A, Slyper M, Waldman J, Dionne D, Nguyen LT, Marshall J, Rosenblatt-Rosen O, Regev A, Greka A (2019) Kidney organoid reproducibility across multiple human iPSC lines and diminished off target cells after transplantation revealed by single cell transcriptomics. bioRxiv:516807
- 22.Takemoto M, He L, Norlin J, Patrakka J, Xiao Z, Petrova T, Bondjers C, Asp J, Wallgard E, Sun Y, Samuelsson T, Mostad P, Lundin S, Miura N, Sado Y, Alitalo K, Quaggin SE, Tryggvason K, Betsholtz C. Large-scale identification of genes implicated in kidney glomerulus development and function. EMBO J. 2006;25(5):1160–1174. doi: 10.1038/sj.emboj.7601014. [DOI] [PMC free article] [PubMed] [Google Scholar]
- 23.Motojima M, Kume T, Matsusaka T. Foxc1 and Foxc2 are necessary to maintain glomerular podocytes. Exp Cell Res. 2017;352(2):265–272. doi: 10.1016/j.yexcr.2017.02.016. [DOI] [PubMed] [Google Scholar]
- 24.Müller-Deile J, Dannenberg J, Liu P, Thum T, Lorenzen J, Nyström J, Schiffer M. Identification of cell and disease specific microRNAs in glomerular pathologies. J Cell Mol Med. 2019;23(6):3927–3939. doi: 10.1111/jcmm.14270. [DOI] [PMC free article] [PubMed] [Google Scholar]
- 25.Wang Z, Wang P, Wang Z, Qin Z, Xiu X, Xu D, Zhang X, Wang Y. MiRNA-548c-5p downregulates inflammatory response in preeclampsia via targeting PTPRO. J Cell Physiol. 2018;234(7):11149–11155. doi: 10.1002/jcp.27758. [DOI] [PubMed] [Google Scholar]
- 26.Kozomara A, Griffiths-Jones S. miRBase: annotating high confidence microRNAs using deep sequencing data. Nucleic Acids Res. 2013;42(Database issue):D68–D73. doi: 10.1093/nar/gkt1181. [DOI] [PMC free article] [PubMed] [Google Scholar]
- 27.Piriyapongsa J, Jordan IK. A family of human microRNA genes from miniature inverted-repeat transposable elements. PLoS One. 2007;2(2):e203. doi: 10.1371/journal.pone.0000203. [DOI] [PMC free article] [PubMed] [Google Scholar]
- 28.Dweep H, Gretz N. miRWalk2.0: a comprehensive atlas of microRNA-target interactions. Nat Methods. 2015;12(8):697. doi: 10.1038/nmeth.3485. [DOI] [PubMed] [Google Scholar]
- 29.Smit AFA, Hubley R, Green P (2013) RepeatMasker Open-4.0. http://repeatmasker.org
- 30.Saleem MA, O’Hare MJ, Reiser J, Coward RJ, Inward CD, Farren T, Xing CY, Ni L, Mathieson PW, Mundel P. A conditionally immortalized human podocyte cell line demonstrating nephrin and podocin expression. J Am Soc Nephrol. 2002;13(3):630–638. doi: 10.1681/ASN.V133630. [DOI] [PubMed] [Google Scholar]
- 31.Mundel P, Reiser J, Zuniga Mejia Borja A, Pavenstadt H, Davidson GR, Kriz W, Zeller R. Rearrangements of the cytoskeleton and cell contacts induce process formation during differentiation of conditionally immortalized mouse podocyte cell lines. Exp Cell Res. 1997;236(1):248–258. doi: 10.1006/excr.1997.3739. [DOI] [PubMed] [Google Scholar]
- 32.Kouskouti A, Kyrmizi I (2005) Chromatin immunoprecipitation (ChIP) assay (PROT11). The EPIGENOME Network of Excellence. http://www.epigenome-noe.net/researchtools/protocol.php_protid=10.html
- 33.Hwang HW, Wentzel EA, Mendell JT. A hexanucleotide element directs microRNA nuclear import. Science. 2007;315(5808):97–100. doi: 10.1126/science.1136235. [DOI] [PubMed] [Google Scholar]
- 34.Shi S, Yu L, Zhang T, Qi H, Xavier S, Ju W, Bottinger E. Smad2-dependent downregulation of miR-30 is required for TGF-beta-induced apoptosis in podocytes. PLoS One. 2013;8(9):e75572. doi: 10.1371/journal.pone.0075572. [DOI] [PMC free article] [PubMed] [Google Scholar]
- 35.Liu L, Lin W, Zhang Q, Cao W, Liu Z. TGF-beta induces miR-30d down-regulation and podocyte injury through Smad2/3 and HDAC3-associated transcriptional repression. J Mol Med (Berl) 2016;94(3):291–300. doi: 10.1007/s00109-015-1340-9. [DOI] [PubMed] [Google Scholar]
- 36.Naumova N, Smith EM, Zhan Y, Dekker J. Analysis of long-range chromatin interactions using chromosome conformation capture. Methods. 2012;58(3):192–203. doi: 10.1016/j.ymeth.2012.07.022. [DOI] [PMC free article] [PubMed] [Google Scholar]
- 37.Koutroutsos K, Kassimatis TI, Nomikos A, Giannopoulou I, Theohari I, Nakopoulou L. Effect of Smad pathway activation on podocyte cell cycle regulation: an immunohistochemical evaluation. Ren Fail. 2014;36(8):1310–1316. doi: 10.3109/0886022X.2014.937664. [DOI] [PubMed] [Google Scholar]
- 38.van der Weyden L, Adams DJ. The Ras-association domain family (RASSF) members and their role in human tumourigenesis. Biochim Biophys Acta. 2007;1776(1):58–85. doi: 10.1016/j.bbcan.2007.06.003. [DOI] [PMC free article] [PubMed] [Google Scholar]
- 39.Meng X, Jiang Q, Chang N, Wang X, Liu C, Xiong J, Cao H, Liang Z. Small activating RNA binds to the genomic target site in a seed-region-dependent manner. Nucleic Acids Res. 2016;44(5):2274–2282. doi: 10.1093/nar/gkw076. [DOI] [PMC free article] [PubMed] [Google Scholar]
Associated Data
This section collects any data citations, data availability statements, or supplementary materials included in this article.
Supplementary Materials
Supp. Table 1: Primer sequences and product sizes (XLSX 12 kb)
Supp. Table 2: Antibodies used and IF reagents (DOCX 14 kb)
Supp. Table 3: Mean value comparison of predicted target sites on promoter regions between different miRNA species of family miR-548 (XLSX 23 kb)
Supp. Methods: Supplementary methods (DOCX 16 kb)