

Abstract
Treatment with combined immune checkpoint blockade (CICB) targeting CTLA-4 and PD-1 is associated with clinical benefit across tumor types, but also a high rate of immune-related adverse events. Insights into biomarkers and mechanisms of response and toxicity to CICB are needed. To address this, we profiled the blood, tumor and gut microbiome of 77 patients with advanced melanoma treated with CICB, with a high rate of any ≥grade 3 immune-related adverse events (49%) with parallel studies in pre-clinical models. Tumor-associated immune and genomic biomarkers of response to CICB were similar to those identified for ICB monotherapy, and toxicity from CICB was associated with a more diverse peripheral T-cell repertoire. Profiling of gut microbiota demonstrated a significantly higher abundance of Bacteroides intestinalis in patients with toxicity, with upregulation of mucosal IL-1β in patient samples of colitis and in pre-clinical models. Together, these data offer potential new therapeutic angles for targeting toxicity to CICB.
Treatment with combined immune checkpoint blockade (CICB) is associated with high rates of objective responses1, but a substantial proportion of patients experience immune-related adverse events (irAEs)2,3. Interestingly, rates of clinical response and irAE appear to be linked4,5, although distinct mechanisms behind therapeutic toxicity are incompletely understood. Robust biomarkers of response to CICB are currently lacking, and it is likely that up to 40% of unselected patients with melanoma, treated with CICB, would be expected to respond to programmed cell death protein 1 (PD-1) blockade alone, and thus could potentially be spared the increased risk of the severe irAEs associated with this regimen1,6,7.
Results
Immune and genomic predictors of response to CICB.
To help address this issue, we studied biomarkers of response and toxicity to CICB in a cohort of 77 patients with advanced predominantly cutaneous-type melanoma receiving CICB, either on clinical trials or as standard-of-care therapy (Fig. 1a and Supplementary Table 1). The majority of patients had stage IV disease (n = 65, 84%), and were naïve to prior systemic therapy (n = 57, 74%) (Supplementary Table 1). In this cohort, the rate of any grade of irAE was high (n = 72, 93.5%) and nearly half of patients (49%) experienced severe (≥grade 3) irAEs (Supplementary Table 2), which is in line with other published series1,3,8–10. Progression-free survival was markedly greater in patients with cutaneous-type melanomas than mucosal or uveal melanomas (Extended Data Fig. 1a), so response-based analyses were restricted to the cutaneous-type cohort, within which there was a trend towards a coupling of response and toxicity (P = 0.10, chi-square test). Despite heterogeneity in terms of melanoma subtype, disease stage and extent of prior treatment, we expected biomarkers of toxicity to be widely applicable and thus did not restrict our cohort under consideration for this outcome.
Fig. 1 |. Molecular and immune predictors of response.
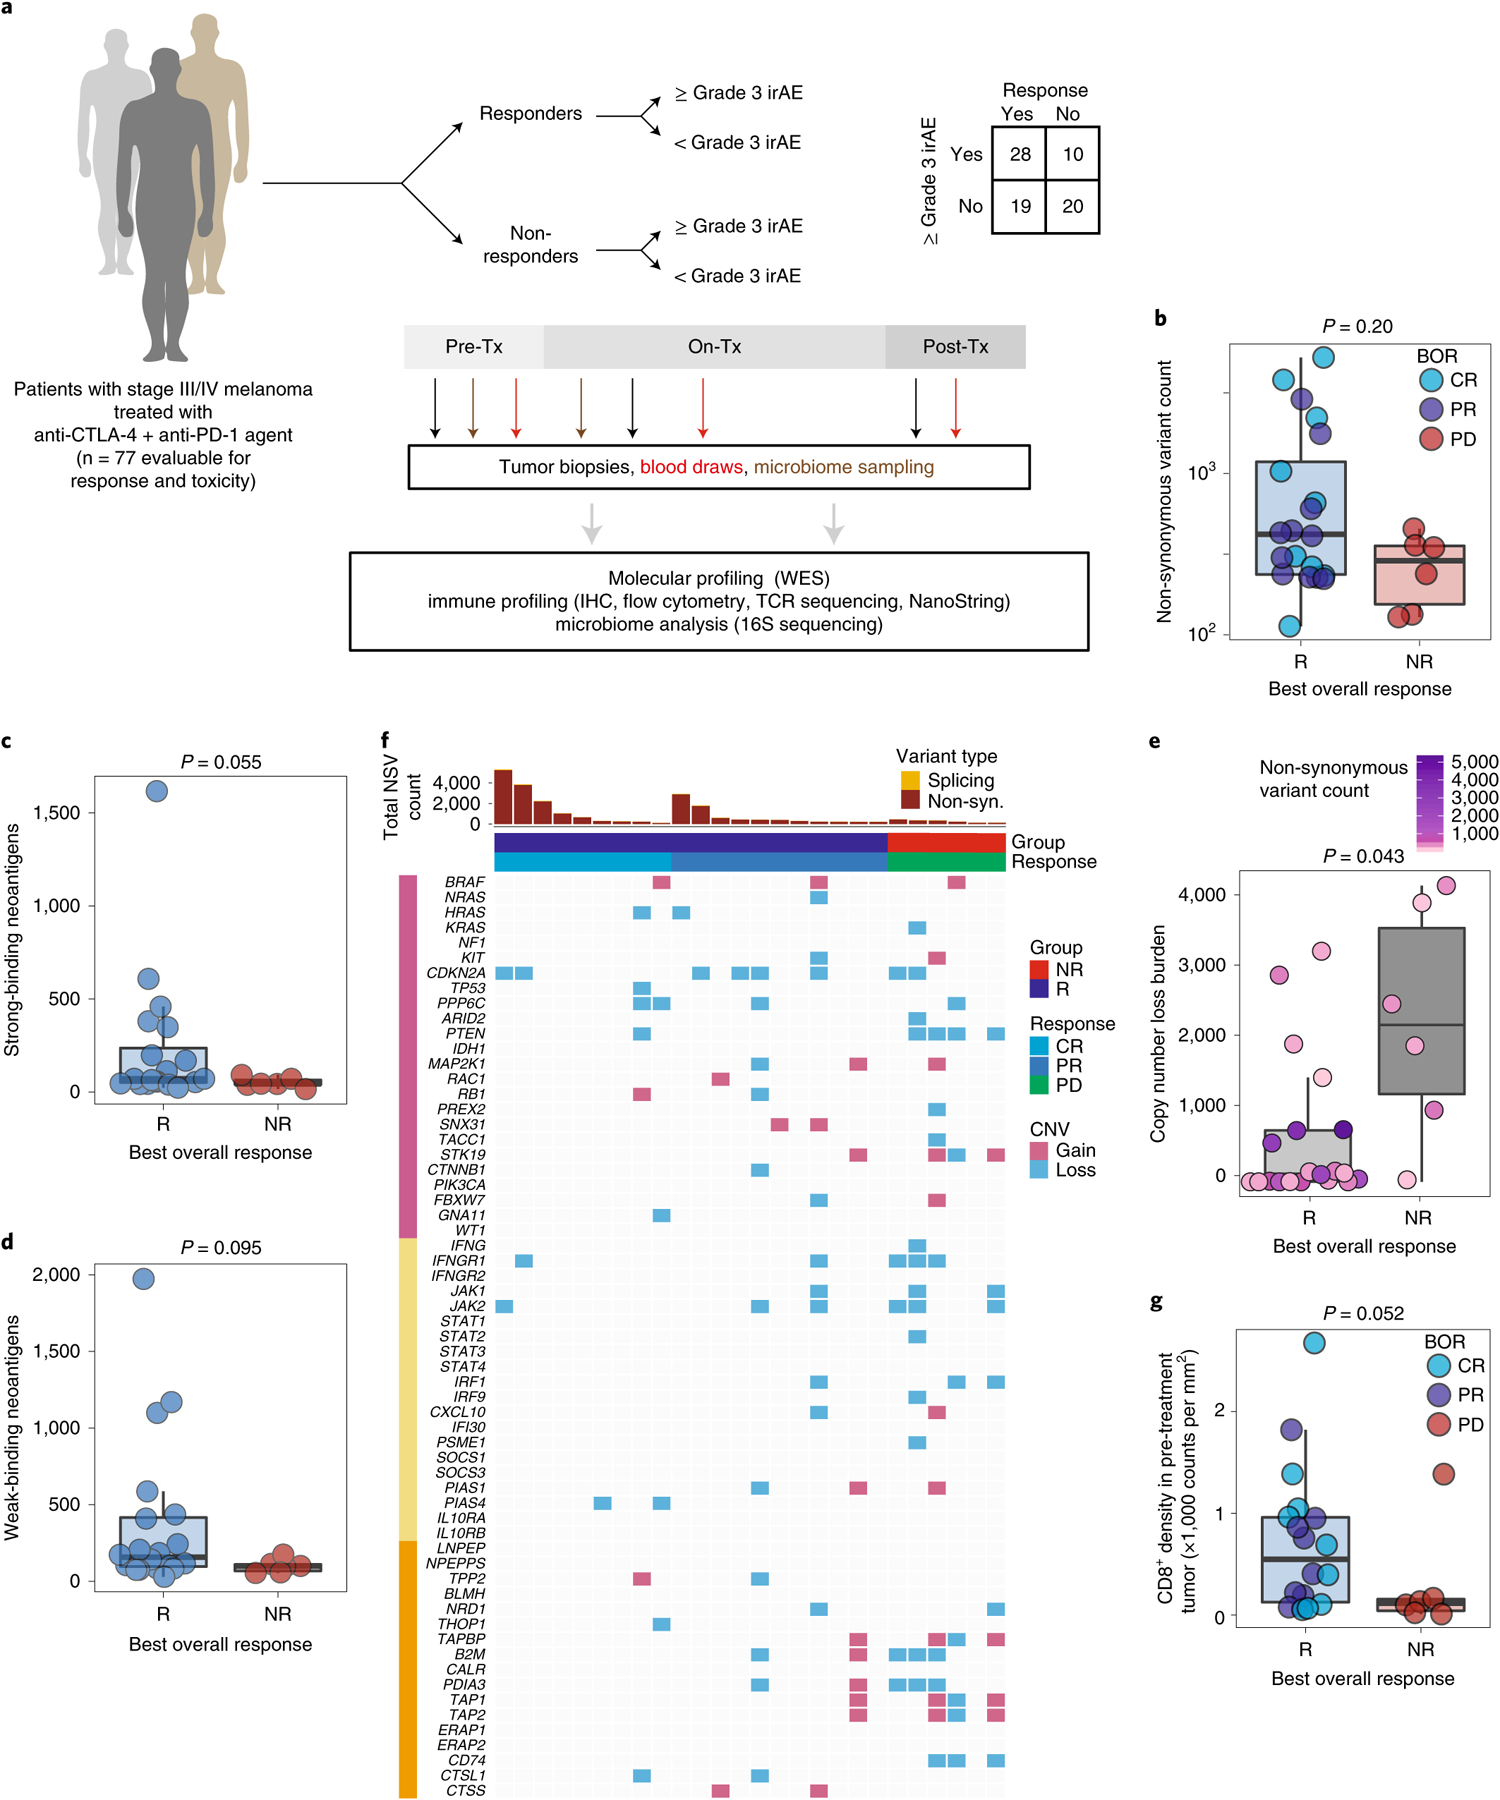
a, Cohort of patients with advanced melanoma (n = 77) evaluated for clinical outcomes and correlative biospecimen analyses prior to and following initiation of combined anti-CTLA-4 and anti-PD-1 blockade. Tx, treatment. b, Non-synonymous variant (NSV) count in pre-treatment tumor samples (n = 26) grouped by binarized best overall response (BOR) (R, responder, n = 20; NR, non-responder, n = 6; CR, complete response; PR, partial response; PD, progressive disease). Specific objective responses are indicated by the color of each data point (Mann–Whitney test, P = 0.20). c,d, Strong (c) and weak (d) binding neoantigen predictions grouped by best overall response as in b (Mann–Whitney test, P = 0.055 (c) and P = 0.005 (d)). e, Copy number loss burden (affected genomic regions) in pre-treatment tumor samples (n = 26) grouped by binarized best overall response (Mann–Whitney test, P = 0.043). Tumor mutation burden is indicated for each sample by color. f, Oncomap of copy number alterations affecting genes belonging to three groups: commonly mutated or copy number altered in melanoma (pink), IFN-γ related signaling (yellow) and antigen processing (orange). g, Density of infiltrating CD8+ cells (counts per mm2) in pre-treatment tumors by singlet stain immunohistochemistry grouped by binarized response (n = 19 R, n = 6 NR; one-sided Mann–Whitney test, P = 0.052). Box plots present the median bar with the box bounding the interquartile range (IQR) and whiskers the most extreme points within 1.5× IQR. All statistical tests are two-sided except where otherwise specified.
We first performed whole-exome sequencing in available pre-treatment tumor samples (Supplementary Table 3) to assess the association of total mutational burden (TMB) with response to CICB (n = 26). We observed higher TMB in responders (R, n = 20) compared with non-responders (NR, n = 6) to CICB overall (Fig. 1b, P = 0.20), consistent with findings from previous studies11–14. The sample size was admittedly limited, but there appeared to be two subsets within the responder population, one with a high TMB for whom anti-PD-1 monotherapy may have been sufficient, and one with a lower TMB in whom CICB was probably more necessary. Qualitative assessment of the mutational landscape in this cohort did not reveal significant differences in the frequency of mutations in the common melanoma driver, interferon-γ (IFN-γ) pathway and antigen processing pathway gene sets in responders versus non-responders (Extended Data Fig. 1b). Similarly, no significant differences were noted in neoantigen burden between responders and non-responders (Fig. 1c,d and Extended Data Fig. 1c). However, tumor samples were only available for a relatively small proportion of patients, limiting the ability to draw strong conclusions from the data.
We next assessed the association between copy number loss and response to CICB based on findings from our group and others suggesting that a high burden of copy number loss was associated with resistance to treatment with sequential checkpoint blockade targeting cytotoxic T-lymphocyte-associated protein 4 (CTLA-4) and PD-115. In the current cohort, we observed that non-responders to CICB had a significantly higher burden of copy number loss compared with responders (P = 0.04; Fig. 1e). Resistance to CICB was principally associated with copy number loss affecting chromosomes 5, 10 and 15 (Extended Data Fig. 1d,e). Several genes previously implicated in resistance to ICB monotherapies appeared either exclusively (CD74) or disproportionately (PDIA3, B2M, PTEN) affected by copy number losses in NR tumors (Fig. 1f and Extended Data Fig. 1f), suggesting potential immuno-genomic mechanisms of resistance to CICB15–19.
Next, we assessed the density of CD8+ T cells in baseline tumor biopsies of responders versus non-responders to CICB given previous studies highlighting the prognostic significance of the density and distribution of CD8+ T cells in response to ICB monotherapy17,20. In these analyses, a higher density of CD8+ T cells was observed in tumors of responders compared with non-responders (n = 19 R, n = 6 NR, P = 0.052, one-sided; Fig. 1g), We also assessed the T-cell repertoire via T-cell receptor (TCR) sequencing in baseline tumor samples of responders versus non-responders to CICB, and noted that T-cell repertoire entropy was higher in responders to CICB (P = 0.058; Extended Data Fig. 1g).
Associations between the gut microbiome and response to CICB.
Given the growing evidence regarding the role of the gut microbiota in response to checkpoint blockade monotherapy21–23, we next assessed the association of gut microbiota signatures with response to CICB. Importantly, we assessed profiles in patients on CICB and performed studies in pre-clinical models for cross-species validation of putative microbial contributors to response and/or toxicity. To do this, we first profiled baseline fecal microbiome samples in patients on CICB using 16S rRNA gene sequencing (n = 54; Supplementary Table 3 and Extended Data Fig. 2a). Assignment of taxonomy at the species level was done by aligning the representative centroid sequence of each operational taxonomic unit (OTU) against the NCBI 16S reference database with BLAST. Species names were only considered for OTUs that had an unambiguous annotation (Supplementary Table 4), and all other OTUs were treated as unclassified at the species level. The taxa Firmicutes (phylum) and Clostridiales (order) were previously shown to be response-associated in the context of PD-1 blockade21, but displayed similar abundance between responder and non-responder patients to CICB (P = 0.39 and P = 0.38, respectively; Extended Data Fig. 2b,c). In this cohort we did not observe any significant differences in alpha diversity in responders versus non-responders (Extended Data Fig. 2d), which is in contrast to our previous findings in patients on anti-PD-1 monotherapy, and may be related to the limited sample size but might also suggest that gut microbiome diversity is less critical in the setting of treatment with CICB. We next focused on novel candidate discovery by identifying potential candidate taxa associated with response by assessing compositional differences between responders and non-responders using linear discriminant analysis effect size (LEfSe) (Fig. 2a) and pairwise comparisons (Extended Data Fig. 3a) and identified several differentially enriched bacterial taxa in R, including Bacteroides stercoris, Parabacteroides distasonis and Fournierella massiliensis (P = 0.03, P = 0.04 and P = 0.008, respectively, by two-sided Mann–Whitney tests). Taxa enriched in non-responders included Klebsiella aerogenes and Lactobacillus rogosae, among others (P = 0.04 and P = 0.02, respectively; Supplementary Table 5). Importantly, given the limitations of assigning taxonomy at the species level using 16S rRNA gene sequencing data, we sought to verify our results using whole metagenomic shotgun sequencing (WMS), which was performed on a subset of patients (n = 27 responders, n = 11 non-responders). Employing Bray–Curtis dissimilarities, Procrustes analysis revealed that taxonomic annotations at the species level by 16S and WMS methods produced similar clustering patterns (Mantel: r = 0.65, P = 0.001; Extended Data Fig. 3b), suggesting a high degree of concordance between the species identification by either method. These studies also confirmed previously identified associations with B. stercoris (P = 0.07) and P. distasonis (P = 0.024) (Fig. 2b). Furthermore, we also observed a strong correlation between species abundances estimated using 16S and WMS (Spearman’s ρ =0.934, P = 2.2 × 10⁻¹⁶; Extended Data Fig. 3c). To account for the effect of known clinical predictors of response, we next performed multivariable logistic regression using species-level abundances from WMS of our top bacterial candidates (Extended Data Fig. 3d) and continued to observe a positive association with response (B. stercoris, adjusted odds ratio (OR) = 4.76, 95% confidence interval (CI) = 0.93–36.5; Supplementary Table 6).
Fig. 2 |. Gut microbial associations with CICB response.
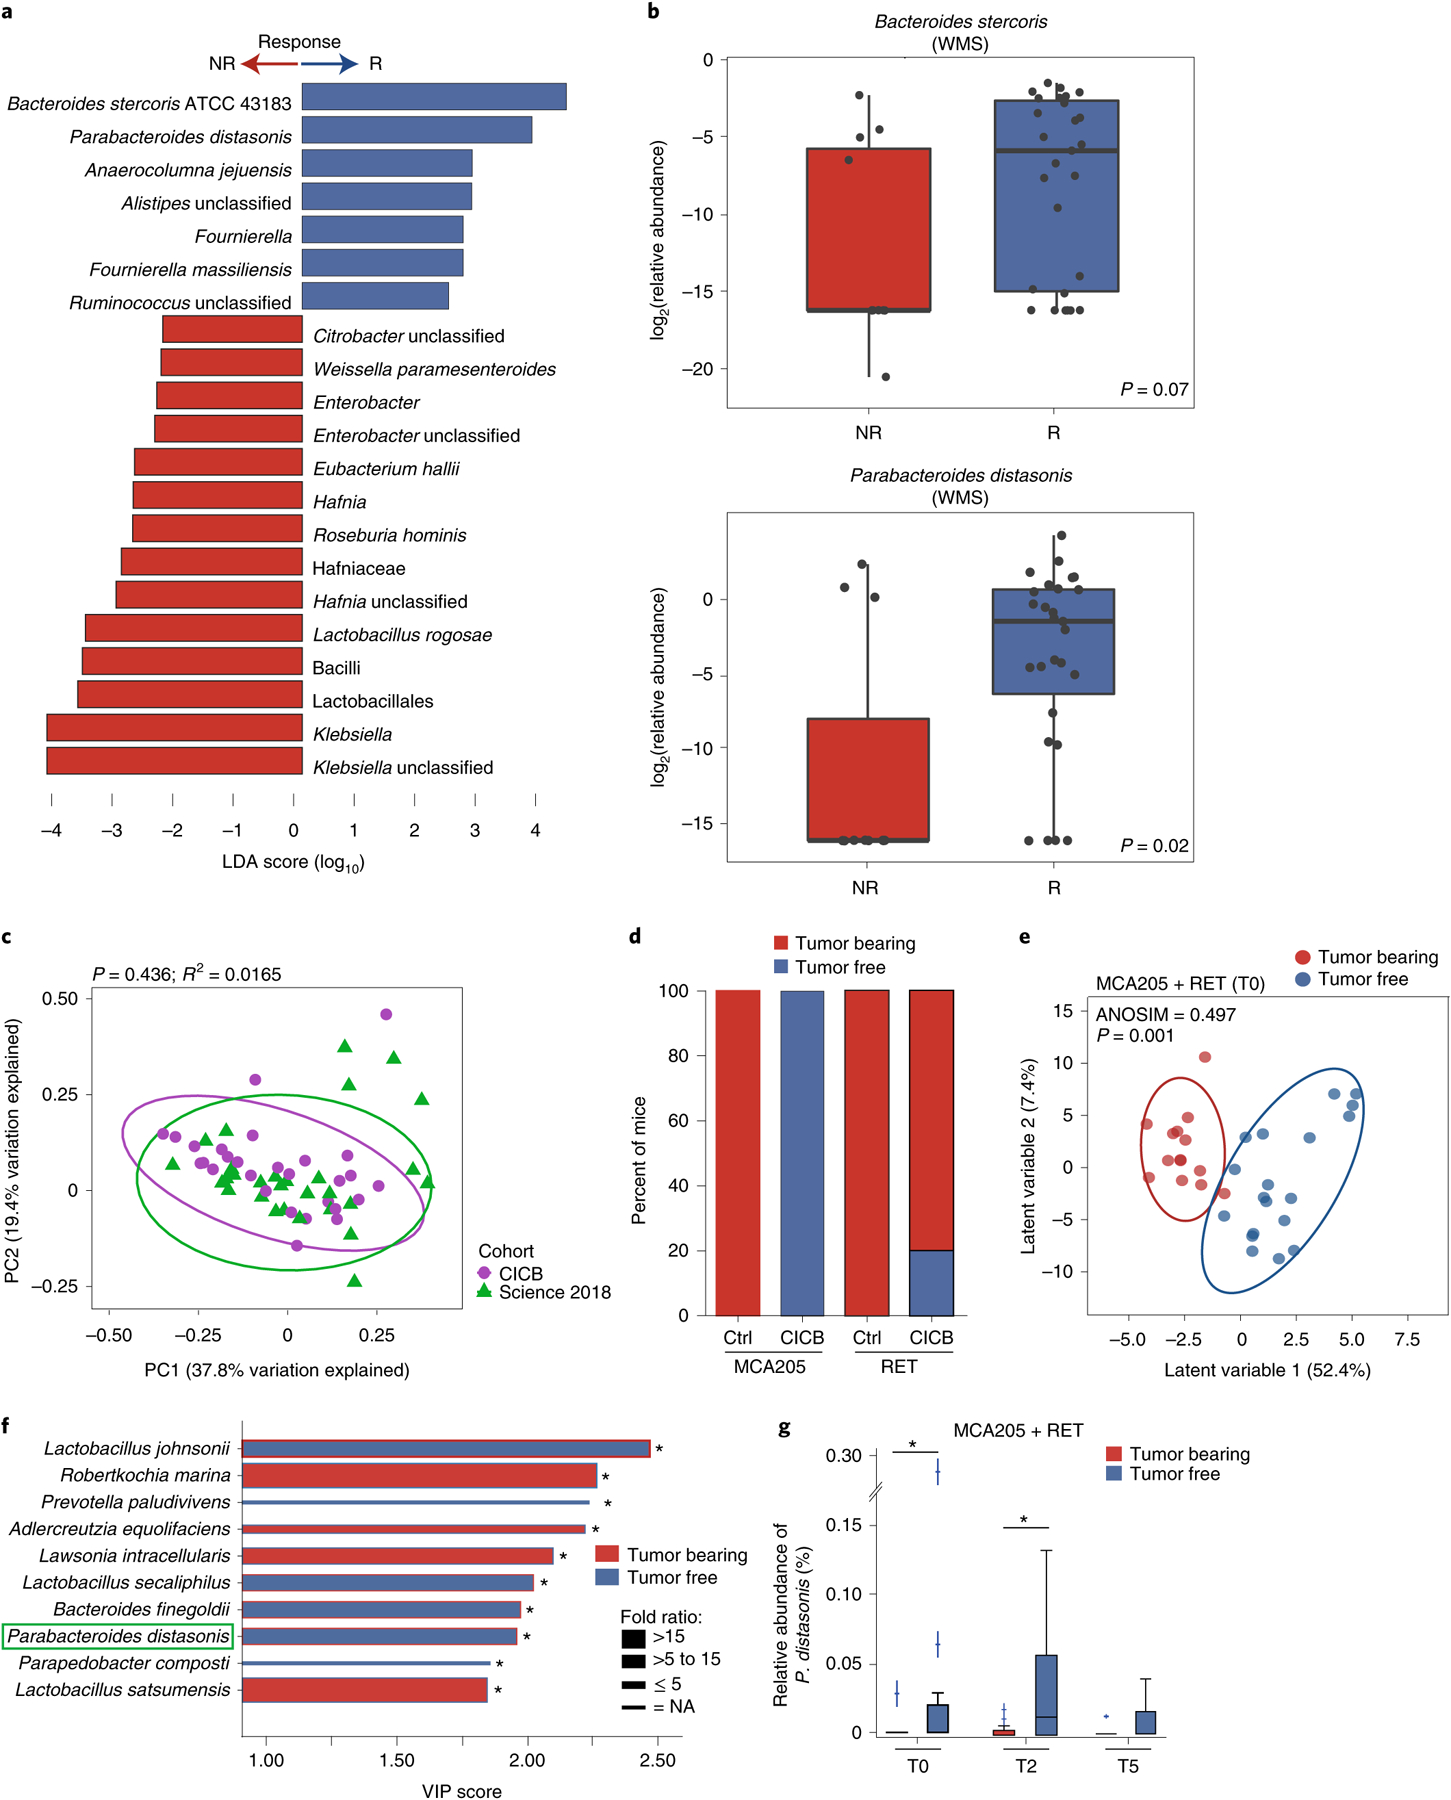
a, Linear discriminant analysis score plot using the Mann–Whitney test of bacterial taxa significantly enriched in patients, either responders (n = 29) or non-responders (n = 11) to CICB, from the cutaneous and unknown primary cohort (n = 40; P < 0.05). b, Abundance of candidate response taxa determined by WMS compared between response groups (total n = 38 patients with cutaneous melanoma: n = 27 R, n = 11 NR). Mann–Whitney test (top, P = 0.07; bottom, P = 0.02). Box plots present the median bar with the box bounding the IQR and whiskers the most extreme points within 1.5× IQR. c, Comparison of gut microbial composition in responders to CICB (n = 29; ‘CICB’, purple) and responders to anti-PD-1 monotherapy in our previously published cohort (n = 30; ref.21, ‘Science 2018’, green) as determined by ordination of beta diversity (weighted UniFrac, PERMANOVA P = 0.436). d, Percentages of tumor-free versus tumor-bearing mice after four intraperitoneal administrations of anti-PD-1 Ab + anti-CTLA-4 mAb (CICB) or isotype control mAbs (Ctrl) used to treat day 7 established MCA205 or RET tumors (n = 24 mice per group, pooled data from two experiments). e, PLS-DA plot of the variance in beta diversity at T0, between CICB-treated mice that were eventually tumor-free or tumor-bearing at euthanasia, in both tumor models combined. ANOSIM defines the separation of the groups; the P value defines the significance of such separation after 999 permutations of the samples (ANOSIM = 0.497, P = 0.001). f, VIP score barplot highlighting bacterial species present at T0 significantly enriched in the group defined by the bar color (highest mean relative abundance) compared to the group defined by the border color (lowest mean relative abundance), indicating mice that were eventually tumor-free versus tumor-bearing following CICB treatment (RET and MCA205 models). An absent border indicates a mean relative abundance of zero in the compared cohort(s). The green box highlights a species in common with patient data. Mann–Whitney test: *P < 0.05; NS, not significant. Bar thickness reports the fold ratio value of the mean relative abundances for each species among the two cohorts. NA, not applicable. g, Relative abundance of P. distasonis (at T0, T2 and T5) in tumor-free and tumor bearers over time. *P < 0.05 by Mann–Whitney test. Error bars represent the mean ± s.e.m. All statistical tests are two-sided except where otherwise specified.
We next compared the overall microbial composition of responders to CICB and responders to anti-PD-1 monotherapy from our previous published cohort of patients treated with anti-PD-1 monotherapy21, demonstrating similar compositional characteristics as measured by weighted UniFrac beta diversity distances (weighted UniFrac, permutational multivariate analysis of variance (PERMANOVA) P value = 0.436; Fig. 2c), suggesting that there may be some unifying microbial features. In line with this, we also noted a significant difference in the overall microbial composition between responders and non-responders when pooling samples from both cohorts (P = 0.002; Extended Data Fig. 4a). Tracking of responder-associated taxa in this CICB-treated cohort with those identified in several other published series of patients treated with anti-CTLA-4 ICB24,25, anti-PD-1 ICB21 and monotherapy or combination ICB26,27 demonstrated modest overlap, with an enrichment of Ruminococcus/Ruminococcaceae consistently observed across all cohorts (Extended Data Fig. 4b). Notably, these analyses were limited by variability in the definitions of response as well as numerous differences in sampling and analytical approaches across these cohorts, and additional work is needed to delineate potentially unifying gut microbiota signatures to different forms of ICB.
We next examined candidate taxa associated with response to CICB in pre-clinical syngeneic transplantable tumor models (Extended Data Fig. 5a). In these studies, treatment with CICB was associated with tumor regression in two tumor models compared with control treated mice (Fig. 2d). We then interrogated fecal microbial composition in these models to determine if this was associated with therapeutic benefit. We performed a supervised analysis (partial least squares discriminant analysis, PLS-DA) to explore the variance in the microbiome composition at T0 comparing mice eventually tumor-bearing versus tumor-free mice at T2 (euthanasia after two systemic injections of CICB) and observed a clear discrimination between the two groups (P = 0.001; Fig. 2e). The relative contribution of each bacterial species abundance at T0 to the observed group separation was next assessed using the PLS-DA-derived variable importance (VIP) score, revealing that P. distasonis was predictive of response to CICB (Fig. 2f), which was also observed in patients with melanoma (Fig. 2a). Importantly, the relative abundance of P. distasonis was significantly higher in mice that eventually became tumor-free post-CICB (Fig. 2g) and was negatively correlated with tumor size (Extended Data Fig. 5b). Together, these data identify associations between distinct commensal species such as P. distasonis and beneficial tumor responses to CICB, with some overlap noted between taxa identified in murine tumor models and in our patient cohort.
The gut microbiome mediates CICB-induced intestinal toxicity via IL-1β.
Following assessment of the gut microbiota and efficacy in mice, we next assessed the relationship between the gut microbiota and toxicity (colitis and ileitis) in our murine models. Consistent with previous studies utilizing immunocompetent mice, CICB did not trigger overt colitis-associated manifestations such as diarrhea or weight loss. However, histologic abnormalities of the gut epithelium and lamina propria pathognomonic of subclinical toxicity such as villi shortening in the ilea, crypt or mucosal attritions, and inflammatory infiltrates could be scored and analyzed in ilea and colons. These inflammatory changes were then assessed with regard to the microbial composition via 16S rRNA gene sequencing of fecal samples at T0. In these studies, treatment with CICB was associated with subclinical ileitis in both MCA and RET tumor models (MCA P = 0.042, RET P = 0.024; Fig. 3a,b). Given known evidence that commensal microbes can induce colitis via interleukin-1β (IL-1β)28, we treated mice concurrently with an interleukin-1 receptor (IL-1R) antagonist (anakinra), which is approved for the treatment of patients with rheumatoid arthritis. Treatment with CICB and concurrent IL-1R antagonism was associated with significantly less inflammation (MCA P = 0.0094, RET P = 0.0009; Fig. 3a,b). Pre-treatment with oral antibiotics was also associated with reduced ileitis in MCA205 animals, but the magnitude of reduced inflammation was modest in comparison (MCA P = 0.032, RET P = 0.25; Fig. 3a,b). Colonic inflammation (as opposed to ileitis) was only observed in the RET model in tumor-bearing mice (P = 0.018; Fig. 3c), and principal coordinate analyses of fecal microbial beta diversity demonstrated a clear association between the bacterial repertoire at day 7 post-tumor inoculation (T0) and subsequent subclinical colitis in this model (Fig. 3d and Extended Data Fig. 5c).
Fig. 3 |. Role of gut microbiota and ileal IL-1β in CICB-induced intestinal inflammation in tumor-bearing mice.
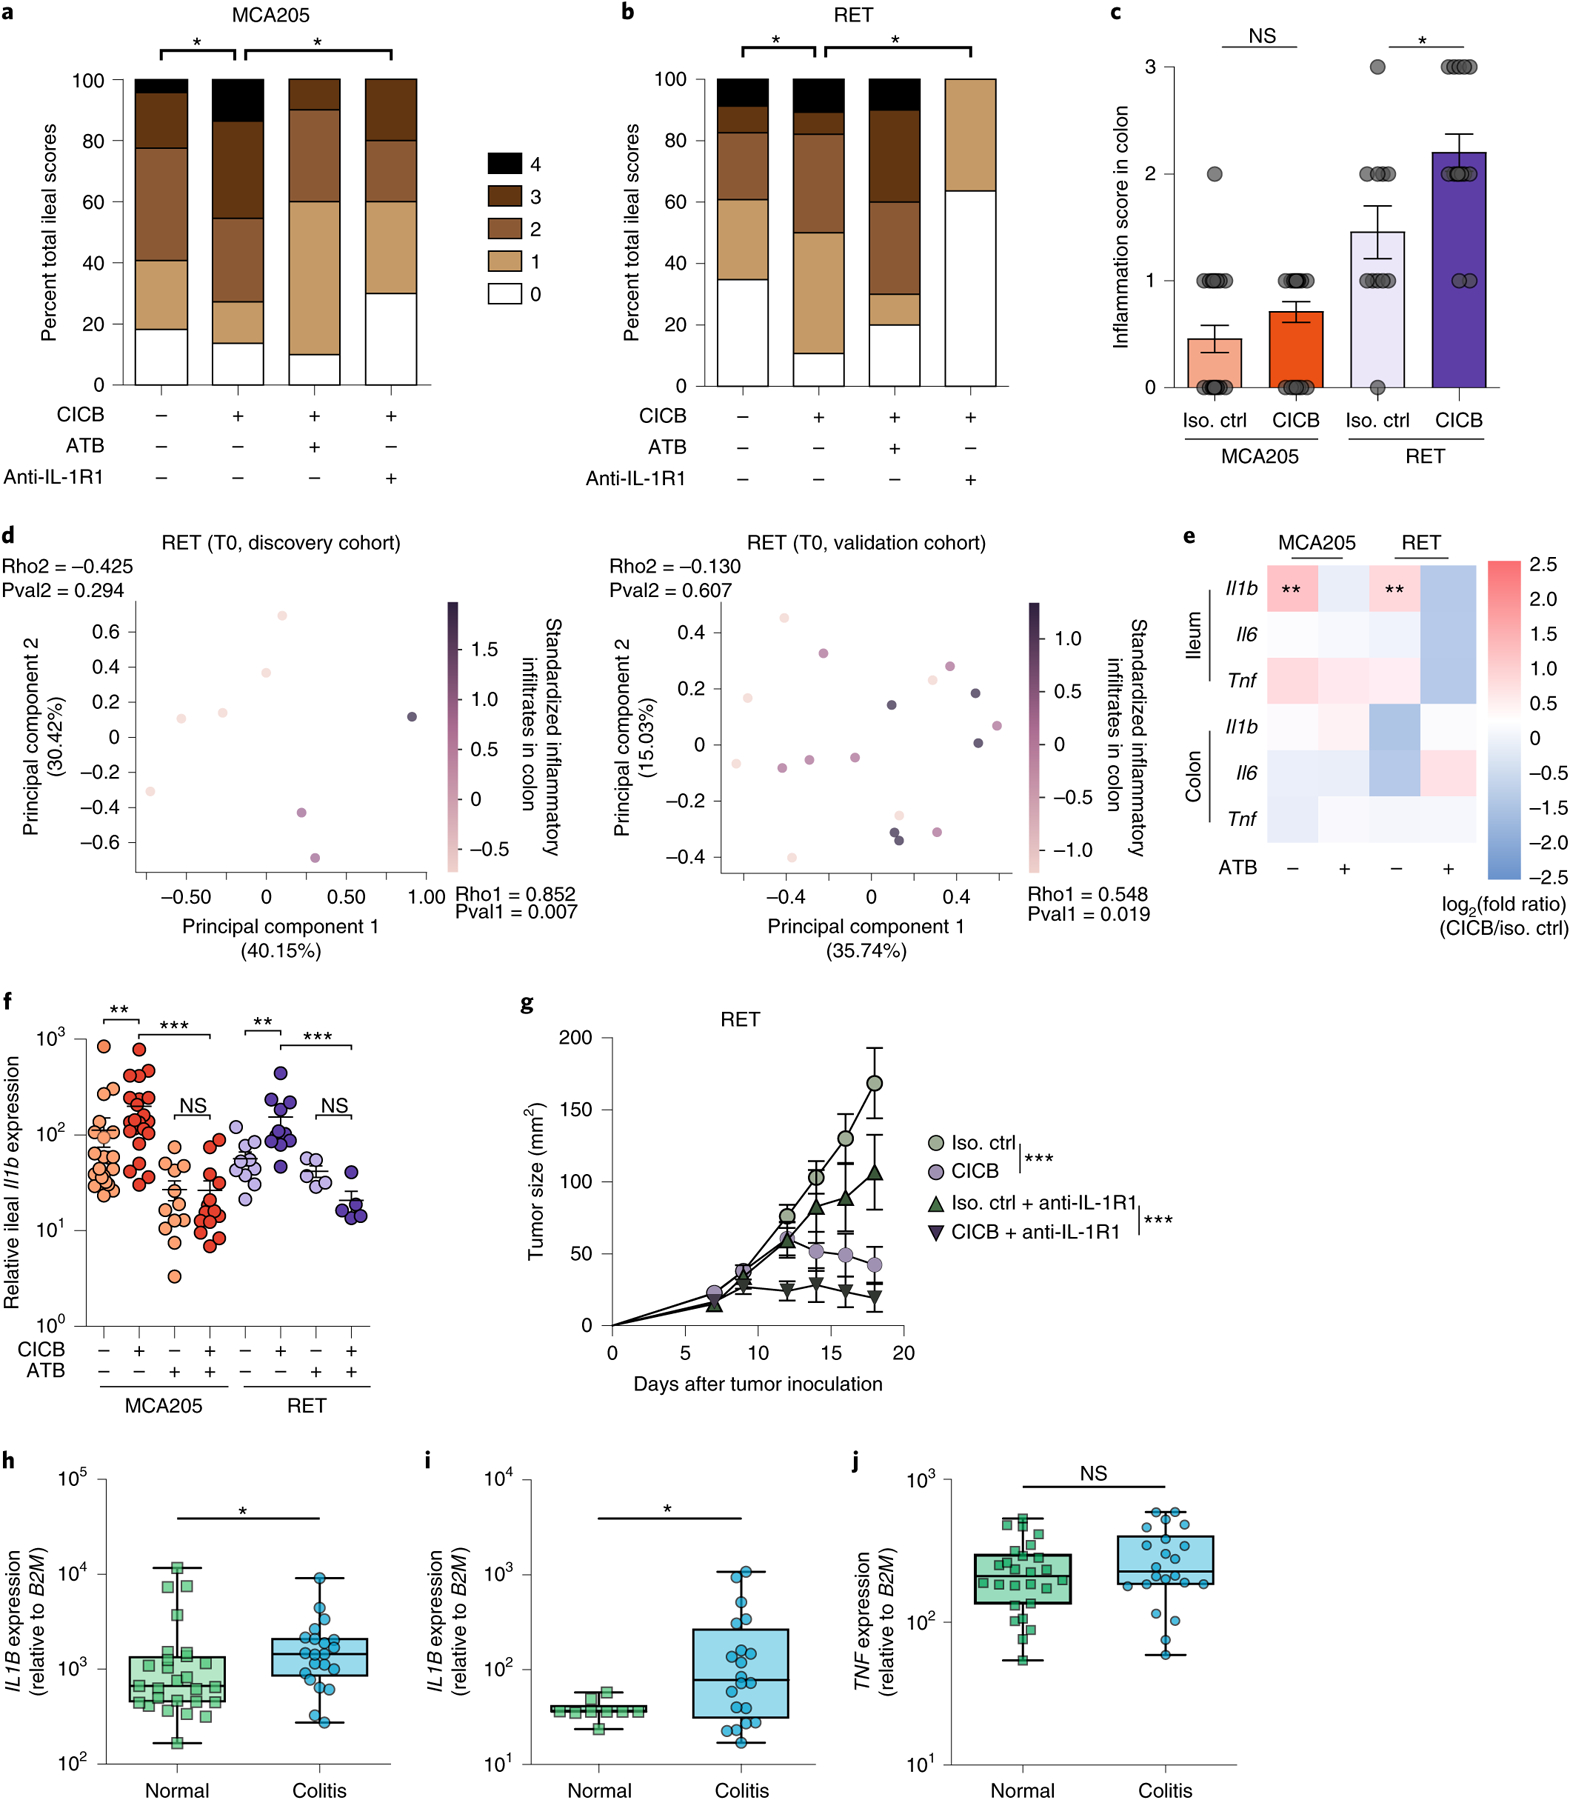
a,b, Scoring (range 0–4) of hematoxylin and eosin-stained inflammatory infiltrates and pathological lesions of the ilea in MCA205 (a; P = 0.042) or RET (b; P = 0.024) tumor-bearing mice treated with isotype control or CICB, ± antibiotics (ATB) or with the IL-1R1 antagonist, anakinra, 24 h after at least one CICB injection (n = 9–22 per group). Student’s t-test. c, Scoring of inflammatory colonic lesions in MCA205 and RET tumor-bearing mice analogous to that shown in a and b (Mann–Whitney test, P = 0.018). Error bars represent mean ± s.e.m. d, Beta diversity ordination (Bray–Curtis dissimilarity) of the fecal microbiota assessed by sequencing of 16S rRNA gene amplicons colored according to score of colonic inflammatory infiltrate in RET tumor-bearing mice. Intensity of the purple indicates increasing inflammatory infiltrate score in the discovery (left) and validation (right) cohorts. Bacterial relative abundances and colonic inflammatory infiltrate were both normalized and standardized before correlation analysis. Pearson correlation and associated P values comparing each principal component with inflammatory infiltrate are indicated (discovery P = 0.294, ρ = −0.425; validation P = 0.607, ρ = −0.130). e, Heatmap of log2(fold change) of pro-inflammatory immune gene expression (CICB-treated versus isotype) in ilea and colons of MCA205 and RET tumor-bearing mice ± ATB. n = 10–22 mice per group. Mann–Whitney test: MCA P = 0.0032, RET P = 0.0016. f, Relative ileal Il1b expression in tumor-bearing mice treated with isotype/CICB ± ATB. n = 10–22 mice per group. Mann–Whitney test: *P < 0.05, **P < 0.01, ***P < 0.001; NS, not significant. g, Tumor growth kinetics of RET melanoma in mice treated with CICB ± IL-1R1 antagonist anakinra. Data presented as mean ± s.e.m. tumor sizes from a representative experiment of two yielding similar results, comprising six mice per group. ANOVA test: ***P < 0.001. Error bars represent mean ± s.e.m. h–j, qPCR measurement of the relative IL1B (h; P = 0.042), IL17 (i; P = 0.041), TNF (j; NS) expression in colon samples from patients with melanoma experiencing immune-related colitis following ICB comparing areas of active inflammation (colitis) with areas of normal colonic tissue (‘normal’; intra-patient or cancer-free controls) (*P < 0.05, Mann–Whitney test). Box plots present the median bar with the box bounding the IQR and whiskers the most extreme points within 1.5× IQR. Additional details are provided in Supplementary Table 7. All statistical tests are two-sided except where otherwise specified.
To confirm that intestinal inflammation associated with CICB was associated with increased IL-1β, we performed transcriptional profiling of the ilea and colons of tumor-bearing mice 24 h after the first systemic administration of CICB. The development of intestinal inflammation (diagnosed by pathological scoring) was accompanied by a prompt and selective transcriptional upregulation of Il1b, but not Tnfa or Il6, and only in the presence of intact gut microflora (MCA P = 0.0032, RET P = 0.0016; Fig. 3e,f). Importantly, pharmacological inhibition of IL-1R using anakinra mitigated CICB-induced intestinal inflammation in both tumor models (MCA P = 0.0094, RET P = 0.0009; Fig. 3a,b) without compromising the anti-tumor efficacy of CICB (P < 0.0001; Fig. 3g). We validated these findings in a cohort of patients who developed colitis (grade 3 or 4) while on ICB. To do this, expression levels of IL1B, IL17 and TNF were assessed in colonic biopsies from affected patients and were compared to normal colon tissue samples from patients undergoing surgery (Supplementary Table 7). We observed higher expression of IL1B and IL17 in colitis versus normal tissue, but did not observe differences in TNF expression (IL1B P = 0.042, IL17 P = 0.041; Fig. 3h–j). Additional studies of IL1B and IL17 in colitis and irAEs are needed and are currently under way.
Bacteroides intestinalis and IL-1β are linked with CICB toxicity in patients with melanoma.
We next assessed associations between gut microbial signatures and toxicity to CICB in our patient cohort. No significant differences were noted in the overall alpha diversity of the gut microbiome in patients who did or did not develop ≥grade 3 irAEs (Extended Data Fig. 6a). However, discovery analysis revealed that several bacterial taxa were differentially enriched in baseline gut microbiome samples of patients who did develop ≥grade 3 irAEs versus those who did not, including Bacteroides intestinalis and Intestinibacter bartlettii (P = 0.009 and P = 0.009, two-sided Mann–Whitney tests, respectively; Supplementary Table 8 and Extended Data Fig. 6b), albeit with a small fold change for the latter. Taxa enriched in patients who did not develop ≥grade 3 irAEs were also identified, including Anaerotignum lactatifermentans and Dorea formicigenerans by LEfSe and pairwise comparisons (P = 0.016 and P = 0.06, respectively; Fig. 4a, Supplementary Table 8 and Extended Data Fig. 6b). We confirmed the concordance of species-level datasets from the 16S and WMS methods by Procrustes analysis (Mantel: r = 0.665, P = 0.001; Extended Data Fig. 6c). In addition, confirmation of bacterial candidates was done using WMS (Fig. 4b and Extended Data Fig. 6d), and a strong positive correlation was observed between the abundance of B. intestinalis quantified using 16S versus WMS (Spearman’s ρ = 0.62, P = 4.2 × 10⁻⁶, Extended Data Fig. 6e and Supplementary Table 8). A trend toward increased B. intestinalis in the gut microbiota of patients experiencing toxicity was also noted in a second cohort of patients with melanoma treated with ICB from another institution (combined McGill/University of Toronto cohort, P = 0.227; Extended Data Fig. 6f and Supplementary Table 9). Interestingly, associations were noted between gut microbiota signatures and the peripheral immune profiles of patients developing ≥grade 3 irAEs versus <grade 3 irAEs (Fig. 4c). As before, associations were maintained after adjusting for clinical predictors in a multivariable logistic regression model using species-level abundances estimated from WMS (B. intestinalis, adjusted OR = 4.54 (95% CI = 1.06–24.7); D. formicigenerans, adjusted OR = 0.35 (95% CI = 0.082–1.35); Supplementary Table 6).
Fig. 4 |. Bacteroides intestinalis is associated with intestinal IL-1β and colitis in the melanoma cohort.
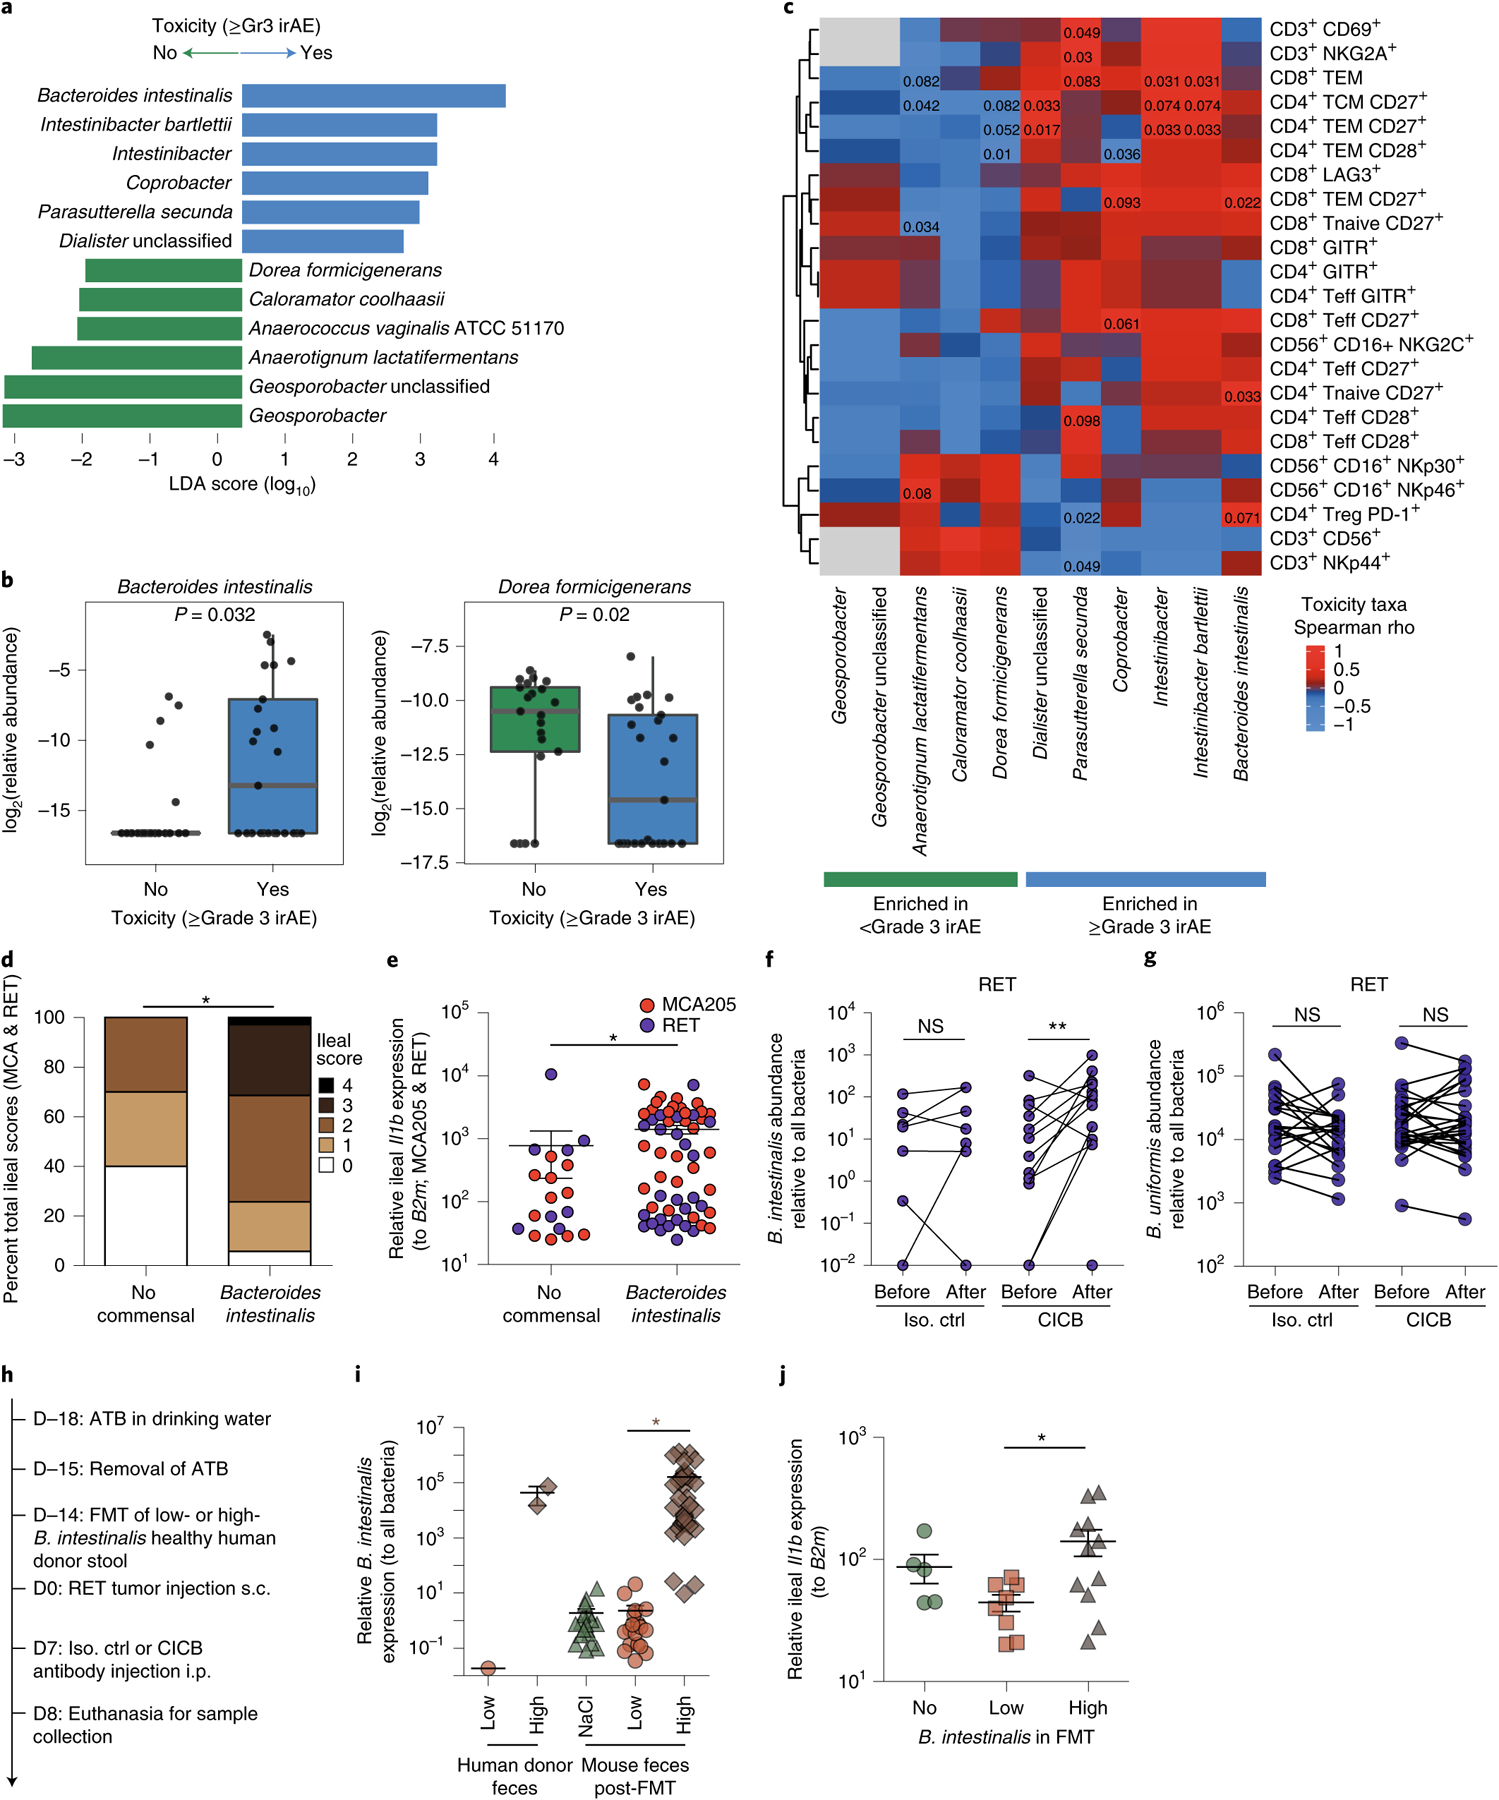
a, Linear discriminant analysis score plot using the Mann–Whitney test from LEfSe analysis of bacterial taxa significantly associated with development of, or freedom from, high-grade (≥grade 3, n = 29) irAEs in all patients with available fecal samples (n = 54; P < 0.05). b, Abundance of candidate taxa by WMS (total n = 46 patients: n = 25 ≥grade 3, n = 21 <grade 3). Mann–Whitney test (left, P = 0.032; right, P = 0.020). Box plots present the median bar with the box bounding the IQR and whiskers the most extreme points within 1.5× IQR. c, Heatmap of correlation (Spearman’s ρ) between key toxicity-associated or non-toxicity-associated bacterial taxa and circulating immune subsets quantitated by multiparameter flow cytometry of baseline blood samples (n = 13). Teff, T effector cells; TCM, T central memory; TEM, T effector memory; Treg, regulatory T cell. d,e, Total ileal toxicity scores (d; P = 0.0021) and relative Il1b expression (e; P = 0.0025) across MCA205 and RET tumor models showing higher toxicity (d) and higher Il1b expression (e) in animals treated with antibiotic microbiota ablation and subsequently colonized with B. intestinalis by gavage versus spontaneous recolonization (no administered commensal). Ileal toxicity was assessed at day 9 post-tumor inoculation in MCA205 (n = 5–32 per group, red dots) and RET (n = 5–26 per group, blue dots) combined. Data represent a pool of two individual experiments using three different strains of B. intestinalis, at 48 h post oral gavage. For ileal toxicity scoring, mice were classified according to low (score 0 or 1) versus high (score 2, 3 or 4) toxicity and compared by chi-square test: *P < 0.05. Ileal Il1b expression was analyzed using Mann–Whitney test: *P < 0.05. f,g, qPCR quantification of the relative abundance of B. intestinalis (f) or non-implicated B. uniformis (g) in feces of mice treated with isotype versus CICB, before and after therapy (**P = 0.0068 or NS). Data are shown in a paired manner (lines link samples from individual mice). n = 21–26 mice per group. Wilcoxon signed-rank test: **P < 0.01. h, Experimental schema for RET-model mice receiving FMT from human donors of differing B. intestinalis abundance and subsequent treatment with CICB or control. i, Differing B. intestinalis content in human donor feces (‘low’ versus ‘high’) and murine colonization following FMT or sham FMT (NaCl) was confirmed by qPCR. Mann–Whitney test (P < 0.001). j, Mice receiving FMT from B. intestinalis ‘high’ donor feces displayed higher expression of Il1b measured by qPCR of ileal tissue sampled 24 h after administration of a single dose of CICB. Mann–Whitney test (P = 0.0287). All statistical tests are two-sided except where otherwise specified.
We then examined associations between CICB-associated toxicity and systemic immune profiles in available clinical samples to identify signatures in the peripheral blood for patients at higher risk of irAEs using multiparameter flow cytometry phenotyping of peripheral blood mononuclear cells (PBMCs) in patients at baseline and on treatment. In these studies, we observed a higher proliferative index in effector and central memory CD8+ T lymphocytes at early on-treatment time points in patients who developed ≥grade 3 irAEs (P = 0.0044 and P = 0.013, respectively, n = 14; Extended Data Fig. 7a,b), potentially suggesting that accelerated expansion of cytotoxic T cells could contribute to immune-related toxicity. We then assessed the expression of CD28 and CD27 in T-cell subsets of these patients (gating, Extended Data Fig. 7c), as these markers are known to be progressively downregulated in antigen-experienced T cells adopting a distinct ‘aged’ functional state29,30. In these analyses, we observed significantly lower expression of surface CD28 and CD27 on circulating CD4+ and CD8+ effector T lymphocytes, respectively, of patients who did not develop severe irAEs in a discovery cohort (CD27 in CD4 effector T (Teff), P = 0.0022; CD28 in CD4 Teff, P = 0.014; CD27 in CD8 Teff, P = 0.072; CD28 in CD8 Teff, P = 0.04; Extended Data Fig. 7d,e, left). We assessed associations between these markers and toxicity in a second cohort of patients with melanoma on CICB (Supplementary Data Table 10), and modest trends were noted (Extended Data Fig. 7d,e, right), although methods of subset enumeration were non-identical between these cohorts. TCR sequencing of PBMCs in our own cohort revealed a significantly higher diversity of the baseline T-cell repertoire in patients who subsequently experienced high-grade irAEs (P = 0.028, n = 24; Extended Data Fig. 7f), in line with previous reports on checkpoint blockade monotherapy31,32. Polyclonal expansion of T-cell clones from baseline to on treatment was also observed, with patients experiencing ≥grade 3 toxicity on CICB having expansion of ≥55 circulating CD8+ T-cell clones compared to those with <grade 3 irAEs (P = 0.22, Extended Data Fig. 7g), as observed with ICB monotherapy targeting CTLA-432. Together, these data suggest that peripheral immune signatures may be present that are associated with a higher risk of developing toxicity, although these clearly need optimization and validation in additional and larger cohorts.
Following this, we sought to establish potentially causal relationships between intestinal enrichment of the distinct commensals identified in our studies and intestinal inflammation during CICB. To do this, we gavaged mice with three different strains of B. intestinalis following gut decontamination with antibiotic treatment (ATB). Increased ileal damage was observed in B. intestinalis-colonized mice compared with mice allowed to spontaneously repopulate their intestinal microflora following ATB (P = 0.0021; Fig. 4d). Gavage with B. intestinalis was also associated with induction of ileal Il1b transcription (P = 0.0025; Fig. 4e). Interestingly, CICB facilitated the over-representation of B. intestinalis over other Bacteroides species such as B. fragilis or B. uniformis, as assessed by quantitative polymerase chain reaction (PCR) in the feces of mice following four systemic injections of CICB (P = 0.0068; Fig. 4f,g). To further confirm the impact of CICB in favoring ileal colonization with B. intestinalis and thereby promoting ileal Il1b transcription, we utilized the avatar mouse model system33, with which fecal microbiota transfer (FMT) was performed in ATB-treated mice (Fig. 4h), using fecal material from three healthy human donors harboring either low or high endogenous levels of B. intestinalis (Fig. 4i). Three weeks post-FMT, the colonization of the recipient mouse intestines with B. intestinalis corresponded to their donor and was thus significantly higher in feces of mice receiving B. intestinalis-high donor FMT than mice receiving B. intestinalis-low donor FMT (P < 0.0001; Fig. 4i). In this model system, we again observed B. intestinalis-associated induction of ileal Il1b expression after systemic injections of CICB (P = 0.0287; Fig. 4j).
Discussion
Taken together, these studies build on prior findings regarding immune checkpoint monotherapies to identify novel biomarkers of response and irAE in the context of CICB, to which unique features may apply. Many of the predictive factors for checkpoint blockade monotherapy appear to be predictive for the response and resistance to CICB (including TMB, CD8+ T-cell density and burden of copy number loss) and toxicity (more diverse TCR repertoire and more naïve T-cell phenotype), although analyses in our study were limited in part by the small numbers of evaluable samples for some analyses, including matched fecal microbiome and peripheral blood lymphocyte phenotyping.
Accordingly, additional studies of larger cohorts of ICB-treated patients will be needed to validate these signatures and address the complexities of how tumor, microenvironment, host and microbiome factors interact to influence ICB outcome. Nonetheless, new findings pertaining to CICB were unveiled in this melanoma cohort and confirmed in mouse models of melanoma and sarcoma. First, the intestinal microbiota paves the way to the CICB-induced toxicity, as shown by the capacity of ATB to mitigate ileitis in mouse cancer models and the significance of the microbiome profiles to the taxonomic level of species in our cohort. Second, CICB appears to favor the dominance of prevalent commensal bacteria associated with clinical benefit (such as P. distasonis) or intestinal toxicity (such as B. intestinalis) in patients with melanoma as well as RET mouse melanomas. Third, these parallel human and mouse studies highlight a contribution of commensals, not only to subclinical colitis, but also to ileal damage associated with increased transcription of IL1B, which could be at least partially prevented by an IL-1R antagonist. The mechanism through which gut microbes impact IL1B expression and development of toxicity needs to be further defined, and such studies are currently under way. Importantly, these findings are corroborated by additional work in human cohorts (Y. Hailemichael et al, unpublished data) and murine models (Y. Zhou et al., unpublished data), and these additional studies support approaches that will abrogate toxicity to CICB while preserving (or even enhancing) therapeutic response. Together, insights from these studies could inform new strategies regarding biomarkers of response and toxicity to CICB, as well as new therapeutic targets to potentially abrogate toxicity beyond tumor necrosis factor-α receptor (TNFαR) blockade34.
Methods
Experimental model and subject details.
Patient cohort.
Patients with advanced (stage III/IV) melanoma treated at The University of Texas MD Anderson Cancer Center between 23 January 2014 and 31 August 2017 who received at least one dose of ipilimumab in combination with a PD-1 checkpoint blockade agent (either nivolumab or pembrolizumab) as CICB were identified from a detailed retrospective and prospective review of clinic records (Supplementary Table 1). CICB treatment was provided as part of clinical trial or expanded access program protocols (NCT01844505, NCT02186249, NCT02089685, NCT01621490, NCT02519322, NCT02320058) or as standard-of-care therapy. Owing to known differences in the underlying biology and immunotherapy responses of melanoma subtypes, only cutaneous melanomas were included for analysis of response, as this was the dominant subset. All subtypes (cutaneous, mucosal and uveal) were included for toxicity analyses. To enable translational analyses, patients without available biospecimens relevant to the CICB treatment period or for whom insufficient data were available to determine radiographic responses and toxicity outcomes were excluded.
For our validation cohort, 43 patients with advanced melanoma amenable to immune checkpoint inhibitors (ICIs) were recruited under ethically approved protocols at McGill University (Ethics MCC 1084) and Sunnybrook (University of Toronto) Time Study (Ethics MCC 1400). Baseline characteristics are presented in Supplementary Table 9. The irAEs were recorded according to the NCI Common Terminology Criteria for Adverse Events (CTCAE) v4.0. All patients were followed until data lock on 1 March 2021. Fecal samples were prospectively collected as previously published using International Human Microbiome Standards guidelines (SOP_03_V1) either before or after the first dose of ICB23. Patients were then segregated between those with no immune-related toxicity and any immune-related toxicity. Relative abundance of B. intestinalis was then measured for both groups.
For all studies involving human research participants, we complied with all relevant ethical regulations.
Mice.
All mice experiments were approved by the local institutional board and performed in accordance with government and institutional guidelines and regulations. Female C57BL/6 mice were purchased from Harlan (France) and utilized between 8 and 16 weeks of age. All mouse experiments were performed at Gustave Roussy Cancer Campus and mice were housed in specific pathogen-free conditions.
Cell lines.
MCA205 and RET melanoma (a transgene-enforced expression of the Ret proto-oncogene under the control of the metallothionein-1 promoter driving spontaneous melanomagenesis, kindly provided by V. Umansky; syngeneic from C57BL/6J mice) were cultured at 37 °C under 5% CO2 in RPMI-1640 medium supplemented with 10% heat-inactivated FBS, 1% penicillin/streptomycin, 2 mM l-glutamine and 1% of sodium pyruvate and non-essential amino acids (all from Gibco Invitrogen) (hereafter complete RPMI medium). Cell lines were regularly tested for mycoplasma contamination and were not used after 10 passages.
Method details.
Clinical assessments and biospecimens.
Response assessments.
Clinical response annotation was performed independently by at least two clinical investigators per patient (MCA, PAP, HT). Treatment responses were defined using the best overall response according to RECIST 1.1 criteria35 comparing tumor burden on restaging imaging performed at standard disease reassessment time point studies with baseline (pre-treatment) studies. Longitudinal restaging scans were evaluated throughout the period of treatment until initiation of a subsequent line of therapy or last known follow-up date. Imaging modality was matched whenever possible, favoring contrast-enhanced computed tomography (CT) of the chest, abdomen and pelvis, contrast-enhanced MRI or CT of the brain, and imaging of the neck or extremities as indicated by known sites of disease. Patients were classified as responders (R) if they achieved objective complete response (CR; 100% reduction in tumor burden) or partial response (PR; ≥30% reduction in tumor burden) attributable to CICB. Patients were classified as non-responders (NR) if they achieved a best overall response of progressive disease (PD; ≥20% increase in disease burden) or stable disease (SD; not meeting criteria for CR, PR or PD) (Supplementary Table 2). Mice were defined as responders if their tumors either regressed or were stable during treatment or as non-responders when tumors increased in size over two consecutive measurements.
Toxicity assessments.
The irAEs were scored according to the CTCAE 4.0 criteria and immune-relatedness to CICB therapy (‘possible’, ‘probable’, ‘definite’ association) assigned by consensus opinion of at least two independent clinical investigators (MCA, HT, WSC). Binary toxicity classification was based on whether patients experienced any grade 3 or higher irAE versus less than grade 3 irAE (Supplementary Table 2).
Biospecimen collections.
Available pre- and on-treatment tumor and peripheral blood samples were identified by querying institutional research biospecimen holdings and, when necessary, archival pathology holdings from diagnostic specimens. Tumor biopsies were obtained as punch, core needle or excisional biopsies and preserved as snap-frozen (for RNA/DNA extraction) or formalin-fixed paraffin-embedded (FFPE; for immunohistochemistry or DNA extraction) specimens. Peripheral blood samples underwent density-gradient centrifugation to isolate PBMCs before cryopreservation until required for germline DNA extraction or flow cytometry. Biospecimens were retrieved, collected and analyzed after patient consent under UT MD Anderson Cancer Center, McGill and University of Toronto Institutional Review Board-approved protocols in accordance with the Declaration of Helsinki. Fecal samples were obtained on an outpatient basis after detailed in-person explanation and instruction by a treating clinician to facilitate stool capture free of water/urine using a single-use toilet insert. Fecal samples were stabilized immediately using the OMNIgene-GUT kit (DNA Genotek) according to the manufacturer’s recommendations, involving contact only with a provided sterile spatula. Stabilized fecal samples were returned in person or by mail to a central laboratory at The University of Texas MD Anderson Cancer Center within 30 days of collection and stored at −80 °C immediately upon receipt. For sequencing, samples were shipped as is and in bulk to the Alkek Center for Metagenomics and Microbiome Research at Baylor College of Medicine. Patient-level sample utilization was as shown in Supplementary Table 3.
Colon biopsies from a cohort of ICB-treated patients taken at the time of clinical grade 3–4 colitis, and from a separate cohort of non-ICB-treated patients without gut symptoms, were identified from systematic chart review, as summarized in Supplementary Table 7. Archival FFPE material was retrieved and freshly cut sections used to extract RNA for downstream estimation of inflammatory cytokine expression by qPCR.
Genomic analyses.
WES analysis.
Whole-exome sequencing (WES) was performed using a previously described protocol15. A total of 26 pre-treatment samples were included (19 R and 7 NR). DNA was extracted from tumor samples after pathological assessment and confirmation of tumor content. Matched peripheral blood leukocytes were collected as germline DNA control. The initial genomic DNA input into the shearing step was 750 ng. End repair, A-base addition, adapter ligation using forked Illumina paired-end adapters, and library enrichment PCR were performed using the KAPA Hyper Prep kit (#KK8504) followed by solid-phase reverse immobilization bead cleanup and cluster generation. Library construction was performed according to the manufacturer’s instructions. Target enrichment was performed using the Agilent SureSelectXT Target Enrichment (#5190–8646) protocol as per the manufacturer’s instructions, using 650–750 ng of prepared libraries. Enriched libraries were normalized to equal concentrations using an Eppendorf Mastercycler EP Gradient instrument, pooled to equimolar amounts on the Agilent Bravo B platform and quantified using the KAPA Library Quantification kit (#KK4824). Pooled libraries were adjusted to 2 nM, denatured with 0.2 M NaOH, diluted using Illumina hybridization buffer, and underwent cluster amplification using HiSeq v3 cluster chemistry and the Illumina Multiplexing Sequencing Primer kit according to the manufacturer’s instructions. Pools were then sequenced on an Illumina HiSeq 2000/2500 v3 system using 76-bp paired-end reads, and analyzed using RTA v.1.13 (or later). The mean coverage for exome data was 221× in tumors and 100× in the germline. Aligned BAM (hg19) files were then processed using the Illumina CASAVA toolkit, Picard and GATK software to identify duplication, realignment and recalibration. Somatic point mutations were identified using MuTect (v1.1.4) and small insertions/deletions using Pindel (v0.2.4). Additional post-calling filters were then applied, including (1) total read count in tumor sample >30, (2) total read count in matched normal sample >10, (3) VAF (variant allele frequency) in tumor sample >0.05, (4) VAF in matched normal sample <0.01 and (5) single-nucleotide variants reported in dbSNP129 and the 1000 Genomes Project were removed.
Copy number alteration analysis.
Copy number alteration analysis was performed as previously described15. Essentially, the Sequenza (v2.1.2) algorithm was applied to the aligned BAM data to obtain the log2(copy number ratio) (tumor/normal) for each tumor sample. Using the R package ‘CNTools’ (v1.24.0), copy number gain (log2(copy ratio) > log21.5) and loss (log2(copy ratio) < −log21.5) at the gene level were identified. The burden of copy number gain or loss was defined as the total number of genes with copy number gain or loss per sample. To define recurrent copy number alteration, the R package ‘cghMCR’ (v1.26.0) was applied to the calculated log2(copy ratio) (tumor/normal) to identify genomic regions of recurrent copy number alterations (minimum common regions). To identify genes preferentially lost or gained in responders versus non-responders, Fisher’s exact test was performed at each gene location, and statistical significance was defined by false discovery rate (FDR) adjusted P < 0.05. Genes with copy number alteration in fewer than three samples were excluded.
Neoantigen prediction.
Non-synonymous exonic mutations from WES were reviewed and all possible 8- to 12-mer peptides encompassing non-synonymous exonic mutations were used for neoantigen prediction and compared with wild-type peptides. Human leukocyte antigen (HLA) of each case was predicted using PHLAT36. Binding affinity was evaluated, taking into account patient HLA, using the NetMHCpan (v2.8) algorithm37,38. Candidate peptides with a predicted half-maximum inhibitory concentration of <500 nM were considered HLA-binding.
Immune analyses.
Flow cytometry (MDACC).
PBMCs obtained from the study patients were analyzed by members of the MD Anderson Immunotherapy Platform at MD Anderson Cancer Center (MDACC). Pre-treatment and post-treatment blood samples were drawn for immunophenotypic analysis of PBMCs. PBMC samples were available from 20 patients, including 10 patients with ≥grade 3 irAEs and 10 patients with <grade 3 irAEs. Multiparametric flow cytometry analysis of PBMCs was performed using fluorescently conjugated monoclonal antibodies (mAbs) across several panels: CD4 AF532 (SK3, eBioscience), CD3 PerCP-Cy5.5 (UCHT1, BioLegend) CD8 AF700 (RPA-T8, BD Biosciences), CD127 BV711 (HIL-7R-M21, BD Biosciences), ICOS PE-Cy7 (ISA-3, eBioscience), PD-1 BV650 (EH12.1, BD Biosciences), FOXP3-PE-e610 (PCH101, eBioscience), CD3 PE-CF594, CD4 Pe-Cy5.5, CD8 AF532 and CD45RA BV650 (HI100, BioLegend), CCR7 BV785 (G043H7, BioLegend), CD27 Pe-Cy5 (0323, eBioscience), CD28 APC-e780 (CD28.2, eBioscience), PD-1 BV650 (EH12.1, BD Biosciences), EOMES e660 (WD1928, eBioscience) and TBET BV605 (4B10, BioLegend). Live/dead fixable yellow stain was obtained from Thermo Fisher Scientific. Samples were run using an LSR Fortessa instrument (BD Biosciences) and analyzed using the FlowJo software program. After appropriate forward/side scatter and live single-cell gating, we determined the frequency of total CD3+ T cells, CD8+ T cells (CD3+ CD8+) and CD4+ T cells (CD3+ CD4+). Among the CD4, CD4+ effector T cells (CD4+ FOXP3−) and CD4+ regulatory T cells (CD4+ FOXP3+ CD127−/low). PD-1 and ICOS expression was evaluated on these populations. CD45RA and CCR7 expression on CD4 and CD8 T cells was used to define naïve, T central memory (TCM), T effector memory (TEM) and Teff subpopulations. PD-1, CD28, CD27, eomesodermin (EOMES) and T-box expressed in T cells (TBET) expression was evaluated in each of these compartments.
Flow cytometry at MSKCC.
PBMCs were isolated and cryopreserved from patient whole-blood samples. Flow cytometry was performed in the Immune Monitoring Facility at Memorial Sloan Kettering Cancer Center (MSKCC) to examine T-cell phenotypic markers. Human PBMC samples were thawed and stained with a fixable viability stain (FVS510, BD Biosciences (BD)) and a cocktail of antibodies to the following surface markers: CD45RA-BUV395 (BD, HI100), CD4-BUV496 (BD, SK3), ICOS-BUV563 (BD, DX29), CD25-BUV615 (BD, 2A3), TIM-3-BUV661 (BD, 7D3), CD27-BUV737 (BD, L128), CD8-BUV805 (BD, SK1), CD57-BV421 (BD, NK-1), CXCR5-BV480 (BD, RF8B2), CD14-BV570 (BioLegend, M5E2), CD19-BV570 (BioLegend, HIB19), CCR4-BV605 (BioLegend, L291H4), CCR7-SB645 (eBioscience, 3D12) HLA-DR-BV711 (BD, G46–6), CD3-BV750 (BD, SK7), CD28-BV786 (BD, CD28.2), PD-1-BB515 (BD, MIH4), CD127-BB700 (BD, HIL-7R-M21), CD38-BB790 (BD, HIT2), TIGIT-PE (eBioscience, MBSA43) and GITR-PE-Cy7 (eBioscience, eBioAITR), in the presence of Brilliant Stain Buffer Plus (BD). Cells were next fixed and permeabilized with the FoxP3/Ki-67 fixation/permeabilization concentrate and diluent (eBioscience) and subsequently stained intracellularly with LAG-3-BB660 (BD, T47–530), Ki-67-AlexaFluor700 (BD, B56), FoxP3-PE-Cy5.5 (eBioscience, PCH101), CTLA-4-PE-Cy5 (BD, BNI3), Eomes-PE-eFluor610 (eBioscience, WD1928), T-bet-APC (eBioscience, ebio4B10), Granzyme B-APC-Fire750 (BioLegend, QA16A02), in the presence of Brilliant Stain Buffer Plus (BD). Stained cells were acquired on a BD Biosciences FACSymphony system and analyzed using FlowJo software (FlowJo).
Immunohistochemistry.
A hematoxylin and eosin (H&E) stained slide from each FFPE tumor sample was obtained to confirm the presence of tumor. Heavily pigmented samples were pretreated with melanin bleaching by a low concentration hydrogen peroxide. The selected antibody panel included programmed death-ligand 1 (PD-L1) clone E1L3N (1:100, Cell Signaling Technology), PD-1 clone EPR4877 (1:250, Epitomics), CD3 polyclonal (1:100, DAKO), CD4 clone 4B12 (1:80, Leica Biosystems), CD8 clone C8/144B (1:25, Thermo Scientific), FOXP3 clone 206D (1:50, BioLegend) and Granzyme B clone 11F1 (ready to use, Leica Microsystems). Immunohistochemistry (IHC) staining of a limited antibody panel was performed using a Leica Bond Max automated stainer (Leica Biosystems). The IHC reaction was performed using a Leica Bond Polymer Refine detection kit (Leica Biosystems) and diaminobenzidine was used as chromogen. Counterstaining was performed with hematoxylin. All IHC slides were scanned using an Aperio AT Turbo (Leica Biosystems) before all downstream IHC analyses. Using the Aperio Image Toolbox analysis software (Leica Biosystems), average values for each marker from five randomly selected 1-mm2 areas within the tumor region were selected for digital analysis as previously described39. PD-L1 expression was evaluated by H-score, which evaluates the percentage of positive cells (0 to 100) and the intensity of staining (0 to 3+), with a total score ranging from 0 to 300. The remaining markers were scored as density of cells.
TCR sequencing.
DNA was extracted from available FFPE tumor tissues (19 R and 6 NR) and PBMCs (15 patients with ≥grade 3 irAEs and 12 patients with <grade 3 irAEs) using the QIAamp DNA FFPE tissue kit (Qiagen). Next-generation TCR sequencing of CDR3 variable regions was performed using the ImmunoSeq hsTCRB kit (Adaptive Biotechnologies) followed by sequencing on a MiSeq 150× system (Illumina) and analysis using the ImmunoSeq Analyzer software v3.0 (Adaptive Biotechnologies), considering only samples for which a minimum of 1,000 unique templates were detected. Clonality is an index inversely correlated with TCR diversity and was measured as 1 − (entropy)/log2(no. of productive unique sequences). Preferential clonal expansion was defined as the number of T-cell clones significantly expanded in post-treatment compared to pre-treatment blood samples.
Murine models.
Antibiotic treatments.
Mice were treated with an antibiotic solution (ATB) containing ampicillin (1 mg ml−1), streptomycin (5 mg ml−1) and colistin (1 mg ml−1) (Sigma-Aldrich), with or without the addition of vancomycin (0.25 mg ml−1) via drinking water. Solutions and bottles were replaced three times and once weekly, respectively. Antibiotic activity was confirmed by cultivating fecal pellets resuspended in brain heart infusion broth + 15% glycerol at 0.1 g ml−1 on COS (Columbia agar with 5% sheep blood) plates for 48 h at 37 °C in aerobic and anaerobic conditions. The duration of ATB treatments was slightly different based on the experimental settings. In brief, mice were treated for two weeks before tumor implantation and continuously throughout the experiment in MCA205 and RET experiments. In experiments where FMT were used, ATB treatment was administered for three days before fecal microbiota transfer.
Tumor challenge and treatment.
Flanks of mice were subcutaneously (s.c.) injected with 0.8 × 10⁶ MCA205 or 0.5 × 10⁶ RET cells. Treatment commenced when tumors reached 20–30 mm2. Mice were injected intraperitoneally (i.p.) every three days with anti-PD-1 mAb (250 μg per mouse; clone RMP1–14, six injections in MCA205, five injections in RET) and/or anti-CTLA-4 mAb (100 μg per mouse, clone 9D9, five injections in both MCA205 and RET) with or without anti-IL-1R antagonist (anakinra, 500 μg per mouse, injected i.p. three times per week) or respective isotype controls as indicated in the figures. All mAbs for in vivo use were obtained from BioXcell, using the recommended isotype control mAbs except anakinra (Swedish Orphan Biovitrum).
FMT experiments.
After three days of ATB treatment, FMT was performed using samples from healthy volunteers whose fecal shotgun sequencing analyses revealed the presence or absence of B. intestinalis. Frozen fecal samples were thawed and thoroughly vortexed. Large particulate material was allowed to settle by gravity. A 200 μl sample of supernatant was administered in a single dose by oral gavage. An additional 100 μl was topically applied onto the fur of each animal. Two weeks after FMT, C57BL/6J mice were inoculated with 1 × 10⁵ RET tumor cells in 100 μl of PBS, injected s.c. The CICB began seven days after tumor inoculation and mice were euthanized at 24 h post first administration of anti-CTLA-4+ anti-PD-1 i.p. to harvest ilea and perform qPCR for several gene products (IL-1b, TNFa, IL-6 and IL-17).
Gut colonization with dedicated commensal species.
Bacteroides intestinalis CSURP836 (provided by Institut Hospitalo-Universitaire Méditerranée Infection, isolated from a human sample), B. intestinalis from everImmune (isolated from stools of a lung cancer patient before immunotherapy) and B. intestinalis (isolated from a mouse sample) were cultured on COS plates in anaerobic conditions using anaerobic generators (Biomerieux) at 37 °C for 24–72 h. Suspensions of 109 c.f.u. ml−1 were obtained using a spectrophotometer (Eppendorf) at an optical density of 1 measured at 600 nm. Oral gavages of 109 c.f.u. in 100 μl were administered 24 h before antibody treatment and with each antibody treatment. Bacteria were verified using a matrix-assisted laser desorption/ionization time of flight mass spectrometer (Microflex LT analyzer, Bruker Daltonics).
Cytokine quantification.
Stool samples were collected and stored at −80 °C until further processing. Samples were thawed and resuspended (at 100 mg ml−1) in PBS containing 0.1% Tween 20. After a 20-min incubation with shaking at room temperature, samples were centrifuged for 10 min at 12,000 r.p.m. and supernatants were harvested and stored at −20 °C until analysis. Lipocalin-2 levels were measured using the mouse Lipocalin-2/NGAL DuoSet ELISA kit (R&D Systems) following the manufacturer’s instructions.
Immunohistochemistry.
Gut tissue was preserved in either FFPE or optimum cutting temperature (OCT) compound. At mouse euthanasia, the ileum and colon were removed, washed in PBS, cut longitudinally, rolled and fixed in 4% paraformaldehyde overnight at 4 °C or, in some experiments, for 2 h at room temperature. The tissue was then either paraffin-embedded with a Tissue-Tek VIP 6 vacuum infiltration processor (Sakura) or rehydrated in 15% sucrose for 1 h followed by 30% sucrose overnight, OCT-embedded (Sakura) and snap-frozen. Longitudinal sections were counterstained with hematoxylin, eosin and safran stain.
Histological assessment of gut tissue for toxicity.
A scoring system was developed with a pathologist (PO) as follows. For the ileum, inflammatory foci, appearance of the submucosa, length of villi and the thickness of lamina propria were scored for each section (0, normal; 1, focal and minor lesions; 2, diffuse and minor lesions; 3, diffuse, minor and major lesions; 4, major lesions with areas containing only connective tissue). For the colon, inflammatory infiltrate, defined as physiological (0), low (1), moderate (2) or high (3) levels, was scored.
Immune gene expression by real-time qPCR analysis.
RNA was extracted using the RNeasy Mini kit (Qiagen) and reverse-transcribed into complementary DNA using SuperScript III reverse transcriptase and the RNaseOUT recombinant ribonuclease inhibitor (Life Technologies) using random primers (Promega) and the deoxynucleoside triphosphate set, PCR grade (Roche). Gene expression was analyzed by real-time quantitative PCR using the TaqMan method with TaqMan Gene Expression Assays and Taqman Universal Master Mix II (Invitrogen) according to the manufacturer’s instructions on the 7500 Fast Real Time PCR system (Applied Biosystems). Expression was normalized to the expression of the housekeeping gene of β-2 microglobulin by means of the 2 − ΔCt method. The following primers were used (all from TaqMan Gene Expression Assay, Thermo Fisher): B2m (Mm00437762_m1), Il1b (Mm00434228_m1), Il6 (Mm00446190_m1), Tnf (Mm00443258_m1), IL1B (Hs01555410_m1), B2M (Hs00187842_m1), IL17A (Hs00174383_m1) and TNF (Hs00174128_m1).
Microbiome studies.
Patient fecal sample collection.
Baseline stool samples were collected using the OMNIgene GUT kit (DNA Genotek). A total of 54 stool samples were subject to bacterial 16S rRNA gene sequencing, including a cutaneous/unknown primary cohort (n = 40; 29 R, 11 NR; 24 with ≥grade 3 irAEs, 16 with <grade 3 irAEs), and for toxicity analyses only, a mucosal cohort (three with and five without ≥grade 3 irAEs) and a uveal melanoma cohort (two with and four without ≥grade 3 irAEs). Within this cohort, a number of samples obtained early after initiation of CICB were included as surrogate baseline samples, as our parallel study on longitudinal samples collected from patients undergoing ICB monotherapies showed no significant change in fecal microbiota early after treatment initiation21.
Human fecal bacterial DNA extraction.
Preparation and sequencing of the human fecal samples was performed in collaboration with the Alkek Center for Metagenomics and Microbiome Research (CMMR), Baylor College of Medicine, using methods adapted from the NIH Human Microbiome Project40,41. Extended details of the analytical pipeline have been reported previously21. Briefly, bacterial genomic DNA extracted using the MO BIO PowerSoil DNA Isolation kit (MO BIO Laboratories) underwent PCR amplification of the 16S rRNA gene V4 region (2 × 250 bp) and was sequenced using the MiSeq platform (Illumina).
Processing of 16S rRNA gene sequences.
Quality filtered sequences with >97% identity were clustered into OTUs and classified phylogenetically against the NCBI 16S ribosomal RNA sequence database (release date, 1 September 2018) using the NCBI-BLAST+ package 2.8.1. 2018). The pipeline involves the following steps:
The fastq_mergepairs command within VSEARCH42 was used to merge paired-end reads, with a maximum of 10 mismatches to create consensus sequences, followed by dereplication using the derep_fulllength command, sorting by decreasing length (sortbylength command; 200 to 350 bp), and sorting by decreasing cluster size of representative sequences (sortbysize command, minimum 2).
OTU clustering, selection and exclusion of chimeras (97%) was done using the cluster_otus command through the UPARSE43 algorithm within USEARCH44.
Representative OTU sequences were then classified using the NCBI 16S database with BLAST (Basic Local Alignment Search Tool). This step was done in R using the blastn UNIX executable and served as the database against which the original merged reads were mapped. At the species level, only OTUs with an unambiguous assignment were classified, whereas all others were annotated as ‘unclassified’ (Supplementary Table 4).
Next the usearch_global command was used to query the database of merged reads for high-identity hits using the previously generated representative OTU sequences as reference. The identity threshold used for this step was 0.97. The mapped OTUs were converted into an OTU table using a series of Python scripts summarized in uc2otutab.py.
Microbiome indices to estimate alpha and beta diversity were calculated in QIIME45. To estimate the phylogenetic distances among OTUs, sequences were first aligned by the PyNAST46 method using the align_seqs.py command. filter_alignment.py was then used to filter the sequence alignment by removing the highly variable regions.
Next, the make_phylogeny.py script was used to create the phylogenetic tree from multiple sequence alignment and the beta_diversity.py script was used to estimate beta diversity using Bray–Curtis dissimilarity and weighted and unweighted UniFrac distance matrices47.
To estimate alpha diversity, the OTU table was first rarefied using the single_rarefaction.py command in QIIME. The rarefaction cutoff used was the total read count for the sample with the least number of reads. The alpha_diversity. py script in QIIME was then used to estimate alpha diversity.
Comparison with Gopalakrishan et al. Science 2018 cohort.
We compared the microbial characteristics of all samples from patients in this cohort and those accrued in Gopalakrishnan et al.21, as they were sequenced using identical methodologies. For the purposes of this comparison, all samples were pooled and run through our bioinformatic pipeline, and OTUs were called from the pooled dataset. New distance matrices were obtained from the pooled dataset, and we compared the overall microbial composition between cohorts using ordination of weighted UniFrac distances by principal coordinate analysis, where distances between samples were compared using PERMANOVA.
Comparison of key response-associated taxa across published immunotherapy-treated cohorts.
Clinical metadata, 16S and shotgun data were downloaded from the Sequence Read Archive (SRA) or obtained from the corresponding authors for published cohorts treated with anti-CTLA-4 ICB24,25, anti-PD-1 ICB21 and monotherapy or combination ICB26,27. 16S and shotgun datasets were processed with our 16S pipeline and MetaPhlAn3, respectively. Results were parsed to obtain the mean abundances for all taxonomies, and Mann–Whitney tests were used to explore differences in the abundance of taxa of interest between objective responders or patients with long-term benefit and those who had non-durable stable disease or progressive disease as defined and indicated in each publication.
Comparison of B. intestinalis in an external cohort.
Stool samples from 43 patients with melanoma were submitted for DNA extraction and sequencing using the Illumina Nextera DNA Fle Library Prep kit according to the manufacturer’s instructions. Libraries were multiplexed using dual indexing and sequenced for 300-bp paired-end reads using the Illumina NovaSeq6000 platform according to the manufacturer’s instructions. This pre-processing pipeline consists of three steps: (1) initial quality control by removing low-quality reads (quality score <Q15), fragmented short reads (<50 bp) and low-complexity reads (entropy < 0.7) using bbduk.sh; (2) contaminant DNA removal using a Bloom filter (bloomfilter.sh), where k = 31 with a minimum of 15 k-mer hits and removing human-associated reads (hg38); (3) alignment of the resulting trimmed and filtered reads to MetaPhlAn3’s database using bbmap.sh at an identity threshold of 97%. Bacterial abundances were then generated using MetaPhlAn348. Relative abundance in tox versus no tox was represented for B. intestinalis.
Whole metagenome shotgun sequencing.
DNA extracted for 16S rRNA gene sequencing was also used for WMS to minimize biases introduced in the extraction process. The sequencing was done at CosmosID, where samples were quantified using Qubit4 and individual sequencing libraries were prepared using proprietary methods. Pooled libraries were sequenced on the Illumina NextSeq 550 platform in a 300-cycle run. Raw FASTQ files were made available through CosmosID’s client portal and annotated taxonomically using MetaPhlAn249 following exclusion of host reads with kneaddata.
Statistical assessment of microbial biomarkers using LEfSe.
The LEfSe method was used to compare abundances of all bacterial clades according to response (that is, R versus NR) and by occurrence of toxicity (that is, between patients with ≥grade 3 irAEs and <grade 3 irAEs; statistical significance was defined as P < 0.05)50. Bacterial taxa with differential abundance between study groups were used as input for the linear discriminant analysis to calculate an effect size. LEfSe analysis for murine taxa was performed with Mothur v1.39.5.
Mouse fecal sample collection, DNA extraction and microbiota characterization.
At least two longitudinal stool samples were collected from mice (n = 71) and stored at −80 °C until DNA extraction. Preparation and sequencing of mouse fecal samples was performed at IHU Méditerranée Infection. Briefly, DNA was extracted using two protocols. The first protocol consisted of physical and chemical lysis, using glass powder and proteinase K, respectively, then processing using the Macherey–Nagel DNA tissue extraction kit51. The second protocol was identical to the first protocol, with the addition of glycoprotein lysis and deglycosylation steps52. The resulting DNA was sequenced, targeting the V3–V4 regions of the 16S rRNA gene as previously described53. Raw FASTQ files were analyzed with Mothur pipeline v.1.39.5 for quality check and filtering (sequencing errors, chimeras) on a Workstation DELL T7910. Raw reads (15,512,959 in total, on average 125,104 per sample) were filtered (6,342,281 in total, on average 51,147 per sample) and clustered into OTUs, followed by elimination of low-populated OTUs (up to five reads) and by de novo OTU picking at 97% pairwise identity using standardized parameters and SILVA rDNA Database v.1.19 for alignment. In all, considering RET and MCA samples, 427 bacterial taxa were identified using a prevalence threshold of ≥20% (that is, present in at least 20% of samples). Sample coverage was computed with Mothur and was on average higher than 99% for all samples, providing a suitable normalization procedure for subsequent analyses. Bioinformatic and statistical analyses on recognized OTUs were performed with Python v.2.7.11. The most representative and abundant read within each OTU (as evidenced in the previous step with Mothur v.1.39.5) underwent a nucleotide BLAST using the National Center for Biotechnology Information (NCBI) BLAST software (ncbi-blast-2.3.0) and the latest NCBI 16S Microbial Database accessed at the end of April 2019 (ftp://ftp.ncbi.nlm.nih.gov/blast/db/). A matrix of bacterial relative abundances was built at each taxonomic level (phylum, class, order, family, genus, species) for subsequent multivariate statistical analyses.
Mouse microbiota and OTU-level analyses.
For mouse experiments, raw data were first normalized then standardized using QuantileTransformer and StandardScaler methods from the scikit-learn package v0.20.3. Normalization using the output_distribution = ‘normal’ option transforms each variable to a strictly Gaussian-shaped distribution, while the standardization results in each normalized variable having a mean of zero and variance of one. These two steps of normalization followed by standardization ensure the proper comparison of variables with different dynamic ranges, such as bacterial relative abundances, tumor size or colonic infiltrate score. Measurements of alpha diversity (within-sample diversity) such as observed_otus and Shannon index, were calculated at the OTU level using the scikit-learn package v.0.4.1. Exploratory analysis of beta diversity (between-sample diversity) was calculated using the Bray–Curtis measure of dissimilarity calculated with Mothur and represented in principal coordinate analyses, while for hierarchical clustering analysis, Bray–Curtis metrics and the complete linkage method were implemented using custom scripts (Python v.2.7.11). We implemented PLS-DA and the subsequent VIP as a supervised analysis wherein the VIP values (order of magnitude) were used to identify the most discriminant bacterial species among tumor-bearing and tumor-free mice, and among the different time points (T0, T2 and T5). As depicted in Fig. 2f, bar thickness reports the fold ratio value of the mean relative abundances for each species among the two cohorts, whereas ‘not applicable’ (NA) refers to comparisons with a group with zero relative abundance. Absence of a border indicates mean relative abundance of zero in the compared cohort(s). To compare the microbiota taxa with gene expression datasets or tumor size and colonic toxicity, a multivariate statistical Spearman (or Pearson for mouse data) correlation analysis (and related P values) was performed with custom Python scripts. Mann–Whitney U and Kruskal–Wallis tests were used to assess significance for pairwise or multiple comparisons, respectively, considering P < 0.05 as significant.
Pairwise comparisons of relative abundances between taxa identified within patient samples were performed using Mann–Whitney tests followed by bootstrapping with 1,000 permutations. Only taxa that were present in at least 40% of all samples were considered. Rarefaction limits for the calculation of alpha diversity were set based on the least number of reads in all fecal samples. Alpha diversity was estimated using the inverse Simpson index, calculated as
where pi is the proportion of the total species S that comprises species i (ref.54). Additional diversity metrics are as indicated in the figures. Correlations between relative abundance of candidate taxa and peripheral immune markers were estimated using Spearman’s ρ. Analysis of similarity (ANOSIM, which represents the difference of datasets’ centroids) or, when indicated, Pearson correlation coefficient, were computed with Python 2.7.11.
Quantification of bacteria in fecal samples by qPCR.
Genomic DNA was extracted from fecal samples using the QIAamp DNA Stool Mini Kit (Qiagen) following the manufacturer’s instructions. Targeted qPCR systems were applied using either TaqMan technology (for systems targeting the All Bacteria domain) or SYBR Green for different Bacteroides species. The following primers and probes were used
| Target | PCR system | Primers and probes | Oligo sequence | Refs. |
|---|---|---|---|---|
| All bacteria | TaqMan | Forward | CGGTGAATACGTTCCCGG | 55,56 |
| Reverse | TACGGCTACCTTGTTACGACTT | |||
| Probe | 6 FAM-CTT GTA CAC ACC GCC CGT C-MGB | |||
| B. intestinalis | SYBR Green | Forward | AGCATGACCTAGCAATAGGTTG | 57 |
| Reverse | ACGCATCCCCATCGATTAT | |||
| B. uniformis | SYBR Green | Forward | TCTTCCGCATGGTAGAACTATTA | 58 |
| Reverse | ACCGTGTCTCAGTTCCAATGTG | |||
| B. fragilis | SYBR Green | Forward | TGATTCCGCATGGTTTCATT | 57 |
| Reverse | CGACCCATAGAGCCTTCATC |
Statistical analyses.
Data analyses and representations were performed either with R software (http://www.R-project.org/), Microsoft Excel (Microsoft Co.) or Prism 5 (GraphPad). Patient cohort survival curves were generated using the R package ‘survival’59. Between-group comparisons of patient cohort genomic and immune parameters were performed using unpaired Mann–Whitney U tests or Fisher’s exact test in the case of low-sample dichotomous variables, taking P < 0.05 as statistically significant. All comparisons were two-sided unless a strong a priori hypothesis warranted a one-sided approach (indicated where appropriate). Permutation testing was performed by randomly permuting sample labels for a total of 1,000 iterations. Multivariable logistic regression models were built using the best subsets approach to adjust for the effect of clinical prognostic variables. Separate models were built for response and toxicity outcomes and, for each model, bacterial candidates identified during the taxonomic discovery phase were considered primary predictors. Abundances estimated from WMS were used as input. All patients were categorized as high or low for a bacterial candidate based on the median relative abundance. We allowed a maximum of two other clinical covariates (given constraints of event rates) from among age at entry, sex, BRAF mutation status (wild type versus mutant), American Joint Committee on Cancer stage (stages III and IV versus stages I and II), baseline lactate dehydrogenase (LDH, high versus low) and melanoma subtype (uveal/mucosal versus cutaneous).
In murine studies, statistical analyses gathering more than two groups were performed using ANOVA followed by pairwise comparisons with Bonferroni adjustments. Differential enrichment analyses in murine studies were corrected for multiple hypothesis testing using FDR at 10% two-stage Benjamini–Hochberg. ANOSIM and PLS-DA P values were automatically calculated after 999 permutations. Otherwise, for two groups, statistical analyses were performed using the unpaired t-test. Outliers within a given distribution were tested using Grubbs’ test (https://graphpad.com/quickcalcs/Grubbs1.cfm) with a threshold at P < 0.05. All tumor growth curves were analyzed using software developed in Professor Guido Kroemer’s laboratory and information about statistical analyses is available at https://kroemerlab.shinyapps.io/TumGrowth/60. Briefly, for longitudinal analyses, original tumor measurements were log-transformed before statistical testing. When complete regressions of tumors were observed, zeros were imputed by the minimum value divided by 2. An automatic outlier detection at P < 0.1 was retained, both for the longitudinal analyses and the Kaplan–Meier curves. Survival curves were estimated using the Cox regression and the multiple testing was taken into account using the Bonferroni adjustment.
Box and whisker plots represent each group’s median (horizontal thick line), upper and lower quartiles (bounds of the box) and range (whiskers), and individual data points are overlaid. P values are two-sided with 95% confidence intervals and are considered significant when P < 0.05 (*P < 0.05, **P < 0.01, ***P < 0.001).
Extended Data
Extended Data Fig. 1 |. Cohort description and tumor intrinsic genomic parameters.
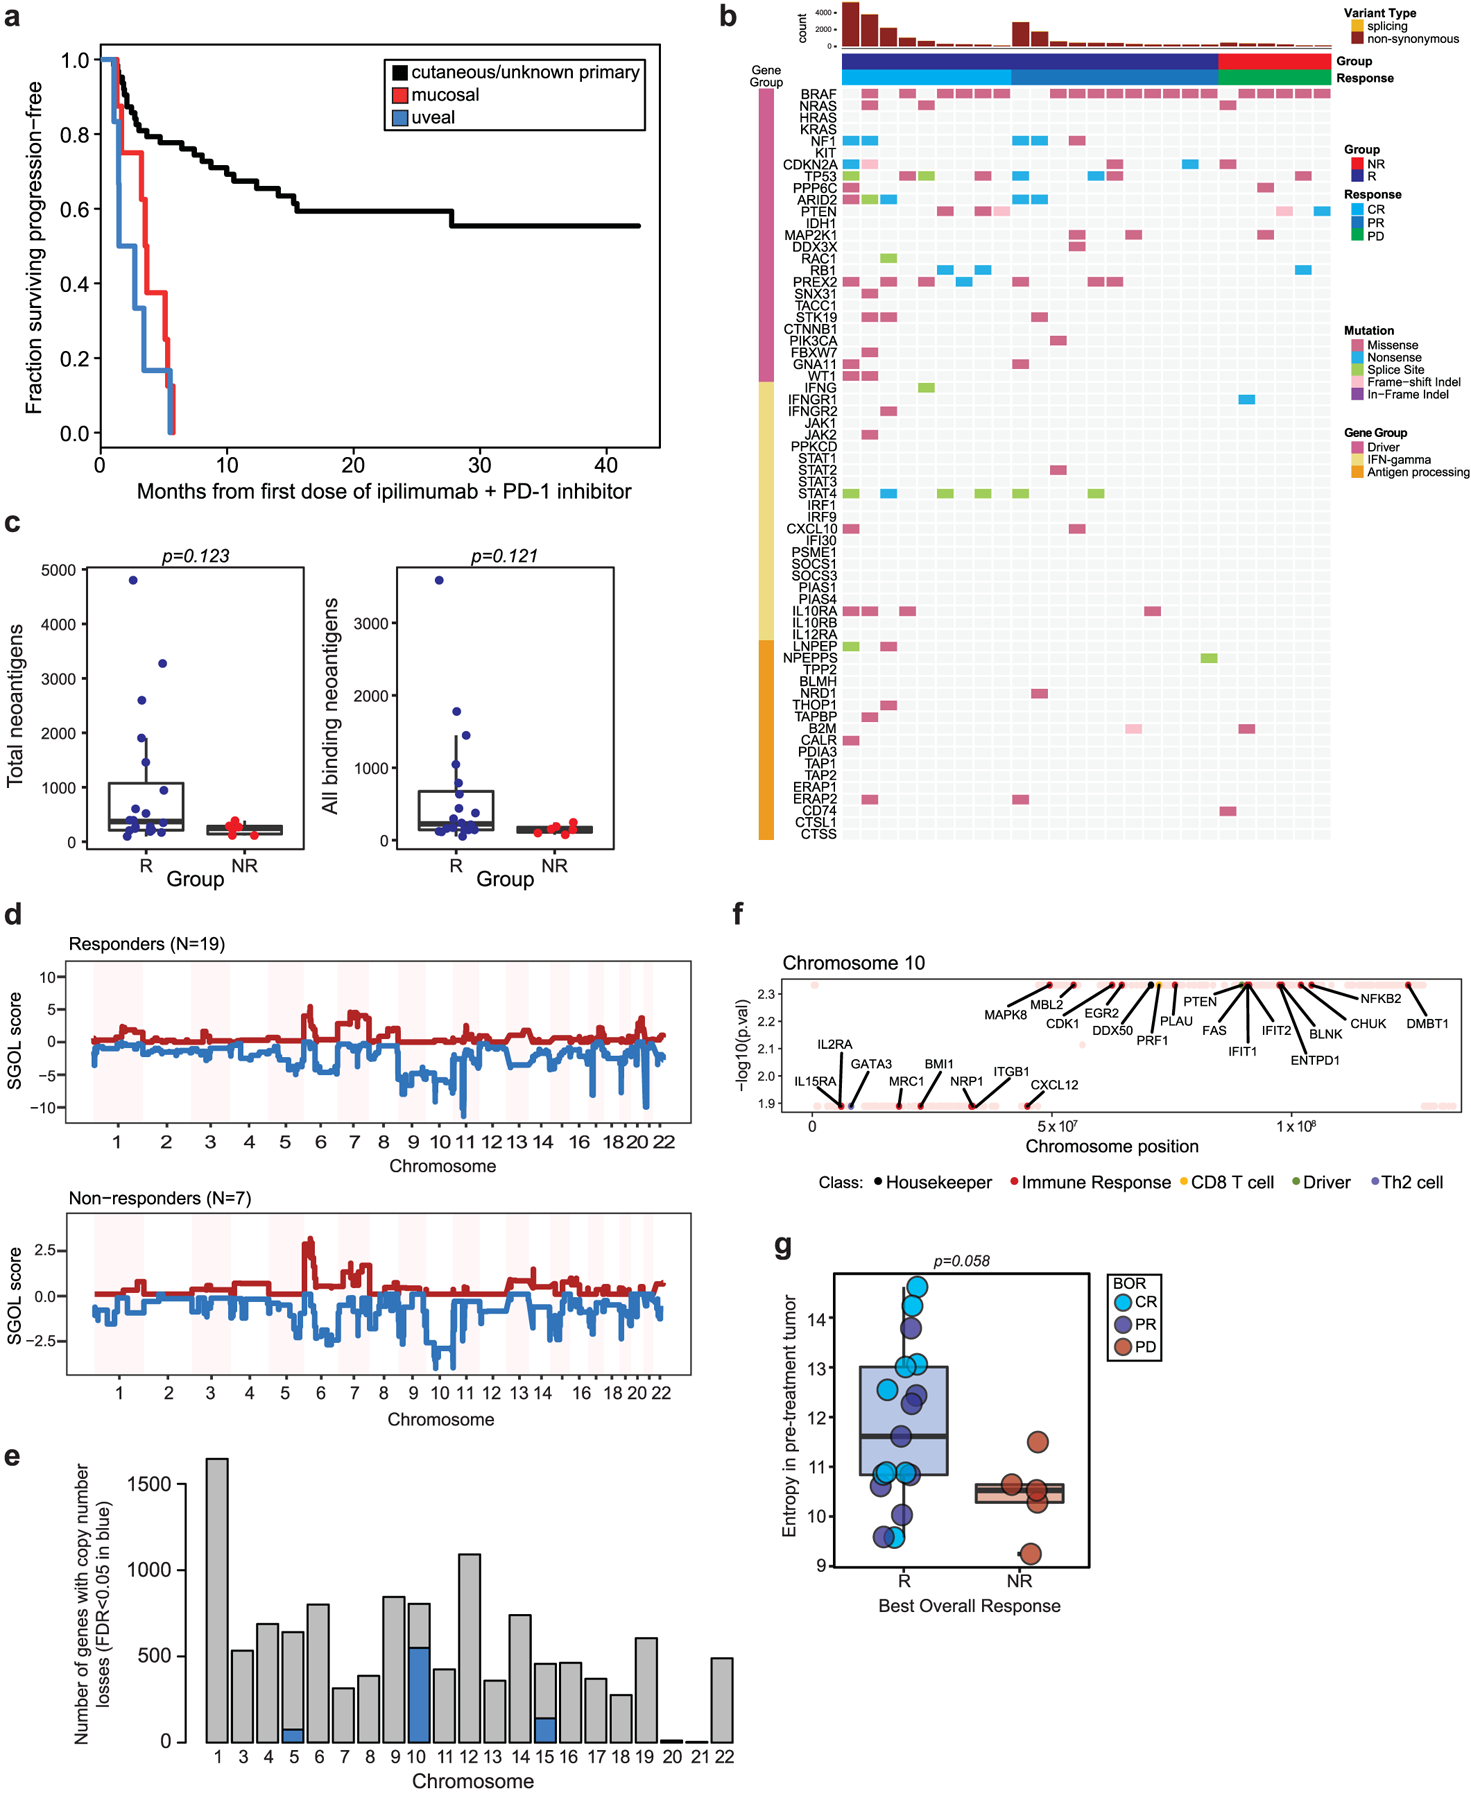
a, Kaplan-Meier curve of progression-free survival in the patient cohort stratified by melanoma subtype (n = 77, n = 63 cutaneous/unknown primary, n = 8 mucosal, n = 6 uveal). b, Landscape of non-synonymous variants (NSV) identified by whole-exome sequencing (n = 26 tumors) affecting selected genes recurrently mutated in melanoma, IFN-signaling genes and antigen processing/presentation genes. c, Differences in counts of total predicted neoantigens, and all binding neoantigens in patients grouped by best overall response (R=responder (blue), n = 20; NR=non-responder (red), n = 6, two-sided Mann-Whitney test left panel p = 0.123, right panel p = 0.121). d, Genome-wide SGOL scores and (e) barplot of the number of genes affected by copy number losses aggregated by chromosome, demonstrating dominant copy number loss burden within chromosomes 5, 10 and 15. f, Copy number loss-affected genes located on chromosome 10 include a broad variety of functional classes. g, Entropy of pre-treatment intratumoral T cell receptor (TCR) repertoires comparing R (n = 19) versus NR (n = 6) repertoires (p = 0.058, two-sided Mann-Whitney test). Box plots present the median bar with the box bounding interquartile range (IQR) and whiskers to the most extreme point within 1.5 × IQR.
Extended Data Fig. 2 |. Fecal microbiome composition and diversity at baseline in CICB-treated patients.
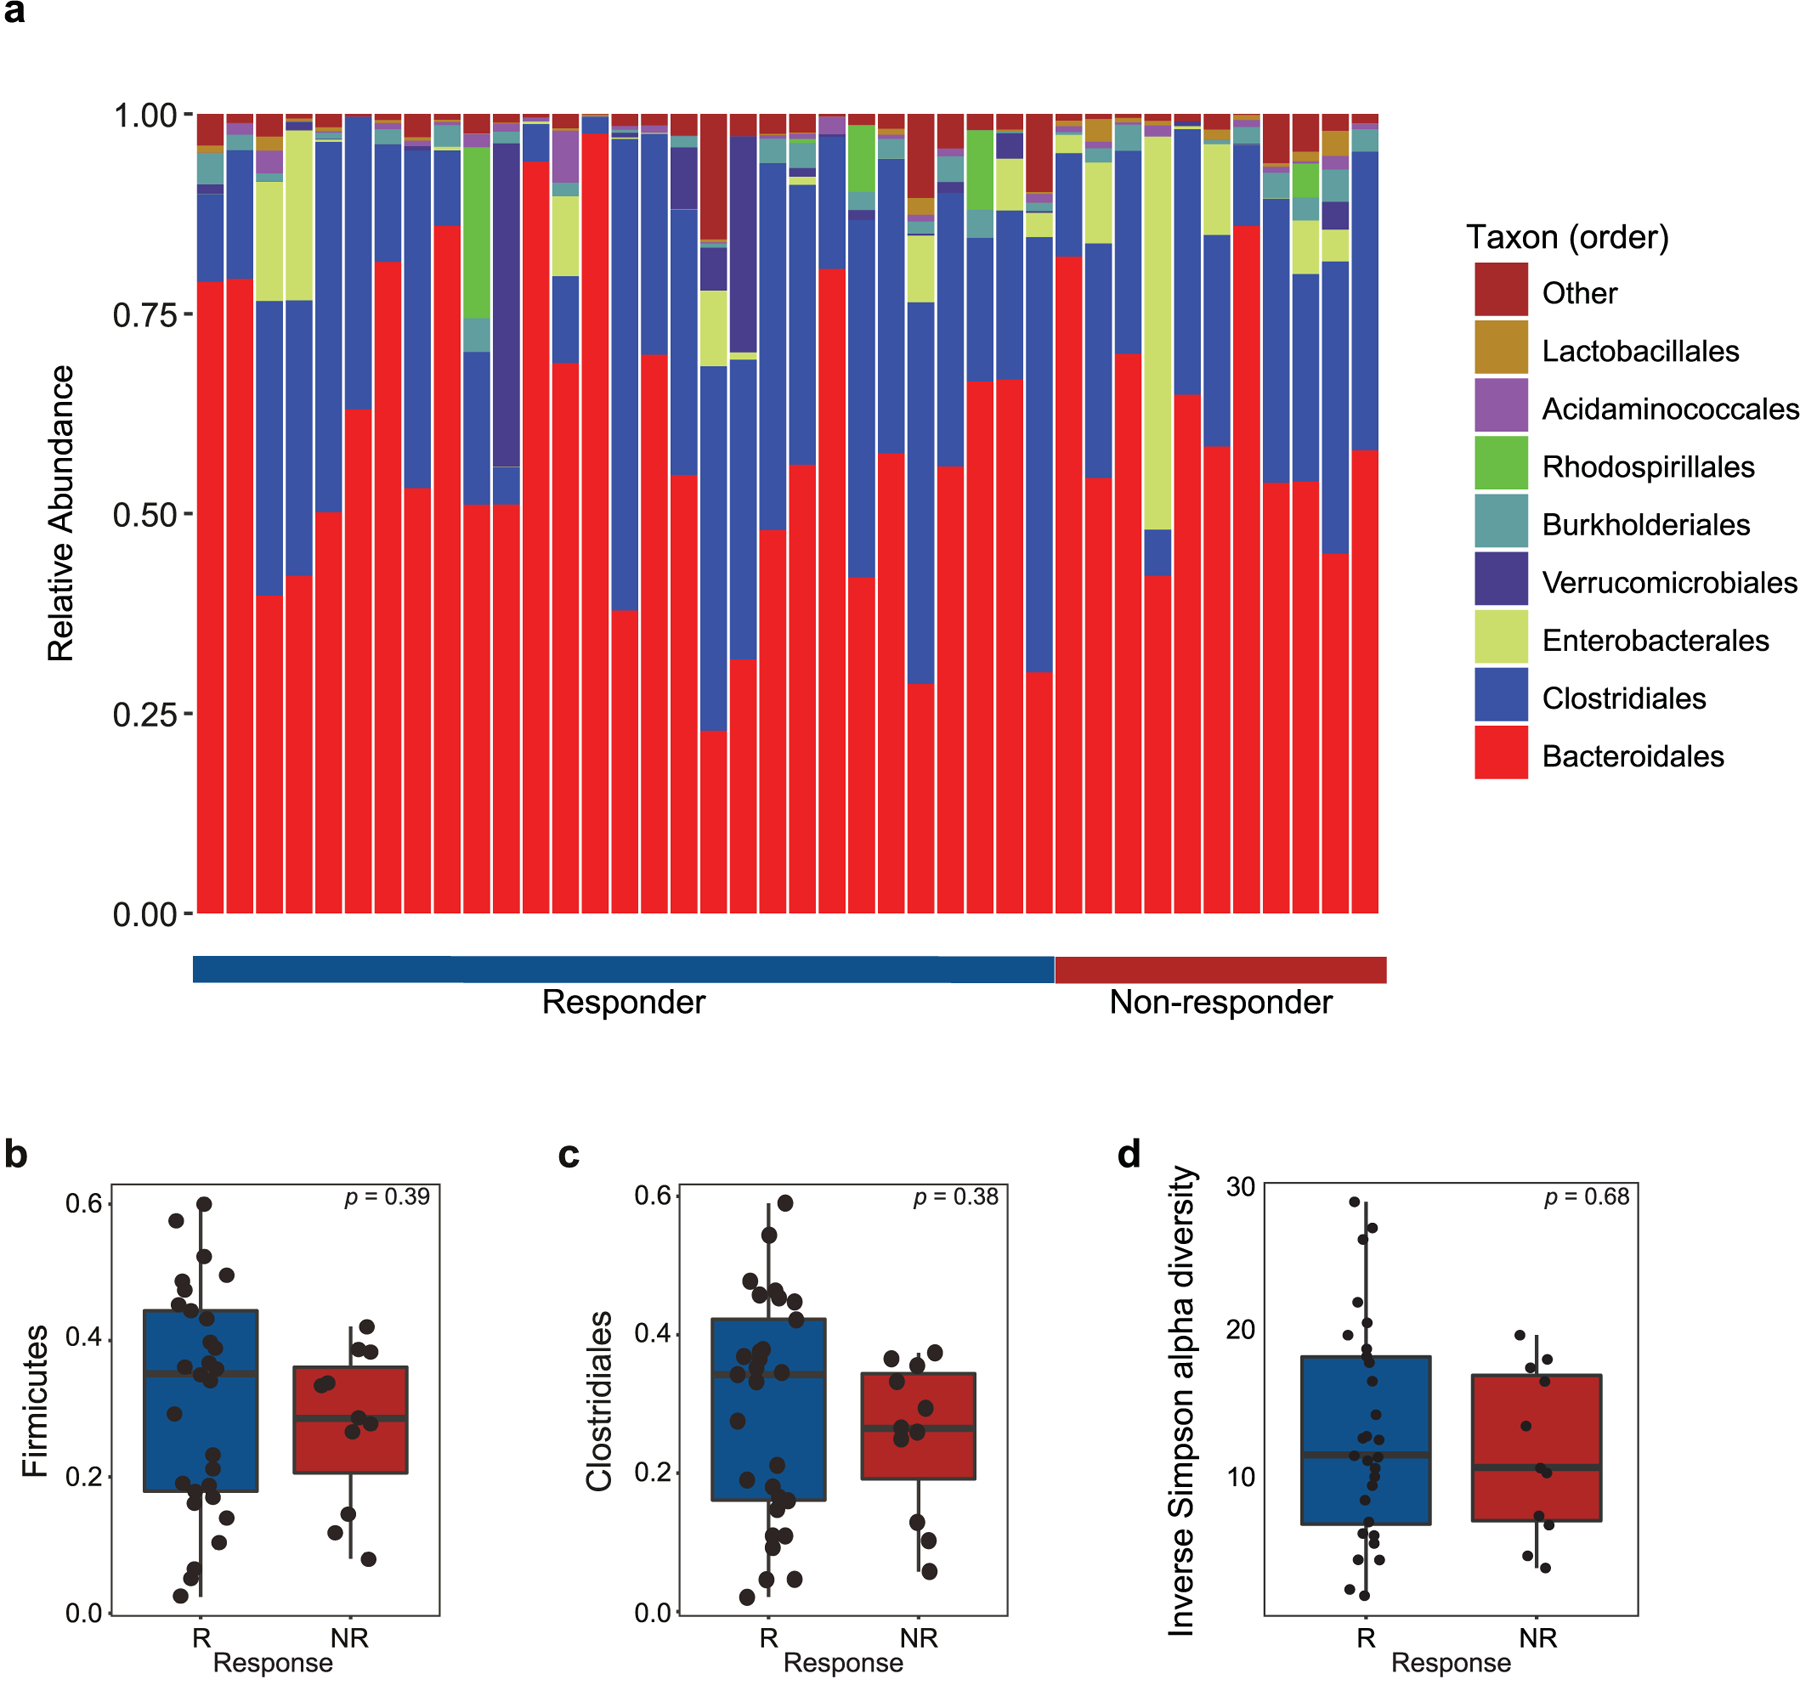
a, Stacked bar plot depicting 16S microbial composition of each analyzed fecal sample from the cutaneous and unknown primary cohort at the order level (n = 39). b,c, Comparison of group-wise abundances of Firmicutes (b) (p = 0.39) and Clostridiales (c) (p = 0.38) by response outcome in the cutaneous/unknown primary cohort (n = 39). d, Inverse Simpson alpha diversity of the fecal microbiome grouped by response in CICB-treated patients with cutaneous or unknown primary melanomas (n = 39) taken at baseline (p = 0.68, Mann-Whitney test; R=responder, NR=non-responder). Box plots present the median bar with the box bounding interquartile range (IQR) and whiskers to the most extreme point within 1.5 × IQR. All tests are two-sided unless otherwise specified.
Extended Data Fig. 3 |. Microbial associations with CICB response are confirmed by whole metagenomic sequencing.
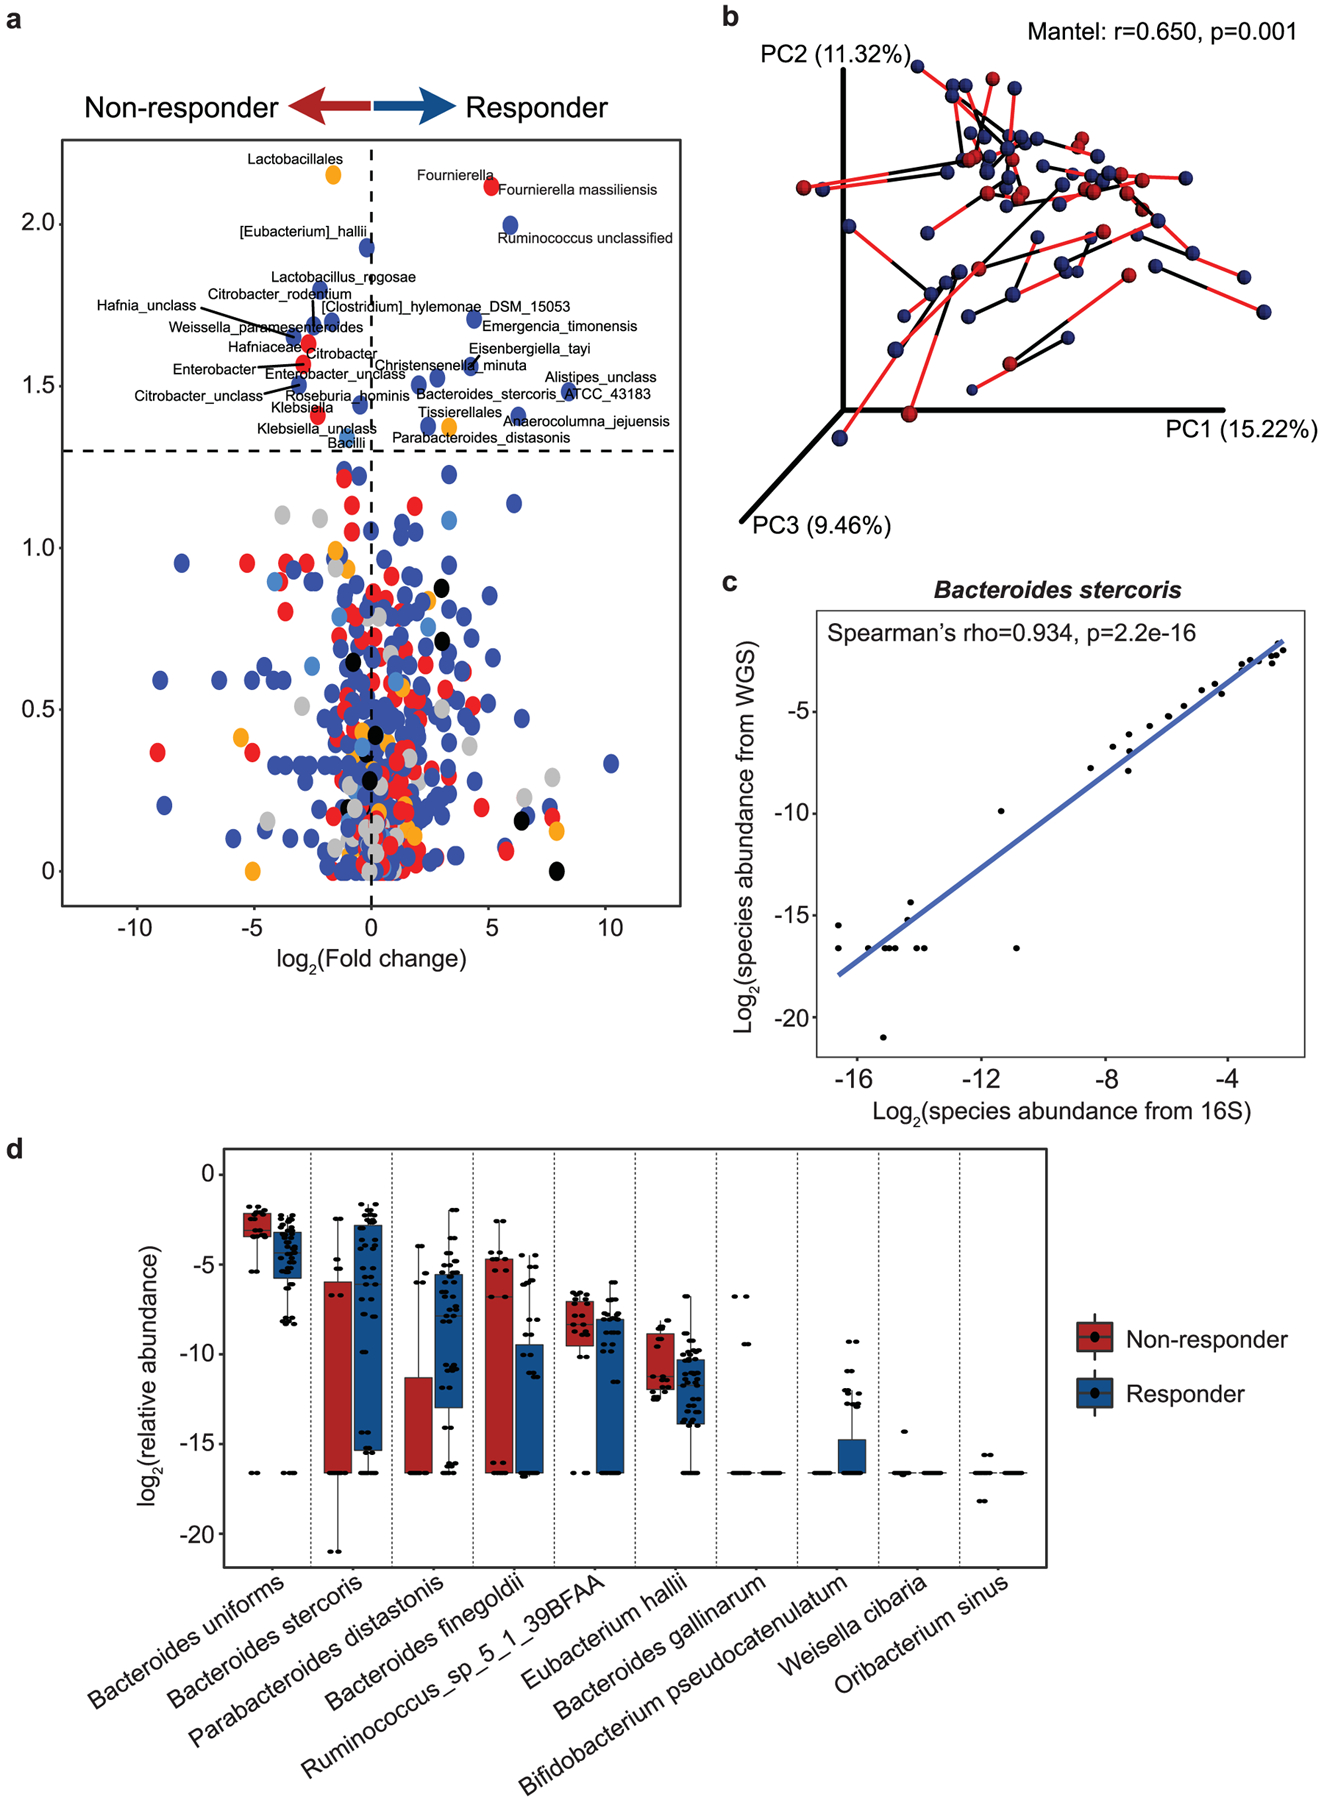
a, Volcano plot of pairwise comparisons of bacterial taxa (at all levels) identified from 16S sequencing (n = 40) dichotomized by response to CICB using Mann-Whitney tests applied to 1000 permutations of differential bacterial abundance. b, Procrustes analysis demonstrating high concordance between taxonomic identification using either 16S or WMS methods within the response cohort (Mantel: r=0.650, p = 0.001). c, A strong positive correlation was observed between abundance of Bacteroides stercoris quantified using 16S versus WMS (Spearman’s rho=0.934 p = 2.2e-16). d, Confirmation of bacterial candidate associations with response using WMS. Box plots present the median bar with the box bounding interquartile range (IQR) and whiskers to the most extreme point within 1.5 × IQR. All tests are two-sided unless otherwise specified.
Extended Data Fig. 4 |. Validation of microbial composition and response taxa across additional datasets.
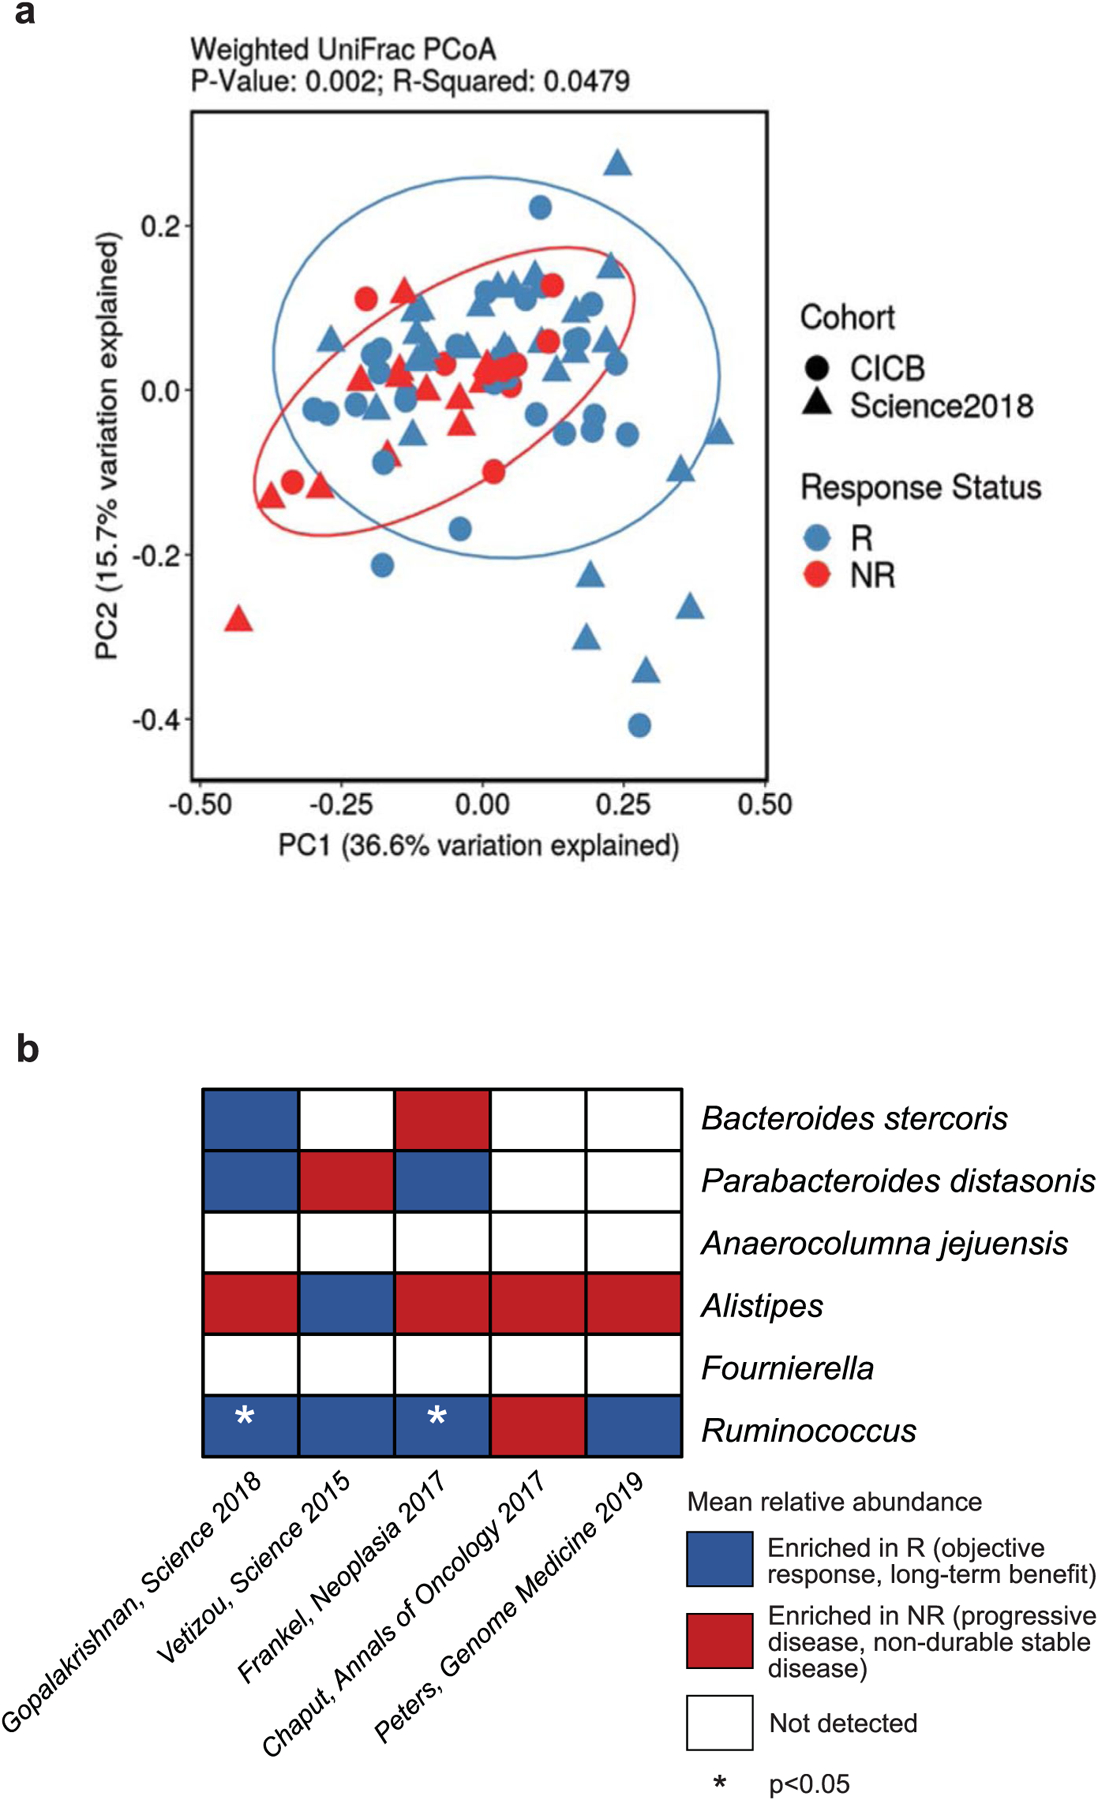
a, Ordination of microbial beta diversity contrasting compositional differences between responders (R, n = 59) and non-responders (NR, n = 24) across the pooled CICB and previously published anti-PD-1 monotherapy (Science 2018) cohorts (Weighted UniFrac, PERMANOVA two-sided p = 0.002). b, Abundance of key response-associated taxa identified in the CICB cohort were evaluated in re-processed microbiome data from several published cohorts, indicating taxa enriched in responders (blue), taxa enriched in non-responders (red), or not detected (white) in each cohort by two-sided Mann-Whitney test (Ruminococcus; Gopalakrishnan, Science 2018 one-sided p = 0.0240, Frankel, Neoplasia 2017 one-sided p = 0.0487).
Extended Data Fig. 5 |. Associations between prevalent bacterial taxa and tumor response in murine models.
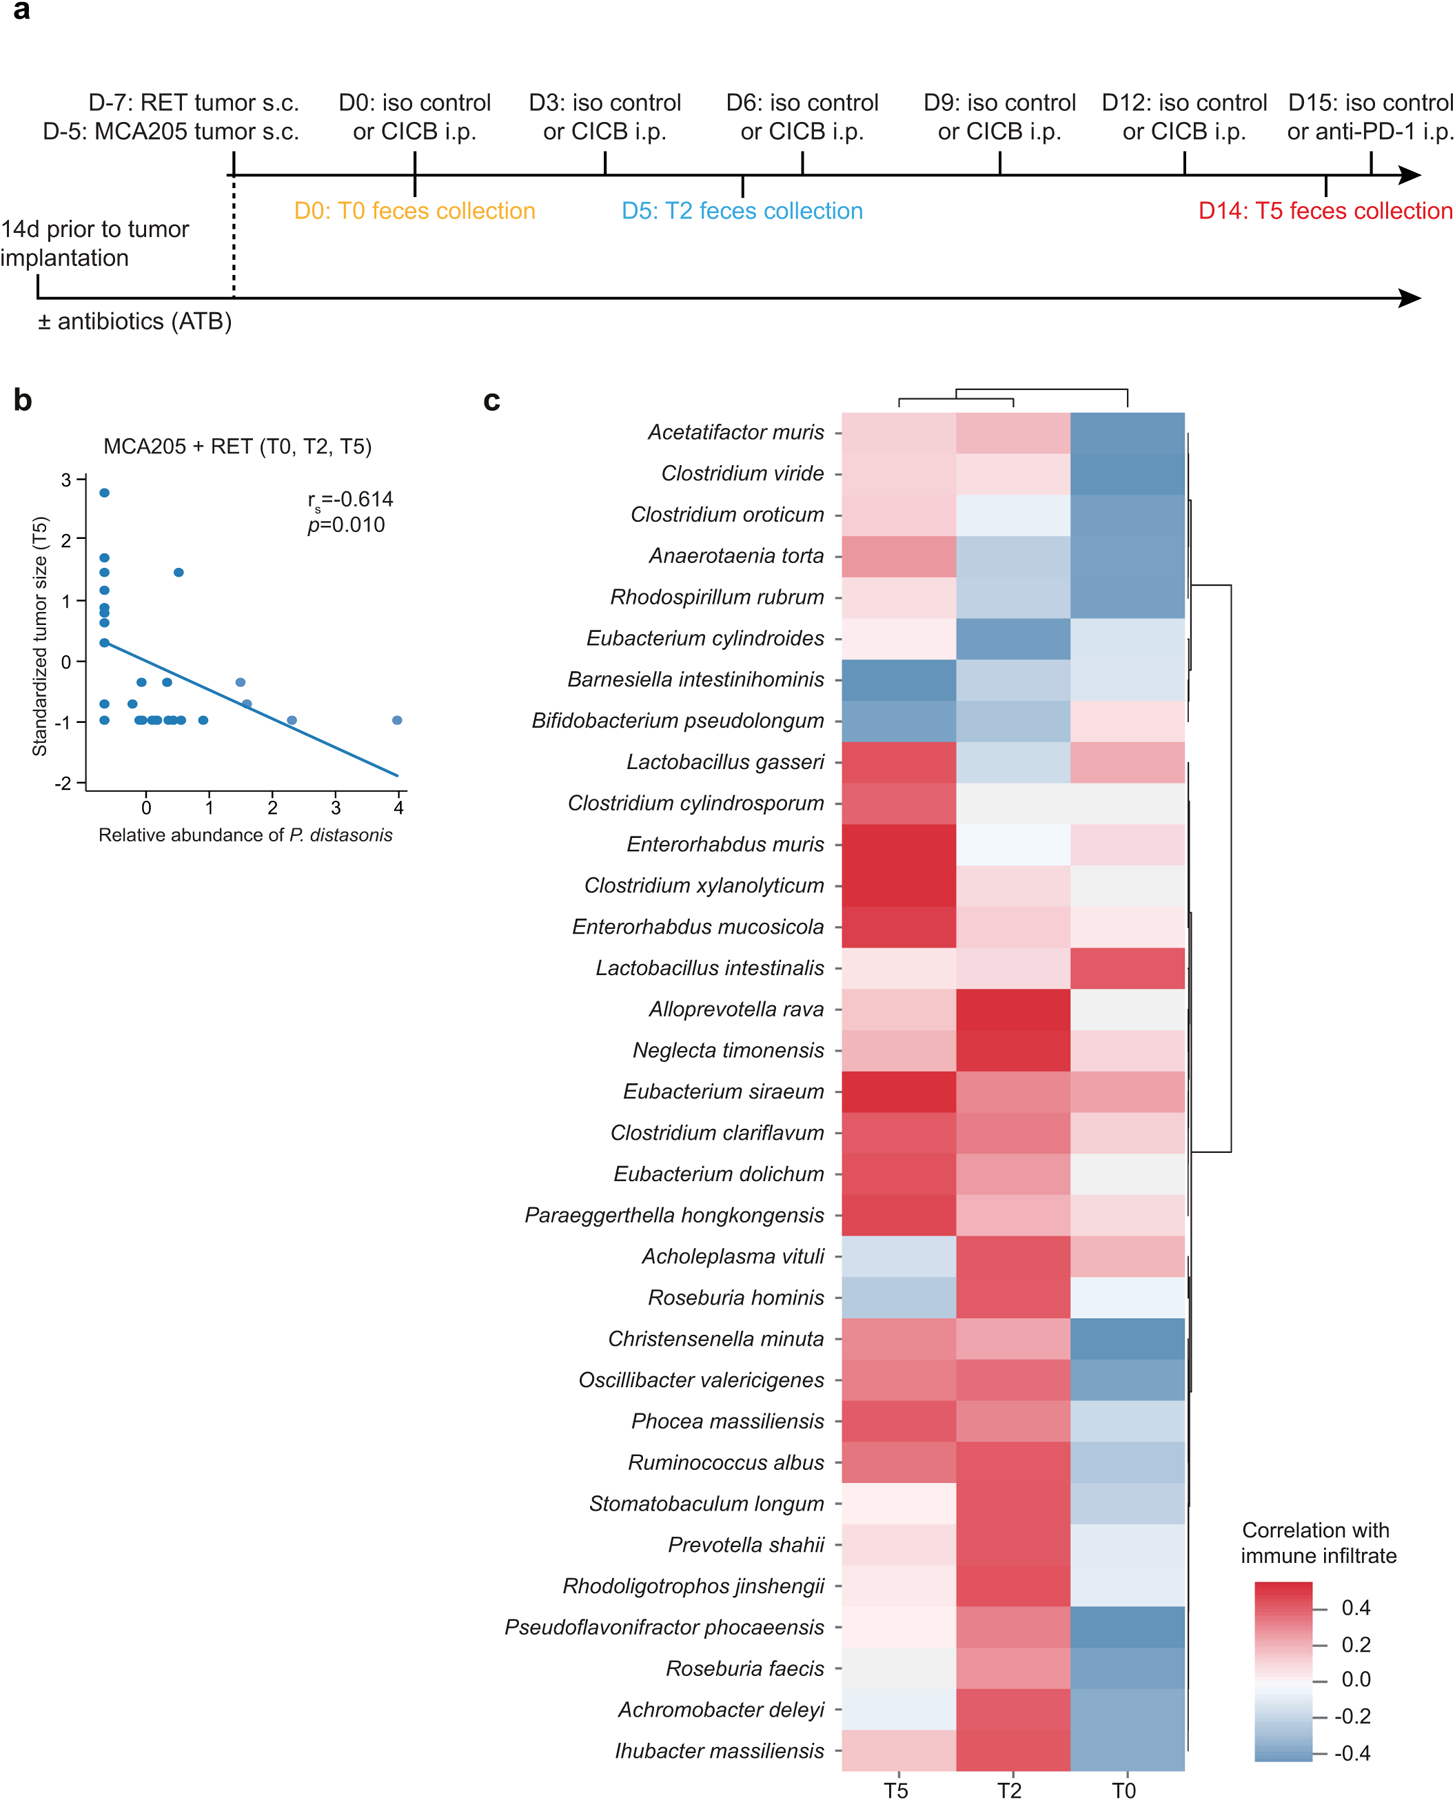
a, Experimental setting for murine studies shown in Figs. 2 and 3. Treatment of established transplantable tumors (MCA205 sarcoma or RET melanoma) by intraperitoneal (i.p.) administrations of CICB and feces collection at three time points for 16S rRNA gene sequencing. Feces collection time points: T0=before treatment initiation (Day 0), T2=48 hours after 2 treatments (Day 5), T5=48 hours after 5 treatments (Day 14). In studies utilizing antibiotic (ATB) treatment, ATB was commenced 14 days prior to tumor inoculation and continued throughout. b, Pearson correlation between the relative abundance of Parabacteroides distasonis (at T0, T2, and T5) and standardized tumor size at T5 in MCA205 and RET tumor-bearing mice (two-sided p = 0.010, r = −0.614). c, Heatmap of Spearman correlations between the most prevalent (>20%) bacterial species identified in mouse feces at different time points (T0, T2, T5) from RET tumor-bearing mice and colon inflammatory infiltrates. Data are derived from combined discovery and validation cohort animals. Red represents a positive correlation, while blue represents a negative correlation with colonic infiltrate score. Following FDR adjustment, no significant correlations were observed.
Extended Data Fig. 6 |. Microbial associations with immune-related toxicity are confirmed by whole metagenomic sequencing.
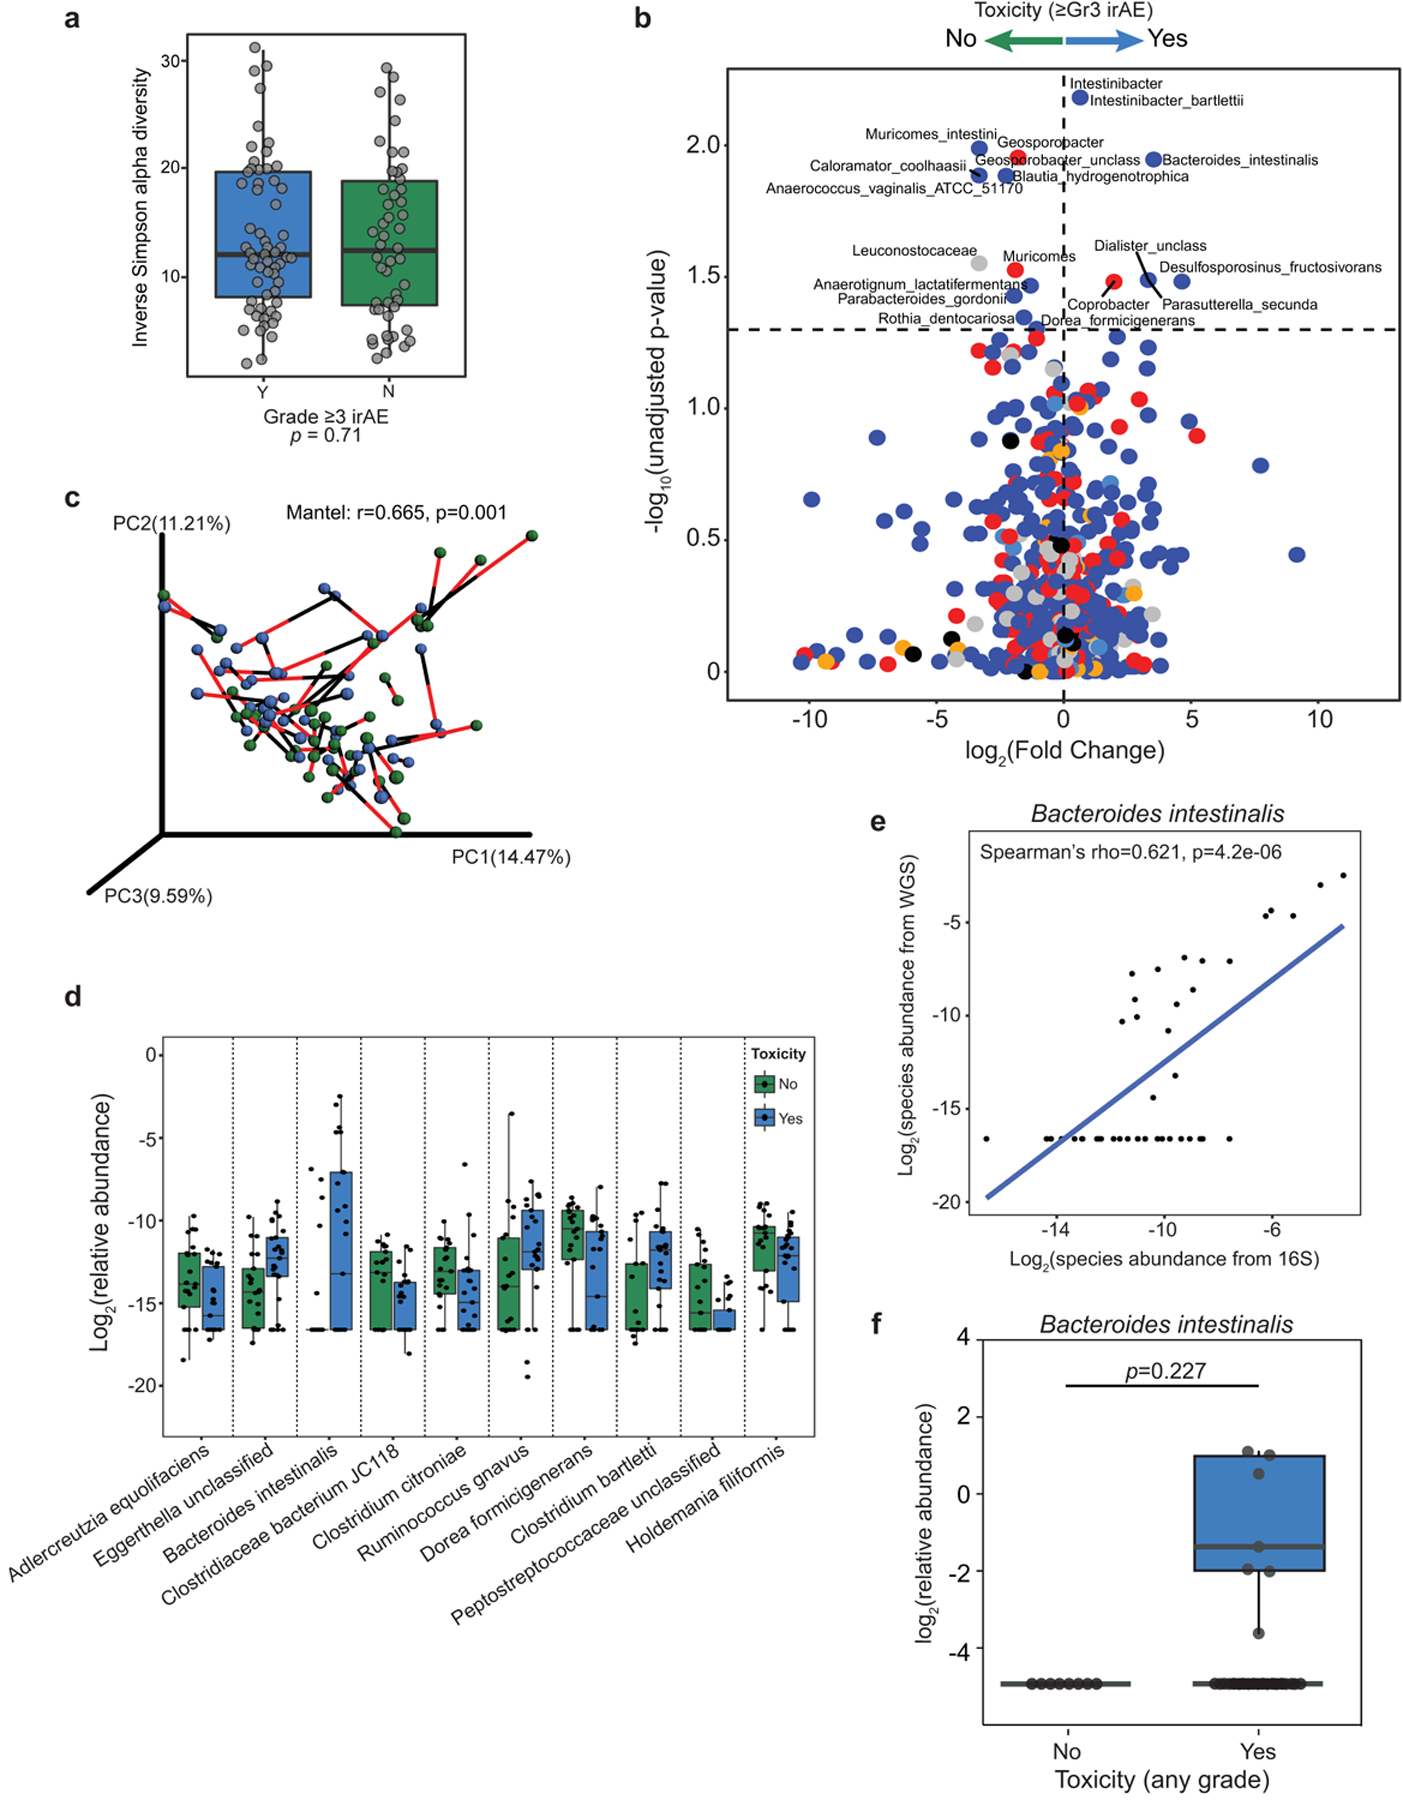
a, Inverse Simpson alpha diversity from 16S sequencing of baseline fecal microbiota in CICB-treated patients (n = 54) was not associated with subsequent development of high-grade immune-related adverse events (irAE). Mann-Whitney test (p = 0.71). b, Volcano plot of pairwise comparisons of bacterial taxa (at all levels) dichotomized by experience of high-grade (≥Grade 3) immune-related adverse events (n = 54 patients) using Mann-Whitney tests applied to 1000 permutations of differential bacterial abundance. Unadjusted p-values shown, adjusted values in supplemental tables 5 and 8. c, Procrustes analysis demonstrating high concordance between taxonomic identification using either 16S or WMS methods (Mantel: r=0.665, p = 0.001). d, Confirmation of bacterial candidate associations with toxicity using WMS (≥ Gr3 irAE: n = 25 Yes, n = 21 No). Significant associations existed for Bacteroides intestinalis (p = 0.032) and Dorea formicigenerans (p = 0.020) all other associations were non-significant. e, A strong positive correlation was observed between abundance of Bacteroides intestinalis quantified using 16S versus WMS (Spearman’s rho=0.62, p = 4.2e-6). f, Box-whisker plot of relative abundance of Bacteroides intestinalis in the combined McGill/University of Toronto cohort of melanoma patients treated with immune checkpoint blockade demonstrating identification of this species exclusively in patients developing irAE (≥Gr1 n = 37 Yes, n = 8 No; One-tailed Mann Whitney test p = 0.2269). Box plots present the median bar with the box bounding interquartile range (IQR) and whiskers to the most extreme point within 1.5 × IQR. All tests are two sided unless otherwise specified.
Extended Data Fig. 7 |. Immune markers of CICB toxicity.
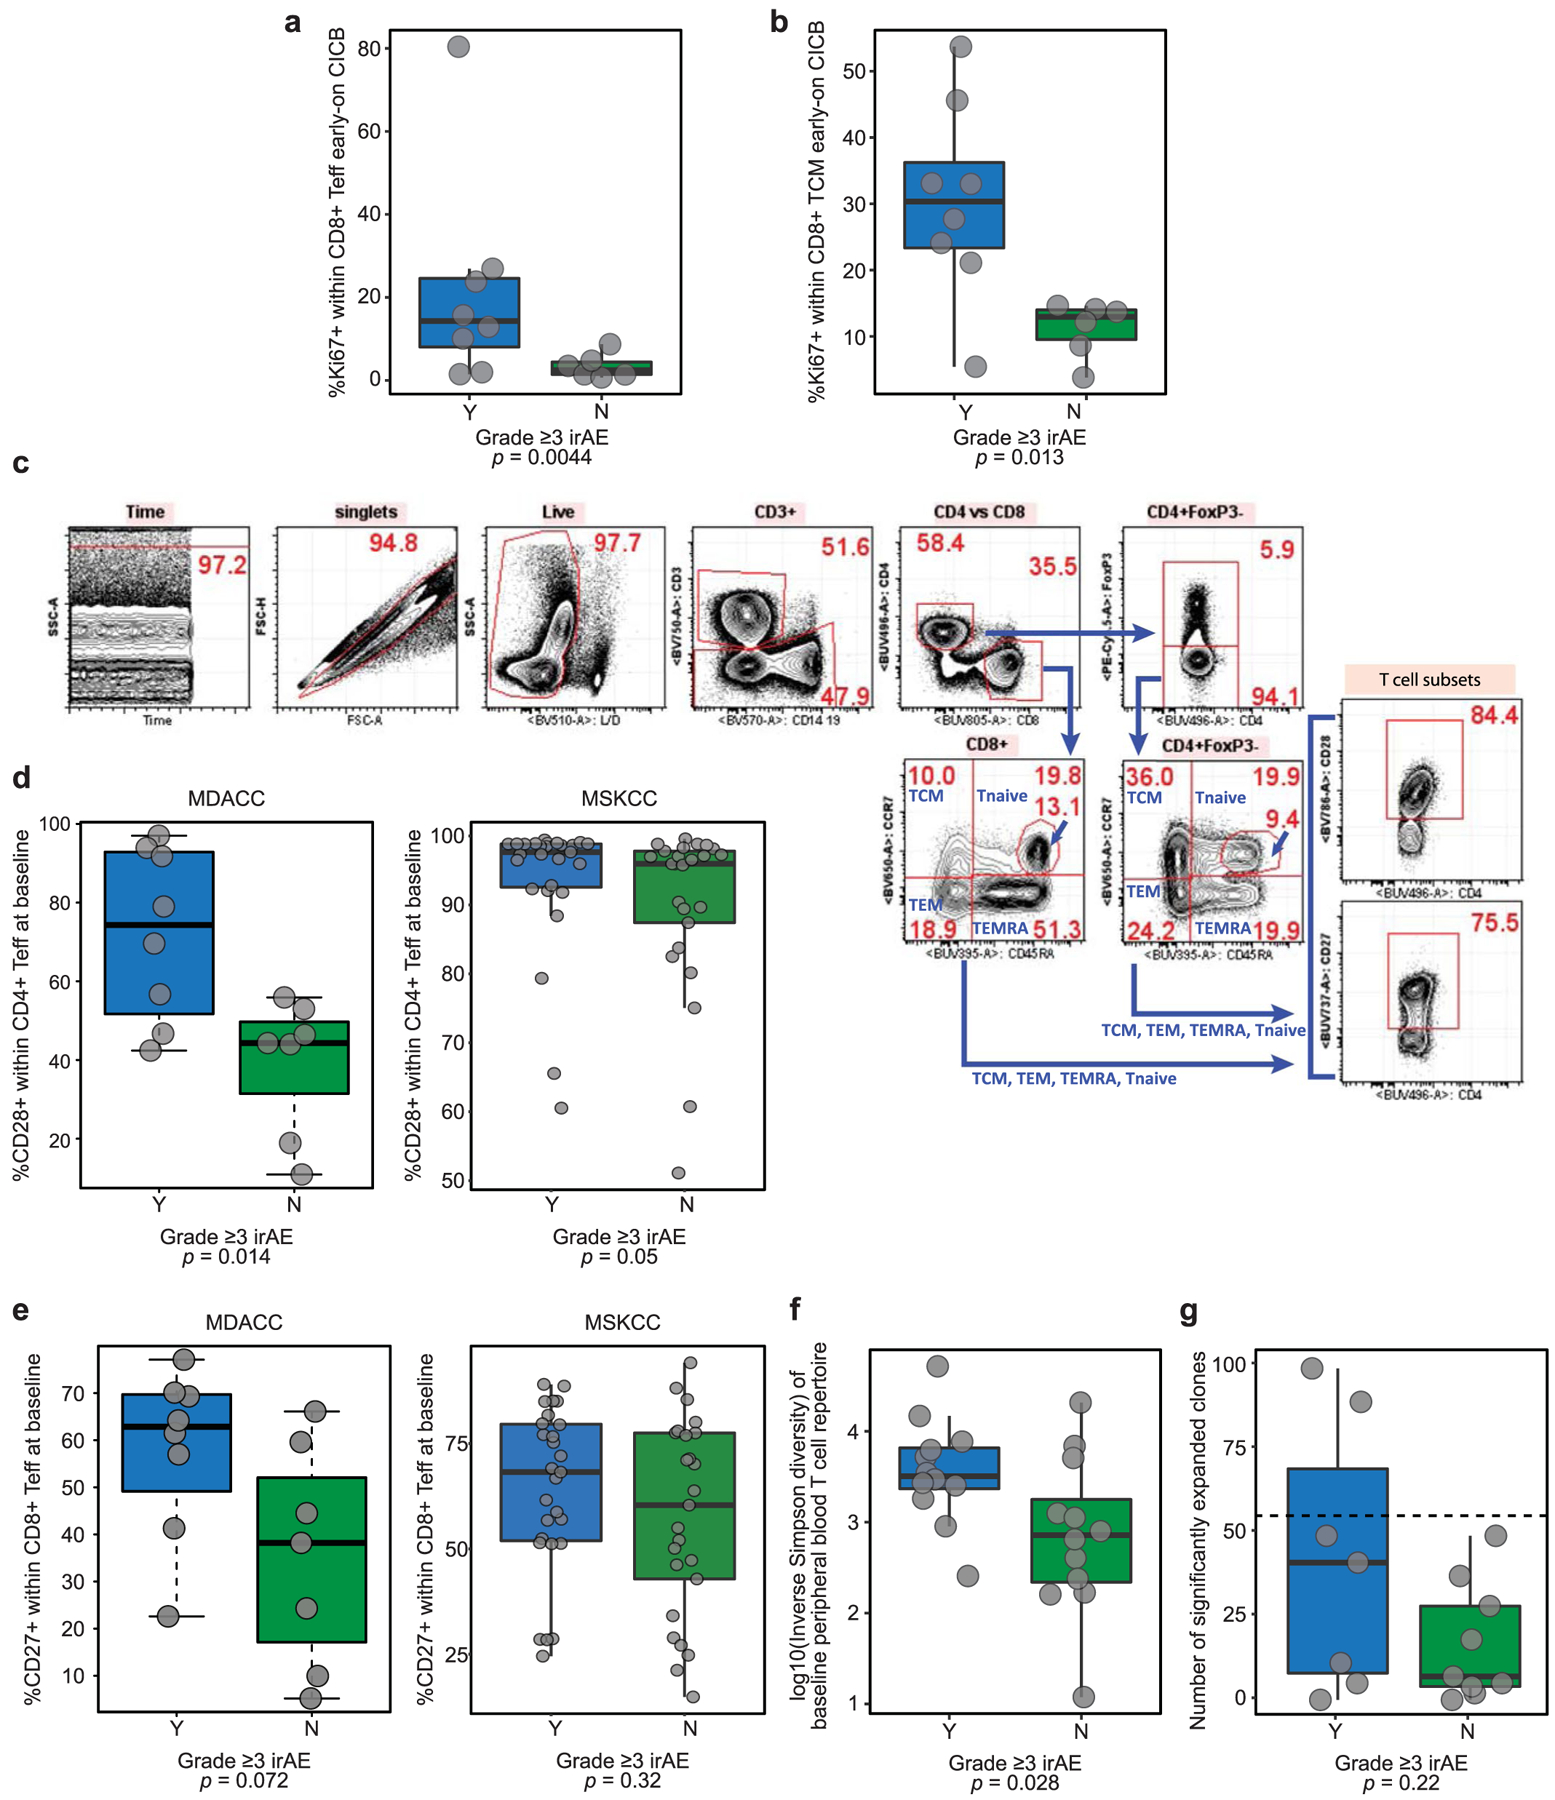
a, b, Comparison of Ki67+ cells within CD8+ T effectors (Teff; a) and T central memory (TCM; b) cells in early on-treatment blood samples between patients with available blood samples (n = 14) grouped according to high-grade irAE (Mann-Whitney test left panel p = 0.0044, right panel p = 0.013). c, Gating strategy for key CD4/8+ T cell populations. d, e, Percentage of CD28+ cells within CD4+ Teff (c) and CD27+ cells within CD8+ Teff (d) measured at baseline in this patient cohort (MDACC; left panels) and a separate cohort of patients treated with CICB at Memorial Sloan-Kettering Cancer Center (MSKCC; right panels). Data are grouped by experience of high-grade irAE (Mann-Whitney test (d) left panel p = 0.014, right panel p = 0.050 (e) left panel p = 0.072, right panel p = 0.32)). f, Boxplot depicting a higher diversity of the peripheral T cell repertoire as measured by TCR Vβ sequencing in patients experiencing high-grade irAE (n = 24, Mann-Whitney test; p = 0.028). g, Boxplot showing the number of significantly expanded T cell clones (pre- to on-treatment) detected by TCR sequencing of the peripheral blood immune repertoire, grouped by presence or absence of high-grade irAE (n = 16, Mann-Whitney test: p = 0.22). Box plots present the median bar with the box bounding interquartile range (IQR) and whiskers to the most extreme point within 1.5 × IQR. All tests are two sided unless otherwise specified.
Supplementary Material
Acknowledgements
This research was supported by generous philanthropic contributions to The University of Texas MD Anderson Cancer Center Moon Shots Program from the Lyda Hill Foundation and utilized platform assistance from the Cancer Genomics Laboratory and Immunotherapy Platform, from the Dr. Miriam and Sheldon G. Adelson Medical Research Foundation and the AIM at Melanoma Foundation. Additional support was provided to P.A.F. from the Cancer Prevention Research Institute of Texas and the Welch Foundation. M.A.D. is supported by the Dr. Miriam and Sheldon G. Adelson Medical Research Foundation, the AIM at Melanoma Foundation, the NIH/NCI (1 P50 CA221703–02 and 1U54CA224070–03), the American Cancer Society and the Melanoma Research Alliance, Cancer Fighters of Houston, the Anne and John Mendelsohn Chair for Cancer Research, and philanthropic contributions to the Melanoma Moon Shots Program of MD Anderson. M.C.A. is supported by a National Health and Medical Research Council of Australia CJ Martin Early Career Fellowship (#1148680). W.-S.C. was supported by a National Institutes of Health T32 Training Grant (T32CA163185). A.P.C. is supported by the CPRIT Research Training Program (RP170067), the Fulbright France Commission Franco-Americainé and the John J. Kopchick Foundation. A.R. is supported by the Kimberley Clark Foundation Award for Scientific Achievement provided by MD Anderson’s Odyssey Fellowship Program. P.-O.G. was supported by the Fonds de Recherche Québec–Santé’s (FRQS) Resident Physician Health Research Career Training Program (32667). M.G.W. was supported by National Institutes of Health (T32CA009599) and an MD Anderson Cancer Center support grant (P30 CA016672). M.A.P. received support from the MSK Cancer Center Support Grant/Core Grant (P30 CA008748). We acknowledge the assistance of the animal facility team at Gustave Roussy. L. Zitvogel is funded by grants from EU H2020 ONCOBIOME, Ligue contre le Cancer (équipe labelisée); Agence Nationale de la Recherche (ANR)—Projets blancs; ANR under the frame of E-Rare-2, the ERA-Net for Research on Rare Diseases; Association pour la recherche sur le cancer (ARC); Cancéropôle Ile-de-France; Chancellerie des universités de Paris (Legs Poix), Fondation de France; Fondation pour la Recherche Médicale (FRM); a donation by Elior; Fondation Carrefour; Institut National du Cancer (INCa); Inserm (HTE); ANR germanofrench; LabEx Immuno-Oncology; the French Ministry of Health PIA2, RHU Torino Lumière (ANR-16-RHUS-0008); the Swiss Bridge Foundation; the Seerave and Carrefour Foundation; the SIRIC Stratified Oncology Cell DNA Repair and Tumor Immune Elimination (SOCRATE). This work was supported by the French Government under the ‘Investissements d’avenir’ (Investments for the Future) program managed by the Agence Nationale de la Recherche (ANR, fr: National Agency for Research, Méditerranée Infection 10-IAHU-03; L. Zitvogel). M.K.C. is supported by an institutional grant (NIH P30 CA008748). L.D. is supported by ‘Parcours d’excellence en cancérologie—Fondation Philanthropia’. This work was supported by Région Provence Alpes Côte d’Azur and European funding FEDER PRIMI. R.C.P. was supported by a Strategic Innovation Grant from the Division of Medical Oncology, University of Toronto. R.C.P. was supported by a Strategic Innovation Grant from the Division of Medical Oncology, University of Toronto. J.A.W. is supported by the National Institutes of Health (1R01CA219896–01A1), the Melanoma Research Alliance (4022024), American Association for Cancer Research Stand Up To Cancer (SU2C-AACR-IRG-19–17) and the MD Anderson Melanoma Moonshot Program. The funders had no role in study design, data collection and analysis, decision to publish or preparation of the manuscript.
Competing interests
M.C.A. reports advisory board participation and honoraria from Merck Sharp and Dohme, outside the submitted work. V.G. and Z.A.C. are currently employees of AstraZeneca. R.N.A. reports research funding from Bristol-Myers Squibb (BMS), Merck and Genentech, all outside the submitted work. R.C.P. reports honoraria EMD Serono, Merck, Norvartis and Pfizer as well as consulting for Merck, BMS, Novartis, Pfizer and AstraZeneca, and research funding from Merck and Novartis outside the submitted work. H.A.T. reports personal fees from Novartis, grants from Merck and Celgene and grants and personal fees from BMS and Genentech, all outside the submitted work. M.A.D. has been a consultant to Roche/Genentech, Array, Novartis, BMS, GlaxoSmithKline (GSK), Sanofi-Aventis, Vaccinex and Apexigen, and he has been the PI of research grants to UT MD Anderson by Roche/Genentech, GSK, Sanofi-Aventis, Merck, Myriad and Oncothyreon. W.-J.H. reports research grants from Merck, BMS, MedImmune and GSK and has served on an advisory board for Merck, all outside the submitted work. J.E.G. reports advisory board participation with Merck, Regeneron, BMS, Novartis and Syndax. A.J.L. reports personal fees from BMS, Novartis, Genentech/Roche and Merck; personal fees and non-financial support from ArcherDX and Beta-Cat; grants and non-financial support from Medimmune/AstraZeneca and Sanofi; grants, personal fees and non-financial support from Janssen, all outside the submitted work. M.T.T. reports personal fees from Myriad Genetics, Seattle Genetics and Novartis, all outside the submitted work. A.P.C. reports advisory roles and/or stock ownership for Immunai and Vastbiome. M.A.P. reports honoraria from BMS and Merck, consulting fees from BMS, Merck, Array BioPharma, Novartis, Incyte, NewLink Genetics, Aduro, Eisai and Pfizer and institutional support from RGenix, Infinity, BMS, Merck, Array BioPharma, Novartis and AstraZeneca. S.P.P. reports institutional support for a clinical trial from InxMed. J.L.M. reports honoraria from Roche, BMS and Merck. R.R.J. has consulted for Karius, Merck, Microbiome DX and Prolacta, and is on the scientific advisory boards of Kaleido, LISCure, Maat Pharma and Seres, and has received patent royalties licensed to Seres. P.S. reports consulting, advisory roles and/or stocks/ownership for Achelois, Adaptive Biotechnologies, Apricity Health, BioAlta, BioNTech, Codiak Biosciences, Constellation, Dragonfly Therapeutics, Forty-Seven Inc., Hummingbird, ImaginAb, Infinity Pharma, Jounce Therapeutics, Lave Therapeutics, Lytix Biopharma, Marker Therapeutics, Oncolytics, Phenomics and Polaris, and owns a patent licensed to Jounce Therapeutics. J.P.A. reports consulting, advisory roles and/or stocks/ownership for Achelois, Adaptive Biotechnologies, Apricity Health, BioAlta, BioNTech, Codiak Biosciences, Constellation, Dragonfly Therapeutics, Forty-Seven Inc., Hummingbird, ImaginAb, Jounce Therapeutics, Lave Therapeutics, Lytix Biopharma, Marker Therapeutics, Phenomics and Polaris, and owns a patent licensed to Jounce Therapeutics. B.R. reports advisory board membership for Vedanta and research funding from Vedanta, Davoltera and Kaleido. V.G., C.N.S., A.R. and J.A.W. are co-inventors on US patent PCT/US17/53,717, relating to the microbiome. J.A.W., V.G., M.C.A., L. Zitvogel and V.I. are co-inventors on a provisional US patent (WO2020106983A1) relating to the microbiome, relevant to the current work. L. Zitvogel is the main founder of EverImmune, a biotech company devoted to the use of commensal bacteria for the treatment of cancers, is on the board of administrators of Transgene and in the scientific advisory board of EpiVax, Lytix Biopharma, and has received research contracts from Kaleido, BMS, Incyte, Transgene, MERUS and GSK. J.A.W. reports speaker fees from Imedex, Dava Oncology, Omniprex, Illumina, Gilead, MedImmune and BMS; consultant/advisor roles or advisory board membership for Roche-Genentech, Novartis, AstraZeneca, GSK, BMS, Merck/MSD, Biothera Pharma and Microbiome DX; and receives clinical trial support from GSK, Roche-Genentech, BMS and Novartis, all outside the current work. The remaining authors declare no competing interests.
Footnotes
Online content
Any methods, additional references, Nature Research reporting summaries, source data, extended data, supplementary information, acknowledgements, peer review information; details of author contributions and competing interests; and statements of data and code availability are available at https://doi.org/10.1038/s41591-021-01406-6.
Reporting Summary. Further information on research design is available in the Nature Research Reporting Summary linked to this article.
Code availability
No unique software or computational code was created for this study. All tumor growth curves were analyzed using software developed in G. Kroemer’s laboratory and information about statistical analyses is available at https://kroemerlab.shinyapps.io/TumGrowth/. Code detailing implementation of established tools/pipelines as described in detail in the Methods is available upon request from the corresponding author.
Extended data is available for this paper at https://doi.org/10.1038/s41591-021-01406-6.
Supplementary information The online version contains supplementary material available at https://doi.org/10.1038/s41591-021-01406-6.
Data availability
WES data from this study are available from the European Genome-Phenome Archive (EGA) under study accession no. EGAS00001003857. Human fecal 16S rRNA gene sequencing and WMS data are available from the EGA under study accession no. EGAS00001004885. Murine fecal 16S rRNA gene sequence reads from this study have been submitted to the NCBI under the Bioproject ID PRJNA484225.
References
- 1.Larkin J et al. Combined nivolumab and ipilimumab or monotherapy in untreated melanoma. N. Engl. J. Med 373, 23–34 (2015). [DOI] [PMC free article] [PubMed] [Google Scholar]
- 2.Hammers HJ et al. Safety and efficacy of nivolumab in combination with ipilimumab in metastatic renal cell carcinoma: the CheckMate 016 Study. J. Clin. Oncol 35, 3851–3858 (2017). [DOI] [PMC free article] [PubMed] [Google Scholar]
- 3.Sznol M et al. Pooled analysis safety profile of nivolumab and ipilimumab combination therapy in patients with advanced melanoma. J. Clin. Oncol 35, 3815–3822 (2017). [DOI] [PubMed] [Google Scholar]
- 4.Attia P et al. Autoimmunity correlates with tumor regression in patients with metastatic melanoma treated with anti-cytotoxic T-lymphocyte antigen-4. J. Clin. Oncol 23, 6043–6053 (2005). [DOI] [PMC free article] [PubMed] [Google Scholar]
- 5.Das S & Johnson DB Immune-related adverse events and anti-tumor efficacy of immune checkpoint inhibitors. J. Immunother. Cancer 7, 306 (2019). [DOI] [PMC free article] [PubMed] [Google Scholar]
- 6.Robert C et al. Nivolumab in previously untreated melanoma without BRAF mutation. N. Engl. J. Med 372, 320–330 (2015). [DOI] [PubMed] [Google Scholar]
- 7.Robert C et al. Pembrolizumab versus ipilimumab in advanced melanoma. N. Engl. J. Med 372, 2521–2532 (2015). [DOI] [PubMed] [Google Scholar]
- 8.Wolchok JD et al. Nivolumab plus ipilimumab in advanced melanoma. N. Engl. J. Med 369, 122–133 (2013). [DOI] [PMC free article] [PubMed] [Google Scholar]
- 9.Postow MA et al. Nivolumab and ipilimumab versus ipilimumab in untreated melanoma. N. Engl. J. Med 372, 2006–2017 (2015). [DOI] [PMC free article] [PubMed] [Google Scholar]
- 10.D’Angelo SP et al. Efficacy and safety of nivolumab alone or in combination with ipilimumab in patients with mucosal melanoma: a pooled analysis. J. Clin. Oncol 35, 226–235 (2017). [DOI] [PMC free article] [PubMed] [Google Scholar]
- 11.Hellmann MD et al. Nivolumab plus ipilimumab in lung cancer with a high tumor mutational burden. N. Engl. J. Med 378, 2093–2104 (2018). [DOI] [PMC free article] [PubMed] [Google Scholar]
- 12.Hugo W et al. Genomic and transcriptomic features of response to anti-PD-1 therapy in metastatic melanoma. Cell 165, 35–44 (2016). [DOI] [PMC free article] [PubMed] [Google Scholar]
- 13.Snyder A et al. Genetic basis for clinical response to CTLA-4 blockade in melanoma. N. Engl. J. Med 371, 2189–2199 (2014). [DOI] [PMC free article] [PubMed] [Google Scholar]
- 14.Van Allen EM et al. Genomic correlates of response to CTLA-4 blockade in metastatic melanoma. Science 350, 207–211 (2015). [DOI] [PMC free article] [PubMed] [Google Scholar]
- 15.Roh W et al. Integrated molecular analysis of tumor biopsies on sequential CTLA-4 and PD-1 blockade reveals markers of response and resistance. Sci. Transl. Med 9, eaah3560 (2017). [DOI] [PMC free article] [PubMed] [Google Scholar]
- 16.Ekmekcioglu S et al. Inflammatory marker testing identifies CD74 expression in melanoma tumor cells, and its expression associates with favorable survival for stage III melanoma. Clin. Cancer Res 22, 3016–3024 (2016). [DOI] [PMC free article] [PubMed] [Google Scholar]
- 17.Peng W et al. Loss of PTEN promotes resistance to T cell-mediated immunotherapy. Cancer Discov. 6, 202–216 (2016). [DOI] [PMC free article] [PubMed] [Google Scholar]
- 18.Tanese K et al. Cell surface CD74-MIF interactions drive melanoma survival in response to interferon-γ. J. Invest. Dermatol 135, 2775–2784 (2015). [DOI] [PMC free article] [PubMed] [Google Scholar]
- 19.Zaretsky JM et al. Mutations associated with acquired resistance to PD-1 blockade in melanoma. N. Engl. J. Med 375, 819–829 (2016). [DOI] [PMC free article] [PubMed] [Google Scholar]
- 20.Tumeh PC et al. PD-1 blockade induces responses by inhibiting adaptive immune resistance. Nature 515, 568–571 (2014). [DOI] [PMC free article] [PubMed] [Google Scholar]
- 21.Gopalakrishnan V et al. Gut microbiome modulates response to anti-PD-1 immunotherapy in melanoma patients. Science 359, 97–103 (2018). [DOI] [PMC free article] [PubMed] [Google Scholar]
- 22.Matson V et al. The commensal microbiome is associated with anti-PD-1 efficacy in metastatic melanoma patients. Science 359, 104–108 (2018). [DOI] [PMC free article] [PubMed] [Google Scholar]
- 23.Routy B et al. Gut microbiome influences efficacy of PD-1-based immunotherapy against epithelial tumors. Science 359, 91–97 (2018). [DOI] [PubMed] [Google Scholar]
- 24.Vetizou M et al. Anticancer immunotherapy by CTLA-4 blockade relies on the gut microbiota. Science 350, 1079–1084 (2015). [DOI] [PMC free article] [PubMed] [Google Scholar]
- 25.Chaput N et al. Baseline gut microbiota predicts clinical response and colitis in metastatic melanoma patients treated with ipilimumab. Ann. Oncol 28, 1368–1379 (2017). [DOI] [PubMed] [Google Scholar]
- 26.Frankel AE et al. Metagenomic shotgun sequencing and unbiased metabolomic profiling identify specific human gut microbiota and metabolites associated with immune checkpoint therapy efficacy in melanoma patients. Neoplasia 19, 848–855 (2017). [DOI] [PMC free article] [PubMed] [Google Scholar]
- 27.Peters BA et al. Relating the gut metagenome and metatranscriptome to immunotherapy responses in melanoma patients. Genome Med. 11, 61 (2019). [DOI] [PMC free article] [PubMed] [Google Scholar]
- 28.Seo SU et al. Distinct commensals induce interleukin-1β via NLRP3 inflammasome in inflammatory monocytes to promote intestinal inflammation in response to injury. Immunity 42, 744–755 (2015). [DOI] [PMC free article] [PubMed] [Google Scholar]
- 29.Moro-Garcia MA, Alonso-Arias R & Lopez-Larrea C Molecular mechanisms involved in the aging of the T-cell immune response. Curr. Genomics 13, 589–602 (2012). [DOI] [PMC free article] [PubMed] [Google Scholar]
- 30.Chen Y, Gorelik GJ, Strickland FM & Richardson BC Decreased ERK and JNK signaling contribute to gene overexpression in ‘senescent’ CD4+CD28− T cells through epigenetic mechanisms. J. Leukoc. Biol 87, 137–145 (2010). [DOI] [PMC free article] [PubMed] [Google Scholar]
- 31.Oh DY et al. Immune toxicities elicted by CTLA-4 blockade in cancer patients are associated with early diversification of the T-cell repertoire. Cancer Res. 77, 1322–1330 (2017). [DOI] [PMC free article] [PubMed] [Google Scholar]
- 32.Subudhi SK et al. Clonal expansion of CD8 T cells in the systemic circulation precedes development of ipilimumab-induced toxicities. Proc. Natl Acad. Sci. USA 113, 11919–11924 (2016). [DOI] [PMC free article] [PubMed] [Google Scholar]
- 33.Routy B et al. The gut microbiota influences anticancer immunosurveillance and general health. Nat. Rev. Clin. Oncol 15, 382–396 (2018). [DOI] [PubMed] [Google Scholar]
- 34.Perez-Ruiz E et al. Prophylactic TNF blockade uncouples efficacy and toxicity in dual CTLA-4 and PD-1 immunotherapy. Nature 569, 428–432 (2019). [DOI] [PubMed] [Google Scholar]
- 35.Eisenhauer EA et al. New response evaluation criteria in solid tumours: revised RECIST guideline (version 1.1). Eur. J. Cancer 45, 228–247 (2009). [DOI] [PubMed] [Google Scholar]
- 36.Bai Y, Ni M, Cooper B, Wei Y & Fury W Inference of high resolution HLA types using genome-wide RNA or DNA sequencing reads. BMC Genomics 15, 325 (2014). [DOI] [PMC free article] [PubMed] [Google Scholar]
- 37.Nielsen M et al. NetMHCpan, a method for quantitative predictions of peptide binding to any HLA-A and -B locus protein of known sequence. PLoS ONE 2, e796 (2007). [DOI] [PMC free article] [PubMed] [Google Scholar]
- 38.Hoof I et al. NetMHCpan, a method for MHC class I binding prediction beyond humans. Immunogenetics 61, 1–13 (2009). [DOI] [PMC free article] [PubMed] [Google Scholar]
- 39.Chen PL et al. Analysis of immune signatures in longitudinal tumor samples yields insight into biomarkers of response and mechanisms of resistance to immune checkpoint blockade. Cancer Discov. 6, 827–837 (2016). [DOI] [PMC free article] [PubMed] [Google Scholar]
- 40.The Human Microbiome Project Consortium. Structure, function and diversity of the healthy human microbiome. Nature 486, 207–214 (2012). [DOI] [PMC free article] [PubMed] [Google Scholar]
- 41.The Human Microbiome Project Consortium. A framework for human microbiome research. Nature 486, 215–221 (2012). [DOI] [PMC free article] [PubMed] [Google Scholar]
- 42.Rognes T, Flouri T, Nichols B, Quince C & Mahe F VSEARCH: a versatile open source tool for metagenomics. PeerJ 4, e2584 (2016). [DOI] [PMC free article] [PubMed] [Google Scholar]
- 43.Edgar RC UPARSE: highly accurate OTU sequences from microbial amplicon reads. Nat. Methods 10, 996–998 (2013). [DOI] [PubMed] [Google Scholar]
- 44.Edgar RC Search and clustering orders of magnitude faster than BLAST. Bioinformatics 26, 2460–2461 (2010). [DOI] [PubMed] [Google Scholar]
- 45.Caporaso JG et al. QIIME allows analysis of high-throughput community sequencing data. Nat. Methods 7, 335–336 (2010). [DOI] [PMC free article] [PubMed] [Google Scholar]
- 46.Caporaso JG et al. PyNAST: a flexible tool for aligning sequences to a template alignment. Bioinformatics 26, 266–267 (2010). [DOI] [PMC free article] [PubMed] [Google Scholar]
- 47.Lozupone C & Knight R UniFrac: a new phylogenetic method for comparing microbial communities. Appl. Environ. Microbiol 71, 8228–8235 (2005). [DOI] [PMC free article] [PubMed] [Google Scholar]
- 48.Beghini F et al. Integrating taxonomic, functional, and strain-level profiling of diverse microbial communities with bioBakery 3. eLife 10, e65088 (2021). [DOI] [PMC free article] [PubMed] [Google Scholar]
- 49.Segata N et al. Metagenomic microbial community profiling using unique clade-specific marker genes. Nat. Methods 9, 811–814 (2012). [DOI] [PMC free article] [PubMed] [Google Scholar]
- 50.Segata N et al. Metagenomic biomarker discovery and explanation. Genome Biol. 12, R60 (2011). [DOI] [PMC free article] [PubMed] [Google Scholar]
- 51.Dridi B, Henry M, El Khechine A, Raoult D & Drancourt M High prevalence of Methanobrevibacter smithii and Methanosphaera stadtmanae detected in the human gut using an improved DNA detection protocol. PLoS ONE 4, e7063 (2009). [DOI] [PMC free article] [PubMed] [Google Scholar]
- 52.Angelakis E et al. Glycans affect DNA extraction and induce substantial differences in gut metagenomic studies. Sci. Rep 6, 26276 (2016). [DOI] [PMC free article] [PubMed] [Google Scholar]
- 53.Million M et al. Increased gut redox and depletion of anaerobic and methanogenic prokaryotes in severe acute malnutrition. Sci. Rep 6, 26051 (2016). [DOI] [PMC free article] [PubMed] [Google Scholar] [Retracted]
- 54.Morgan XC & Huttenhower C Chapter 12: human microbiome analysis. PLoS Comput. Biol 8, e1002808 (2012). [DOI] [PMC free article] [PubMed] [Google Scholar]
- 55.Furet JP et al. Comparative assessment of human and farm animal faecal microbiota using real-time quantitative PCR. FEMS Microbiol. Ecol 68, 351–362 (2009). [DOI] [PubMed] [Google Scholar]
- 56.Suzuki MT, Taylor LT & DeLong EF Quantitative analysis of small-subunit rRNA genes in mixed microbial populations via 5′-nuclease assays. Appl. Environ. Microbiol 66, 4605–4614 (2000). [DOI] [PMC free article] [PubMed] [Google Scholar]
- 57.Odamaki T et al. Distribution of different species of the Bacteroides fragilis group in individuals with Japanese cedar pollinosis. Appl. Environ. Microbiol 74, 6814–6817 (2008). [DOI] [PMC free article] [PubMed] [Google Scholar]
- 58.Tong J, Liu C, Summanen P, Xu H & Finegold SM Application of quantitative real-time PCR for rapid identification of Bacteroides fragilis group and related organisms in human wound samples. Anaerobe 17, 64–68 (2011). [DOI] [PubMed] [Google Scholar]
- 59.Therneau TM & Grambsch PM Modeling Survival Data: Extending the Cox Model (Springer, 2000). [Google Scholar]
- 60.Enot DP, Vacchelli E, Jacquelot N, Zitvogel L & Kroemer G TumGrowth: an open-access web tool for the statistical analysis of tumor growth curves. Oncoimmunology 7, e1462431 (2018). [DOI] [PMC free article] [PubMed] [Google Scholar]
Associated Data
This section collects any data citations, data availability statements, or supplementary materials included in this article.
Supplementary Materials
Data Availability Statement
WES data from this study are available from the European Genome-Phenome Archive (EGA) under study accession no. EGAS00001003857. Human fecal 16S rRNA gene sequencing and WMS data are available from the EGA under study accession no. EGAS00001004885. Murine fecal 16S rRNA gene sequence reads from this study have been submitted to the NCBI under the Bioproject ID PRJNA484225.