The authors regret that two errors appeared in the published manuscript. First, the printed equation for , the ratio of 5hmC to C, was missing a variable and should have read:
where is the measured partial concentration of labeled 5hmC fragments, is the total DNA concentration provided in the measurement, is the biotin labeling yield, is the mean fragment length, and is the fractional cytosine content of the DNA, which should be taken as 0.2 based on updated G + C content of human genomic DNA.1
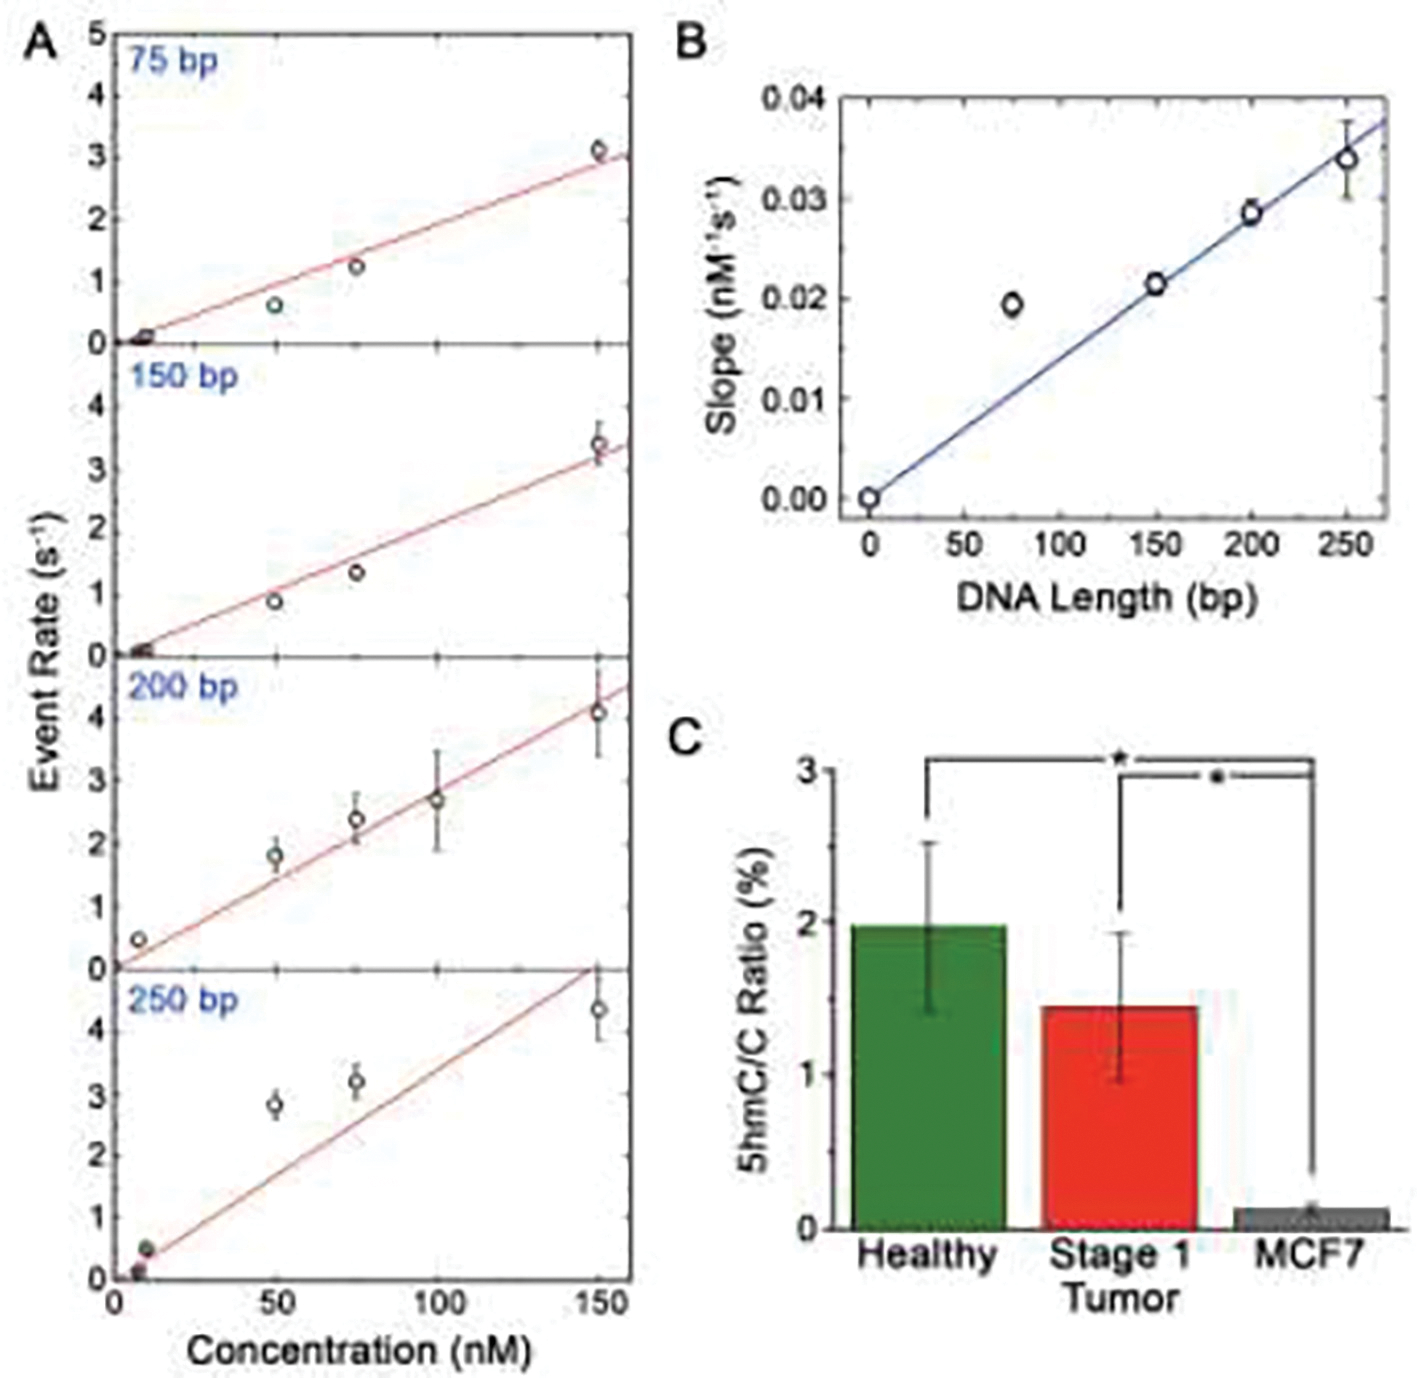
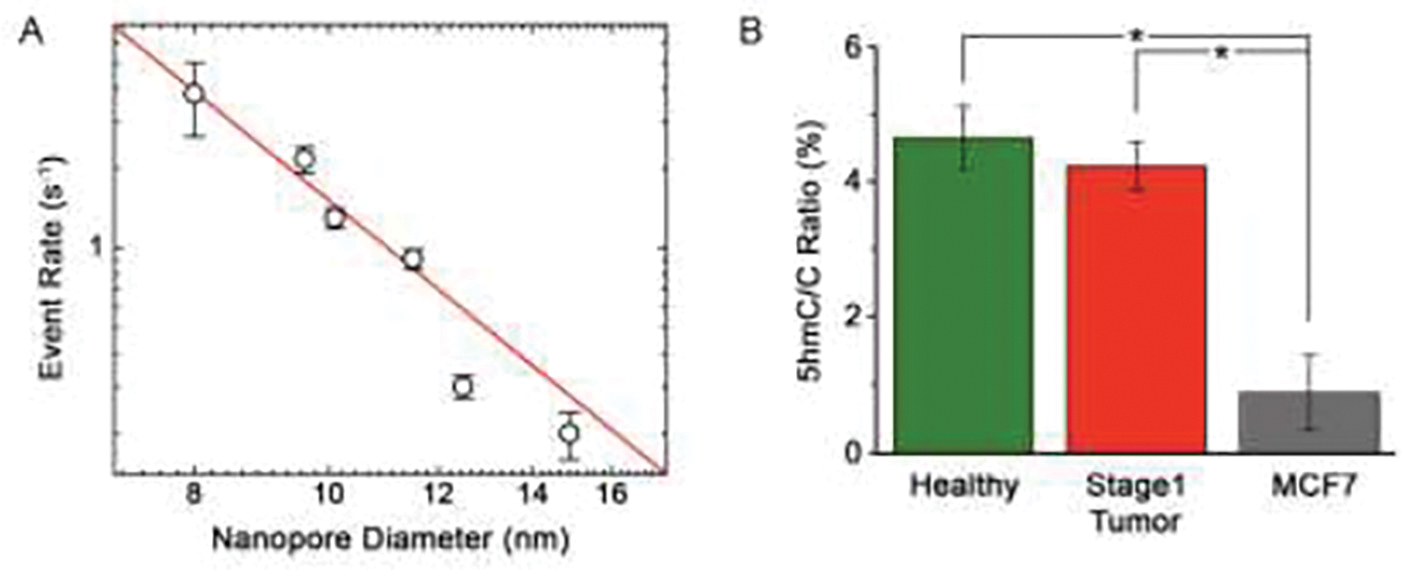
Second, due to a spreadsheet error, the values for R shown in Fig. 4C and Fig. 5B were miscalculated. Corrected figures are provided below. While the quantitative values of were incorrect in the published figures, the central conclusion drawn from the comparison between healthy, stage 1 tumor, and MCF7 genomic DNA – that alterations in 5hmC content are not observed for early-stage breast cancer – is unaffected.
Fig. 4.

(A) SS-nanopore event rates (400 mV applied voltage) as a function of concentration for monobiotinylated dsDNA constructs of different length (75, 150, 200, and 250 bp) bound to MS. Red lines are linear fits to each data set. (B) Dependence of the slopes of the fits in (A) as a function of construct length. Blue line is a linear fit to the data. (C) 5hmC:C ratio for genomic DNA isolated from healthy breast tissue, stage 1 breast cancer tissue, and MCF7 cells taking into account the length-dependent calibration from (B). * p < 0.05.
Fig. 5.

(A) Event rate for a 100 nM concentration of 60 bp dsDNA bound to MS measured at 400 mV through a range of SS-nanopore diameters. The red line is an exponential fit to the data (see text). (B) 5hmC:C ratio R corrected for device-to-device variation in pore diameter and normalized to 9.0 nm. * p < 0.001.
The authors would like to apologise for any inconvenience caused.
Correct Fig. 4.
Correct Fig. 5.
References
- 1..Piovesan A, et al. On the length, weight and GC content of the human genome. BMC Res Notes. 2019;12:106. [DOI] [PMC free article] [PubMed] [Google Scholar]


