

Abstract
Objective:
There is a need to characterize exposures associated with the pathogenesis of systemic lupus erythematosus (SLE). In this pilot study, we explore a hypothesis-free approach that can measure thousands of exogenous chemicals in blood (“exposome”) in patients with SLE and unaffected controls.
Methods:
This cross-sectional study analyzed a cohort of prevalent SLE cases (n=285) and controls (n=106). Plasma was analyzed by liquid chromatography-quadrupole time-of-flight mass spectrometry (LC-QTOF/MS). Mass spectrometry features present in at least 25% of all samples were selected for association analysis (n=2,737). Features were matched to potential chemicals utilizing available databases. Association analysis of abundances of features with SLE status was performed, adjusting for age and sex. We also explored features associated with SLE phenotypes, sociodemographic factors, and current medication use.
Results:
We found 30 features significantly associated with SLE status (Bonferroni p<0.05). Of these, 7 matched chemical names based on databases. These seven features included phthalate metabolites, a formetanate metabolite, and eugenol. The abundance of acid pesticides differed between SLE cases and controls (Bonferroni p<0.05). Two unmatched features were associated with a history of lupus nephritis, and one with anti-double-stranded DNA antibody production (Bonferroni p< 0.05). Seventeen features varied by self-reported race and ethnicity, including a polyfluoroalkyl substance (ANOVA p < 1.69E-05). Eleven features correlated with antimalarials, 6 with mycophenolate mofetil, and 29 with prednisone use.
Conclusion
This proof-of-concept study demonstrates that LC-QTOF/MS is a powerful tool that agnostically detects circulating exogenous compounds. These analyses can generate hypotheses of disease-related exposures for future prospective, longitudinal studies.
Graphical Abstract

Introduction
Systemic lupus erythematosus (SLE) is a complex, heterogeneous disease characterized by autoantibody formation and end-organ damage. The pathogenesis of the disease is complex and not fully elucidated, but substantial evidence indicates that SLE results from complex interactions between genetic variants and environmental exposures.1 Previous studies that attempted to link environmental exposures to SLE pathogenesis relied upon self-report questionnaire data, geographical information, and targeted surveys. When measured, environmental chemicals have been studied in a one-exposure, one-effect model, without the ability to capture a range of exposures.
In recent years, the concept of the “exposome” was developed to denote a more comprehensive and complete assessment of environmental exposures2, 3. The exposome can be measured by either a “targeted”, hypothesis-driven approach, in which a particular chemical is measured, or a “non-targeted” approach, where a wider range of chemicals present in the biological sample are agnostically detected. Standard approaches to biomonitoring are targeted, in that the chemicals to be analyzed are first chosen and then the analytic chemistry assays to measure them specifically are developed. Currently, the most commonly used platform is liquid chromatography-tandem mass spectrometry (LC-MS/MS), which is well suited for targeted analysis of single or multiple analytes4. However, the use of LC-MS/MS for comprehensive screening of environmental chemicals is limited by the targeted data acquisition in MS measurement, which requires extensive methodologic set-up and development. This has prompted the development of non-targeted methods in recent years, which allows for evaluation of multiple environmental chemicals with no a priori data. Specifically, liquid chromatography-quadrupole time-of-flight mass spectrometry (LC-QTOF/MS) allows for agnostic, comprehensive and unbiased environmental chemical screening. LC-QTOF/MS has been used in the screening, confirmation, quantification, and structure elucidation of chemicals such as organic micro-contaminants, pharmaceuticals and their metabolites, and pesticides in environmental samples such as water and food. Recent advances in optics and detectors have also enabled the application of LC-QTOF/MS to biological samples such as plasma or urine5–7. Application of this technology enables one to assess the synergistic or additive effects of various exposures and define the “exposome” for a particular individual. 8, 9
We applied this innovative and comprehensive approach to capture a wide array of exogenous and endogenous small molecules simultaneously for the first time in a deeply phenotyped, multiethnic cohort of patients with SLE and unaffected controls. While this cross-sectional study limits the ability to infer causality to associated exposures, this use of this cohort facilitates assessment of the feasibility and utility of a discovery-driven approach implemented with this tool. The goal of this proof-of-concept study was to demonstrate that this new technology can be employed in large-scale population-based studies, thereby enabling the generation of hypotheses that could inform future investigations into the environmental factors contributing to the risk and severity of SLE.
Methods
Our analysis pipeline is illustrated in Fig 1.
Fig 1.

Analysis pipeline to characterize plasma environmental chemicals in SLE and control participants
Patients and Subjects
This study was approved by the Institutional Review Board of the University of California, San Francisco. For this cross-sectional study, a total of 285 SLE cases and 106 controls were included. All participants signed a written informed consent to participate. Participants were recruited from the California Lupus Surveillance Project (CLUES), a multi-racial and multi-ethnic cohort of individuals with physician-confirmed SLE.10 CLUES was initially comprised of a population-based cohort of individuals with SLE living in San Francisco County from 2007 to 2009.11 These participants had a wide range of disease durations, with a mean of 16.3 years (SD of 10.5). Additional participants residing in the geographic region after the surveillance project terminated were recruited into CLUES through local academic and community rheumatology clinics and existing local research cohorts. Study procedures were comprised of an in-person research clinic visit, including collection and review of medical records before the visit; a history and physical examination conducted by a physician specializing in lupus; collection of biospecimens, including peripheral blood for clinical and research purposes; and completion of a structured interview administered by an experienced research assistant. All SLE diagnoses were confirmed by study physicians based upon one of the following definitions: (a) meeting ≥ 4 of the 11 American College of Rheumatology (ACR) revised criteria for the classification of SLE as defined in 1982 and updated in 1997, (b) meeting 3 of the 11 ACR criteria plus a documented rheumatologist’s diagnosis of SLE, or (c) a rheumatologist confirmed diagnosis of lupus nephritis, defined as having evidence of lupus nephritis on kidney biopsy. Medication use at the time of blood draw was recorded. Unaffected controls were recruited through community efforts, focusing on individuals from multiethnic backgrounds and similar age ranges as CLUES participants. Control individuals were screened for autoimmune diseases with a questionnaire. Demographics, health behaviors such as smoking and current medications at the time of blood draw were obtained. Sociodemographic data such as education level, household income and self-reported race and ethnicity information were collected from each study participant. In this analysis, we divided household income into two categories: those earning less than $60,000 per year and those earning $60,000 or more annually. This categorization was based on both the income distribution in our sample and to ensure sufficient sample size for each group. We also dichotomized education level as having obtained Bachelor’s degree or higher, and not having obtained a Bachelor’s degree. All participants underwent genome-wide genotyping as previously described.12 Clinical and demographic characteristics of SLE cases and controls are shown in Table 1.
Table 1.
Characteristics of SLE cases and controls
| Demographics | SLE Cases (n=285) | Controls (n=106) |
|---|---|---|
| Female Subjects, n (%) | 252 (88) | 89 (90) |
| Age at blood draw, mean years (SD) | 45.3 (±13.9) | 41.1 (±15.9) |
| Self-Reported Race and Ethnicity n (%) | ||
| White | 83 (29) | 34 (37) |
| Hispanic | 68 (24) | 14 (15) |
| African American | 29 (10) | 5 (5) |
| Asian/PI | 97 (34) | 39 (42) |
| Other | 6 (2) | 1 (1) |
| Household income n (%) | ||
| <60k | 121 (42) | 34 (32) |
| >60k | 164 (58 | 72 (68) |
| Education level n (%) | 80 (79) | |
| Bachelor’s degree or more | 141 (50) | 80 (79) |
| Less than bachelor’s degree | 143 (50) | 21 (21) |
| Smoking status | ||
| Ever Smoked | 90 (32) | 24 (24) |
| Clinical Characteristics | ||
| Disease Duration, mean years (SD) | 16.4 (±10.6) | N/A |
| Mean disease activity SLEDAI score at blood draw (SD) | 3.0 (±3.1) | N/A |
| ACR SLE Classification Criteria, n (%) | ||
| Malar Rash | 133(47) | N/A |
| Discoid Rash | 35 (12) | N/A |
| Oral Ulcers | 129 (45) | N/A |
| Photosensitivity | 117 (41) | N/A |
| Arthritis | 224 (79) | N/A |
| Serositis | 111 (39) | N/A |
| Pleuritis | 85 (30) | N/A |
| Pericarditis | 50 (18) | N/A |
| Renal Disorder | 129 (45) | N/A |
| Lupus nephritis | 127 (45) | N/A |
| ERSD/Dialysis | 28 (10) | N/A |
| Neurologic | 30 (11) | N/A |
| Seizure | 20 (7) | N/A |
| Psychosis | 11 (4) | N/A |
| Hematologic | 131 (46) | N/A |
| Hemolytic Anemia | 21 (7) | N/A |
| Leukopenia | 65 (23) | N/A |
| Lymphopenia | 85 (30) | N/A |
| Thrombocytopenia | 46 (16) | N/A |
| Immunologic | 225 (79) | N/A |
| anti-dsDNA | 186 (65) | N/A |
| anti-Smith | 78 (27) | N/A |
| ANA | 271 (95) | N/A |
Non-targeted data acquisition and analysis
Our workflow consisted of four main steps: (i) chemical analysis, (ii) data cleaning and processing, (iii) database searching and annotation, and (iv) confirmation of features using standardized approaches.
(i). Chemical Analysis
Using our published method,7 we analyzed plasma samples from patients with SLE and unaffected controls via liquid chromatography- quadrupole time-of-flight mass spectrometry (LC-QTOF/MS, Agilent LC1260- QTOF/MS 6550, Agilent Technologies, Santa Cruz, CA, USA). Briefly, we thawed each 250 uL plasma sample, spiked it with 2.5 uL of 1 ug/mL internal standards (2.5 ng MEHP-C13, 2.5 ng MBzP- C13), and centrifuged it at 3000 rpm for 10 minutes before preparing it for LC-QTOF/MS analysis by solid phase extraction (SPE) using Waters Oasis HLB cartridge (10 mg, 1 cc). The SPE extract was evaporated under a stream of nitrogen gas, then reconstituted in 250 uL of 10% methanol for column injection. A 50 uL aliquot of the extract was used for each of the duplicate injections of the sample into an Agilent Poroshell 120 C18 column (2.1 X 100 mm, 2.7 um) maintained at 55° C. Chromatographic separation of the analytes was achieved by gradient elution using water with 0.05% ammonium acetetate (pH=7.8) as mobile phase A and methanol with 0.05% ammonium acetate (pH=7.8) as mobile phase B. Mass spectrometry was performed using an Agilent Jetstream electrospray ionization (ESI) source operated in the negative polarity. Both parent and fragment ion data were collected using auto-MS/MS mode (information-dependent acquisition).
(ii). Data cleaning and processing
Feature extraction was performed as previously described.7 Briefly, we used the Agilent Mass Profiler to extract mass spectrometry peaks or features with the following restrictions: ion intensity > 1000; charge state = 1; retention time alignment within 0.5 minutes; retention time correction within 0.3 minutes; and Q score >70. Features were normalized to abundance and retention time of internal standards. No fold-change restriction between SLE cases and controls was imposed. Abundances lower than the detection limit were imputed and all values were then natural log transformed. After performing abundance normalization with internal standards, additional batch adjustments were done using ComBat13. A total of 55,768 features were identified. Of these, 32,913 were only identified in SLE cases and 795 were only identified in unaffected controls. PCA plots after batch adjustment of mass spectrometry for all participants are shown in figures S1–S3.
(iii). Database searching and annotations.
To identify features, we used an in-house database of Environmental Organic Acids assembled at the Gerona Lab7 from common environmental chemicals (phenols, phthalates, perfluorinated alkyl substances, polybrominated diphenyl ether metabolites, organophosphate flame retardants, pesticides and metabolites) that have been reported to have endocrine disrupting properties.6 We also searched the HUMANBLOOD database in the Environmental Protection Agency’s Chemistry Dashboard,14 which contains exogenous chemicals as well as metabolites that have been previously detected in human blood. The database is an aggregate of public resources, including the Human Metabolome Database (HMDB),15 WikiPathways, Wikipedia, and literature articles. 14 Finally, we searched the METLIN database. METLIN is a large spectral database compiled and maintained by the Scripps Institute that contains data on 860,000 chemical compounds and is searchable using both positive and negative ionization MS/MS spectra. 16 Compound matching was performed using a mass error tolerance of 10 parts per million (ppm) and a target score ≥ 70. Target score is a composite of accurate mass and isotopic pattern matches. Additional steps to identify compounds included visual inspection of the MS/MS data. Briefly, the monoisotopic mass was calculated, and matching was performed by matching the detected monoisotopic mass to the monoisotopic mass in the libraries within an accuracy of 15 ppm.
(iv). Confirmation of features via LC–MS/MS analysis
Matched features were examined for confirmation with analytical standards by comparing the retention times (RT) and MS/MS spectra of the detected chemical features in the samples to those in the analytical standards. The match criteria imposed included RT match within 0.1 minute tolerance and mass spectral library score of at least 70 with at least two fragment ion matches between the feature’s and the standard’s MS/MS spectra. We selected a subset for validation based on strength and direction of association, cost, exact formula match of feature, isomer reliability, and literature presence. We had two categories of confirmation: Category 1 consisted of compounds with MS/MS confirmation and RT, accurate mass, and MS spectral matches. Category 2 consisted of compounds without MS/MS confirmation but that had RT, accurate mass, and MS spectral matches.
Association with SLE, SLE phenotypes, medication use and demographic factors.
Untargeted LC-QTOF/MS is heavily skewed towards features that are detected in a small number of samples (Fig S2). There is a tradeoff between analyzing fewer high-frequency features (identified in more individuals) vs. more low-frequency features for which there is less statistical power to identify an association. We chose to analyze features that were detected in at least 25% of our study population to have reasonable statistical power while retaining a large number of features to permit a comprehensive analysis. A total of 2,737 features met this threshold and were included in the association analyses. We performed case-control analyses with matched features, with all features (including unmatched), and with feature classes. We constructed generalized linear models (glm in R) with SLE status as a predictor of the (transformed) compound abundance, adjusted for age and sex. For case-control analysis of all individual features, our main sample set included 267 SLE cases and 88 controls. For replication, we ran a smaller set of samples in a single batch which consisted of 18 SLE cases and 18 controls. Within SLE cases, sub-phenotype analyses were performed with history of lupus nephritis and history of double-stranded DNA antibody positivity as phenotypes. We previously identified three patient clusters at CLUES enrollment based on American College of Rheumatology (ACR) classification criteria and sub-criteria utilizing k-means clustering. We labeled them mild (M), severe 1 (S1) and severe 2 (S2), based on the pattern of autoantibodies and internal organ involvement.12 Cluster M was characterized by a high proportion of participants with skin manifestations and inflammatory arthritis, less internal organ involvement and positive sub-serologies. Cluster S1 was characterized by a higher proportion of anti-dsDNA antibodies and history of lupus nephritis, and cluster S2 was characterized by a higher proportion of sub-serologies, lupus nephritis and hematologic manifestations. These cluster assignments were also examined as phenotypes in this study.
We also performed association tests to detect features with different abundances according to high/low education and income levels. Covariates in the above models were chosen if they were associated with the outcome or phenotype at p<0.2. Covariates explored were the first 6 genetic principal components, age, sex, race and ethnicity, and smoking history. Genetic principal components were incorporated as covariates to adjust for genetic substructure between cases and controls, which might manifest as differences in metabolism and absorption of exogenous compounds.
Among the participants with SLE, we also examined the association between detected features and medications. We grouped known immunosuppressant medications into the following categories: prednisone, biologics (belimumab, rituximab), antimalarials (hydroxychloroquine, chloroquine), azathioprine, mycophenolate mofetil (as well as mycophenolic acid), calcineurin inhibitors (tacrolimus, cyclosporine) and other inhibitors of DNA nucleotide synthesis (methotrexate, leflunomide). We examined differences in the abundance of detected features according to education level, household income, and self-report race and ethnicity (using ANOVA). Significant results were further examined with Tukey’s range test. All association analyses used Bonferroni p-value thresholds for significance, i.e., p=0.05 divided by the number of tests.
Results
Features associated with SLE status
We categorized features according to our ability to match them to a chemical name (name-matched), a chemical formula (formula-matched) or if we were unable to match them with current databases they were categorized as unmatched. The number of features detected in SLE cases was higher, with an average of 34 (range 11–55) name-matched features compared to 19 (range 7–32) in controls. The same trend was seen for only formula-matched (mean 410 vs 247) and unmatched features (mean 657 vs 348, Table S1). This is likely due at least in part to differences in sample size, as well as our feature selection for analysis, which required features to be present in at least 25% of the entire sample set.
Name-matched features
We performed an association analysis of abundances of name-matched features, adjusting for sex and age. Results with a p-value < 0.05 are shown in Table 2. Seven features were found to be significantly associated with case-control status (p-value < 7.4E-04). Of these, six were found in higher abundance in SLE cases than controls. These included phthalate metabolites (monomethyl phthalate, monohydroxyisononyl phthalate, monoisobutyl phthalate, and mono 3-carboxypropyl phthalate), a formetanate metabolite (pesticide metabolite), and eugenol (phenol). Endothal, an organic acid used as an herbicide, was found in higher frequency in controls. Other notable features that did not meet our significance threshold included two perfluorochemicals, and several other phthalate and pesticide metabolites (Table 2). We also performed analyses based on chemical classes (Figure 1, Table S2). Name-matched features were grouped into the following categories: nitro and nitroso compounds, acid pesticides, phenolic pesticides, metabolites of phenolic pesticides, perfluroalkyl substances (PFAS), phenols, phosphate flame retardant metabolites, and phthalate metabolites. We compared the abundances as well as detection frequencies between cases and controls, adjusting for sex and age. Figure 1 shows the abundances of chemical classes between cases and controls, where only acid pesticides were significantly different (p=1.16E-05). These consited of 2 matched features, phenoxyacetic acid and dichlorprop. When looking at detection frequencies, there were more pesticide metabolites, phenols, phthalate metabolites, PFAS, and phenols found in plasma in SLE patients compared to controls (p < 0.0063, Table S2).
Table 2. Name-matched features associated with SLE status.
Association models with SLE as the outcome and feature abundance in plasma as the predictor, adjusted for sex and age. Detection frequencies are also shown. Bold p values indicate statistical significance (p-value < 7.4E-04).
| Matched Feature | Chemical Class | p-value | β-coeff (95% CI) * | Mean abundances of features, natural log transformed | Detection Frequency n (%) | Association with SLE status | ||
|---|---|---|---|---|---|---|---|---|
|
| ||||||||
| SLE | Control | SLE N=285 | Control N=106 | |||||
|
| ||||||||
| Endothal | Phenol | 6.98E-16 | −2.389 (−2.944 – −1.834) | −3.822 | −1.45 | 14(4.2) | 85(85) | Negative |
| Monomethyl phthalate | Phthalate metabolite | 6.81E-11 | 4.2 (2.974 – 5.425) | −2.155 | −6.235 | 75(22.6) | 24(24) | Positive |
| Monohydroxyisononyl phthalate A | Phthalate metabolite | 6.61E-06 | 2.652 (1.515 – 3.79) | 3.504 | 0.891 | 144(43.4) | 12(12) | Positive |
| Eugenol B | Phenol | 1.35E-05 | −2.536 (−3.663 – −1.409) | 1.772 | 4.063 | 193(58.1) | 45(45) | Negative |
| Phenoxyacetic acid | Pesticide-acid | 1.03E-04 | 3.025 (1.514 – 4.536) | −1.974 | −4.776 | 81(24.4) | 20(20) | Positive |
| Mono 3-carboxypropyl phthalate | Phthalate metabolite | 1.95E-04 | 2.109 (1.01 – 3.207) | −2.421 | −4.444 | 57(17.2) | 45(45) | Positive |
| Monoisobutyl phthalate | Phthalate metabolite | 2.94E-04 | −1.862 (−2.86 – −0.863) | 1.374 | 3.356 | 216(65.1) | 15(15) | Negative |
| Formetanate metabolite | Pesticide metabolite – phenol | 6.59E-04 | −1.902 (−2.988 – −0.817) | 5.995 | 7.4 | 96(28.9) | 31(31) | Negative |
| Temephos metabolite | Pesticide metabolite – phenol | 0.0017 | −2.239 (−3.624 – −0.854) | −3.49 | −1.696 | 63(19.0) | 37(37) | Negative |
| 4-Heptyloxyphenol B | Phenol | 0.004 | 2.041 (0.66 – 3.423) | 1.425 | −0.295 | 169(50.9) | 28(28) | Positive |
| 4-Heptyloxyphenol A | Phenol | 0.0055 | −1.962 (−3.339 – −0.585) | 1.211 | 3.199 | 261 (78.6) | 77 (77) | Negative |
| Bisphenol AP | Phenol | 0.0065 | 1.865 (0.529 – 3.202) | 1.665 | −0.221 | 191(57.5) | 99(99) | Positive |
| Perfluorohexanesulfonic acid | PFC | 0.0081 | −1.968 (−3.417 – −0.519) | 1.233 | 2.848 | 176(53.0) | 40(40) | Negative |
| Perfluorooctane sulfonic acid | PFC | 0.0084 | −1.814 (−3.157 – −0.472) | −3.086 | −1.545 | 81(24.4) | 24(24) | Negative |
| Monoundecyl phthalate B | Phthalate metabolite | 0.017 | −1.56 (−2.837 – −0.284) | −2.897 | −1.496 | 95(28.6) | 19(19) | Negative |
| 4-Propoxyphenol | Phenol | 0.022 | 1.692 (0.252 – 3.131) | −1.688 | −3.32 | 92(27.7) | 32(32) | Positive |
| Eugenol A | Phenol | 0.022 | 1.689 (0.251 – 3.128) | 3.55 | 1.946 | 266(80.1) | 67(67) | Positive |
| Monocarboxyisoheptyl phthalate | Phthalate metabolite | 0.025 | 1.519 (0.192 – 2.846) | −2.199 | −3.829 | 103(31.0) | 4(4) | Positive |
| Primisulfuron-methyl metabolite | Pesticide metabolite – phenol | 0.027 | 0.804 (0.094 – 1.513) | −2.801 | −3.426 | 93(28.0) | 12(12 | Positive |
| Enterodiol | Phenol | 0.028 | −1.268 (−2.395 – −0.141) | −1.883 | −0.51 | 128(38.6) | 13(13) | Negative |
| Dichlorprop | Pesticide-acid | 0.039 | 0.94 (0.051 – 1.829) | −1.739 | −2.658 | 101(30.4) | 29(29) | Positive |
| 4-tert-Pentylphenol B | Phenol | 0.041 | −1.249 (−2.444 – −0.053) | −1.81 | −0.543 | 137(41.3) | 6(6) | Negative |
Coefficient is the mean difference between cases and controls, adjusted for covariates.
As this is a cross-sectional study that included some participants with long disease duration (e.g., > 20 years), we also performed a case-control comparison comprised of SLE cases with a disease duration of 2 years or less (n=28), and controls (n=105), adjusting for the same covariates. We found 2 matched features that were significantly associated with case-control status (Table S3): Perfluorohexyl ethanoic acid (p=1.2E-06, β-coeff 0.096) and monomethyl phthalate (p=4.9E-04 β-coeff 0.023). Monomethyl phthalate was also a significant result in the entire cohort, and other previous significant features such as endothal were also in the top results, although not significant likely due to a reduced sample size.
Finally, while our primary analysis included features that were present in at least 25% of samples for association testing, we also examined matched features present only in controls and matched features present only in cases. We identified 13 matched features found in SLE cases and in less than 5% of controls (Table S4). These matched compounds include 2 pesticides, several PFAS compounds, and a phthalate metabolite.
All Features
When including all features (n=2,737), matched and unmatched, 23 were significantly associated with case-control status (p<1.8E-05, Table 3). Some features matched to potentially 3–4 chemicals by chemical formula or molecular mass. Eight of these were found in greater abundance in patients with SLE and 15 were found in greater abundance in controls. Representative violin plots for the top 2 features in both patients with SLE and controls are shown in Figure S3. Ten of the 23 features were replicated in the smaller independent batch (p<0.0022). Features with an unadjusted p-value < 0.0001 are shown in Table 3. As these chemicals are mostly undetermined, it is difficult to assess their relevance. However, it is important to note that undetermined features replicated in our analysis, highlighting the need for further annotation and investigation.
Table 3. All features (named and un-matched) associated with SLE status.
Association models with SLE as the outcome and feature abundance in plasma as the predictor, adjusted for sex and age. Discovery and replication results are shown. Bold features highlight replicated features.
| Feature | Discovery | Replication | Potential match | Chemical interpretation | Association with SLE status | ||
|---|---|---|---|---|---|---|---|
| P-value | β-coeff (95% CI*) | P-value | β-coeff (95% CI) * | ||||
| unknown_165.0249_5.012 | 5.75E-14 | 0.586 (0.44 – 0.733) | 0.003 | 1.308 (0.507 – 2.108) | 4-Methoxyphenylisothiocyanate, 4-Hydroxybenzyl isothiocyanate | Positive | |
| unknown_451.9869_5.459 | 2.29E-09 | 0.496 (0.338 – 0.654) | 0.008 | 0.664 (0.205 – 1.123) | Positive | ||
| unknown_1046.5034_4.935 | 2.56E-09 | 0.648 (0.441 – 0.856) | 0.001 | 1.361 (0.62 – 2.102) | Positive | ||
| unknown_247.9887_0.701 | 5.54E-09 | −1.167 (−1.55 – −0.785) | 0.002 | −2.235 (−3.539 – −0.932) | Negative | ||
| unknown_294.1864_6.348 | 3.46E-08 | −1.261 (−1.699 – −0.823) | 0.0002 | −3.185 (−4.63 – −1.74) | Tetradecyl sulfate | Sclerosing medication for varices | |
| C5H16N6O2S_224.1049_4.174 | 5.71E-08 | 1.517 (0.981 – 2.053) | 0.76 | −0.305 (−2.24 – 1.63) | 2-Hydroxy-1-[4-(2-hydroxyethoxy)phenyl]-2-methylpropan-1-one | Positive | |
| unknown_320.0465_0.664 | 1.40E-07 | −0.553 (−0.754 – −0.351) | 0.44 | −0.237 (−0.838 – 0.363) | 8-Chloro-5,7,4'-trihydroxy-3-C-methylflavanone | Negative | |
| unknown_453.2856_6.048 | 4.01E-07 | −1.204 (−1.661 – −0.748) | 8.23E-08 | −3.546 (−4.535 – −2.557) | 1-palmitoyl-phosphatidylethenolamine, Glycerophospho-N-Palmitoyl Ethanolamine, hexadecanoyl-lysophosphatidylethanolamine, Sambutoxin | Endogenous cannabinoid precursor, mycotoxin | Negative |
| unknown_382.239_6.981 | 1.26E-06 | −0.529 (−0.739 – −0.319) | 1.38E-05 | −1.938 (−2.67 – −1.206) | Sarcostin | Corticosteroid hormone | Negative |
| C17H18F21IN11OS_950.0128_5.227 | 1.60E-06 | 0.441 (0.264 – 0.619) | 0.568 | 0.185 (−0.442 – 0.812) | Positive | ||
| unknown_240.1361_5.492 | 2.66E-06 | −0.83 (−1.171 – −0.49) | 0.072 | −1.162 (−2.383 – 0.06) | Negative | ||
| C25H50FN3O10_571.348_6.137 | 4.68E-06 | −0.748 (−1.063 – −0.433) | 1.23E-05 | −2.012 (−2.767 – −1.257) | Negative | ||
| C9H16Cl4F2N3O_360.0021_0.7 | 5.97E-06 | −0.524 (−0.748 – −0.301) | 0.418 | −0.368 (−1.245 – 0.51) | n-heptanoyl acetic acid | Metabolite of Heptanoic Acid: used in the synthesis of fragrances and artificial flavor preparations. | Negative |
| C18H32O2_280.241_8.13 | 6.21E-06 | −2.161 (−3.084 – −1.238) | 4.79E-04 | −5.265 (−7.9 – −2.631) | Negative | ||
| Monomethyl phthalate_180.0425_3.878 | 7.21E-06 | 0.615 (0.35 – 0.879) | 0.085 | 0.748 (−0.075 – 1.572) | m-Hydroxyphenylpyruvic acid, Caffeate, 4-Hydroxyphenylpyruvic acid, trans-2,3-Dihydroxycinnamate, Caffeic Acid, Monomethyl phthalate, 2-Hydroxy-3-(4-hydroxyphenyl)propenoic acid, Aspirin | Positive | |
| C32H50F2N9O3S4_774.2878_4.848 | 7.93E-06 | −0.587 (−0.841 – −0.334) | 0.009 | −1.242 (−2.115 – −0.369) | Negative | ||
| C20H32O2_304.2408_8.003 | 8.16E-06 | −1.337 (−1.916 – −0.759) | 0.001 | −3.056 (−4.708 – −1.403) | Negative | ||
| unknown_416.0883_4.063 | 9.81E-06 | 0.608 (0.342 – 0.873) | 3.52E-05 | 1.77 (1.055 – 2.484) | Calomelanol D | Plant metabolite | Positive |
| unknown_240.0748_5.224 | 1.10E-05 | −0.771 (−1.109 – −0.432) | 0.868 | 0.105 (−1.123 – 1.333) | Dinoseb, Dinoterb | Herbicide | Negative |
| C38H67F2O7S_705.4575_7.322 | 1.25E-05 | −0.379 (−0.546 – −0.211) | 0.028 | −0.869 (−1.605 – −0.133) | Negative | ||
| unknown_1240.8754_3.782 | 1.40E-05 | −0.59 (−0.853 – −0.328) | 3.93E-04 | −1.154 (−1.721 – −0.587) | Negative | ||
| C18H23F7I2O4_689.9572_4.963 | 1.57E-05 | 0.568 (0.314 – 0.822) | 0.173 | 0.358 (−0.145 – 0.86) | Positive | ||
| C21H45F2N10O6_571.349_5.253 | 1.66E-05 | −0.876 (−1.268 – −0.483) | 0.089 | −0.552 (−1.168 – 0.063) | Negative | ||
| C13H23BrF2N4O4_416.0877_4.048 | 2.17E-05 | −0.533 (−0.775 – −0.29) | 4.58E-04 | −1.565 (−2.344 – −0.785) | Negative | ||
| C18H31ClN3O_340.2143_9.187 | 2.20E-05 | −0.523 (−0.76 – −0.285) | 0.867 | −0.103 (−1.294 – 1.088) | 14,19-Dihydroaspidospermatine, Ethanol, 2,2'-((4-((2-(diethylamino)ethyl)amino)-3-nitrophenyl)imino)bis- | Alkaloid, metabolite | Negative |
| unknown_1177.3161_4.938 | 2.76E-05 | 0.486 (0.262 – 0.71) | 0.018 | 0.871 (0.188 – 1.553) | Positive | ||
| unknown_942.2446_4.916 | 2.98E-05 | 0.469 (0.252 – 0.686) | 0.067 | 0.556 (−0.017 – 1.128) | |||
| unknown_256.0943_3.946 | 3.01E-05 | −0.554 (−0.81 – −0.297) | 2.67E-04 | −1.264 (−1.863 – −0.664) | Aryl beta-D-glucoside, Phenylgalactoside, Phenyl beta-D-glucopyranoside | Negative | |
| C11H22O3_202.157_4.919 | 3.63E-05 | −0.741 (−1.089 – −0.394) | 0.009 | −1.508 (−2.574 – −0.442) | omega-hydroxy hendecanoic acid, Undecanoic acid, 3-hydroxy-, (S)-, 10-hydroxy-undecanoic acid,4-hydroxy-undecanoic acid, 3-hydroxy-undecanoic acid, 2-hydroxy-undecanoic acid | Undecanoic acid: medium-chain fatty acid found in body fluids, human metabolite and antifungal | Negative |
| unknown_809.3788_4.945 | 3.69E-05 | 0.401 (0.213 – 0.589) | 0.152 | 0.429 (−0.144 – 1.003) | Positive | ||
| unknown_856.677_4.923 | 4.49E-05 | 0.54 (0.284 – 0.796) | 0.896 | −0.047 (−0.74 – 0.647) | PC(19:0/22:2(13Z,16Z)), PC(19:1(9Z)/22:1(11Z)), PC(20:2(11Z,14Z)/21:0), PC(21:0/20:2(11Z,14Z)), PC(22:2(13Z,16Z)/19:0), PC(22:1(11Z)/19:1(9Z)) | Positive | |
| unknown_236.1779_6.127 | 5.03E-05 | −0.573 (−0.847 – −0.3) | 0.023 | −1.156 (−2.1 – −0.213) | Farnesoic acid, Helminthosporol, Sirenin, Kikkanol B, Hernandulcin, Cyperolone, Lubimin, Capnell-9(12)-ene-8beta,10alpha-diol, Curdione, capsidiol, Latia luciferin, (−)-Kanshone A, 4E,7Z,10Z-Tridecatrienyl acetate, 3,7-Epoxycaryophyllan-6-One | Negative | |
| unknown_263.9623_0.695 | 5.73E-05 | −0.378 (−0.56 – −0.196) | 0.127 | −0.552 (−1.24 – 0.137) | Negative | ||
| C12H24O2_200.1782_6.629 | 6.37E-05 | −1.265 (−1.878 – −0.653) | 0.026 | −2.147 (−3.939 – −0.356) | Lauric acid, Isolauric acid, 9-Methyl-undecanoic acid, 8-Methyl-undecanoic acid, 4-Methyl-undecanoic acid, 5-Methyl-undecanoic acid, 2-Methyl-undecanoic acid, 3-Methyl-undecanoic acid, 6-Methyl-undecanoic acid | Lauric acid: Fatty acid, esters of which occur in natural substances. Is main use in manufacturing is as an ingredient in soaps and shampoos | Negative |
| unknown_601.3379_6.082 | 7.23E-05 | −0.954 (−1.419 – −0.489) | 0.001 | −2.13 (−3.292 – −0.968) | Negative | ||
| unknown_571.3493_5.32 | 7.33E-05 | 0.837 (0.428 – 1.246) | 0.008 | 1.937 (0.613 – 3.26) | Positive | ||
| unknown_322.1087_5.022 | 7.75E-05 | 0.549 (0.28 – 0.817) | 0.095 | 0.906 (−0.125 – 1.937) | Positive | ||
| unknown_775.9798_0.636 | 9.46E-05 | 0.531 (0.267 – 0.794) | 0.153 | 0.399 (−0.135 – 0.933) | Positive | ||
| C10H18F6I2N9_631.9678_5.045 | 0.00011072 | 0.47 (0.234 – 0.705) | 0.963 | 0.016 (−0.675 – 0.708) | Positive | ||
| C22H41FN2O9_496.28_6.664 | 0.00011634 | −0.59 (−0.887 – −0.294) | 4.08E-04 | −1.996 (−2.979 – −1.012) | Negative | ||
| C13H11F15O2_484.052_0.658 | 0.00012121 | −0.378 (−0.568 – −0.187) | 0.701 | 0.11 (−0.445 – 0.665) | Negative | ||
Coefficient is the mean difference between cases and controls, adjusted for covariates.
Subphenotype analysis
Within SLE cases only, we performed association analysis with several lupus phenotypes, specifically history of lupus nephritis, history of anti-double stranded DNA antibody production, disease activity (SLEDAI score) and clinical cluster (M, S1, or S2) at cohort enrollment. We found 2 features significantly associated with a history of lupus nephritis, which had only a formula match. The first feature (C7H4Br2O4_309.8476_4.975, p=9.97 E-10, β coeff= −0.845), found in lower frequency in SLE cases with a history of lupus nephritis, had a potential match to o-Pyrocatechuic acid or 2,6-dibromo-3,5-dihydroxybenzoic acid. The second feature (C5H6BrClF2OS_265.8982_4.893, p=1.23E-06, β coeff=−0.505 was potentially matched to Chlorquinox, an organochloride compound antifungal agent. We also found one feature associated with a history of anti-double-stranded DNA antibody positivity (unknown_441.9887_4.563, p=6.4E-06, β coeff= 0.608), with no potential matches. No significant associations were found with clinical clusters or disease activity (SLEDAI score). Finally, we generated a heatmap with abundances of features that we selected as candidates for confirmation with reference standards (below), namely those significantly associated with SLE status, a history of lupus nephritis, or anti-double- stranded DNA antibody production. We also included compounds that were present in at least half of SLE cases but not present in controls, which were not in the analysis that included features detected in 25% of all study participants (Fig 2).
Fig. 2.

Boxplots of matched features grouped into chemical classes in SLE vs unaffected controls.
Associations with medication use
To investigate whether non-targeted mass spectrometry could detect medication-related metabolites, we performed an association analysis of all features among participants with SLE. We found 11 features that were correlated with use of antimalarials, 6 features with mycophenolate mofetil, and 29 features with prednisone use (Table S5). Although the majority remain to be identified, there were some notable findings, such as the identification of desmethylchloroquine with antimalarials (p= 4.04E-27, β coeff = 0.163) and several steroid metabolites associated with prednisone use (e.g., 11-beta-hydroxyandrosterone-3-glucuronide, metabolite of cortolone, tetrahydroaldosterone-3-glucuronide, p < 1.8E-05).
Features with different abundances according to sociodemographic factors.
We also assessed whether different exposures were associated with sociodemographic factors such as education level, household income and self-reported race and ethnicity. We found 17 features with different abundances according to self-report race and ethnicity (ANOVA p < 1.8E-05, table S6). Of these, there was only one name-matched feature, perfluorohexanesulfonic acid, found highest in Whites and lowest in Hispanics. We did not find any statistically significant named features associated with education level or household income, but the most significant association was with higher abundances of perfluorohexanesulfonic acid with education level (Bachelor’s degree or higher, p=0.0023, β= 0.55). (Table S7).
Confirmation of compounds
We selected 31 features to be confirmed using commercially acquired reference standards. We were able to confirm 11 of the 31 features. Category 1 consisted of compounds with MS/MS confirmation and retention time, accurate mass and MS spectral matches. These included perfluorohexanesulfonic acid, N-palmitoyl taurine, bilirubin, o-pyrocatechuic acid and mono (2-carboxymethylhexyl) phthalate. Category 2 consisted of compounds without MS/MS confirmation but with retention time, accurate mass and MS spectral match. These included 5-oxononanoic acid, butyl 4-oxopentanoate, glycerophospho-N-palmitoyl ethanolamine, methyl-1-(hydroxymethyl)cyclohexane-1-carboxylate and 4-tert-nonylphenol. Overall, this confirmation rate is similar to other non-targeted exposome studies 17–19 and supports the use of this approach for discovery and hypothesis generation. Confirmatory LC-QTOF/MS data is shown in tables S8 and S9.
Discussion
In this proof of concept study, we show that using a hypothesis-free approach such as LC-QTOF/MS can detect differences in circulating exogenous environmental chemicals in a well phenotyped SLE cohort and unaffected controls. Overall, we could identify individual features and compare abundances between cases and controls, with findings that warrant additional investigation, such as the increased exposure of acid pesticides in SLE. We also identified 11 common SLE drug metabolites in SLE sera, supporting the face validity of our method. All six matched features found more commonly in SLE sera have been previously associated with human metabolic or endocrine dysregulation.20–24 Given the well-documented disproportionate burden of environmental exposures for minority populations25, 26, this work may have important implications for disparities observed in SLE.
New evidence suggests a rising prevalence of ANA seropositivity27. A recent study examining the impact of environmental exposures on the rising ANA prevalence found that in a large representative US sample, exposure to xenobiotics (substances foreign to the body) was associated with ANA positivity. 28 By utilizing data from the Agricultural Health Study, a study revealed that having ANA antibodies was associated with a reported history of seeking medical care due to exposure to pesticides, use of the fumigant methyl bromide, and use of petroleum oil/distillates.29 Understanding how environmental toxins impact autoimmunity is a pressing unmet need.
The availability of high throughput genome-wide genotyping led to the Genome Wide Association Study (GWAS) revolution, which was fundamental for our understanding of the genetic contribution to SLE. New technologies like LC-QTOF/MS may allow us to advance our understanding of the exposome — the cumulative measure of environmental influences over the lifespan — and its impact in autoimmune diseases such as SLE. Approximately 40,000 chemicals are registered on the inventory of the Toxic Substances Control Act (TSCA) as actively used chemicals in the United States.30 This number does not include chemicals that are regulated by other U.S. statutes, such as pesticides, foods and food additives, drugs, cosmetics, tobacco and tobacco products, and nuclear materials and munitions. Their cumulative effects on health and disease remain unknown. The field of exposomics and environmental health is rapidly evolving from detailed patient surveys to objective, comprehensive and agnostic measurements of small molecules (endogenous and exogenous) and biomarkers. It is with this premise that we performed this exploratory proof of concept study to better understand this powerful tool and to evaluate its performance in a large study (for exposomic standards) of SLE individuals and controls. Despite the continual growth of computational tools and chemical databases to aid chemical annotation, the majority of detected chemical features in untargeted exposomic studies are not confidently identified31, 32. This is partly due to the number of synthetic chemicals that comprise real-world exposures being greater than current inventories. Chemicals in commerce may be complex mixtures or contain isomers and impurities, and many are transformed in humans or by microbes in the body (i.e., the microbiome) or in the environment (e.g., methylmercury) to a multitude of metabolic and degradation products. The fact that current databases failed to identify the majority of features identified in this study highlights the need for additional reference panels and surveillance. As genetic risk is not modifiable, identifying exposures that influence disease risk has great potential for informing effective prevention strategies.
In this exploratory cross sectional study, some preliminary results are worth discussing. We found a higher abundance of phthalate metabolites in SLE cases than in controls. Phthalates are non-persistent organic chemicals widely used in consumer products. Low molecular weight phthalates are often added to shampoos, lotions, and personal care products, whereas high-molecular weight phthalates are used as plasticizer in items such as flooring and clear food wrap. They are also used as excipients in drug coatings such as Prilosec and Myfortic, and as plasticizers for IV tubing and containers. 33 Since they have a relatively short half life (8–18 hours), these exposures must have occurred less than 24 hours before the blood draw. 34 Similar to our study, higher concentration of urinary phthalates has been found in women with autoimmunity, including SLE, compared to women in other studies. 35, 36 A recent study revealed that phthalate exposure was associated with all-cause and cardiovascular mortality, with >90,000 attributable deaths/year in 55–64 year olds.20 Based on the preliminary evidence discussed above, phthalate exposure and its effect on SLE should be further studied.
The association with pesticides and herbicides and lupus risk has been previously reported in epidemiologic studies documenting associations of agricultural and residential pesticide exposure with increased risk for SLE.37, 38 Notably, data from the Agricultural Health Study indicated that the herbicide metribuzin, along with the regular application of pesticides for 20 or more days per year, were both linked to an increased risk of SLE 39 A study corroborated this findings using a national cohort of women, where more frequent pesticide use (OR 2.3, 95% CI 1.3,4.1) and extended childhood farm residence (OR 1.8, 95% CI 1.1, 3.0) were associated with increased SLE risk.37 In our study, we found higher levels of acid pesticide metabolites in SLE cases compared to controls. Phenoxyacetic acid, an herbicide that is grouped in the acid pesticides category, was one of our name-matched results.40 These organic compounds are persistent, often contaminating water and soil.40 Although there is no prior evidence implicating this compound with risk of autoimmunity, a small study showed that farmers exposed to chlorophenoxy herbicides had significant changes in circulating immune cells. 23 Dichlorprop, the other acid pesticide identified in our dataset, is listed as a priority compound of potential concern for Mediterranean countries by the European Union. However, as of now, there is no evidence directly linking it to autoimmunity.41
Another interesting observation was the higher abundance and detection frequency of endothal, an herbicide for terrestrial and aquatic plants, in unaffected controls compared to SLE cases. It is also a protein phosphatase 2A (PP2A) inhibitor. PP2A has been shown to be increased in patients with SLE, and subsequent treatment of SLE T cells with a PP2A inhibitor normalized IL-2 production in SLE patients. 42 This finding warrants confirmation.
Our data support the potential for differential exposures by self-reported race and ethnicity, regardless of SLE status. In the United States, minorities often live in segregated neighborhoods due to redlining and discriminatory housing practices43–45. Polluting industries are often located in or close to these communities where residents have insufficient socioeconomic and political capital to determine where these sites are placed46. Over a third of products found in Dollar Stores exceed Consumer Product Safety Commission-established phthalate limits. 26 Lower-income communities that rely more heavily on inexpensive products and processed foods, and with lower access to fresh fruits and vegetables have been shown to experience a disproportionate burden of phthalate and pesticide exposures. 47 In this study, we found several unmatched features that differed in abundance according to self-reported race/ethnicity. Interestingly, the only matched feature, perfluorohexanesulfonic acid, a polyfluoroalkyl substance or PFAS, was found in higher abundance in participants with higher education and self-reported Whites. This is consistent with a recent study demonstrating that Swedish adolescents that adhered to a diverse and healthy diet were more highly exposed to PFAS than those eating less healthy diets. 48 Polyfluoroalkyl substances are persistent organic pollutant with bioaccumulative properties, best known for their original use in producing the fluoropolymer Teflon and the stain-resistant coating Scotchgard. 49 These chemicals are now used in a wide range of consumer and industrial products where grease or water proofing is desired, or surfactant action is a benefit. These products include food packaging and non-stick cookware, cosmetics, waterproof and stain-proof textiles and carpets. PFAS have been linked to many harmful health effects, including cancer, immune system dysfunction, liver damage, developmental and reproductive harm, and hormone disruption. 50
This study sought to demonstrate the utility of LC-QTOF/MS as a powerful tool for capturing thousands of circulating features at one time. Limitations of this study impact the interpretation of our findings. The cross-sectional nature of the study design limits the ability to establish causality between exposures and the development of SLE. Any observed association must consider the possibility of reverse causation, wherein the outcome precedes and influences the exposure, preventing definitive causal inferences. Participants were recruited from a research cohort of prevalent disease from a particular county, with relatively long disease duration, and mostly clinically quiescent disease (Table S1). As we captured participants from one geographic area, we had low representation of the African American community in our sample. Furthermore, although we tried to account for immunosuppressant medication use at the time of blood draw, historical use of medications with longer half-lives could explain some of the features that were associated with SLE. Another limitation in our methods is that the mass spectrometry data was only generated utilizing negative ionization, which cannot capture some exposures previously linked to SLE and potentially misses chemicals that would have been detected utilizing positive ionization. The study initially intended to focus on endocrine disrupting chemicals, the majority of which are organic acids which ionize better in negative polarity, which was taken into account in designing the data acquisition strategy for the LC-QTOF/MS analysis. Expansion of the data analysis to other publicly available databases is a compelling impetus for conducting LC-QTOF/MS analysis in both positive and negative polarity in future studies.
In summary, we demonstrate the ability of agnostic mass spectrometry to capture a wide array of exogenous chemicals in individuals with SLE, which can be used in association analyses of SLE disease risk and disease-specific sub-phenotypes. This technology has the potential to significantly advance our understanding of the exposome in health and in autoimmune diseases such as SLE. However, to maximize the informativeness of this technology, better reference panels need to be developed, and prospective longitudinal cohorts that can measure the exposome at several stages of disease (for example, pre-clinical disease, and during active flares), and in geographic locations where vulnerable populations may be exposed to environmental pollutants should be studied.
Supplementary Material
Fig 3. Heatmap of 49 selected features according to association analyses.
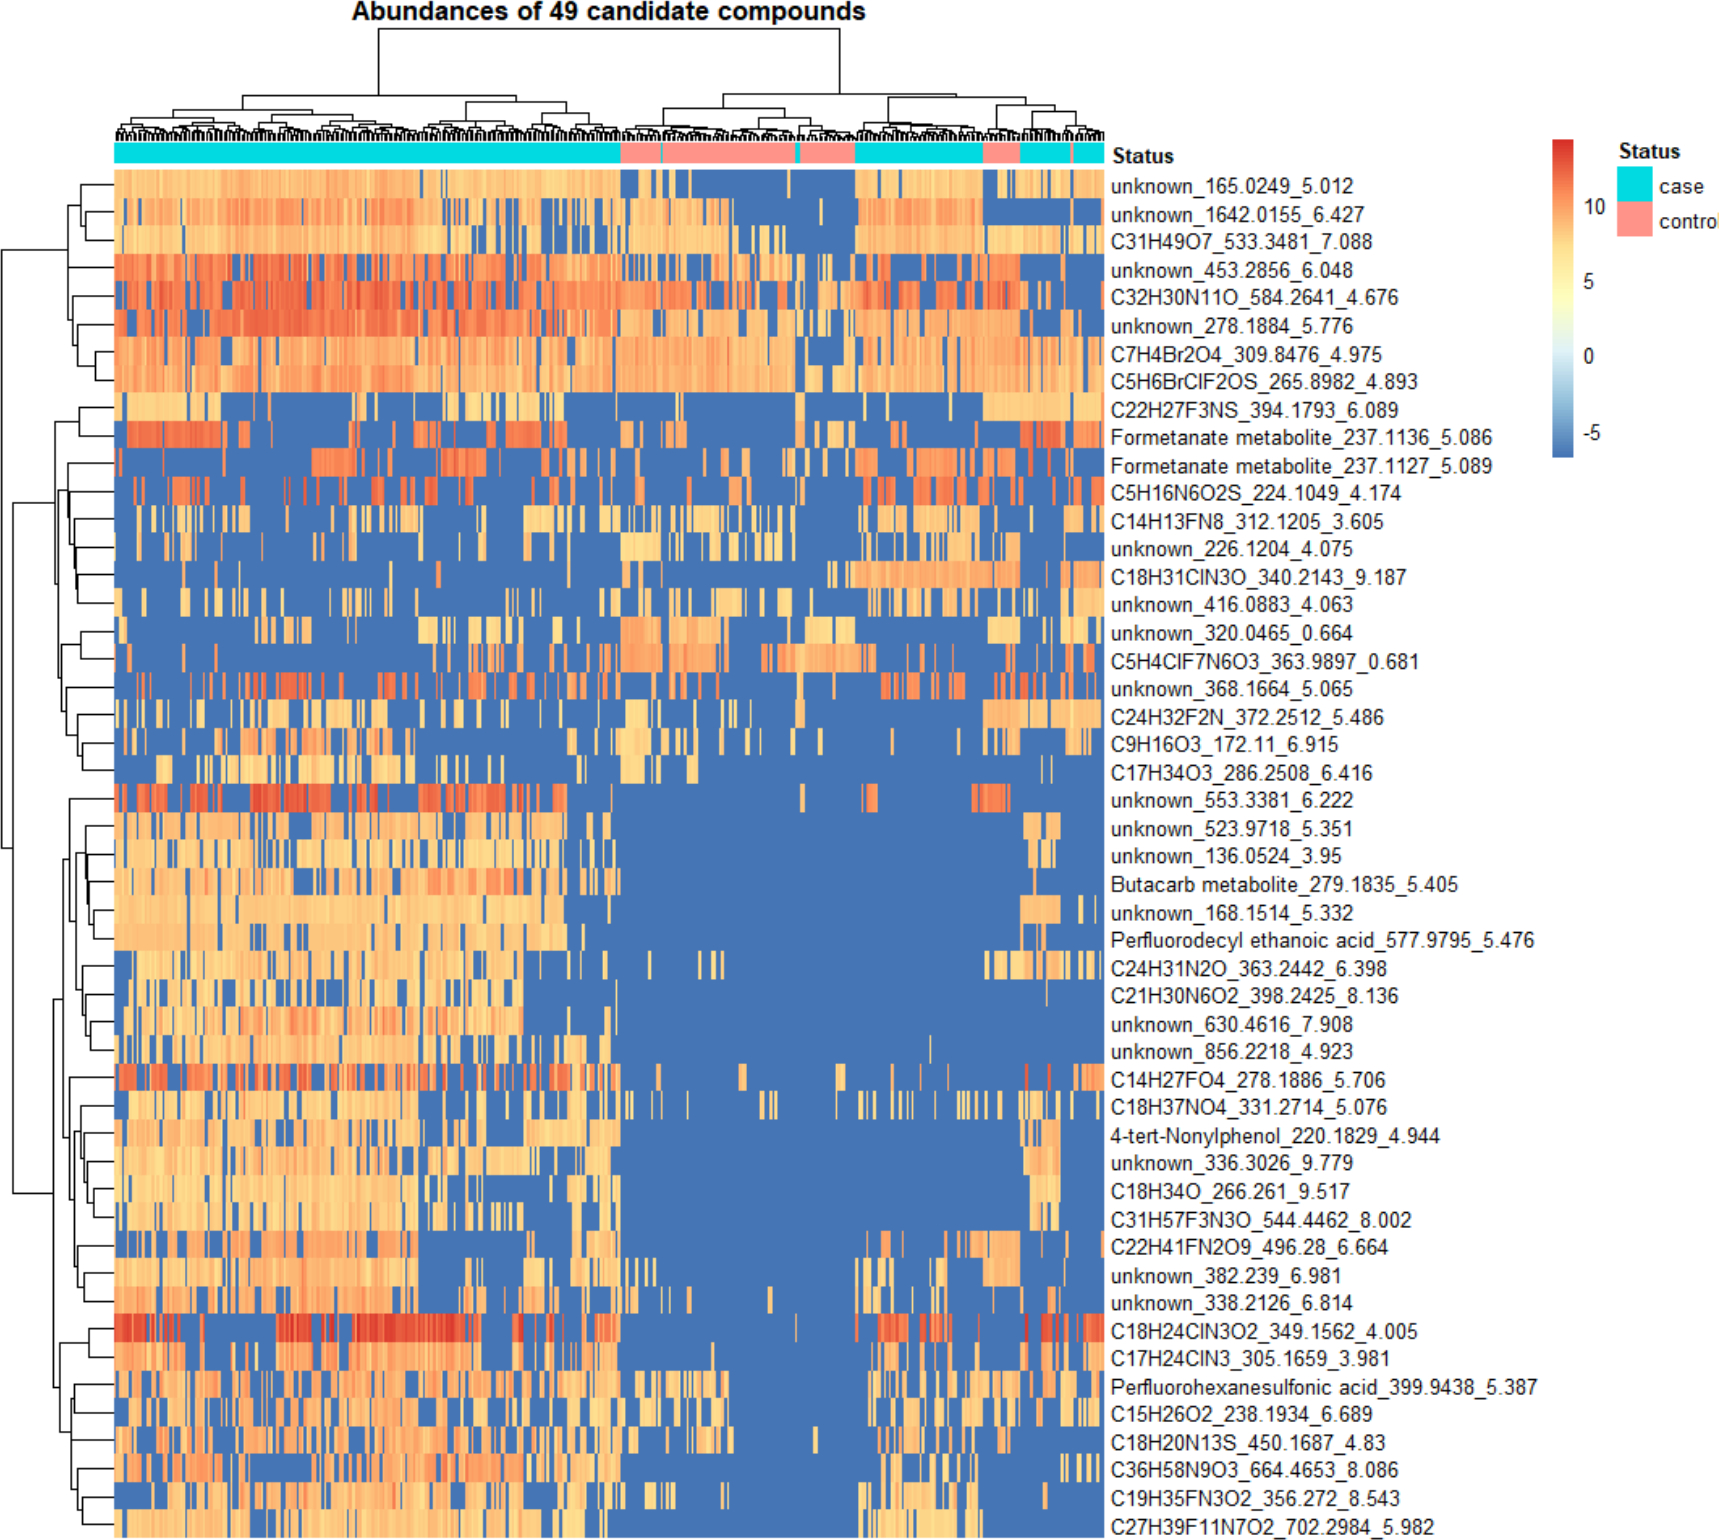
Abundances of features were normalized, and natural log transformed.
Acknowledgements
We would like to acknowledge all the participants in this study. This research was supported in part by the Intramural Research Program of the National Human Genome Research Institute, National Institutes of Health.
References
- 1.Woo JMP, Parks CG, Jacobsen S, Costenbader KH, Bernatsky S. The role of environmental exposures and gene-environment interactions in the etiology of systemic lupus erythematous. J Intern Med. Feb 10 2022;doi: 10.1111/joim.13448 [DOI] [PMC free article] [PubMed] [Google Scholar]
- 2.Wild CP, Scalbert A, Herceg Z. Measuring the exposome: a powerful basis for evaluating environmental exposures and cancer risk. Environ Mol Mutagen. Aug 2013;54(7):480–99. doi: 10.1002/em.21777 [DOI] [PubMed] [Google Scholar]
- 3.Vermeulen R, Schymanski EL, Barabasi AL, Miller GW. The exposome and health: Where chemistry meets biology. Science. Jan 24 2020;367(6476):392–396. doi: 10.1126/science.aay3164 [DOI] [PMC free article] [PubMed] [Google Scholar]
- 4.Nakazawa H, Iwasaki Y, Ito R. Analytical methods for the quantification of bisphenol A, alkylphenols, phthalate esters, and perfluoronated chemicals in biological samples. Anal Sci. 2014;30(1):25–34. doi: 10.2116/analsci.30.25 [DOI] [PubMed] [Google Scholar]
- 5.Lacorte S, Fernandez-Alba AR. Time of flight mass spectrometry applied to the liquid chromatographic analysis of pesticides in water and food. Mass Spectrom Rev. Nov-Dec 2006;25(6):866–80. doi: 10.1002/mas.20094 [DOI] [PubMed] [Google Scholar]
- 6.Gomez MJ, Gomez-Ramos MM, Malato O, Mezcua M, Fernandez-Alba AR. Rapid automated screening, identification and quantification of organic micro-contaminants and their main transformation products in wastewater and river waters using liquid chromatography-quadrupole-time-of-flight mass spectrometry with an accurate-mass database. J Chromatogr A. Nov 5 2010;1217(45):7038–54. doi: 10.1016/j.chroma.2010.08.070 [DOI] [PubMed] [Google Scholar]
- 7.Gerona RR, Schwartz JM, Pan J, Friesen MM, Lin T, Woodruff TJ. Suspect screening of maternal serum to identify new environmental chemical biomonitoring targets using liquid chromatography-quadrupole time-of-flight mass spectrometry. J Expo Sci Environ Epidemiol. Mar 2018;28(2):101–108. doi: 10.1038/jes.2017.28 [DOI] [PMC free article] [PubMed] [Google Scholar]
- 8.Hu X, Walker DI, Liang Y, et al. A scalable workflow to characterize the human exposome. Nat Commun. Sep 22 2021;12(1):5575. doi: 10.1038/s41467-021-25840-9 [DOI] [PMC free article] [PubMed] [Google Scholar]
- 9.Price EJ, Vitale CM, Miller GW, et al. Merging the exposome into an integrated framework for “omics” sciences. iScience. Mar 18 2022;25(3):103976. doi: 10.1016/j.isci.2022.103976 [DOI] [PMC free article] [PubMed] [Google Scholar]
- 10.Katz P, Yazdany J, Trupin L, et al. Psychometric Evaluation of the National Institutes of Health Patient-Reported Outcomes Measurement Information System in a Multiracial, Multiethnic Systemic Lupus Erythematosus Cohort. Arthritis Care Res (Hoboken). Dec 2019;71(12):1630–1639. doi: 10.1002/acr.23797 [DOI] [PMC free article] [PubMed] [Google Scholar]
- 11.Dall’Era M, Cisternas MG, Snipes K, Herrinton LJ, Gordon C, Helmick CG. The Incidence and Prevalence of Systemic Lupus Erythematosus in San Francisco County, California: The California Lupus Surveillance Project. Arthritis Rheumatol. Oct 2017;69(10):1996–2005. doi: 10.1002/art.40191 [DOI] [PubMed] [Google Scholar]
- 12.Lanata CM, Paranjpe I, Nititham J, et al. A phenotypic and genomics approach in a multi-ethnic cohort to subtype systemic lupus erythematosus. Nat Commun. Aug 29 2019;10(1):3902. doi: 10.1038/s41467-019-11845-y [DOI] [PMC free article] [PubMed] [Google Scholar]
- 13.Johnson WE, Li C, Rabinovic A. Adjusting batch effects in microarray expression data using empirical Bayes methods. Biostatistics. Jan 2007;8(1):118–27. doi: 10.1093/biostatistics/kxj037 [DOI] [PubMed] [Google Scholar]
- 14.Pleil JD, Lowe CN, Wallace MAG, Williams AJ. Using the US EPA CompTox Chemicals Dashboard to interpret targeted and non-targeted GC-MS analyses from human breath and other biological media. J Breath Res. Mar 18 2021;15(2):025001. doi: 10.1088/1752-7163/abdb03 [DOI] [PubMed] [Google Scholar]
- 15.Wishart DS, Feunang YD, Marcu A, et al. HMDB 4.0: the human metabolome database for 2018. Nucleic Acids Res. Jan 4 2018;46(D1):D608–D617. doi: 10.1093/nar/gkx1089 [DOI] [PMC free article] [PubMed] [Google Scholar]
- 16.Database M. https://metlin.scripps.edu/landing_page.php?pgcontent=mainPage [Google Scholar]
- 17.Wang A, Abrahamsson DP, Jiang T, et al. Suspect Screening, Prioritization, and Confirmation of Environmental Chemicals in Maternal-Newborn Pairs from San Francisco. Environ Sci Technol. Apr 20 2021;55(8):5037–5049. doi: 10.1021/acs.est.0c05984 [DOI] [PMC free article] [PubMed] [Google Scholar]
- 18.Jiang T, Wang M, Wang A, et al. Large-Scale Implementation and Flaw Investigation of Human Serum Suspect Screening Analysis for Industrial Chemicals. J Am Soc Mass Spectrom. Sep 1 2021;32(9):2425–2435. doi: 10.1021/jasms.1c00135 [DOI] [PMC free article] [PubMed] [Google Scholar]
- 19.Schymanski EL, Jeon J, Gulde R, et al. Identifying small molecules via high resolution mass spectrometry: communicating confidence. Environ Sci Technol. Feb 18 2014;48(4):2097–8. doi: 10.1021/es5002105 [DOI] [PubMed] [Google Scholar]
- 20.Trasande L, Liu B, Bao W. Phthalates and attributable mortality: A population-based longitudinal cohort study and cost analysis. Environ Pollut. Jan 1 2022;292(Pt A):118021. doi: 10.1016/j.envpol.2021.118021 [DOI] [PMC free article] [PubMed] [Google Scholar]
- 21.Jebara A, Beltifa A, Di Bella G, Mabrouk L, Ben Mansour H. Endocrine-disruptor endpoints in the ovary and thyroid of adult female rats exposed to realistic doses of di-(2-ethylhexyl) phthalate. J Water Health. Aug 2022;20(8):1256–1267. doi: 10.2166/wh.2022.140 [DOI] [PubMed] [Google Scholar]
- 22.Xie Z, Liu S, Hua S, et al. Preconception exposure to dibutyl phthalate (DBP) impairs spermatogenesis by activating NF-kappaB/COX-2/RANKL signaling in Sertoli cells. Toxicology. May 30 2022;474:153213. doi: 10.1016/j.tox.2022.153213 [DOI] [PubMed] [Google Scholar]
- 23.Faustini A, Settimi L, Pacifici R, Fano V, Zuccaro P, Forastiere F. Immunological changes among farmers exposed to phenoxy herbicides: preliminary observations. Occup Environ Med. Sep 1996;53(9):583–5. doi: 10.1136/oem.53.9.583 [DOI] [PMC free article] [PubMed] [Google Scholar]
- 24.Rocha VA, Aquino AM, Magosso N, et al. 2,4-dichlorophenoxyacetic acid (2,4-D) exposure during postnatal development alters the effects of western diet on mouse prostate. Reprod Toxicol. Sep 2023;120:108449. doi: 10.1016/j.reprotox.2023.108449 [DOI] [PubMed] [Google Scholar]
- 25.Zota AR, Shamasunder B. The environmental injustice of beauty: framing chemical exposures from beauty products as a health disparities concern. Am J Obstet Gynecol. Oct 2017;217(4):418 e1–418 e6. doi: 10.1016/j.ajog.2017.07.020 [DOI] [PMC free article] [PubMed] [Google Scholar]
- 26.Ruiz D, Becerra M, Jagai JS, Ard K, Sargis RM. Disparities in Environmental Exposures to Endocrine-Disrupting Chemicals and Diabetes Risk in Vulnerable Populations. Diabetes Care. Jan 2018;41(1):193–205. doi: 10.2337/dc16-2765 [DOI] [PMC free article] [PubMed] [Google Scholar]
- 27.Dinse GE, Parks CG, Weinberg CR, et al. Increasing Prevalence of Antinuclear Antibodies in the United States. Arthritis Rheumatol. Aug 26 2022;doi: 10.1002/art.42330 [DOI] [PMC free article] [PubMed] [Google Scholar]
- 28.Dinse GE, Co CA, Parks CG, et al. Expanded assessment of xenobiotic associations with antinuclear antibodies in the United States, 1988–2012. Environ Int. Jun 27 2022;166:107376. doi: 10.1016/j.envint.2022.107376 [DOI] [PMC free article] [PubMed] [Google Scholar]
- 29.Parks CG, Santos ASE, Lerro CC, et al. Lifetime Pesticide Use and Antinuclear Antibodies in Male Farmers From the Agricultural Health Study. Front Immunol. 2019;10:1476. doi: 10.3389/fimmu.2019.01476 [DOI] [PMC free article] [PubMed] [Google Scholar]
- 30.Rayasam SDG, Koman PD, Axelrad DA, Woodruff TJ, Chartres N. Toxic Substances Control Act (TSCA) Implementation: How the Amended Law Has Failed to Protect Vulnerable Populations from Toxic Chemicals in the United States. Environ Sci Technol. Sep 6 2022;56(17):11969–11982. doi: 10.1021/acs.est.2c02079 [DOI] [PMC free article] [PubMed] [Google Scholar]
- 31.Zhang P, Carlsten C, Chaleckis R, et al. Defining the Scope of Exposome Studies and Research Needs from a Multidisciplinary Perspective. Environ Sci Technol Lett. Oct 12 2021;8(10):839–852. doi: 10.1021/acs.estlett.1c00648 [DOI] [PMC free article] [PubMed] [Google Scholar]
- 32.Liu KH, Walker DI, Uppal K, et al. High-Resolution Metabolomics Assessment of Military Personnel: Evaluating Analytical Strategies for Chemical Detection. J Occup Environ Med. Aug 2016;58(8 Suppl 1):S53–61. doi: 10.1097/JOM.0000000000000773 [DOI] [PMC free article] [PubMed] [Google Scholar]
- 33.Chung BY, Choi SM, Roh TH, et al. Risk assessment of phthalates in pharmaceuticals. J Toxicol Environ Health A. 2019;82(5):351–360. doi: 10.1080/15287394.2019.1598053 [DOI] [PubMed] [Google Scholar]
- 34.Dominguez-Romero E, Scheringer M. A review of phthalate pharmacokinetics in human and rat: what factors drive phthalate distribution and partitioning? Drug Metab Rev. Aug 2019;51(3):314–329. doi: 10.1080/03602532.2019.1620762 [DOI] [PubMed] [Google Scholar]
- 35.A G, J S, R K, et al. Phthalate exposure in pregnant women with systemic lupus erythematous (SLE). Environmental Epidemiology. 2019;3:134. doi: 10.1097/01.EE9.0000607216.87044.7a [DOI] [Google Scholar]
- 36.Lanata C LT, Dall’Era M, Yazdany J, Katz PP, Trupin L, Helmick CG, Gerona R, Criswell LA. Identifying Exposures to Chemicals in Patients with SLE – a Non-Targeted Exposome Approach Reveals Enrichment for Phthalates [abstract]. Arthritis Rheumatol. 2017;69 (suppl 10) [Google Scholar]
- 37.Parks CG, D’Aloisio AA, Sandler DP. Early Life Factors Associated with Adult-Onset Systemic Lupus Erythematosus in Women. Front Immunol. 2016;7:103. doi: 10.3389/fimmu.2016.00103 [DOI] [PMC free article] [PubMed] [Google Scholar]
- 38.Parks CG, De Roos AJ. Pesticides, chemical and industrial exposures in relation to systemic lupus erythematosus. Lupus. May 2014;23(6):527–36. doi: 10.1177/0961203313511680 [DOI] [PMC free article] [PubMed] [Google Scholar]
- 39.Parks CG, Costenbader KH, Long S, Hofmann JN, Beane FLE, Sandler DP. Pesticide use and risk of systemic autoimmune diseases in the Agricultural Health Study. Environ Res. Jun 2022;209:112862. doi: 10.1016/j.envres.2022.112862 [DOI] [PMC free article] [PubMed] [Google Scholar]
- 40.Muszynski P, Brodowska MS, Paszko T. Occurrence and transformation of phenoxy acids in aquatic environment and photochemical methods of their removal: a review. Environ Sci Pollut Res Int. Jan 2020;27(2):1276–1293. doi: 10.1007/s11356-019-06510-2 [DOI] [PMC free article] [PubMed] [Google Scholar]
- 41.European Food Safety A, Arena M, Auteri D, et al. Peer review of the pesticide risk assessment of the active substance dichlorprop-P and variant dichlorprop-P-2-ethylhexyl. EFSA J. Jun 2018;16(6):e05288. doi: 10.2903/j.efsa.2018.5288 [DOI] [PMC free article] [PubMed] [Google Scholar]
- 42.Katsiari CG, Kyttaris VC, Juang YT, Tsokos GC. Protein phosphatase 2A is a negative regulator of IL-2 production in patients with systemic lupus erythematosus. J Clin Invest. Nov 2005;115(11):3193–204. doi: 10.1172/JCI24895 [DOI] [PMC free article] [PubMed] [Google Scholar]
- 43.Jones MR, Diez-Roux AV, Hajat A, et al. Race/ethnicity, residential segregation, and exposure to ambient air pollution: the Multi-Ethnic Study of Atherosclerosis (MESA). Am J Public Health. Nov 2014;104(11):2130–7. doi: 10.2105/AJPH.2014.302135 [DOI] [PMC free article] [PubMed] [Google Scholar]
- 44.Woo B, Kravitz-Wirtz N, Sass V, Crowder K, Teixeira S, Takeuchi DT. Residential Segregation and Racial/Ethnic Disparities in Ambient Air Pollution. Race Soc Probl. Mar 2019;11(1):60–67. doi: 10.1007/s12552-018-9254-0 [DOI] [PMC free article] [PubMed] [Google Scholar]
- 45.Christensen P, Sarmiento-Barbieri I, Timmins C. Housing Discrimination and the Toxics Exposure Gap in the United States: Evidence from the Rental Market. The Review of Economics and Statistics. 2020:1–37. doi: 10.1162/rest_a_00992 [DOI] [Google Scholar]
- 46.Gee GC, Payne-Sturges DC. Environmental health disparities: a framework integrating psychosocial and environmental concepts. Environ Health Perspect. Dec 2004;112(17):1645–53. doi: 10.1289/ehp.7074 [DOI] [PMC free article] [PubMed] [Google Scholar]
- 47.Attina TM, Malits J, Naidu M, Trasande L. Racial/ethnic disparities in disease burden and costs related to exposure to endocrine-disrupting chemicals in the United States: an exploratory analysis. Journal of clinical epidemiology. 2019;108:34–43. doi: 10.1016/j.jclinepi.2018.11.024 [DOI] [PMC free article] [PubMed] [Google Scholar]
- 48.Nystrom J, Benskin JP, Plassmann M, et al. Healthy eating index and diet diversity score as determinants of serum perfluoroalkyl acid (PFAA) concentrations in a national survey of Swedish adolescents. Environ Res. Sep 2022;212(Pt A):113170. doi: 10.1016/j.envres.2022.113170 [DOI] [PubMed] [Google Scholar]
- 49.Pelch KE, Reade A, Wolffe TAM, Kwiatkowski CF. PFAS health effects database: Protocol for a systematic evidence map. Environ Int. Sep 2019;130:104851. doi: 10.1016/j.envint.2019.05.045 [DOI] [PubMed] [Google Scholar]
- 50.Fenton SE, Ducatman A, Boobis A, et al. Per- and Polyfluoroalkyl Substance Toxicity and Human Health Review: Current State of Knowledge and Strategies for Informing Future Research. Environ Toxicol Chem. Mar 2021;40(3):606–630. doi: 10.1002/etc.4890 [DOI] [PMC free article] [PubMed] [Google Scholar]
- 51.Newsted J, Tazelaar D, Kristofco L, Losey B. A meta-analysis of the occurrence of alkylphenols and alkylphenol ethoxylates in surface waters and sediments in the United States between 2010 and 2020. Environ Pollut. Aug 1 2023;330:121757. doi: 10.1016/j.envpol.2023.121757 [DOI] [PubMed] [Google Scholar]
- 52.Rand AA, Rooney JP, Butt CM, Meyer JN, Mabury SA. Cellular toxicity associated with exposure to perfluorinated carboxylates (PFCAs) and their metabolic precursors. Chem Res Toxicol. Jan 21 2014;27(1):42–50. doi: 10.1021/tx400317p [DOI] [PubMed] [Google Scholar]
- 53.Wan HT, Lai KP, Wong CKC. Comparative Analysis of PFOS and PFOA Toxicity on Sertoli Cells. Environ Sci Technol. Mar 17 2020;54(6):3465–3475. doi: 10.1021/acs.est.0c00201 [DOI] [PubMed] [Google Scholar]
- 54.Galezowska G, Rogowska J, Olkowska E, Ratajczyk W, Wolska L. Environmental Risk Assessment Resulting from Sediment Contamination with Perfluoroalkyl Substances. Molecules. Dec 29 2020;26(1)doi: 10.3390/molecules26010116 [DOI] [PMC free article] [PubMed] [Google Scholar]
- 55.Cao Y, Ng C. Absorption, distribution, and toxicity of per- and polyfluoroalkyl substances (PFAS) in the brain: a review. Environ Sci Process Impacts. Nov 17 2021;23(11):1623–1640. doi: 10.1039/d1em00228g [DOI] [PubMed] [Google Scholar]
Associated Data
This section collects any data citations, data availability statements, or supplementary materials included in this article.