Abstract
Plants exposed to incidences of excessive temperatures activate heat-stress responses to cope with the physiological challenge and stimulate long-term acclimation1,2. The mechanism that senses cellular temperature for inducing thermotolerance is still unclear3. Here we show that TWA1 is a temperature-sensing transcriptional co-regulator that is needed for basal and acquired thermotolerance in Arabidopsis thaliana. At elevated temperatures, TWA1 changes its conformation and allows physical interaction with JASMONATE-ASSOCIATED MYC-LIKE (JAM) transcription factors and TOPLESS (TPL) and TOPLESS-RELATED (TPR) proteins for repressor complex assembly. TWA1 is a predicted intrinsically disordered protein that has a key thermosensory role functioning through an amino-terminal highly variable region. At elevated temperatures, TWA1 accumulates in nuclear subdomains, and physical interactions with JAM2 and TPL appear to be restricted to these nuclear subdomains. The transcriptional upregulation of the heat shock transcription factor A2 (HSFA2) and heat shock proteins depended on TWA1, and TWA1 orthologues provided different temperature thresholds, consistent with the sensor function in early signalling of heat stress. The identification of the plant thermosensors offers a molecular tool for adjusting thermal acclimation responses of crops by breeding and biotechnology, and a sensitive temperature switch for thermogenetics.
Subject terms: Heat, Plant hormones, Transcription
TWA1 is a temperature-sensing transcriptional co-regulator that is needed for basal and acquired thermotolerance in Arabidopsis thaliana.
Main
Climatic temperature gradients constrain growth and fitness of plants. Plant species have preferred temperatures with daytime optima that vary substantially from 10 °C for the cool-preferring viola to 35 °C for the tropical kapok tree4. Temperatures substantially exceeding the optimum trigger acclimation responses that involve development and the heat-stress response (HSR)2. Several plant thermosensors that regulate temperature-induced developmental processes are known, such as Ca2+channels, transcriptional regulators and light receptors5,6.
In metazoans, fungi and plants, heat triggers the HSR through HSF1 transcription factors (TFs)1,7. After release from inhibitory molecular chaperones8, HSF1 induces expression of heat-shock proteins (HSPs) and initiates adaptation. In plants, the HSR involves several phytohormone pathways9–13. A. thaliana mutants that are deficient in biosynthesis or insensitive to the phytohormone abscisic acid (ABA) are compromised in basal and acquired thermotolerance14.
ABA is the key signal to regulate the water status of plants by adjusting transpiration and water resorption to the demand of atmospheric CO2 for photosynthesis15,16. Under water deficit, ABA levels increase and induce protective measures including stomatal closing, differential gene expression, downregulation of chlorophylls and biosynthesis of osmolytes such as proline. In natural environments, heat and drought occur often combined and are the cause of major crop losses17. Stimulating ABA signalling through ABA receptors can reduce transpiration while sustaining photosynthesis and growth, therefore offering an option for a more water-efficient agriculture18. However, reduced transpiration increases leaf temperature and may thereby acerbate thermal stress during a heat wave. On the other hand, ABA promotes thermotolerance, and enhanced ABA signalling might be beneficial for heat acclimation.
Identification of TWA1
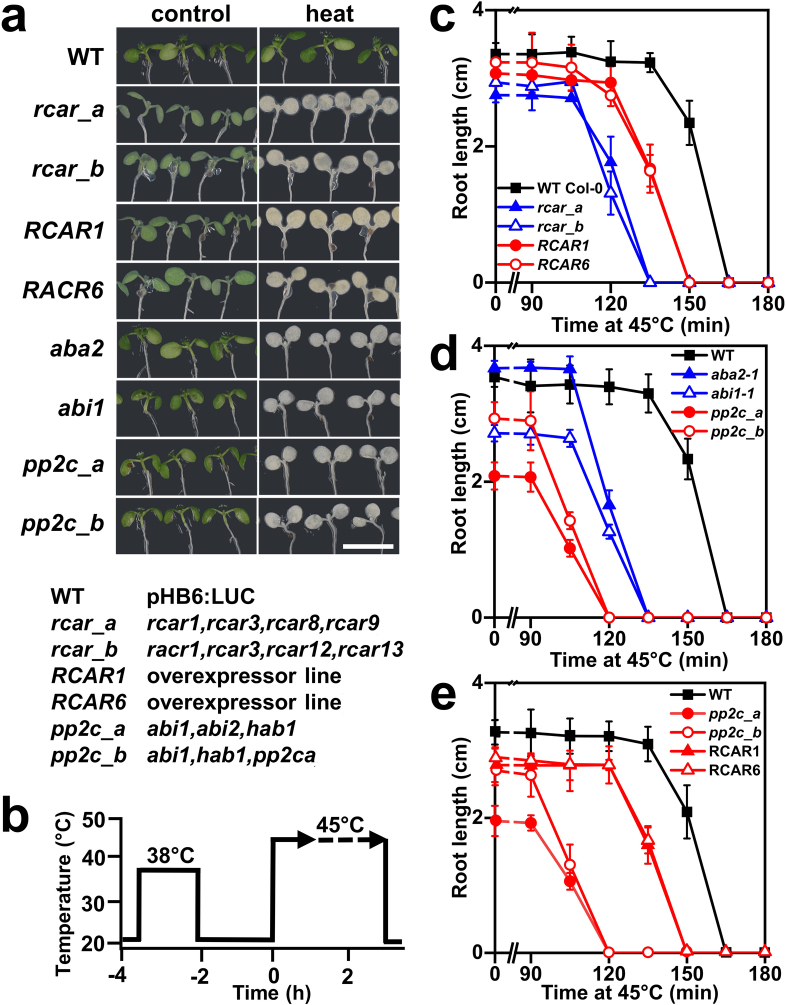
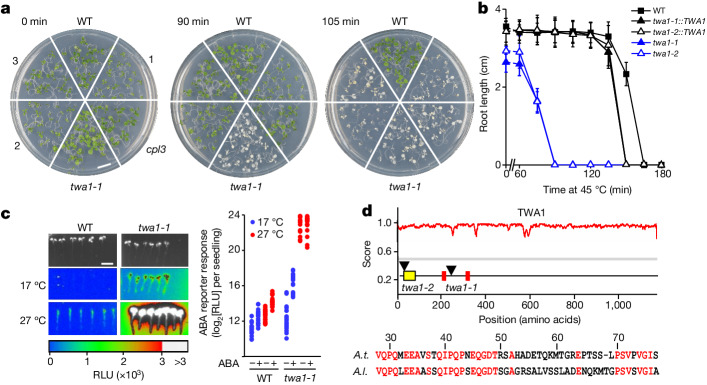
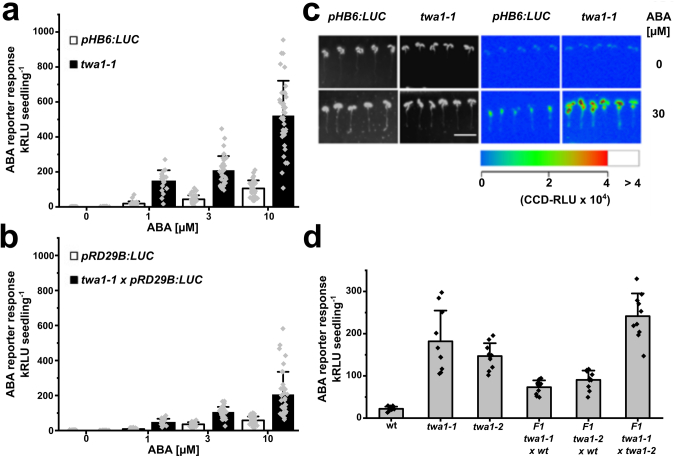
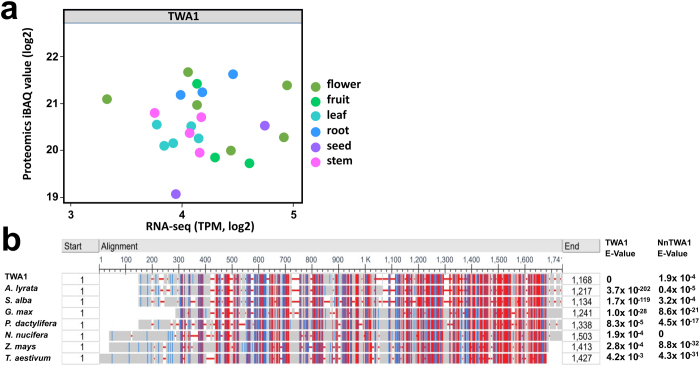
To better understand the role of ABA in heat tolerance, A. thaliana lines that are hyper-responsive or insensitive towards ABA were examined for alterations in acquired thermotolerance induced by a priming heat exposure. Ectopic expression of ABA receptors RCAR6 and RCAR1 or deficiency in ABA co-receptors encoded by type 2C protein phosphatases (PP2Cs) results in ABA hypersensitivity18,19, while deficiency in multiple ABA receptors leads to ABA hyposensitivity20,21. Seedlings with such changes in the ABA response, including previously analysed ABA mutants14, were exposed to a priming period at 38 °C followed by a recovery phase and a subsequent variable period of heat stress at 45 °C (Extended Data Fig. 1a,b). Both, ABA-hypersensitive and ABA-insensitive lines were more susceptible to heat stress compared with the wild type (WT; Extended Data Fig. 1a,c,d). The ABA-hypersensitive lines had a heat-sensitive phenotype irrespective of light (Extended Data Fig. 1e). The findings argue for a dual role of ABA during heat stress, that is, initially promoting thermotolerance but eventually being counterproductive for the acclimation process. ABA receptors and PP2C co-receptors control fast and slow responses including ion channels and aquaporins by fast post-translational control and differential gene expression for long-term adjustments15,16. ABA hypersensitivity at the level of gene expression is conferred by deficiency in the C-terminal domain phosphatase-like (CPL) family members such as CPL322. We examined the thermotolerance of the cpl3-knockout mutant and four additional mutants identified in a screen for ABA hypersensitivity using an ABA-responsive luciferase (LUC) reporter line23 (Methods). All of these mutants were more heat sensitive than the WT line (Fig. 1a). One mutant line showed a strongly enhanced thermosensitivity with a half-maximum inhibitory period (IP50) of approximately 75 min at 45 °C, whereas the pp2c triple mutant and WT lines had IP50 values of 105 min and 155 min, respectively (Fig. 1b and Extended Data Fig. 1d). The gene locus was named THERMO-WITH ABA-RESPONSE 1 (TWA1). In the presence of exogenous ABA, the induction of ABA-responsive LUC reporters was enhanced in the twa1-1 background (Fig. 1c and Extended Data Fig. 2a–c), indicating hyperactivation of ABA signalling. Shifting the temperature from 17 °C to 27 °C induced a 3-fold increase in reporter expression in WT plants but caused a more than 100-fold increase in the twa1-1 seedlings (Fig. 1c). The twa1-1 mutant showed partial haploinsufficiency in a cross with the WT (Extended Data Fig. 2d) and the affected gene (At5g13590) was identified (Methods). The TWA1 locus encodes a predicted 130 kDa intrinsically disordered protein of unknown function with two potential ethylene-responsive-element-binding-factor-associated amphiphilic repression (EAR) motifs (LxLxL)24 (Fig. 1d). A point mutation in the twa1-1 allele terminates translation after 247 amino acids. The transfer DNA (T-DNA) knockout line twa1-2 with disrupted TWA1 in the first exon was heat sensitive, comparable to twa1-1 (Fig. 1b). Transfer of a genomic fragment encompassing the TWA1 gene complemented the thermosensitivity of both mutants (Fig. 1b). TWA1 is expressed throughout the plant25 (Extended Data Fig. 3a).
Extended Data Fig. 1. Seedlings with enhanced ABA signalling are impaired in acquired thermotolerance.
a, Phenotypes of 5-day-old seedlings assayed for acquired tolerance. Pictures of wild type and lines with altered ABA response were taken one day after or without 150 min heat stress at 45 °C. Scale bar depicts 1 cm. b, Scheme of heat exposures in a. c, d, Inhibition of root growth in lines with reduced (blue) and increased ABA response (red) compared to WT (reporter line pHB6:LUC in Col-0 accession (d), or Col-0 (c)) exposed to 45 °C for different times. Inhibition was determined 5 days after stress. e, Inhibition of root growth by heat stress in the dark. 4 day-old acclimated seedlings of wild type, mutants pp2c_a and pp2c_b, and RCAR1 and RCAR6 overexpressing lines were exposed to 45 °C heat stress for the indicated times in darkness. Root extension was measured 5 days after treatment. c-e, Mean ± s.d. (n = 6). Statistical significance and source data are provided in the Supplementary Information (SI) File Extended Data Fig. 1.
Fig. 1. The TWA1 locus.
a, The A. thaliana twa1-1 mutant is conspicuously thermosensitive. Five-day-old seedlings of WT and mutants with ABA-hypersensitive gene regulation were exposed to 45 °C for 90 or 105 min or not after 90 min priming at 38 °C. Pictures were taken 5 days after heat stress. b, The acquired thermotolerance of WT, twa1-1 and twa1-2 plants, as well as mutants complemented with the TWA1 gene, that were assayed for root growth within 5 days after heat exposure as indicated. c, ABA-inducible pHB6:LUC expression in 5-day-old seedlings exposed to 1 µM ABA for 16 h at 17 °C or 27 °C. Left, photographs and light emission of WT and twa1-1 plants expressing the reporter. Right, reporter activity per seedling given in relative light units (RLU; n = 18). d, Prediction of intrinsically disordered regions (https://metapredict.net/) with maximum score of 1, and a schematic of TWA1, showing the highly variable region (HVR, yellow) and two EAR domains (red) (top). TWA1 disruption in mutants is shown by arrowheads. Bottom, amino acid identity (red) of the HVR from A. thaliana (A.t.) and A. lyrata (A.l.). For b, data are mean ± s.d.; n = 6 per datapoint. Experimental and statistical significance details are provided in the Methods and as Source Data.
Extended Data Fig. 2. Hypersensitive ABA reporter response of twa1 mutants.
a, Induction of luciferase activity by exogenous ABA in wild type reporter line pHB6:LUC and twa1-1 mutant of pHB6:LUC genotype. 5-day-old seedlings were exposed to ABA for 24 h before luminescence measurements (mean ± SD, n = 36 per data point). b, ABA-induced luciferase in wild type pRD29B:LUC reporter line and twa1-1 mutant in the pRD29B:LUC genotype analysed as in a. c, Life imaging of pHB6:LUC or twa1-1 seedlings exposed to no and 30 µM ABA. Bright field and light emission photographs in false colours for relative light units (CCD-RLU) per seedling. Scale bar: 1 cm. d, Partial haplo-insufficiency of twa1-1 and twa1-2 alleles. F1 crosses and lines homozygous for the reporter were exposed to 3 µM ABA for 24 h (mean ± SD, n = 10). Statistical significance in SI_Extended Fig. 2.
Extended Data Fig. 3. TWA1 expression and TWA1 homologues.
a, TWA protein and TWA1 transcript abundance according to ATHENA proteomics database (https://athena.proteomics.wzw.tum.de)25. TPM, transcripts per kilobase and million reads; iBAQ are summed peptide intensity per protein normalized to the number of expected peptides. b, Alignment of TWA1 homologues identified by BLASTp searches against plant genomes on NCBI. Amino acid sequences were aligned with NCBI’s COBALT71. Alignments in red indicate highly conserved regions and lower conservation is shown in blue. E-values were calculated by using FASTA (https://fasta.bioch.virginia.edu) with TWA1 and lotus NnTWA1 as reference. Sequences: TWA1 - NP_001331741.1, Arabidopsis lyrata - XP_002873619.1, Sinapis alba - AF8055519.1, Glycine max - KAG5128726.1, Nelumbo nucifera - A0A1U7ZPG7 and from monocots: Phoenix dactylifera - A0A8B7BGH8, Zea mays - XP_035823187.1, Triticum aestivum - XP_044429385.1.
Thermosensor function
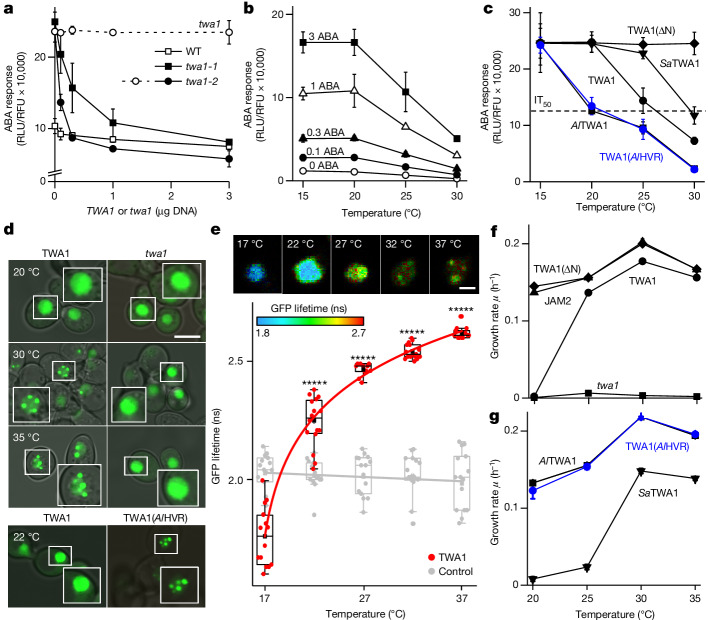
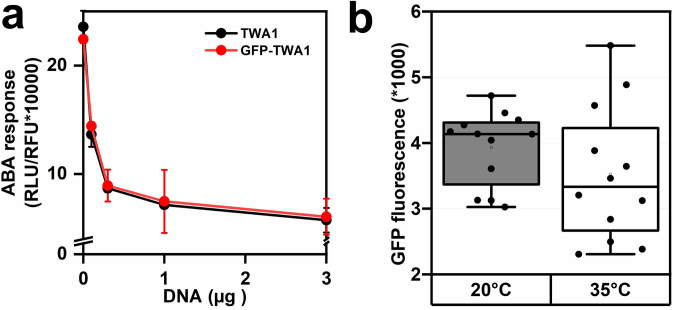
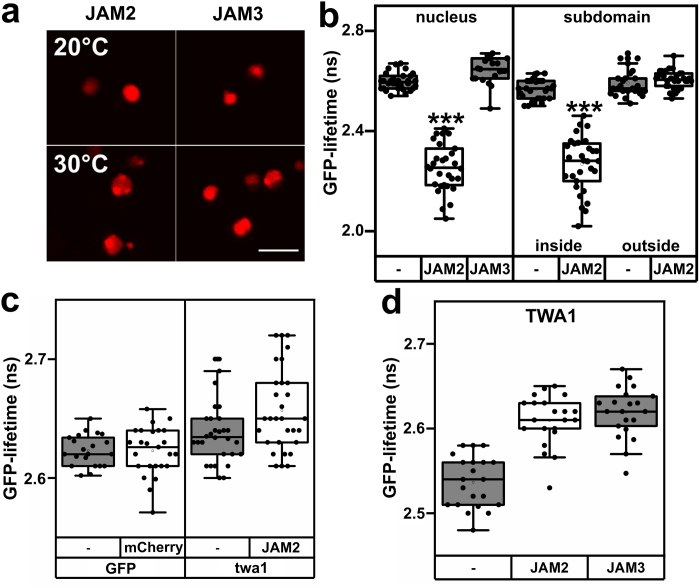
The ABA-hypersensitive reporter expression in twa1 mutants (Fig. 1c and Extended Data Fig. 2) implied that TWA1 has a gene-regulatory role. Transient TWA1 expression in leaf protoplasts resulted in a dose-dependent downregulation of an ABA-responsive reporter (Fig. 2a). The inhibitory response required functional TWA1 and was moderate in WT protoplasts but more conspicuous in protoplasts of twa1-1 and twa1-2 plants. The TWA1-mediated inhibition occurred irrespective of exogenous ABA and was temperature dependent (Fig. 2b,c). There was no detectable inhibition by TWA1 at 20 °C, while increasing the incubation temperature from the standard 25 °C to 30 °C increased the repressive effect (Fig. 2b). Homologues of TWA1 are found in monocots and dicots (Extended Data Fig. 3b). The coding sequences of TWA1 homologues from the cold acclimated lyrate rock cress Arabidopsis lyrata and white mustard Sinapis alba, which naturally occurs in Mediterranean climates, were isolated and AlTWA1 and SaTWA1 were expressed in twa1-2 protoplasts (Fig. 2c). At 30 °C, they inhibited expression of the ABA-responsive reporter, consistent with a conserved function as orthologues. However, the temperature dependence differed with half-maximum inhibitory values (IT50) of approximately 20 °C, 26 °C and 30 °C for AlTWA1, TWA1 and SaTWA1, respectively. High variability between the A. thaliana and A. lyrata orthologues occurs in a stretch of 20 amino acids within an amino-terminal region of TWA1 named HVR (Fig. 1d). We reasoned that the HVR might contribute to thermal sensing. Exchanging the HVR for the AlTWA1 domain in TWA1 was sufficient to change the thermoresponse of the TWA1(AlHVR) chimera to mimic that of AlTWA1 (Fig. 2c). The truncated TWA1(ΔN) with deletion of amino acid residues 1–554 was inactive in inhibiting gene expression (Fig. 2c). The findings imply a thermosensory function of TWA1 involving the HVR. The presence of EAR motifs suggested that TWA1 might function as a transcriptional coregulator like the NOVEL INTERACTOR OF JAZ26. The search for TWA1-interacting proteins using the yeast-two-hybrid (Y2H) system and indexed open-reading-frame libraries27 resulted in the identification of the JAM2 TF (Extended Data Fig. 4). JAM2 is involved in signalling of the phytohormone jasmonate (JA) by antagonizing the JA-promoting action of the TF MYC2, both as a homo- and heterodimer28,29. The related TFs JAM1–AIB30, JAM3 and MYC2 did not interact with TWA1 in the yeast analysis (Extended Data Fig. 4). The specific JAM2 binding to TWA1 was corroborated in yeast using Förster resonance energy transfer–fluorescence lifetime imaging (FRET–FLIM). FRET analysis of fluorophores requires proximity in the nanometre range (<10 nm) and it reduces the fluorescence lifetime (FL) of the excited donor fluorophore. Changes in the fluorophore distance affect the FRET signal by a power of six31. We used the protein fluorophores mono enhanced GFP (GFP) and mCherry with GFP–TWA1 as donor and mCherry-tagged JAM2 or JAM3 as an acceptor. GFP–TWA1 is functional (Extended Data Fig. 5a) and showed a preferential nuclear localization in yeast (Fig. 2d,e). TWA1 abundance was not significantly affected by temperature (Extended Data Fig. 5b); however, temperature affected nuclear TWA1 crowding. At 30 °C and 35 °C, GFP–TWA1 accumulated in nuclear subdomains, which was not observed at 20 °C or for the truncated product of twa1-1 (twa1 product, Fig. 2d). mCherry-tagged JAM2 and JAM3 revealed a nuclear localization (Extended Data Fig. 6a). TWA1 physically interacted with JAM2 at 30 °C specifically within the nuclear subdomains, whereas JAM3 never detectably did (Extended Data Fig. 6b). JAM2 interaction was not observed with the twa1 product (Extended Data Fig. 6c) and not with TWA1 at 20 °C (Extended Data Fig. 6d) and therefore correlated with TWA1 aggregation in nuclear subdomains. In contrast to GFP–TWA1, GFP–TWA1(AlHVR) accumulated in nuclear subdomains already at 22 °C, consistent with a regulatory role of the HVR domain for TWA1 crowding (Fig. 2d). Intramolecular FRET–FLIM analysis of TWA1 in live yeast revealed proximity of the amino and carboxy termini at 17 °C (Fig. 2e). An increase in temperature moved the terminal domains of the sensor apart, as evidenced by the FL increase.
Fig. 2. The thermosensor function of TWA1.
a–c, TWA1 and TWA1 variants inhibit ABA-responsive pRD29B:LUC expression in leaf protoplasts. a, Protoplasts of WT, twa1-1 and twa1-2 plants were transfected with a TWA1or twa1-1 expression cassette (shown as µg DNA per 105 protoplasts), incubated for 16 h at 25 °C with 10 µM ABA. Relative light units were normalized to fluorescence units of a co-transfected control (RFU). The dashed line indicates expression of mutant twa1 product in twa1-2 protoplasts. b, TWA1 action at different exogenous ABA levels. c, The action of TWA1 and variants at different incubation temperatures with 0.3 µg effector DNA per 105 twa1-2 protoplasts. The variants included TWA1(ΔN), A. lyrata AlTWA1, mustard SaTWA1 and TWA1(AlHVR). d, Top, GFP–tagged TWA1 and twa1 product in yeast nuclei and temperature-dependent phase separation. Bottom, nuclear subdomain formation of TWA1(AlHVR) at 22 °C. Insets: 1.5-fold magnifications. Scale bar, 10 μm. See the ‘Statistics and reproducibility’ section of the Methods. e, Temperature-induced changes in the proximity of TWA1 amino- and carboxy-terminal domains as revealed by intramolecular FRET–FLIM analysis. Top, false-colour images of GFP FLs of mCherry–TWA1–GFP (TWA1) in yeast nuclei. Scale bar, 2 µm. Bottom, GFP FL of TWA1 and mCherry–GFP. n = 10–15 per datapoint. Statistical analysis was performed using Student’s t-tests; *****P = 10−5. For the box plots, the centre line shows the median, the box limits show the upper (25th percentile) and lower (75th percentile) quartiles, and the whiskers show 1.5× the interquartile range. f,g, The temperature dependence of JAM2 binding to TWA1 and variants including the twa1 product (f) and binding to orthologues (g) was analysed using a Y2H growth assay. The growth rate µ was calculated on the basis of cell density increase within 24 h. JAM2–JAM2 dimerization served as the control (Extended Data Fig. 7). For a–c,f,g, n = 3 per datapoint. Statistical significance details are provided as Source Data.
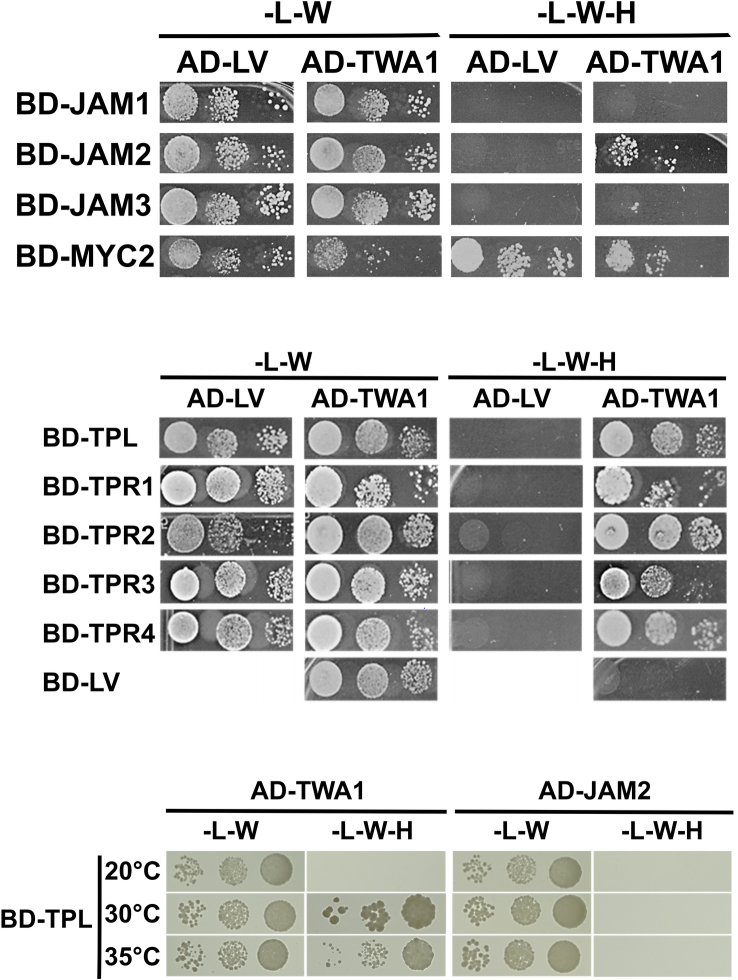
Extended Data Fig. 4. Yeast-Two-Hybrid analysis of TWA1-protein interaction.
Top, Physical interaction of TWA1 with JAM transcription factors of A. thaliana. TWA1 fused to the GAL4-activation domain (AD) was assayed for interaction with JAMs/MYC2 fused to Gal 4-DNA binding domain (BD) at 30 °C. Middle, transcriptional corepressors TPL and TPRs bind to TWA1 at 30 °C. Bottom, the interaction of TPL with the thermosensor is temperature dependent. Yeasts were grown in the absence of leucine and tryptophan (-L-W), and with or without histidine (H) using serial tenfold culture dilutions. Controls are empty expression cassettes (LV).
Extended Data Fig. 5. GFP-TWA1 is functional in protoplasts and GFP-TWA1 abundance in response to temperature in yeast.
a, Capacity of TWA1 and GFP-TWA1 to inhibit ABA signalling in twa1-2 protoplasts. The ABA-responsive luciferase reporter (pRD29B:LUC construct) was induced by 10 µM exogenous ABA. Protoplasts were transfected with DNA of the effector expression cassettes (0 to 3 µg DNA/105 protoplasts) and incubated for 16 h at 25 °C before determination of the reporter activity (RLU) normalized to a cotransfected control (RFU). Data are mean ± SD, n = 3. b, GFP fluorescence in nuclei (n = 12) of yeast cells expressing GFP-TWA1 grown at 20 °C and 35 °C. The GFP signal was normalized to background fluorescence. Differences were statistically not significant (two-sided Mann-Whitney U Test, P = 0.30). Box plots: centre line, median; box limits, upper (25th percentile) and lower quartils (75th percentile); whiskers, 1.5 times interquartile range. Statistical significance in SI_Extended Fig. 5.
Extended Data Fig. 6. Analysis of JAM2 and JAM3 in yeast.
a, Fluorescence of mCherry-tagged JAM2 and JAM3 in yeast nuclei at 20 °C (Top) and 30 °C (Bottom). Scale bar 5 µm. b, FRET-FLIM analysis of GFP-TWA1 with mCherry-tagged acceptor proteins JAM2, JAM3, or no acceptor (−) at 30 °C in the yeast nucleus. Reduction of TWA1 fluorescence lifetime by JAM2 expression indicates proximity of the proteins which occurred within nuclear subdomains (see a). Asterisks indicate a significant difference (JAM2, nucleus, P = 0.009; JAM2, inside subdomain, P = 0.008; two-sided Mann-Whitney U test, 20-30 cells). c, Protein interaction analysis of mCherry-tagged JAM2 with GFP and GFP-twa1 product (twa1). The analysis with non-fused mCherry protein is shown as a control (−). Two-sided Mann-Whitney U-Test, P = 0.82 (JAM2, twa1); P = 0.68 (mCherry, GFP); n = 20−30. d, No detectable interaction of TWA1 with JAM2 at 20 °C in yeast nucleus. FRET-FLIM analysis with GFP-TWA1 (−) and GFP-TWA1 with mCherry-tagged acceptor proteins JAM2 and JAM3 (two-sided Mann-Whitney U-Test, P = 0.24 (JAM2, TWA1); P = 0.07 (JAM3, TWA1); n = 20−30. Box plots as in SI Extended Data Fig. 5. Statistical significance in SI_Extended Fig. 6.
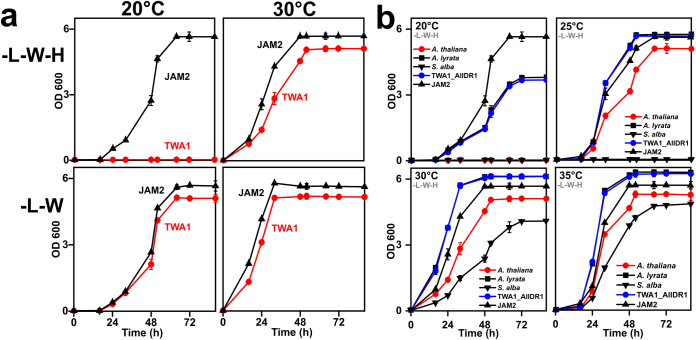
As protein–protein interaction in the Y2H32 system provides histidine-autotrophic growth, this read-out enabled examination of the temperature dependence of JAM2 binding to TWA1. At 20 °C, little to no growth occurred with the JAM2–TWA1 pair compared with the dimer-forming JAM2–JAM2 combination under the histidine-selective condition (Extended Data Fig. 7a). Increasing the incubation temperature to 30 °C resulted in histidine-autotrophic growth of JAM2–TWA1-expressing yeast, consistent with the physical interaction of both proteins at permissive temperatures. Thus, yeast growth rates at different temperatures provided a proxy for JAM2–TWA1 interaction, with JAM2 dimerization serving as a reference (Fig. 2f and Extended Data Fig. 7b). In the temperature interval of 20 °C to 25 °C, TWA1 switches from undetectable to close to maximum JAM2 interaction. JAM2 did not bind to the twa1 product, whereas it interacted with TWA1(ΔN), deleted for the first 554 amino acid residues, at all temperatures (Fig. 2f). In contrast to TWA1, AlTWA1 supported yeast growth at 20 °C, whereas SaTWA1 required temperatures of around 30 °C for optimal growth (Fig. 2g and Extended Data Fig. 7b). TWA1(AlHVR) and AlTWA1 were indistinguishable in this analysis (Fig. 2g), consistent with the results of the plant cell analysis of the thermal characteristics of both sensor proteins (Fig. 2c). The findings reveal a role of the amino-terminal HVR for the temperature-dependent regulation of JAM2 binding to the carboxy-terminal half of TWA1.
Extended Data Fig. 7. Dependency of JAM2 interaction with TWA1 and TWA1 orthologues on temperature.
a, Temperature dependence of JAM2 binding to TWA1 and variants. Y2H growth assay for histidine autotrophy. The JAM2-JAM2 pair (JAM2) served as positive control. b, Histidine autotrophic yeast growth in the Y2H assay provided by the binding of JAM2 fusion with Gal4-BD to Gal4-AD fusions of JAM2 (JAM2), TWA1, and orthologues from A. lyrata, S. alba, and a TWA1 version in which the Arabidopsis HVR has been exchanged for the corresponding domain of A. lyrata (TWA1_AlHVR). a, b, The inoculum was 0.020 optical density (OD) at wavelength 600 nm in growth medium lacking leucine, tryptophan, and histidine (-L,-W,-H), and data are mean ± SD, n = 3 per data point).
TWA1-mediated transcriptional regulation
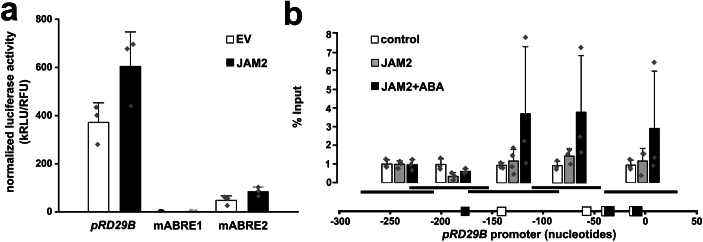
The EAR domain provides an interaction surface for the co-repressors TPL and TPRs, which suppress transcription and interact with the Mediator complex24,33. Y2H analysis revealed binding of TPL/TPRs to TWA1 (Extended Data Fig. 4). The TWA1 inhibitory action on ABA-dependent gene expression required TPL/TPRs in A. thaliana protoplasts. TWA1 did not inhibit reporter expression in the triple tpl tpr2 tpr4 mutant (Fig. 3a). Expression of TPL or TPR2 recovered TWA1-mediated gene regulation in the triple mutant, confirming a function of the co-repressors in the TWA1-mediated downregulation (Fig. 3a). Similarly, protoplasts of the jam1 jam2 jam3 triple mutant were unresponsive to ectopic TWA1 expression unless JAM1 or JAM2 were co-expressed (Fig. 3b). JAMs and MYC2 are basic helix-loop-helix TFs that compete for binding to G-box cis-elements and related motifs28,29 that include the ABA-responsive regulatory element34. Chromatin immunoprecipitation revealed that JAM2 binds to the ABA-responsive RD29B promoter close to the transcription start site and this interaction depended on both ABA and an ABA-responsive regulatory element (Extended Data Fig. 8a,b).
Fig. 3. The molecular mechanism of TWA1-mediated transcriptional repression.
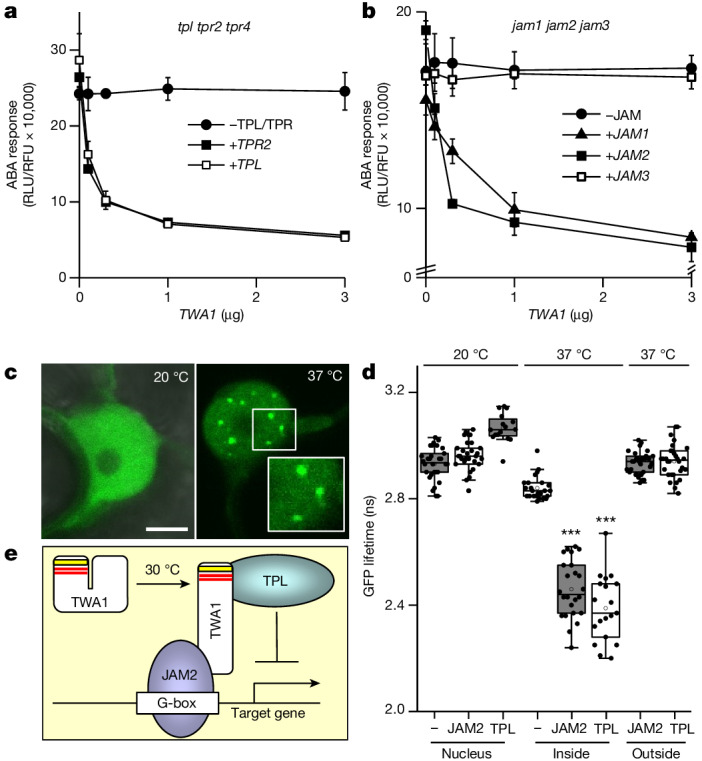
a, TPL and TPR corepressors are required for TWA1-inhibited reporter expression. Protoplasts of tpl tpr2 tpr4 triple-mutant plants were transfected with TWA1, TPL and TPR2 effector DNA. b, JAM1 and JAM2 co-expression rescues the TWA1 response in protoplasts of jam1 jam2 jam3 plants. For a,b, ABA response analysis was performed as in Fig. 2b with 3 µg effector DNA per 105 protoplasts. c,d, Accumulation and binding of GFP–TWA1 to JAM2 and TPL in nuclear subdomains of N. benthamiana epidermal cells. GFP–TWA1 and mCherry-tagged JAM2 or TPL were transiently expressed in leaves exposed to 37 °C for 2 h or kept at 20 °C. c, GFP imaging in the nucleus (see the ‘Statistics and reproducibility’ section in the Methods). Scale bar, 5 μm; insets are 1.5-fold magnifications. d, FRET–FLIM analysis. Statistical analysis was performed using two-sided Mann–Whitney U-tests; ***P = 0.005. n = 20–30 cells. Box plots are as described in Fig. 2e. e, Simplified model of repressor complex formation. Temperature transitions from 20 °C to 30 °C induce conformational changes in TWA1 that allow JAM2 binding to the carboxy-terminal part of TWA1 and TPL binding to the amino-terminal domain through EAR motifs (red). The HVR (yellow) is integral to thermosensing. JAM2 interacts with G-box-related cis-elements as dimers. TPL is tetrameric and targets subunits of the Mediator complex33. Statistical significance details are provided as Source Data.
Extended Data Fig. 8. Transactivation and binding of JAM2 to the vicinity of the transcription start site within the RD29B promoter.
a, Enhanced ABA response by ectopic expression of JAM2. Protoplasts of wild type were transfected with JAM2 effector cassette (3 µg DNA/105 protoplasts) and the promoter pRD29B or pRD29B with mutated ABA-responsive cis elements (ABRE), mABRE1 or mABRE2, driving luciferase expression. After incubation in the presence of 10 µM ABA for 16 h, the luciferase activity was measured (kRLU/RFU), (mean ± SD, n = 3). b, JAM2 interaction with RD29B is stimulated in the presence of ABA. Top, ChIP analysis of the promoter region of RD29B. Bottom, Scheme of pRD29B with the transcriptional start site at position 1. ABREs (motif ACGTG) are signified by filled boxes and their nucleotide distance relative to the start site is given with ABRE1 and ABRE2 closest and next closest to the start site respectively. Potential JAM2 binding sites, that is imperfect G-boxes with one nucleotide deviation from the core CACGTG motif83, are indicated with open boxes. Middle, the positions of the amplified DNA fragments are shown. Protoplasts were analysed after transient expression of JAM2 effector (3 µg DNA/105 protoplasts) or not (control) with or without 10 µM ABA (mean ± s.e.m., n = 3-4).
The physical interaction of TWA1 with TPL and JAM2 was confirmed using FRET–FLIM in Nicotiana benthamiana. Transient expression of GFP-tagged TWA1 in epidermal cells showed a nuclear localization of TWA1 that accumulated in subdomains (Fig. 3c), similar to the yeast analysis (Fig. 2d). FRET–FLIM supported binding of TPL to TWA1 and corroborated the TWA1–JAM2 complex formation at 37 °C (Fig. 3d). Both interactions occurred specifically in these nuclear subdomains but not at 20 °C (Fig. 3d). The data support the model in which elevated temperatures induce intramolecular rearrangements of TWA1 that allow interaction with JAM2 and TPL for assembly of the transcriptional repressor complex (Fig. 3e) in nuclear subdomains.
Thermotolerance conferred by TWA1
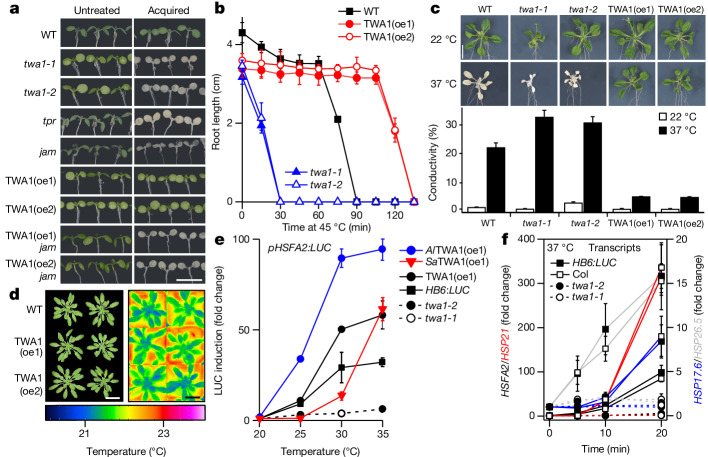
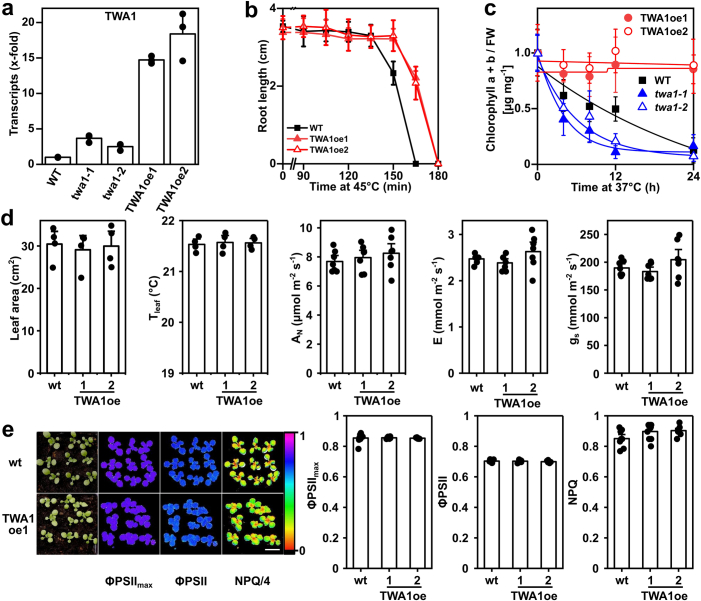
In agreement with the functional interactions of TWA1 with TPL/TPR and JAM proteins, seedlings of the jam1 jam2 jam3 and tpl tpr2 tpr4 triple mutants showed a compromised acquired thermotolerance like twa1-1 and twa1-2 plants (Fig. 4a). Ectopic TWA1 expression under the viral 35S promoter resulted in 15- and 18-fold increased TWA1 transcript levels in the twa1-2 mutant compared with in the WT in two representative TWA1-overexpression (TWA1(oe)) lines (Extended Data Fig. 9a), which exhibited higher acquired (Fig. 4a and Extended Data Fig. 9b) and basal (Fig. 4b) thermotolerance. The thermotolerance conferred by TWA1 expression depended on JAMs, as shown by the thermosensitivity of TWA1(oe) lines in the jam1 jam2 jam3 genotype (Fig. 4a). A. thaliana seedlings that were exposed to 37 °C responded with chlorophyll loss that was enhanced in twa1 mutants and ameliorated by ectopic TWA1 expression compared with the WT (Extended Data Fig. 9c). The improved basal thermotolerance of the TWA1(oe) lines was also evident in the reduced ion leakage of 3-week-old plantlets that were exposed for 24 h to 37 °C (Fig. 4c). Notably, the TWA1(oe) lines cultivated at ambient conditions were indistinguishable from the WT in growth, photosynthesis and gas-exchange parameters (Fig. 4d and Extended Data Fig. 9d,e).
Fig. 4. Thermotolerance and heat shock transcripts are controlled by TWA1.
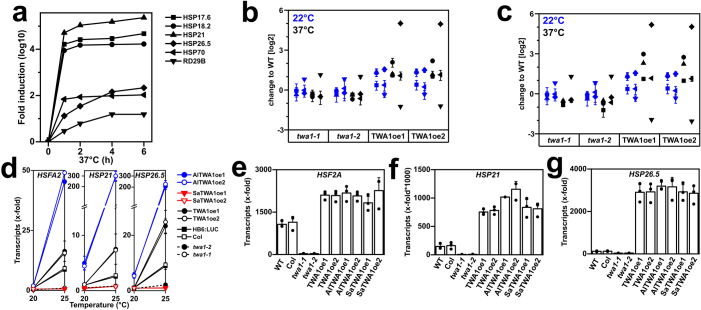
a, Acquired thermotolerance depends on TPL/TPR-type corepressors and on JAM TFs with loss of thermotolerance conferred by TWA1 expression (TWA1(oe) lines) in jam1 jam2 jam3 (jam) plants. TWA1 was expressed under the viral 35S promoter in twa1-2 plants. tpr signifies the tpl tpr2 tpr4 genotype. Photographs were taken 1 day after heat stress (150 min, 45 °C) or without heat stress. Scale bar, 1 cm. b, The basal thermotolerance of 5-day-old seedlings. Root growth analysis as in Fig. 1b but without priming. c, Ion leakage of 3-week-old plantlets that were exposed to 37 °C for 24 h or kept at 22 °C. Ion leakage was expressed relative to maximum leakage by boiling. Data are mean ± s.d. n = 12 from three repetitions. Scale bar, 1 cm. d, Improved thermotolerance of TWA1(oe) lines without trade-offs in growth or changes in apparent photosynthetic parameters (Extended Data Fig. 9d,e). Photograph of plants grown for 38 days under short-day conditions at 22 °C and thermal images in false colours. Scale bars, 3 cm. e, Temperature- and TWA1-dependent induction of the HSFA2 promoter driving LUC expression in leaf protoplasts of different lines. Analysis was performed as in Fig. 3a. Expression of AlTWA1 and SaTWA1 in twa1-2 plants. Data are mean ± s.d. n = 3 per datapoint. f, Transcript changes in 5-day-old WT and twa1 seedlings grown at 20 °C and exposed to 37 °C for up to 20 min. The transcript level at t = 0 was set to 1. Data are mean ± s.d. n = 3, 10 seedlings per n. Statistical analysis details for b,c,e are provided as Source Data.
Extended Data Fig. 9. Ectopic expression of TWA1 enhances thermotolerance but does not affect growth and photosynthesis.
a, TWA1 transcript levels in two representative TWA1-overexpressing (TWA1oe) lines in comparison to wild type and the twa1 mutants. 5-d old seedlings were analysed for TWA1 transcript abundance by RT-qPCR with UBC9, UBI10 and TIP41L transcripts as reference. Ectopic TWA1 expression was under the control of the viral 35 S promoter in twa1-2 mutant background. The TWA1 transcript level in wild type (pHB6:LUC) was set to 1 and fold change of abundance in mutants and TWA1oe lines is presented. Data are mean ± SD, n = 3, ten seedlings per n. b, Enhanced acquired thermotolerance of TWA1oe lines. Inhibition of root growth in TWA1oe lines (red) compared to WT in response to various 45 °C exposure times (mean ± s.d., n = 6). c, Basal thermotolerance is improved in TWA1oe lines and impaired in twa1-1 and twa1-2. Chlorophyll content per fresh weight of 5d-old seedlings one day after exposure to 37 °C as indicated (mean ± s.d., n = 15 from three repetitions). The chlorophyll content at t = 0 was set to 1. d, e, Improved thermotolerance of TWA1oe lines without tradeoffs in growth and changes in apparent photosynthetic parameters. Comparison of total leaf area (leaf area; n = 4), leaf temperature (Tleaf; n = 4), net photosynthesis (An; n = 7), transpiration (E; n = 7), and stomatal conductance (gs; n = 7) of plants grown for 38 days at short-day conditions with 22 °C daytime temperature and 150 µmol m−2 s−1 photosynthetic active radiation (mean ± s.e.m.). e, 20-day-old plantlets analysed for maximum quantum efficiency of photosystem II (FPSIImax), quantum efficiency of photosystem II (FPSII), and non-photochemical quenching (NPQ). No statistically significant differences were found (n = 9; P > 0.05, one-way ANOVA). Left, Values are expressed in false colours. Right, mean ± s.e.m. Statistical analysis for b-e is provided in SI Extended Data Fig. 9.
The enhanced thermotolerance by TWA1 expression might be caused by a preinduced HSR due to constitutive upregulation of HSP transcripts35–41. We examined the possibility. In WT seedlings, a temperature shift to priming periods at 37 °C induced transcripts for small HSPs and the major ATP-dependent chaperone HSP70 as part of the HSR (Extended Data Fig. 10a). At ambient temperatures, the levels of these transcripts were similar to the WT in TWA1-deficient and TWA1(oe) lines, therefore not supporting preinduction of HSR transcripts in the TWA1(oe) lines (Extended Data Fig. 10b,c). A 4 h priming phase increased HSP transcript levels in the TWA1(oe) lines up to 30-fold higher for HSP26.5 compared with the WT, while the increases were marginally reduced in both twa1 mutants (Extended Data Fig. 10b,c). Given the IT50 value of TWA1 around 26 °C, the induction of early HSR transcripts was monitored at lower temperatures. First, we used the activation of the HSFA2 promoter as a readout. The HSFA2 promoter is directly targeted by the master HSF1-class TFs, HSFA1s in plants, and the HSFA2 induction is HSFA1 dependent and sufficient for establishing heat tolerance36,37. In WT protoplasts, a shift from 20 °C to 25 °C increased HSFA2-promoter-driven LUC expression with optimal values at 30 °C and 35 °C (Fig. 4e).
Extended Data Fig. 10. Transcript levels in seedlings expressing TWA1 or TWA1 orthologs in comparison to wild type and twa1 mutants.
a, Left, Changes in transcript abundance for HSPs and ABA-induced RD29B in wild type of 5 days-old seedlings exposed to a shift from 22 °C to 37 °C for up to 6 h. Transcripts were quantified by realtime PCR after 4 h recovery at 22 °C. The transcript level in WT (pHB6:LUC) without heat treatment was set to 1. b, Transcript changes in TWA1-deficient and TWAoe lines compared to WT as in a, with 37 °C exposure for 4 h (treatment and symbols as in a. Transcripts were analysed by RT-PCR). c, Analysis as in b, however, with a recovery time of 0.5 h. d, Transcript changes of HSFA2, HSP21, and HSP26.5 affected by TWA1 and orthologs in 5-d old seedlings from ten different lines grown at 20 °C and exposed for 1 h to 25 °C, or kept at 20 °C, with 0.5 h recovery period at 20 °C prior to RT-qPCR analysis. e-g, Transcript abundance in A. thaliana seedlings grown at 20 °C and exposed to 35 °C for 1 h after 30 min recovery at 20 °C that expressed TWA1, the orthologues from A. lyrata AlTWA1 and Sinapis alba SaTWA1 under the control of the viral 35 S promoter in the twa1-2 background. The analysis of two representative lines is shown in comparison to WT lines (pHB6:LUC and Col-0) and both twa1 mutants for e, HSFA2, f, HSP21 and g, HSP26.5 transcript levels. The transcript abundance of WT pHB6:LUC line at 20 °C is set to 1. a-g, Data are mean ± s.d., n = 3, ten seedlings per n. Statistical significance in SI_Extended Fig. 10.
The induction did not occur in twa1 protoplasts and was enhanced in TWA1(oe) cells (Fig. 4e). A thermal response shift to lower and higher temperatures occurred in protoplasts from AlTWA1(oe1) and SaTWA1(oe1) plants expressing the lyrate and mustard orthologue in the twa1-2 genotype compared with protoplasts of the WT and TWA1(oe) plants (Fig. 4e). The TWA1 dependence of the response was corroborated by transcript analysis of seedlings that were exposed to a 1 h temperature shift from 20 °C to 25 °C (Extended Data Fig. 10d). Compared with the WT, the transcript increase for HSFA2, HSP21 and HSP26.5 was supressed in twa1-1, twa1-2 and SaTWA1(oe) seedlings, while it was enhanced in TWA1(oe) and AlTWA1-expressing seedlings (Extended Data Fig. 10d). At 35 °C, the transcript levels were comparable in SaTWA1(oe), TWA1(oe) and AlTWA1(oe) seedlings and consistently higher than in the WT (Extended Data Fig. 10e–g). To further elucidate the role of TWA1, WT and TWA1-deficient A. thaliana seedlings were exposed to 5 up to 20 minutes of heat stress (Fig. 4f). The transcript levels of HSFA2, HSP17.6, HSP21 and HSP26.5 were clearly induced in both WT lines but did not change in both twa1 mutants, in agreement with a positive regulatory function of the thermosensor for the upregulation of HSR transcripts.
In summary, our study reveals a thermosensor function of TWA1 that is required for heat tolerance and timely induction of HSFA2 and HSP transcripts in A. thaliana. The HSR is triggered by activation of key HSF1-type TFs. In A. thaliana, three related HSFA1s redundantly initiate the HSR38. The combined inactivity of two of those master TFs still allows HSFA2 induction and thermotolerance to heat-induced ion leakage39,41. Both responses are impaired in plants with TWA1 deficiency, supporting an action of the thermosensor upstream of HSFA1s or, alternatively, in parallel. Ectopic expression of constitutively active HSFA1 TFs39,40 and of TWA1 provide improved thermotolerance. Constitutive heat tolerance by HSFA1 is associated with preinduced HSR and growth penalty39, traits that are also conferred by ectopic HSFA2 and HSFA3 expression35,37. However, neither adverse physiological effect was observed in TWA1-mediated heat tolerance. Moreover, the induction of HSR transcripts within minutes required a functional TWA1. The findings point to an inducible protective function of TWA1 in early signalling in response to temperature rise.
Thermal activation of TWA1 involves the HVR and temperature-induced domain rearrangements that control the binding of JAM2 and repressor proteins. The role of TWA1 bears parallels to the thermosensor EARLY FLOWERING 3 (ELF3)6. ELF3 is a component of the evening complex, which functions as a transcriptional co-repressor in the control of the circadian clock and flowering time in A. thaliana. Thermally, TWA1 acts in the opposite manner to ELF3 by repressing gene expression at elevated temperatures, and it responds more sensitively to temperature changes. The TWA1 response has an apparent Q10 value of around 150, that is, a 10 °C difference can induce a 150-fold change in activity as deduced from growth rates in Y2H analyses (Methods). This responsiveness of TWA1 is in the range of the most thermosensitive proteins known, including members of the TRPA1 Ca2+channel of snake42 and mosquitos43 that are used for thermal prey localization. In eukaryotes, heat stress induces cytosolic and organellar stress granules pioneered in plants44 and the formation of nuclear subdomains that are reversible aggregates of proteins and RNA for cellular adaptation to thermal challenges8,45–47. Liquid–liquid phase separation (LLPS) has a prominent role in the formation of multilayered nuclear subdomains as sites of active gene expression48. After thermal activation, TWA1 accumulated in nuclear subdomains that are reminiscent of LLPS. These subdomains are the sites for TWA1 interaction with JAM2 and TPL, indicating the formation of active repressor complexes specifically in the presumed LLPS. Proteins with intrinsically disordered regions have a propensity for LLPS49 and include plant proteins with a prion-like domain50,51. Under heat stress, the intrinsically disordered region of the yeast HSF1 promotes condensate formation and multiple chromatin interactions for transcription within a single LLPS52. The temperature-sensing mechanism leading to HSF1 activation in yeast and mammals is still not clarified, while there is mounting evidence for the chaperone HSF1 titration model8.
TWA1-type sensors might be unique to plants. TWA1 sensed sub-heat temperature elevations between 20 °C and 30 °C and was required for the induction of early HSR transcripts. However, after a 4 h priming phase, HSP transcript levels were comparable between the WT and twa1 mutants, implying additional modes of transcript upregulation. In plants, heat-triggered increases in hydrogen peroxide53,54 and nitrogen oxide55 activate HSFA1s and allow for redox signal integration into the HSR. TWA1 possibly provides another node of signal integration. Plants frequently experience combined stress with the challenge to integrate conflicting single stress responses56. For example, the ABA-mediated proline increase under water deficit provides protective osmolytes, but high proline levels are toxic under heat57. TWA1 probably orchestrates the acclimation responses by integrating temperature with ABA and JA signalling58 that relay abiotic and biotic cues, respectively. In the future, using TWA1-type temperature sensors with different thermal characteristics through breeding and biotechnology will enable the adjustment of the acclimation responses of crops to a warming climate59. Moreover, TWA1 and its orthologues provide prototypes for engineering temperature switches in the emerging field of thermogenetics60.
Methods
Plant materials and growth conditions
Plants of A. thaliana Heynh. ecotype Col and La-er were grown in pots on a perlite/soil mixture at 22 °C under long-day conditions with 16 h light (150 µE m−2 s−1) unless otherwise stated. The plants were used for stable transformation, protoplast preparation and DNA extraction. A. thaliana seedlings were grown on agar plates with half-strength Murashige and Skoog agar medium for physiological assays as previously described61. For thermotolerance tests, growth conditions were as reported previously14. T-DNA knockout lines of the GABI-Kat collection62, including GK-476H03 (At5g13590; twa1-2) and SALK collection63 including SALK_143411 (At2g33540; designated cpl3-10) were obtained from The European Arabidopsis Stock Centre.
The JAM2/bHLH013 (At1g01260) gene was inactivated in the pHB6:LUC line using the CRISPR–Cas9 system64,65 and vector pDGE63, (Addgene plasmid, 79445). Two independent jam2 isolates contained a frameshift, which resulted in early termination of translation after amino acid 12 and we designated them as jam2-2. DNA-sequencing analysis revealed the absence of off-target mutations in the closely related genes JAM1/bHLH017 (At2g46510) and JAM3/bHLH003 (At4g16430). The triple mutant jam1-2 jam2-2 jam3-2 (jam) was generated by crossing jam2-2, jam1-2 (GK_285E09) and jam3-2 (GK_301G05)28 plants and selecting for the homozygous jam mutant in the offspring. Similarly, the tpl-8 tpr2-2 tpr4-2 triple mutant (tpr) was obtained by crossing tpl-8 (SALK_036566) with SALK_112730 (tpr2-2) and SALK_002209 (designated tpr4-2) plants. The generation of RCAR1- and RCAR6-overexpressing lines has been reported previously61. Quadruple RCAR-knockout lines were obtained by combining the multiple PYR/PYL knockout line pyr1 pyl1 pyl2 pyl4 pyl5 pyl866, the rcar9 mutant67 and lines SALK_083621 (rcar1) and GK-012D02 (rcar13). The triple mutants abi1-2 abi2-2 hab1-1 (pp2c_a) and abi1-2 hab1-1 pp2ca-1 (pp2c_b)19 were a gift from P. L. Rodriguez together with the multiple PYR/PYL knockout. Mutants were crossed to the ABA reporter lines pRD29B:LUC and pHB6:LUC23. Lines homozygous for reporter constructs and for mutant alleles were used throughout the experiments.
Mutant isolation and ABA exposure
Mutants with ABA-hypersensitive reporter activation were recovered from a screen of the maternal second generation (M2) of ethyl methanesulfonate-mutagenized A. thaliana seeds of the ABA reporter line pHB6:LUC23 in the Col-0 background. In brief, the M2 seedlings were grown on solidified half-strength MS medium for 5 days before transfer to medium supplemented with 3 µM (+)-cis-trans-ABA (Chemos; www.chemos-group.com) or 0.3 M mannitol for 24 h followed by life luciferase imaging with the intensity of light emission from plant organs of interest being measured using Simple PCI 6.6 software (https://hcimage.com/)23. Among the mutants recovered, certain mutants were hypersensitive to exogenously applied ABA, while mutants with an unaltered response to ABA were considered to carry lesions in drought stress signalling upstream of the canonical ABA signalling pathway. About 115,000 seedlings were screened and 109 putatively hypersensitive mutants were selected. Candidates showing a hypersensitive reporter response were propagated and the progeny was re-examined. Finally, 24 mutants were confirmed, among which 16 were found to be ABA-hypersensitive and 8 were found to be affected in drought stress signalling upstream of ABA. We selected mutants with a robust phenotype for map-based cloning in combination with next-generation sequencing and identified twa1-1 together with mutants allelic to cpl1 and cpl3. The twa1-1 mutant was backcrossed to the pHB6:LUC reporter line four times.
Gene identification
The TWA1 locus has been identified by bulked segregant analysis68. In brief, approximately 50 homozygous mutant seedlings were pooled and processed for next-generation DNA-sequencing analysis to identify single-nucleotide polymorphisms (SNPs) compared with the reference genome Col-0. The analysis confined the location of the target gene within a 180 kb genomic fragment on chromosome 5. In this fragment, four SNPs were found within genes, two of them were synonymous. The non-synonymous mutations generated a premature TGA stop codon in At5g13590 at nucleotide 744 of the coding sequence and the other caused a conservative amino acid exchange in At5g13930. The identity of TWA1 (At5g13590) was confirmed by complementation of the ABA-hypersensitive phenotype by gene transfer of a 7 kb genomic fragment encompassing 1.1 kb of the promoter region, the structural gene and the terminator (a list of the primers and restriction sites used for cloning is shown in Supplementary Table 1).
Effector constructs and analysis of gene expression
Plant RNA extraction, cDNA synthesis and construction of plasmids for effector expression were performed as described previously61. In brief, cDNA was generated from mRNA isolated from leaves of A. thaliana Col-0, A. lyrata and S. alba. Total RNA was purified from leaves using the analytik jena-innuPREP Plant RNA Kit (Analytik Jena) and cDNA was synthesized using the RevertAid First Strand cDNA Synthesis Kit (Thermo Fisher Scientific). The coding sequences of effectors were integrated into a modified Bluescript vector with an expression cassette consisting of the 35S promoter, followed by the coding sequence and the NOS terminator61. A list of the primers and restriction sites used for cloning is provided in Supplementary Table 1. The 363 bp AvrII–HindIII DNA fragment of the AlTWA1 gene encompassing the HVR was exchanged with the AvrII–HindIII fragment of TWA1 to yield TWA1(AlHVR). Constructs used for FRET–FLIM analysis were cloned using the Golden-Gate system69. TWA1, twa1-1, JAM2 and JAM3 cDNAs were cloned into the level I vector (LI_BpiI) and subsequently into LII expression vectors (JAM2 and JAM3: LII_3-4_CEN_LEU with promoter pTDH3 and terminator tDH1, plus an N-terminal mCherry tag; TWA1and twa1: LII_1-2_CEN_LEU with pTDH3 and tDH1, plus an N-terminal GFP tag). For intramolecular FRET, TWA1 was cloned into LII_3-4_CEN_LEU with pTDH3 and tDH1, including an N-terminal mCherry tag and a C-terminal GFP (GFP used in all constructs was mono enhanced GFP) tag linked to TWA1 through a glycine–serine linker (mCherry: GGGGSGGGGSGGGGSG; GFP: GGGGGSGGGGSGGGGS). As a control, both fluorophores were fused with the same glycine–serine linkers and expressed using the LII_3-4_LEU expression cassette. The GFP-TWA1(AlHVR) construct was cloned into pGREG57470 using the TWA1(AlHVR) cassette (see above) and SalI. The reporter construct pHSFA2:LUC was generated by replacing the RD29B promoter in pRD29B:LUC with an amplified 2 kb fragment of the HSFA2 promoter region as described previously54. The correctness of all constructs was verified by DNA-sequencing analysis. Quantitative gene expression was monitored with BRYT Green Dye-based qPCR (GoTaq qPCR Master Mix kit, Promega) using the LightCycler 480 instrument (Roche) and gene-specific primers. TIP41L, UBC9 and UBI10 were used for normalization. A list of the primers used for quantitative PCR with reverse transcription is shown in Supplementary Table 2.
Protein sequence alignments
Homologues of TWA1 were identified through BLASTp searches against genomes on NCBI (https://blast.ncbi.nlm.nih.gov/Blast.cgi?PAGE=Proteins). Amino acid sequences of TWA1 and representative proteins were aligned with the NCBI COBALT alignment tool71.
Prediction of intrinsically disordered proteins
Prediction of intrinsically disordered regions was performed using metapredict (https://metapredict.net/)72.
Protoplast assays and transgenic plants
Transient expression analysis in A. thaliana protoplasts, and expression cassettes for pRDB29:LUC, p35S:GUS and effectors have been described previously73. Primers for DNA amplification and restriction sites used for generation of effector constructs are listed (Supplementary Table 1). Protoplasts were isolated from leaves of Columbia WT accession (Col-0) or from mutant lines of the Col-0 background. In brief, 105 protoplasts were transfected with DNA of different expression cassettes including the ABA-responsive pRD29B:LUC reporter (5 µg), the p35S:GUS control reporter (3 µg) for expression normalization and the indicated amounts of various effector plasmids and incubated at 25 °C, unless otherwise stated, for 16 h before assessment of luciferase and glucuronidase activity. Ectopic expression of TWA1 and twa1 (mutant allele of twa1-1), AlTWA1 and SaTWA1 in A. thaliana plants was under the 35S promoter in the twa1-2 background. The cDNA expression cassettes of the TWA1 variants and orthologues were inserted as an AscI DNA fragment into the pGreenII 0179 vector74 modified with an AscI cloning site in the T-DNA region. Transgenic plants were generated by Agrobacterium tumefaciens-mediated gene transfer as described previously75.
Thermotolerance evaluation
Thermotolerance was analysed as reported previously14. In brief, 5-day-old light-grown seedlings (22 °C) were exposed to heat stress at 45 °C for 90 min to 180 min with 15 min intervals for assessment of basal thermotolerance. For analysis of acquired thermotolerance, seedlings had a preceding 90 min acclimation period at 38 °C followed by a 120 min recovery phase (22 °C) before heat stress at 45 °C. For root growth assays, seedlings were allowed to recover for 5 days under continuous light (22 °C) and the root extension after heat stress was determined.
Determination of chlorophyll content and of electrolyte leakage
For chlorophyll analysis, the seedlings were frozen in liquid nitrogen after their fresh weight had been determined, homogenized using the TissueLyser II (Qiagen) and extracted with methanol for determination of chlorophyll as reported previously76. Absorption of cleared extracts was recorded at 665 nm and 652 nm. In the electrolyte-leakage assay, leaves of 3-week-old A. thaliana plants were placed into Petri dishes containing 25 ml water and were incubated at 37 °C or 22 °C in the light (65 µmol m−2 s−1) for 24 h. Thereafter, single leaves were immersed in 1 ml of double-distilled water in Eppendorf tubes and incubated for 30 min with gentle shaking9. Conductivity was measured using a Conductivity Meter (Seven Easy Mettler Toledo, InLab 752-6 mm conductivity sensor). Electrolyte leakage was normalized to the conductivity after heating the samples to 99 °C for 10 min.
Chromatin immunoprecipitation experiments
GFP–JAM2 was expressed in A. thaliana Col-0 protoplasts that were incubated for 16 h in the absence or presence of ABA (10 µM). Protoplasts transfected with an empty vector served as the control. Protoplasts were collected by centrifugation (500g, 2 min) and the supernatant was discarded. Subsequent steps (nucleus isolation, shearing of chromatin, preclearing, immunoprecipitation, reverse cross-linking and DNA purification) were performed as described previously77. Anti-GFP antibodies were obtained from Santa Cruz Biotechnology (1:2,000 dilution was used for antibodies) and ChromoTek GFP-Trap Agarose was obtained from Proteintech. The enrichment of different DNA fragments encompassing the RD29B promoter in the antibody containing fraction (as compared to the control without antibody) was quantified using quantitative PCR from immunoprecipitated samples.
Photosynthetic parameters and thermoimaging
Gas-exchange measurements and thermoimaging were performed as described previously18. For quantifying net photosynthesis (An), transpiration (E) and stomatal conductance (gs) of the whole rosette, the GFS-3000 gas-exchange system was equipped with custom-built whole plant cuvettes (Heinz Walz). The analyses were conducted at 150 µmol m−2 s−1 PAR, 400 µmol mol−1 external CO2 and a water vapour deficit of 1.3 ± 0.1 kPa using the software of the instrument supplier. PAM imaging was performed by using a MAXI version of IMAGING PAM (Heinz Walz). The operation of the PAM imaging system was performed according to the manufacturer’s instructions. In brief, plants were dark-adapted for 30 min and then subjected to a saturating light pulse, and the maximum quantum efficiency of photosystem II (ϕPSIImax) was calculated from basic (F0) and maximum level of fluorescence (Fm). Actinic light was then applied (150 µmol m−2 s−1 PAR) and, after 1 h of illumination, a saturating light pulse was triggered to determine transient fluorescence (Ft) and maximal fluorescence (Fm′). The corresponding quantum efficiency of photosystem II (ϕPSII) was calculated as (Fm′ − Ft)/Fm′. The non-photochemical quenching (NPQ) was determined as the ratio of (Fm − Fm′)/Fm′. The images of NPQ are presented using the standard false colour code, with rescaled values (original values divided by 4) ranging from 0 to 1.
Confocal microscopy
Confocal microscopy and FRET–FLIM analyses were performed as described previously78. In brief, leaves of 5-week-old tobacco (N. benthamiana) were infiltrated with a suspension of A. tumefaciens GV3101 (MP90) for expression of the viral p19 protein and A. thaliana proteins. The bacteria contained binary level II plasmids79 for the expression of GFP-TWA1/twa1, and mCherry fusions with JAM2, JAM3 and TPL under the control of the viral 35S promoter in plant leaves. Infiltrated plants were incubated for 2 days at 20 °C and exposed for 2 h to 37 °C or 20 °C. For analysis of yeast, freshly transformed yeast cells of strain AH109 (MATa, obtained from J. Uhrig, Cologne) were cultivated overnight in 1 ml synthetic dextrose medium (SD) at different temperatures as indicated before confocal analysis. Confocal analysis was conducted using the Olympus FluoView 3000 inverse laser-scanning confocal microscope with the UPLSAPO 60XW 60×/NA 1.2/WD 0.28 water-immersion objective (Olympus). For imaging of the GFP and mCherry fluorophore, tissue samples were excited at 488 and 561 nm, respectively. Specific GFP fluorescence in the nucleus was calculated by subtracting the background fluorescence80. For FRET–FLIM data acquisition, the PicoQuant advanced FCS/FRET–FLIM/rapidFLIM upgrade kit (PicoQuant) was used. GFP was excited at 485 nm with a pulsed laser (pulse rate, 40 MHz; laser driver, PDL 828 SEPIA II; laser, LDH-D-C-485, PicoQuant), and fluorescence emission was collected using the Hybrid Photomultiplier Detector Assembly 40 (PicoQuant) and processed by the TimeHarp 260 PICO Time-Correlated Single Photon Counting module (resolution, 25 ps; PicoQuant). At least 250 photons per pixel were recorded for each analysed sample. Data were fitted to a bi-exponential decay function and convoluted using SymPhoTime 64 software (PicoQuant).
Yeast constructs and growth analyses
Yeast growth and Y2H assays were performed as reported previously67 unless otherwise stated using pGAD424 (GenBank: U07647) and pBRIDGE vectors for expression of A. thaliana proteins (Clontech). A screen for proteins interacting with TWA1 was performed with A. thaliana Y2H libraries27,81. Coding sequences of TWA1 and homologues were expressed as fusions with the GAL4-activation domain (AD), while JAM, MYC2, TPL and TPRs were fused to the GAL4-DNA binding domain. For analysis of yeast growth in liquid culture, precultures of three independently transformed yeast colonies per construct were used for inoculation of 1.5 ml SD medium containing 2% glucose supplemented with 20 mg l−1 uracil, 20 mg l−1 methionine and, for selection of plasmids and protein interaction, supplemented with 20 mg l−1 histidine, 60 mg l−1 leucine and 50 mg l−1 tryptophan as indicated. After growth overnight in a gyratory shaker at 200 rpm and 30 °C, 13.5 ml supplemented SD was added, and the suspension culture was further cultivated until the beginning of the exponential growth phase was reached at optical densities at 600 nm (OD600) of between 0.6 and 0.8. Subsequently, cells were sedimented (1,500g, 5 min), resuspend in selective SD and used to inoculate 20 ml fresh SD to a final OD600 of 0.020 for monitoring growth at different temperatures (200 rpm). The apparent growth rate µ was calculated in the first 24 h of culturing using the formula µ = (ln[OD24 h/OD0 h])/24 h. The growth rate in yeast was used to approximate the Q10 temperature coefficient of the TWA1 response as Q10 = [µT2/µT1]10/(T2 − T1) where T is temperature in Celsius and µT1 and µT2 are the rates at T1 and T2, respectively. The Q10 value of ~150 was estimated using the measured rates of 0.138 and 0.011 h−1 at 25 °C and 20 °C, respectively.
Statistics and reproducibility
Statistics were derived from data of biological replicates excluding technical replicates. The sample size was calculated using the G*Power v.3.1.9.7 software82 for unpaired two-sided t-tests, with n = 3 for protoplast and yeast experiments with a presumed effect size of 5, α and β of 0.05, and power (1 − β) = 0.95. The number of biological replicates was n = 6 for single datapoints in the seedling growth assay with a presumed effect size of 2.5, α and β of 0.05, and power (1 − β) = 0.95. Each experiment was repeated at least twice with similar results. Representative confocal images are shown in Figs. 2d and 3c. In yeast, approximately 85% of fluorescent cells showed the GFP–TWA1 subnuclear crowding at 30 °C, never observed with the twa1 product (Fig. 2d, n > 100). In tobacco epidermal cells, the nuclear subdomain accumulation of GFP–TWA1 was 75% at 37 °C (Fig. 3c, n > 50). The nuclear TWA1 crowding was consistent in independent experiments. Data were analysed using Mann–Whitney U-tests unless otherwise stated (https://www.socscistatistics.com/tests/mannwhitney and https://www.statskingdom.com/170median_mann_whitney.html, to calculate exact P values of <0.0001). One-way analysis of variance was performed using SPSS v.16.0 software for Windows. Student’s t-tests were performed using Excel 2016. Box plots were drawn using OriginPro 2020. Details on the statistical analyses are found in the Source Data.
Reporting summary
Further information on research design is available in the Nature Portfolio Reporting Summary linked to this article.
Online content
Any methods, additional references, Nature Portfolio reporting summaries, source data, extended data, supplementary information, acknowledgements, peer review information; details of author contributions and competing interests; and statements of data and code availability are available at 10.1038/s41586-024-07424-x.
Supplementary information
Source data
Acknowledgements
We thank C. Eltschig for technical assistance; P. L. Rodriguez, S. Cutler and the staff at Nottingham Arabidopsis Stock Center for A. thaliana material; M. Parniske for Golden Gate vectors; M. Schäffer and R. Hückelhoven for providing A. lyrata cDNA library, R. A. Torres-Ruiz and the members of the Center for Advanced Light Microscopy (CALM) for technical support; S. Zytynska and R. Meier for their help in using the TUMmesa plant growth facility (DFG, INST 95/1184-1 FUGG); and T.-M. Strom for genome sequencing and analysis. This work was supported by the German Science Foundation, projects CH182/5-3 to A.C., Reinhart Koselleck 398997955 to E.G. and the European Research Council’s Horizon 2020 Research and Innovation Program, grant agreement 648420 to P.F.-B.
Extended data figures and tables
Author contributions
A.C. and E.G. conceived the study. L.B. analysed thermotolerance, protoplasts and yeast, and performed confocal microscopy analyses. L.B. analysed gene expression and generated, together with C.H., effector constructs. C.H. performed plant transformation. A.C. performed crossings and selection of multiple homozygous lines and carried out in vivo imaging experiments. J.H. identified the TWA1 locus, performed a screen for proteins interacting with TWA1 using A. thaliana Y2H libraries and the chromatin immunoprecipitation experiment. S.W. performed Y2H assays. Z.Y. conducted gas-exchange measurements and thermoimaging. B.G. and P.F.-B. supervised photosynthetic analyses and Y2H screening, respectively. A.C. and E.G. wrote the article, and all of the authors contributed ideas and reviewed the manuscript.
Peer review
Peer review information
Nature thanks Cesar Cuevas-Velazquez, Sean Cutler and the other, anonymous, reviewer(s) for their contribution to the peer review of this work.
Funding
Open access funding provided by Technische Universität München.
Data availability
All data supporting the findings of this study are available within the Article. Data on TWA1 protein and transcript abundance in A. thaliana organs are from the ATHENA proteomics database (https://athena.proteomics.wzw.tum.de). Source data are provided with this paper.
Competing interests
A patent on the use of TWA1 as molecular thermogenetic control switch and for improvement of thermotolerance and modifying of senescence has been filed by the Technische Universität München, with E.G., A.C. and L.B. listed as inventors (Europäische Patentanmeldung no. 23 219 155.1). The data presented in this patent are included in the Article. The other authors declare no competing interests.
Footnotes
Publisher’s note Springer Nature remains neutral with regard to jurisdictional claims in published maps and institutional affiliations.
Contributor Information
Alexander Christmann, Email: alexander.christmann@tum.de.
Erwin Grill, Email: erwin.grill@tum.de.
Extended data
is available for this paper at 10.1038/s41586-024-07424-x.
Supplementary information
The online version contains supplementary material available at 10.1038/s41586-024-07424-x.
References
- 1.Scharf KD, Berberich T, Ebersberger I, Nover L. The plant heat stress transcription factor (Hsf) family: structure, function and evolution. Biochim. Biophys. Acta. 2012;1819:104–119. doi: 10.1016/j.bbagrm.2011.10.002. [DOI] [PubMed] [Google Scholar]
- 2.Casal JJ, Balasubramanian S. Thermomorphogenesis. Annu. Rev. Plant Biol. 2019;70:321–346. doi: 10.1146/annurev-arplant-050718-095919. [DOI] [PubMed] [Google Scholar]
- 3.Verslues PE, et al. Burning questions for a warming and changing world: 15 unknowns in plant abiotic stress. Plant Cell. 2023;35:67–108. doi: 10.1093/plcell/koac263. [DOI] [PMC free article] [PubMed] [Google Scholar]
- 4.Went FW. The effect of temperature on plant growth. Annu. Rev. Plant Physiol. 1953;4:347–362. [Google Scholar]
- 5.Hayes S, Schachtschabel J, Mishkind M, Munnik T, Arisz SA. Hot topic: thermosensing in plants. Plant Cell Environ. 2021;44:2018–2033. doi: 10.1111/pce.13979. [DOI] [PMC free article] [PubMed] [Google Scholar]
- 6.Jung JH, et al. A prion-like domain in ELF3 functions as a thermosensor in Arabidopsis. Nature. 2020;585:256–260. doi: 10.1038/s41586-020-2644-7. [DOI] [PubMed] [Google Scholar]
- 7.Richter K, Haslbeck M, Buchner J. The heat shock response: life on the verge of death. Mol. Cell. 2010;40:253–266. doi: 10.1016/j.molcel.2010.10.006. [DOI] [PubMed] [Google Scholar]
- 8.Feder, Z. A. et al. Subcellular localization of the J-protein Sis1 regulates the heat shock response. J. Cell Biol.10.1083/jcb.202005165 (2021). [DOI] [PMC free article] [PubMed]
- 9.Clarke SM, et al. Jasmonates act with salicylic acid to confer basal thermotolerance in Arabidopsis thaliana. N. Phytol. 2009;182:175–187. doi: 10.1111/j.1469-8137.2008.02735.x. [DOI] [PubMed] [Google Scholar]
- 10.Balfagon D, et al. Jasmonic acid is required for plant acclimation to a combination of high light and heat stress. Plant Physiol. 2019;181:1668–1682. doi: 10.1104/pp.19.00956. [DOI] [PMC free article] [PubMed] [Google Scholar]
- 11.Albertos P, et al. Transcription factor BES1 interacts with HSFA1 to promote heat stress resistance of plants. EMBO J. 2022;41:e108664. doi: 10.15252/embj.2021108664. [DOI] [PMC free article] [PubMed] [Google Scholar]
- 12.Li N, et al. Plant hormone-mediated regulation of heat tolerance in response to global climate change. Front. Plant Sci. 2020;11:627969. doi: 10.3389/fpls.2020.627969. [DOI] [PMC free article] [PubMed] [Google Scholar]
- 13.Larkindale J, Vierling E. Core genome responses involved in acclimation to high temperature. Plant Physiol. 2008;146:748–761. doi: 10.1104/pp.107.112060. [DOI] [PMC free article] [PubMed] [Google Scholar]
- 14.Larkindale J, Hall JD, Knight MR, Vierling E. Heat stress phenotypes of Arabidopsis mutants implicate multiple signaling pathways in the acquisition of thermotolerance. Plant Physiol. 2005;138:882–897. doi: 10.1104/pp.105.062257. [DOI] [PMC free article] [PubMed] [Google Scholar]
- 15.Cutler SR, Rodriguez PL, Finkelstein RR, Abrams SR. Abscisic acid: emergence of a core signaling network. Annu. Rev. Plant Biol. 2010;61:651–679. doi: 10.1146/annurev-arplant-042809-112122. [DOI] [PubMed] [Google Scholar]
- 16.Yoshida T, Christmann A, Yamaguchi-Shinozaki K, Grill E, Fernie AR. Revisiting the basal role of ABA—roles outside of stress. Trends Plant Sci. 2019;24:625–635. doi: 10.1016/j.tplants.2019.04.008. [DOI] [PubMed] [Google Scholar]
- 17.Cohen I, Zandalinas SI, Huck C, Fritschi FB, Mittler R. Meta-analysis of drought and heat stress combination impact on crop yield and yield components. Physiol. Plant. 2021;171:66–76. doi: 10.1111/ppl.13203. [DOI] [PubMed] [Google Scholar]
- 18.Yang Z, et al. Leveraging abscisic acid receptors for efficient water use in Arabidopsis. Proc. Natl Acad. Sci. USA. 2016;113:6791–6796. doi: 10.1073/pnas.1601954113. [DOI] [PMC free article] [PubMed] [Google Scholar]
- 19.Rubio S, et al. Triple loss of function of protein phosphatases type 2C leads to partial constitutive response to endogenous abscisic acid. Plant Physiol. 2009;150:1345–1355. doi: 10.1104/pp.109.137174. [DOI] [PMC free article] [PubMed] [Google Scholar]
- 20.Park SY, et al. Abscisic acid inhibits type 2C protein phosphatases via the PYR/PYL family of START proteins. Science. 2009;324:1068–1071. doi: 10.1126/science.1173041. [DOI] [PMC free article] [PubMed] [Google Scholar]
- 21.Zhao Y, et al. Arabidopsis duodecuple mutant of PYL ABA receptors reveals PYL repression of ABA-independent SnRK2 activity. Cell Rep. 2018;23:3340–3351. doi: 10.1016/j.celrep.2018.05.044. [DOI] [PMC free article] [PubMed] [Google Scholar]
- 22.Koiwa H, et al. C-terminal domain phosphatase-like family members (AtCPLs) differentially regulate Arabidopsis thaliana abiotic stress signaling, growth, and development. Proc. Natl Acad. Sci. USA. 2002;99:10893–10898. doi: 10.1073/pnas.112276199. [DOI] [PMC free article] [PubMed] [Google Scholar]
- 23.Christmann A, Hoffmann T, Teplova I, Grill E, Muller A. Generation of active pools of abscisic acid revealed by in vivo imaging of water-stressed Arabidopsis. Plant Physiol. 2005;137:209–219. doi: 10.1104/pp.104.053082. [DOI] [PMC free article] [PubMed] [Google Scholar]
- 24.Causier B, Ashworth M, Guo W, Davies B. The TOPLESS interactome: a framework for gene repression in Arabidopsis. Plant Physiol. 2012;158:423–438. doi: 10.1104/pp.111.186999. [DOI] [PMC free article] [PubMed] [Google Scholar]
- 25.Mergner J, et al. Mass-spectrometry-based draft of the Arabidopsis proteome. Nature. 2020;579:409–414. doi: 10.1038/s41586-020-2094-2. [DOI] [PubMed] [Google Scholar]
- 26.Pauwels L, et al. NINJA connects the co-repressor TOPLESS to jasmonate signalling. Nature. 2010;464:788–791. doi: 10.1038/nature08854. [DOI] [PMC free article] [PubMed] [Google Scholar]
- 27.Altmann M, et al. Extensive signal integration by the phytohormone protein network. Nature. 2020;583:271–276. doi: 10.1038/s41586-020-2460-0. [DOI] [PubMed] [Google Scholar]
- 28.Sasaki-Sekimoto Y, et al. Basic helix-loop-helix transcription factors JASMONATE-ASSOCIATED MYC2-LIKE1 (JAM1), JAM2, and JAM3 are negative regulators of jasmonate responses in Arabidopsis. Plant Physiol. 2013;163:291–304. doi: 10.1104/pp.113.220129. [DOI] [PMC free article] [PubMed] [Google Scholar]
- 29.Song S, et al. The bHLH subgroup IIId factors negatively regulate jasmonate-mediated plant defense and development. PLoS Genet. 2013;9:e1003653. doi: 10.1371/journal.pgen.1003653. [DOI] [PMC free article] [PubMed] [Google Scholar]
- 30.Li H, et al. The bHLH-type transcription factor AtAIB positively regulates ABA response in Arabidopsis. Plant Mol. Biol. 2007;65:655–665. doi: 10.1007/s11103-007-9230-3. [DOI] [PubMed] [Google Scholar]
- 31.Algar WR, Hildebrandt N, Vogel SS, Medintz IL. FRET as a biomolecular research tool—understanding its potential while avoiding pitfalls. Nat. Methods. 2019;16:815–829. doi: 10.1038/s41592-019-0530-8. [DOI] [PubMed] [Google Scholar]
- 32.Fields S, Song O. A novel genetic system to detect protein-protein interactions. Nature. 1989;340:245–246. doi: 10.1038/340245a0. [DOI] [PubMed] [Google Scholar]
- 33.Leydon, A. R. et al. Repression by the Arabidopsis TOPLESS corepressor requires association with the core mediator complex. eLife10.7554/eLife.66739 (2021). [DOI] [PMC free article] [PubMed]
- 34.Ezer D, et al. The G-Box transcriptional regulatory code in Arabidopsis. Plant Physiol. 2017;175:628–640. doi: 10.1104/pp.17.01086. [DOI] [PMC free article] [PubMed] [Google Scholar]
- 35.Yoshida T, et al. Functional analysis of an Arabidopsis heat-shock transcription factor HsfA3 in the transcriptional cascade downstream of the DREB2A stress-regulatory system. Biochem. Biophys. Res. Commun. 2008;368:515–521. doi: 10.1016/j.bbrc.2008.01.134. [DOI] [PubMed] [Google Scholar]
- 36.Mishra SK, et al. In the complex family of heat stress transcription factors, HsfA1 has a unique role as master regulator of thermotolerance in tomato. Genes Dev. 2002;16:1555–1567. doi: 10.1101/gad.228802. [DOI] [PMC free article] [PubMed] [Google Scholar]
- 37.Ogawa D, Yamaguchi K, Nishiuchi T. High-level overexpression of the Arabidopsis HsfA2 gene confers not only increased themotolerance but also salt/osmotic stress tolerance and enhanced callus growth. J. Exp. Bot. 2007;58:3373–3383. doi: 10.1093/jxb/erm184. [DOI] [PubMed] [Google Scholar]
- 38.Yoshida T, et al. Arabidopsis HsfA1 transcription factors function as the main positive regulators in heat shock-responsive gene expression. Mol. Genet. Genomics. 2011;286:321–332. doi: 10.1007/s00438-011-0647-7. [DOI] [PubMed] [Google Scholar]
- 39.Ohama N, et al. The transcriptional cascade in the heat stress response of Arabidopsis is strictly regulated at the level of transcription factor expression. Plant Cell. 2016;28:181–201. doi: 10.1105/tpc.15.00435. [DOI] [PMC free article] [PubMed] [Google Scholar]
- 40.Lee JH, Hübel A, Schöffl F. Derepression of the activity of genetically engineered heat shock factor causes constitutive synthesis of heat shock proteins and increased thermotolerance in transgenic Arabidopsis. Plant J. 1995;8:603–612. doi: 10.1046/j.1365-313x.1995.8040603.x. [DOI] [PubMed] [Google Scholar]
- 41.Lohmann C, Eggers-Schumacher G, Wunderlich M, Schöffl F. Two different heat shock transcription factors regulate immediate early expression of stress genes in Arabidopsis. Mol. Genet. Genomics. 2004;271:11–21. doi: 10.1007/s00438-003-0954-8. [DOI] [PubMed] [Google Scholar]
- 42.Gracheva EO, et al. Molecular basis of infrared detection by snakes. Nature. 2010;464:1006–1011. doi: 10.1038/nature08943. [DOI] [PMC free article] [PubMed] [Google Scholar]
- 43.Li T, et al. Diverse sensitivities of TRPA1 from different mosquito species to thermal and chemical stimuli. Sci. Rep. 2019;9:20200. doi: 10.1038/s41598-019-56639-w. [DOI] [PMC free article] [PubMed] [Google Scholar]
- 44.Nover L, Scharf KD, Neumann D. Formation of cytoplasmic heat shock granules in tomato cell cultures and leaves. Mol. Cell. Biol. 1983;3:1648–1655. doi: 10.1128/mcb.3.9.1648. [DOI] [PMC free article] [PubMed] [Google Scholar]
- 45.Wallace EW, et al. Reversible, specific, active aggregates of endogenous proteins assemble upon heat stress. Cell. 2015;162:1286–1298. doi: 10.1016/j.cell.2015.08.041. [DOI] [PMC free article] [PubMed] [Google Scholar]
- 46.Sanders DW, et al. Competing protein-RNA interaction networks control multiphase intracellular organization. Cell. 2020;181:306–324. doi: 10.1016/j.cell.2020.03.050. [DOI] [PMC free article] [PubMed] [Google Scholar]
- 47.Riback JA, et al. Stress-triggered phase separation is an adaptive, evolutionarily tuned response. Cell. 2017;168:1028–1040. doi: 10.1016/j.cell.2017.02.027. [DOI] [PMC free article] [PubMed] [Google Scholar]
- 48.Lafontaine DLJ, Riback JA, Bascetin R, Brangwynne CP. The nucleolus as a multiphase liquid condensate. Nat. Rev. Mol. Cell Biol. 2021;22:165–182. doi: 10.1038/s41580-020-0272-6. [DOI] [PubMed] [Google Scholar]
- 49.Riback JA, et al. Composition-dependent thermodynamics of intracellular phase separation. Nature. 2020;581:209–214. doi: 10.1038/s41586-020-2256-2. [DOI] [PMC free article] [PubMed] [Google Scholar]
- 50.Fang X, et al. Arabidopsis FLL2 promotes liquid-liquid phase separation of polyadenylation complexes. Nature. 2019;569:265–269. doi: 10.1038/s41586-019-1165-8. [DOI] [PMC free article] [PubMed] [Google Scholar]
- 51.Dorone Y, et al. A prion-like protein regulator of seed germination undergoes hydration-dependent phase separation. Cell. 2021;184:4284–4298. doi: 10.1016/j.cell.2021.06.009. [DOI] [PMC free article] [PubMed] [Google Scholar]
- 52.Chowdhary S, Kainth AS, Paracha S, Gross DS, Pincus D. Inducible transcriptional condensates drive 3D genome reorganization in the heat shock response. Mol. Cell. 2022;82:4386–4399. doi: 10.1016/j.molcel.2022.10.013. [DOI] [PMC free article] [PubMed] [Google Scholar]
- 53.Volkov RA, Panchuk II, Mullineaux PM, Schoffl F. Heat stress-induced H2O2 is required for effective expression of heat shock genes in Arabidopsis. Plant Mol. Biol. 2006;61:733–746. doi: 10.1007/s11103-006-0045-4. [DOI] [PubMed] [Google Scholar]
- 54.Nishizawa A, et al. Arabidopsis heat shock transcription factor A2 as a key regulator in response to several types of environmental stress. Plant J. 2006;48:535–547. doi: 10.1111/j.1365-313X.2006.02889.x. [DOI] [PubMed] [Google Scholar]
- 55.He NY, et al. A nitric oxide burst at the shoot apex triggers a heat-responsive pathway in Arabidopsis. Nat. Plants. 2022;8:434–450. doi: 10.1038/s41477-022-01135-9. [DOI] [PubMed] [Google Scholar]
- 56.VanWallendael A, et al. A molecular view of plant local adaptation: incorporating stress-response networks. Annu. Rev. Plant Biol. 2019;70:559–583. doi: 10.1146/annurev-arplant-050718-100114. [DOI] [PubMed] [Google Scholar]
- 57.Lv WT, Lin B, Zhang M, Hua XJ. Proline accumulation is inhibitory to Arabidopsis seedlings during heat stress. Plant Physiol. 2011;156:1921–1933. doi: 10.1104/pp.111.175810. [DOI] [PMC free article] [PubMed] [Google Scholar]
- 58.Zander M, et al. Integrated multi-omics framework of the plant response to jasmonic acid. Nat Plants. 2020;6:290–302. doi: 10.1038/s41477-020-0605-7. [DOI] [PMC free article] [PubMed] [Google Scholar]
- 59.Hirt, H. et al. PlantACT!—how to tackle the climate crisis. Trends Plant Sci.10.1016/j.tplants.2023.01.005 (2023). [DOI] [PubMed]
- 60.Chee WKD, Yeoh JW, Dao VL, Poh CL. Thermogenetics: applications come of age. Biotechnol. Adv. 2022;55:107907. doi: 10.1016/j.biotechadv.2022.107907. [DOI] [PubMed] [Google Scholar]
- 61.Tischer SV, et al. Combinatorial interaction network of abscisic acid receptors and coreceptors from Arabidopsis thaliana. Proc. Natl Acad. Sci. USA. 2017;114:10280–10285. doi: 10.1073/pnas.1706593114. [DOI] [PMC free article] [PubMed] [Google Scholar]
- 62.Rosso MG, et al. An Arabidopsis thaliana T-DNA mutagenized population (GABI-Kat) for flanking sequence tag-based reverse genetics. Plant Mol. Biol. 2003;53:247–259. doi: 10.1023/B:PLAN.0000009297.37235.4a. [DOI] [PubMed] [Google Scholar]
- 63.Alonso JM, et al. Genome-wide insertional mutagenesis of Arabidopsis thaliana. Science. 2003;301:653–657. doi: 10.1126/science.1086391. [DOI] [PubMed] [Google Scholar]
- 64.Ordon J, et al. Generation of chromosomal deletions in dicotyledonous plants employing a user-friendly genome editing toolkit. Plant J. 2017;89:155–168. doi: 10.1111/tpj.13319. [DOI] [PubMed] [Google Scholar]
- 65.Labun K, Krause M, Torres Cleuren Y, Valen E. CRISPR genome editing made easy through the CHOPCHOP website. Curr. Protoc. 2021;1:e46. doi: 10.1002/cpz1.46. [DOI] [PubMed] [Google Scholar]
- 66.Gonzalez-Guzman M, et al. Arabidopsis PYR/PYL/RCAR receptors play a major role in quantitative regulation of stomatal aperture and transcriptional response to abscisic acid. Plant Cell. 2012;24:2483–2496. doi: 10.1105/tpc.112.098574. [DOI] [PMC free article] [PubMed] [Google Scholar]
- 67.Fuchs S, Tischer SV, Wunschel C, Christmann A, Grill E. Abscisic acid sensor RCAR7/PYL13, specific regulator of protein phosphatase coreceptors. Proc. Natl Acad. Sci. USA. 2014;111:5741–5746. doi: 10.1073/pnas.1322085111. [DOI] [PMC free article] [PubMed] [Google Scholar]
- 68.Nordström KJ, et al. Mutation identification by direct comparison of whole-genome sequencing data from mutant and wild-type individuals using k-mers. Nat. Biotechnol. 2013;31:325–330. doi: 10.1038/nbt.2515. [DOI] [PubMed] [Google Scholar]
- 69.Chiasson D, et al. A unified multi-kingdom Golden Gate cloning platform. Sci. Rep. 2019;9:10131. doi: 10.1038/s41598-019-46171-2. [DOI] [PMC free article] [PubMed] [Google Scholar]
- 70.Jansen G, Wu C, Schade B, Thomas DY, Whiteway M. Drag&Drop cloning in yeast. Gene. 2005;344:43–51. doi: 10.1016/j.gene.2004.10.016. [DOI] [PubMed] [Google Scholar]
- 71.Papadopoulos JS, Agarwala R. COBALT: constraint-based alignment tool for multiple protein sequences. Bioinformatics. 2007;23:1073–1079. doi: 10.1093/bioinformatics/btm076. [DOI] [PubMed] [Google Scholar]
- 72.Emenecker RJ, Griffith D, Holehouse AS. Metapredict: a fast, accurate, and easy-to-use predictor of consensus disorder and structure. Biophys. J. 2021;120:4312–4319. doi: 10.1016/j.bpj.2021.08.039. [DOI] [PMC free article] [PubMed] [Google Scholar]
- 73.Moes D, Himmelbach A, Korte A, Haberer G, Grill E. Nuclear localization of the mutant protein phosphatase abi1 is required for insensitivity towards ABA responses in Arabidopsis. Plant J. 2008;54:806–819. doi: 10.1111/j.1365-313X.2008.03454.x. [DOI] [PubMed] [Google Scholar]
- 74.Hellens RP, Edwards EA, Leyland NR, Bean S, Mullineaux PM. pGreen: a versatile and flexible binary Ti vector for Agrobacterium-mediated plant transformation. Plant Mol. Biol. 2000;42:819–832. doi: 10.1023/a:1006496308160. [DOI] [PubMed] [Google Scholar]
- 75.Meyer K, Leube MP, Grill E. A protein phosphatase 2C involved in ABA signal transduction in Arabidopsis thaliana. Science. 1994;264:1452–1455. doi: 10.1126/science.8197457. [DOI] [PubMed] [Google Scholar]
- 76.Porra RJ, Thompson WA, Kriedemann PE. Determination of accurate extinction coefficients and simultaneous equations for assaying chlorophylls a and b extracted with four different solvents: verification of the concentration of chlorophyll standards by atomic absorption spectroscopy. Biochim. Biophys. Acta. 1989;975:384–394. [Google Scholar]
- 77.Kaufmann K, et al. Chromatin immunoprecipitation (ChIP) of plant transcription factors followed by sequencing (ChIP-SEQ) or hybridization to whole genome arrays (ChIP-CHIP) Nat. Protoc. 2010;5:457. doi: 10.1038/nprot.2009.244. [DOI] [PubMed] [Google Scholar]
- 78.Ruschhaupt M, et al. Rebuilding core abscisic acid signaling pathways of Arabidopsis in yeast. EMBO J. 2019;38:e101859. doi: 10.15252/embj.2019101859. [DOI] [PMC free article] [PubMed] [Google Scholar]
- 79.Binder A, et al. A modular plasmid assembly kit for multigene expression, gene silencing and silencing rescue in plants. PLoS ONE. 2014;9:e88218. doi: 10.1371/journal.pone.0088218. [DOI] [PMC free article] [PubMed] [Google Scholar]
- 80.Carrillo R, Christopher DA. Development of a GFP biosensor reporter for the unfolded protein response-signaling pathway in plants: incorporation of the bZIP60 intron into the GFP gene. Plant Signal. Behav. 2022;17:2098645. doi: 10.1080/15592324.2022.2098645. [DOI] [PMC free article] [PubMed] [Google Scholar]
- 81.Arabidopsis Interactome Mapping Consortium. Evidence for network evolution in an Arabidopsis interactome map. Science. 2011;333:601–607. doi: 10.1126/science.1203877. [DOI] [PMC free article] [PubMed] [Google Scholar]
- 82.Faul F, Erdfelder E, Buchner A, Lang A-G. Statistical power analyses using G*Power 3.1: tests for correlation and regression analyses. Behav. Res. Methods. 2009;41:1149–1160. doi: 10.3758/BRM.41.4.1149. [DOI] [PubMed] [Google Scholar]
- 83.Song, L. et al. A transcription factor hierarchy defines an environmental stress response network. Science10.1126/science.aag1550 (2016). [DOI] [PMC free article] [PubMed]
Associated Data
This section collects any data citations, data availability statements, or supplementary materials included in this article.
Supplementary Materials
Data Availability Statement
All data supporting the findings of this study are available within the Article. Data on TWA1 protein and transcript abundance in A. thaliana organs are from the ATHENA proteomics database (https://athena.proteomics.wzw.tum.de). Source data are provided with this paper.


