Abstract
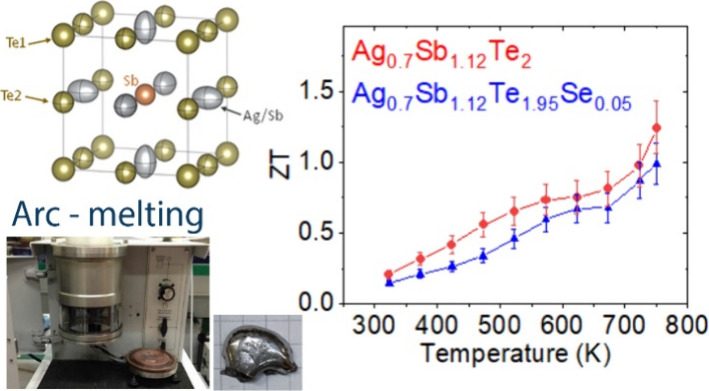
Thermoelectric materials offer a promising avenue for energy management, directly converting heat into electrical energy. Among them, AgSbTe2 has gained significant attention and continues to be a subject of research at further improving its thermoelectric performance and expanding its practical applications. This study focuses on Ag-deficient Ag0.7Sb1.12Te2 and Ag0.7Sb1.12Te1.95Se0.05 materials, examining the impact of compositional engineering within the AgSbTe2 thermoelectric system. These materials have been rapidly synthesized using an arc-melting technique, resulting in the production of dense nanostructured pellets. Detailed analysis through scanning electron microscopy (SEM) reveals the presence of a layered nanostructure, which significantly influences the thermoelectric properties of these materials. Synchrotron X-ray diffraction reveals significant changes in the lattice parameters and atomic displacement parameters (ADPs) that suggest a weakening of bond order in the structure. The thermoelectric characterization highlights the enhanced power factor of Ag-deficient materials that, combined with the low glass-like thermal conductivity, results in a significant improvement in the figure of merit, achieving zT values of 1.25 in Ag0.7Sb1.12Te2 and 1.01 in Ag0.7Sb1.12Te1.95Se0.05 at 750 K.
Keywords: thermoelectrics, AgSbTe2, arc-melting, vacancy, compositional engineering, synchrotron X-ray diffraction, atomic displacement parameters, thermoelectric properties
Introduction
Ever-growing energy demands require sustainable,
efficient energy
solutions fit for the new developments. Thermoelectric (TE) materials
offer an alternative way of energy production and thermal expenditure
by the direct conversion of heat to electrical energy. This opens
up reliable applications for waste heat recovery and localized cooling.
Elaboration of functionalized devices is conditioned by the performance
of the TE materials, determined by their figure of merit (zT):  , where T is the absolute
temperature, σ is the electronic conductivity, κ is the
total thermal conductivity, and S is the Seebeck
coefficient. These usually antagonistic properties depend on the electronic
and crystalline structure of the material and require complex approaches
for their optimization.1−4
New strategies have resulted in several improvements of zT throughout the last two decades. Chalcogenide materials dominate the field in the mid-temperature range, based on anharmonic bonding in SnSe, band convergence in PbTe, and defect and disorder engineering in AgSbTe2 derivatives.5−9 The outstanding performance of AgSbTe2 derivatives is also apparent in well-known (GeTe)m(AgSbTe2) TAGS and (PbTe)m(AgSbTe2) LAST derivatives.10−13 Nevertheless, in recent years, several articles asserted the high conversion efficiency of AgSbTe2 alone. It displays extremely low thermal conductivity, high values of Seebeck coefficient, and a high figure of merit at fairly low temperatures (500–800 K), filling the vacant range left by SnSe and PbTe.14−16 For instance, Cao et al.(17) obtained a peak zT of 1.15 at 623 K, while Wu et al.(18) described a peak zT of 1.2 at 500 K in Ag0.9Sb1.1Te2, and the Biswas group reported a zT as high as 2.4 at 573 K in Yb-doped AgSbTe2.19 However, there are several inconsistencies concerning its electrical conductivity, affected by crystalline disorder and different nanoprecipitates, mainly Ag2Te, which strongly alter the transport properties. Roychowdhury et al.(20) described outstanding values of average and peak performance, with zT ≈ 2.6 at 573 K, by employing atomic ordering and a systematic approach to improve carrier mobility in this system through Cd doping, which have been then reproduced using Hg as dopant.21
AgSbTe2 displays a cubic structure in the Pm3m space group with Ag and Sb sharing 3c Wyckoff positions, although most of the literature describes it in more symmetric approximations such as in ref (22). This random Ag/Sb arrangement suppresses the carrier mobility by the disorder-induced localization of electronic states. Besides, several dopants have been studied in this system,23−26 resulting in high-performance derivatives with a variety of phenomenologies giving rise to prominent thermoelectric figures of merit (zT > 1). The ultralow thermal conductivity and good electrical performance have been also ascribed to the precipitates of Ag2Te and Sb2Te3 formed in nanostructured samples.27,28 Nevertheless, the effect of nanostructures in the reduced lattice thermal conductivity has been cast aside by the importance of the s2 electron lone pairs in I–V–VI2 materials as the main cause of anharmonic bonding.29 This pronounced anharmonicity leads to an elevated Grüneisen parameter and strong interactions in phonon–phonon processes.30 Theoretical calculations indicate that a significant contrast in force constants arising from the distinct nature of Te–Ag and Te–Sb bonds induces this strong scattering effect on phonons. Consequently, the thermal conductivity of the AgSbTe2 compound is constrained by phonon–phonon Umklapp processes.24 Additionally, the flat valence band maximum and multipeak valence band structure produce a large positive Seebeck coefficient.31
Compositional engineering by the introduction of Ag vacancies leads to the delocalization of electronic states in the system, inducing a heightened separation between the Fermi level and the mobility edge within the electronic structure.32 This contributes to a subsequent increase in the power factor and additionally limits the formation of Ag2Te impurities in the samples. Consequently, polycrystalline samples of off-stoichiometric Ag0.7Sb1.12Te2 and Ag0.7Sb1.12Te1.95Se0.05 were studied in this work. The samples have been synthesized by arc-melting and their properties characterized. The arc-melting synthesis method is very fast, leading to pure phases and dense samples in a straightforward procedure.33,34 The crystalline structure of the samples was analyzed by laboratory XRD and synchrotron XRD, showing conspicuous changes in the lattice and anisotropic atomic displacement parameters (ADP) compared to stoichiometric AgSbTe2. Moreover, the large weighted mobility and reduced lattice thermal conductivity found in the samples lead to a peak in zT of 1.25 for Ag0.7Sb1.12Te2 at 750 K.
Experimental Methods
Ag0.7Sb1.12Te2 and Ag0.7Sb1.12Te1.95Se0.05 have been synthesized by arc-melting from the stoichiometric mixture of the metallic elements Ag (99.97%, Goodfellow Metals, Cambridgeshire, UK), Sb (99.5%, Alfa Aesar, Haverhill, MA, USA), Te (99.99%, Alfa Aesar, Haverhill, MA, USA), and Se (99.5%, Sigma-Aldrich). A 13 mm diameter cold-pressed pellet of the reagents is introduced into the chamber of an Edmund Buhler MAM-1 arc furnace, which is then melted by the electron arc in a water-cooled Cu crucible in an inert Ar atmosphere. In a time span of less than 3 min, the samples are melted three times to ensure homogenization. The resulting ingot is then partially cold-pressed in a disk shape with 8 mm diameter and 3 mm thickness using a Retsch (Haan, Germany) Pellet Press PP25 under an isostatic pressure of 10 MPa to facilitate the transport measurements. Small pieces are cut and ground to powder to perform the structural characterization. The density of the cold-pressed pellet, measured by an Archimedes balance, was >94% of the theoretical crystallographic density.
Preliminary crystallographic characterization was performed for the ground sample using powder X-ray diffraction (XRD) on a Bruker-AXS D8 (Karlsruhe, Germany) diffractometer run by DIFFRACTPLUS software (version 2.5.0, Bruker, Karlsruhe, Germany) with Cu Kα radiation (λ = 1.5418 Å) in Bragg–Brentano reflection geometry.
High-quality synchrotron X-ray diffraction (SXRD) experiments were conducted at the ID22 beamline (European Synchrotron Radiation Facility-ESRF in Grenoble, France).35 The incident X-ray radiation had a precise wavelength of 0.35429 Å. The powders of the studied samples were carefully loaded into quartz capillaries with a diameter of 0.7 mm. Diffraction data were collected within the 2θ range of 0.008–47° using a multianalyzer stage equipped with 13 Si(111) crystals. Subsequent Rietveld refinements were performed using the FullProf program.36 Peak shapes were characterized using a pseudo-Voigt function, while the refinement process encompassed the following parameters: scale factors, zero-error, background coefficients, asymmetry correction factors, lattice parameters, atomic positions, occupancy factors, and anisotropic displacement parameters.
Differential scanning calorimetry (DSC) analysis was performed in a TA Instruments SDT Q600 instrument with a 20 mg sample from room temperature to 500 °C under an argon flow at a heating rate of 10 K min–1 (Supporting Information, section SI1).
Microstructure of the samples was analyzed using scanning electron microscopy (SEM) with an EDX-equipped JEOL 6400 microscope, while high-resolution transmission electron microscopy (HRTEM) and selected-area electron diffraction (SAED) were performed using a JEOL 3000F microscope. Treatment of the HRTEM images was carried out using the Digital Micrograph package.37
The thermoelectric characterization of the materials was done using pellets directly obtained after cold pressing the arc-melted products (raw ingots) into 8 mm diameter pellets. To achieve the configuration for specific measurements, a primary cut was made perpendicular to the pressing direction, resulting in two thinner pellets, each approximately 1.2 mm in thickness. On one of these pellets, a further cut was performed parallel to the pressing direction, making a bar-shaped segment dedicated to Seebeck coefficient measurements. Simultaneously, the remaining portion of the pellet was employed for the determination of the electrical resistivity. For thermal diffusivity measurements, a thin slice (approximately 0.3 mm thick) of the original pellet was cut using a diamond saw, polished, and covered with graphite paint. The cut into thinner pellets and bar-shaped pieces was done by using an Isomet low-speed saw (Buehler). A diagram illustrating how the different sections of the sample were cut is given in the Supporting Information, section SI2.
The Seebeck coefficient of the samples was determined by using a commercial MMR-Technologies system. These measurements were conducted under vacuum conditions (10–3 mbar) within a temperature range spanning from 300 to 800 K. As a reference, constantan wire was also measured for comparison with the bar-shaped samples, which had been previously cut with a diamond saw perpendicular to the pressing direction. The thermal gradient applied during the Seebeck measurement was oriented perpendicular to the pressing direction. The electrical resistivity measurements were performed using the same instrument, employing the van der Pauw method. For the measurement of thermal diffusivity (α), a Linseis LFA 1000 instrument was employed, and measurements were taken within the temperature range of 300–800 K under an argon atmosphere. To enhance the heat absorption and emissivity, a thin graphite coating was applied to the surface of the pellets. The measurements were taken along the pressing direction. The thermal conductivity (κ) was calculated using the formula κ = αCpd, where d stands for the sample density and Cp represents the specific heat that was estimated using the Dulong–Petit law. κL is derived by deducting the electronic contribution, κe, from κ, and κe is determined using the Wiedemann–Franz law: κe = LσT (where L represents the Lorenz number). The reported measurements incorporate error margins of 5% for the Seebeck coefficient, 5% for thermal conductivity, and 1.5% for electrical resistivity.
The Hall mobility and carrier density were calculated from the Hall effect and magnetoresistance measured using the four-probe resistivity option of the PPMS (Physical Property Measurement System, by Quantum Design) in the van der Pauw geometry in delta-mode with a DC current of I = 5 mA as a function of the magnetic field up to ±8 T at 300 K.
Results and Discussion
Laboratory and Synchrotron X-ray Powder Diffraction
The samples were directly obtained as dense disk-shaped pellets with metallic luster and resistance to fractures. Laboratory XRD characterization (Figure 1) of the ground samples displays the characteristic AgSbTe2-type cubic Pm3m structure. It is noteworthy that the typical Ag2Te impurity peaks are not present in either composition studied here, as confirmed by differential scanning calorimetry (DSC) analysis (see Supporting Information, section SI1). In our previous work on arc-melted AgSbTe2, the presence of Ag2Te was almost negligible in the XRD pattern, but still detectable.38 The low amount of impurities has been reported as a consequence of quenching the melted material in the synthesis process, which thwarts the formation of higher melting point impurities.25 Furthermore, even those minor amounts of impurities vanish in the samples described here. However, a very small amount of Te (<2%) is observed in the X-ray diffractogram as a secondary phase. Other reports have described the antibonding-induced instabilities in the AgSbTe2 electronic structure, which are reduced by Ag vacancies in the crystalline structure. Then, the charge imbalance is compensated by Sb insertion at Ag positions (SbAg), leading to a pristine structure with low a hole-carrier concentration of ∼1 × 1018 cm–3. The formation of an Sb-rich matrix is linked to the segregation of Ag2Te impurities, which is very common in other AgSbTe2 works. Here, by using compositional engineering, the intentionally induced Ag vacancies and Sb excess result in the desired phases. The nominal compositions analyzed here were chosen with slight variations of the stoichiometry upon formation of samples, which follow the stable stoichiometric range described in other reports.29
Figure 1.
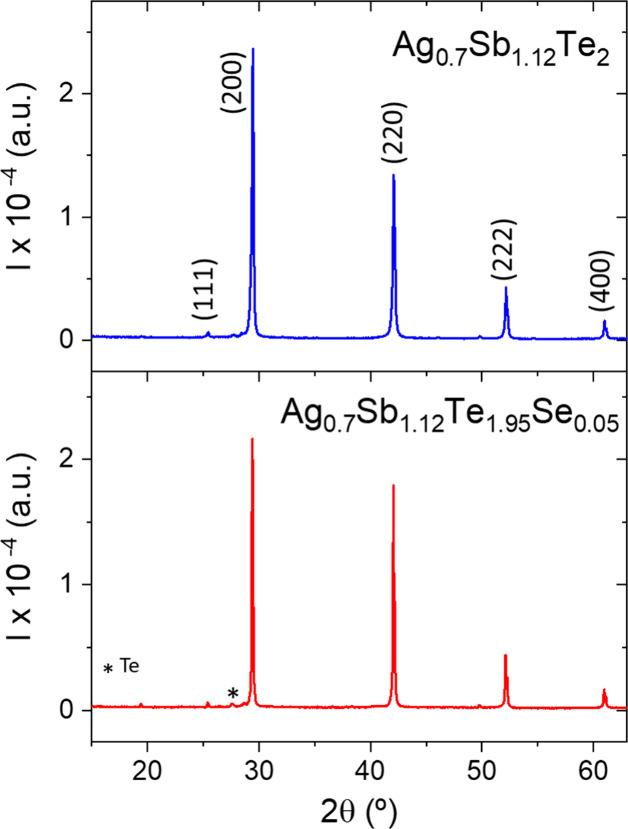
X-ray diffraction patterns of arc-melted Ag0.7Sb1.12Te2 and Ag0.7Sb1.12Te1.95Se0.05 (nominal compositions). Miller indices corresponding to cubic Pm3m reflections are also labeled.
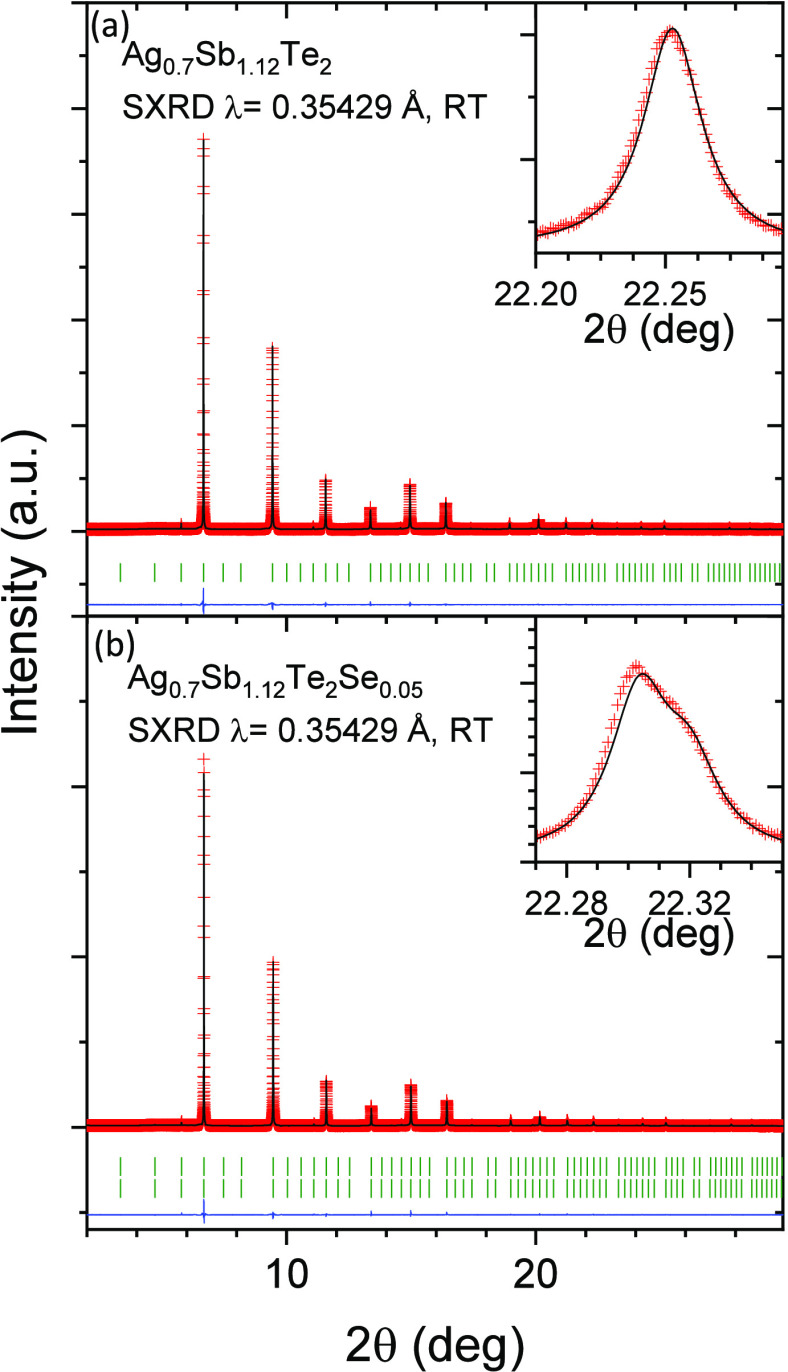
A detailed structural characterization has been performed using high-resolution synchrotron XRD data collected at the ID22 beamline (ESRF) at RT. The higher radiation flux and great resolution of this instrument allow the analysis of the occupation factors and anisotropic displacement parameters (ADPs) by Rietveld refinement of the diffraction patterns. The calculated profiles are defined in the cubic Pm3m (No. 221) space group and display a very good agreement with experimental data (Figure 2a,b). Using this description, Sb is located at 1b (1/2, 1/2, 1/2), Ag and Sb atoms are located at 3c (1/2, 1/2, 0), and Te is located at 1a (0, 0, 0) and 3d (0, 1/2, 0) Wyckoff positions. Structural parameters resulting from the refinement are shown in Table 1. This is a rock-salt-like crystallographic structure with every position showing an octahedral configuration and equal average bond lengths. In nominal Ag0.7Sb1.12Te2, the Ag deficiency and Sb excess are determined in the refinement, showing values similar to those from EDX analysis (see Supporting Information, section SI3).
Figure 2.
Synchrotron XRD patterns of nominal (a) Ag0.7Sb1.12Te2 and (b) Ag0.7Sb1.12Te1.95Se0.05 at room temperature. The experimental data are shown as red crosses, the calculated pattern is shown as a black line, and the difference is shown as a blue line. The insets display (a) a single peak profile and (b) the typical profile for two overlapping peaks. There are no observed secondary phases within the detection limits.
Table 1. Structural Parameters Calculated from the Rietveld Refinement of Nominal Compositions Ag0.7Sb1.12Te2 and Ag0.7Sb1.12Te1.95Se0.05 SXRD Data at Room Temperature.
| nominal composition | Ag0.7Sb1.12Te2 | refined composition | Ag0.86(4)Sb1.06(4)Te1.93(1) |
| lattice parameter (Å) | 6.08918(2) | cell volume (Å3) | 225.7748(9) |
| atomic
displacement parameters (Å2) | ||||
|---|---|---|---|---|
| atom | U11 | U22 | U33 | occ (<1) |
| Te1 | 0.0321(7) | 0.031(1) | 0.0321(7) | 1.000 |
| Te2 | 0.039(2) | 0.039(2) | 0.039(2) | 0.850(5) |
| Sb | 0.030(2) | 0.030(2) | 0.030(2) | 1.000 |
| Sb2 | 0.0352(9) | 0.0352(9) | 0.072 (2) | 0.37(2) |
| Ag | 0.0352(9) | 0.0352(9) | 0.072 (2) | 0.58(2) |
| agreement factors |
bonding distance (Å) | ||||
|---|---|---|---|---|---|
| RI (%) | Rp (%) | Rwp (%) | Rexp (%) | χ2 | d(Ag/Sb–Te) |
| 2.3 | 2.3 | 3.0 | 1.4 | 4.7 | 3.04459(2) |
| nominal composition Ag0.7Sb1.12Te1.95Se0.05 | ||
|---|---|---|
| refined composition | Ag0.8Sb1.14Te1.91Se0.09 | Ag0.8Sb1.14Te1.97Se0.03 |
| phase abundance (%) | 33.9(2) | 66.1(2) |
| lattice parameter (Å) | 6.07103(2) | 6.07544(2) |
| cell volume (Å3) | 223.762(1) | 224.251(1) |
| atomic
displacement parameters (Å2) | |||||
|---|---|---|---|---|---|
| occ (<1) |
|||||
| atom | U11 | U22 | U33 | ||
| Te1 | 0.0282(4) | 0.0295(9) | 0.0282(4) | 1.00 | 1.00 |
| Te2 | 0.051(1) | 0.051(1) | 0.051(1) | 0.82 | 0.94 |
| Se | 0.051(1) | 0.051(1) | 0.051(1) | 0.18 | 0.06 |
| Sb | 0.0246(9) | 0.0246(9) | 0.0246(9) | 1.00 | 1.00 |
| Sb2 | 0.0308(5) | 0.0308(5) | 0.063(2) | 0.43 | 0.43 |
| Ag | 0.0308(5) | 0.0308(5) | 0.063(2) | 0.53 | 0.53 |
| agreement factors |
bonding distance (Å) |
||||||
|---|---|---|---|---|---|---|---|
|
RI (%) |
d(Ag/Sb–Te) |
||||||
| Rp (%) | Rwp (%) | Rexp (%) | χ2 | ||||
| 2.63 | 2.60 | 2.3 | 3.1 | 1.5 | 4.2 | 3.03551(2) | 3.03772(2) |
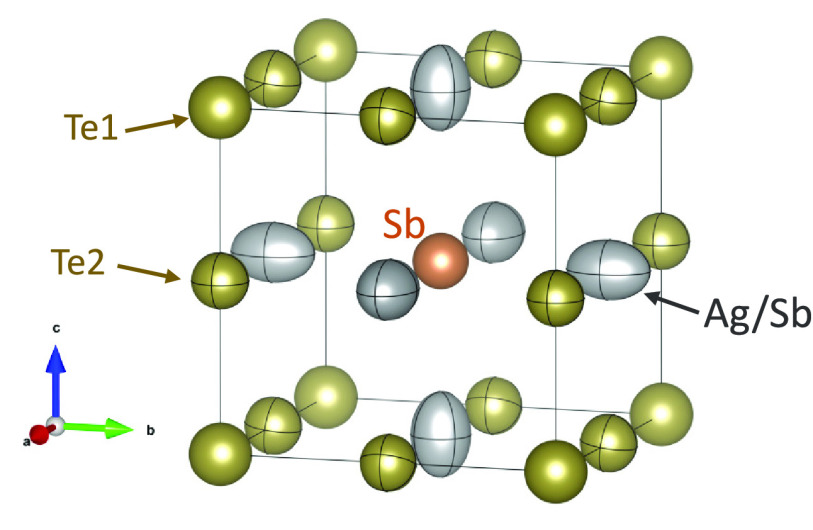
Despite the induced vacancies in the crystal structure and the reduced covalent radius of Sb (1.39 Å) vs Ag (1.45 Å),39 the lattice parameter of nominal Ag0.7Sb1.12Te2 increases with respect to stoichiometric AgSbTe2 (6.0788 Å).38 This expansion of the unit cell agrees with a reduced bonding strength, with bond length increasing from d(Ag/Sb–Te) = 3.03939 Å to d(Ag/Sb–Te) = 3.04459(4) Å, which can be a consequence of increased SbAg substitution and filling of antibonding states as previously described.40 The reduced bond order can lead to reduced lattice thermal conductivity, altered bandwidth, and effective mass. The representation of the Ag0.7Sb1.12Te2 structure is shown in Figure 3. In our previous report on stoichiometric AgSbTe2, the ADP ellipsoids of Ag/Sb atoms at 3c positions displayed a disk-like shape elongated along Ag/Sb–Te bonds (Supporting Information, section SI4). However, here, the ADP ellipsoids are hugely elongated along Ag/Sb–Sb bonds, indicating weakened interactions. Comparing absolute values, the 3c ADP values are still similar to those of the stoichiometric composition in the bc plane (along Ag/Sb–Te bonds), while there is an overall increase in every position. Furthermore, the ellipsoids at Te1 show much larger U11 and U33 and slightly reduced U22, suggesting more homogeneous surroundings, which would be in agreement with weaker Sb/Ag–Te interactions. This scheme agrees well with weakened bond order in the structure, in which there is a significant increase of static and dynamic disorder at the 3c(Sb/Ag) position.
Figure 3.
Representation of refined Ag0.7Sb1.12Te2 crystal structure, including the ADP as ellipsoids determined by crystal symmetry.
The diffraction pattern of Ag0.7Sb1.12Te1.95Se0.05 displays a conspicuous splitting of the peaks, more visible at high diffraction angles, as shown in the inset of Figure 2b. This indicates a phase segregation into two cubic phases with a slight variation of the lattice parameter and thus either different structural order or phase composition. The segregation into domains with different composition has been previously described by microscopic analysis and is observed here thanks to the high resolution of the synchrotron experiment.41 This segregation is proposed as two differently Se-doped phases, of which the occupation factors were fixed based on elemental analysis by EDX. The fast solidification of melted particles in complex systems can lead to localized temperature gradients and might result in layered cooling, producing small variations in the composition of the segregated phases.42 The best agreement factors were obtained by placing Se atoms at the 1a Wyckoff positions using the occupation factors described in Table 1. Any attempts to introduce Se at 3c Wyckoff positions were unsuccessful, leading to unrealistic compositions. This suggests that the substitution of Te2 by Se is the most favorable configuration. As a consequence of the smaller covalent radius of Se (1.20 Å) compared to Te (1.38 Å),39 there is a reduction of the lattice parameter to values similar to other Se-doped samples in the literature.25 The ADP values of this sample show an arrangement similar to that in the undoped off-stoichiometric composition, as the ellipsoids at 3c positions are elongated along Ag/Sb–Sb bonds. Additionally, the Te1/Se position shows larger disorder with increased ADP values, as expected for the shared crystallographic position. Overall, the Ag- and Sb-off stoichiometry and Se doping induces further weakening of bonding interactions.
SEM and HRTEM Microscopy
SEM micrographs (Figure 4) show a compact morphology in the pellets, with the typical layered structure found for arc-melted samples.33,38,43Figure 4a,b shows the microstructure of Ag0.7Sb1.12Te2, while the morphology of Ag0.7Sb1.12Te1.95Se0.05 is depicted in Figure 4c,d. Figure 4a,c shows high densification over large areas of the compacted pellets (ca. 450 μm), whereas micrographs of the cross section of the pellets are included in Figure 4b,d. The melting in an arc furnace results in strongly textured materials, consisting of stacked sheets, on a nanoscale in one direction. The nanostructuring strongly influences the thermoelectric properties of these materials, providing surface boundaries that induce a significant scattering of phonons and electrons.44 The actual composition, assessed semiquantitatively using EDX in over ten individual crystals, shows a small deviation from the nominal composition, as Ag0.9Sb1.04Te2 and Ag0.79Sb1.13Te1.87Se0.06 (Supporting Information, section SI3), which agrees with the best Rietveld refinements of the synchrotron X-ray diffraction data.
Figure 4.
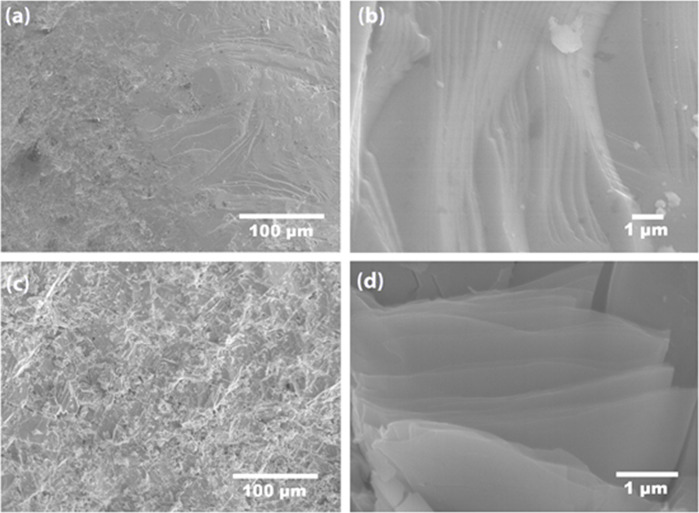
SEM micrographs of arc-melted (a, b) Ag0.7Sb1.12Te2 and (c, d) Ag0.7Sb1.12Te1.95Se0.05.
The crystals of the two arc-melted samples were examined using high-resolution transmission electron microscopy (HRTEM) and selected area electron diffraction (SAED). Figure 5a shows the experimental image captured along the [100] zone axis of the Ag0.7Sb1.12Te2 sample, while Figure 5b depicts the Ag0.7Sb1.12Te1.95Se0.05 HRTEM micrograph along the [111] zone axis. In both images, the dots with color contrast represent the atomic columns’ projections stemming from the Ag/Sb and Te/Se sublattices, revealing a highly crystalline and ordered structure. The study of the reciprocal space by SAED, shown in the upper panel of both micrographs, confirms the cubic structure with a cell parameter of ca. 6.07 Å, in good agreement with the information extracted from synchrotron X-ray diffraction. The lack of additional reflections, streaking lines, or diffuse scattering among the main reflections confirms the absence of extended defects, superstructures, dislocations, etc. Enlargements of the HRTEM images, with the corresponding model projections (Ag/Sb in gray and Te/Se in yellow) overlaid on the experimental images for each material, are presented in the bottom part of both figure panels, demonstrating a strong level of agreement between the model and the micrographs.
Figure 5.
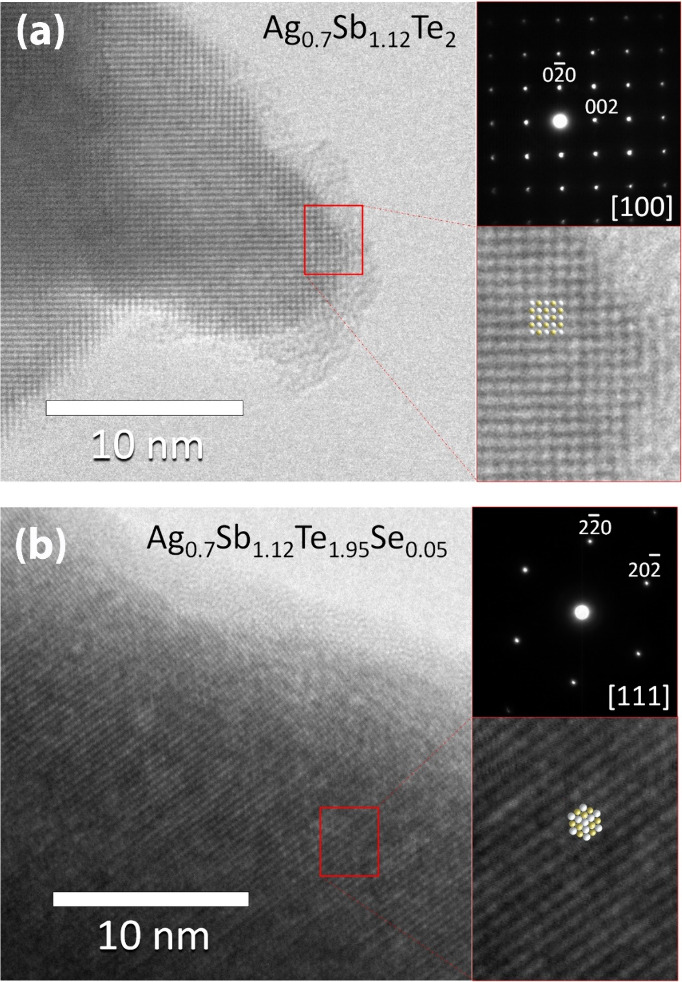
Experimental HRTEM micrographs of nominal (a) Ag0.7Sb1.12Te2 along the [100] zone axis and (b) Ag0.7Sb1.12Te1.95Se0.05 along the [111] zone axis. The upper insets on the right of both panels display SAED patterns, while the bottom insets offer a magnified view of a specific region within the HRTEM images, as indicated by the red rectangle.
Thermoelectric Properties
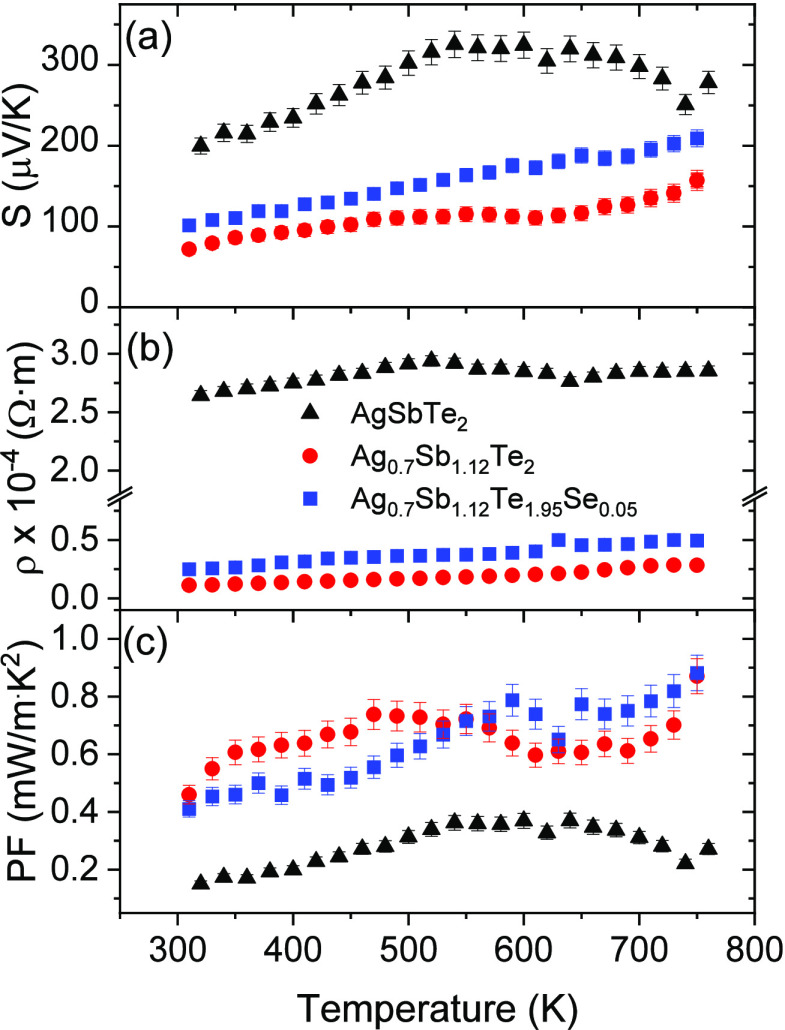
The evolution of the electrical transport properties of Ag0.7Sb1.12Te2 and Ag0.7Sb1.12Te1.95Se0.05 with temperature is shown in Figure 6 and compared with previously reported38 similarly synthesized stoichiometric AgSbTe2. A monotonic increase in the Seebeck coefficient is observed as the temperature increases (Figure 6a) in both Ag-deficient samples. However, a maximum Seebeck value is not reached within the measurement range of the equipment and, considering that the melting point is around 830 K, there is no room for measurement at higher temperatures. All samples exhibit a positive Seebeck coefficient, indicating that the dominant charge carriers for the prepared compositions are holes (p-type conductivity). Although in AgSbTe2 a bipolar contribution is evident as there is initially an increment of the Seebeck coefficient, followed by a plateau up to 700 K followed by a sharp reduction, this behavior is not visible in the measured temperature range for the nonstoichiometric samples in this study. Maximum values of the Seebeck coefficients of 157 and 209 μV K–1 were measured for Ag0.7Sb1.12Te2 and Ag0.7Sb1.12Te1.95Se0.05, respectively, both at 750 K. These values are notably lower than the Seebeck coefficient of 340 V K–1 at 540 K reported for the arc-melted AgSbTe2 reference.38 This decrease might be associated with an increase in the carrier concentration, which is consistent with the significant variation in electrical resistivity, reduced by 1 order of magnitude through compositional engineering in Ag-deficient samples (Figure 6b). The electrical properties of pristine AgSbTe2 are mainly hindered by its high electrical resistivity because of deficient carrier concentration,8 while using this vacancy-engineering strategy might produce an enhancement of the number of charge carriers, similar to what has been reported for other aliovalent doped samples.15,23,26,45,46 Furthermore, the synthesis method also plays a critical role in the electrical properties. As an example, it has been reported that ball-milling AgSbTe2 induces changes of carrier density (due to the presence of defects), and in this case, nanostructuration produced by arc-melting also affects the electrical properties. In this work, the resistivity of the Ag-deficient samples (Figure 6b) increases slightly with temperature, from 1.2 × 10⁻⁵ to 2.9 × 10⁻⁵ Ω m between 300 and 750 K for Ag0.7Sb1.12Te2 and 2.3 × 10⁻⁵ to 5.1 × 10⁻⁵ Ω m at the same temperature range for Ag0.7Sb1.12Te1.95Se0.05.
Figure 6.
Temperature dependence of (a) the Seebeck coefficient (S), (b) electrical resistivity (ρ), and (c) power factor (PF = S2/ρ) of the arc-melted AgSbTe2-based samples. Error bars are indicated in the graphics.
As a result, a power factor of close to 0.9 mW m–1 K–2 at 750 K is calculated for both samples (Figure 6c). This power factor value is approximately 125% higher than the maximum value found for the AgSbTe2 arc-melted sample (0.4 mW m–1 K–2 at 630 K). However, it is worth noting that more recently, higher power factors, up to 2.1 mW m–1 K–2 at 673 K, have been identified in AgSbTe1.85Se0.1S0.05 system, where the charge carrier density and phase stability of polycrystalline AgSbTe2 were optimized by doping with S and Se.40
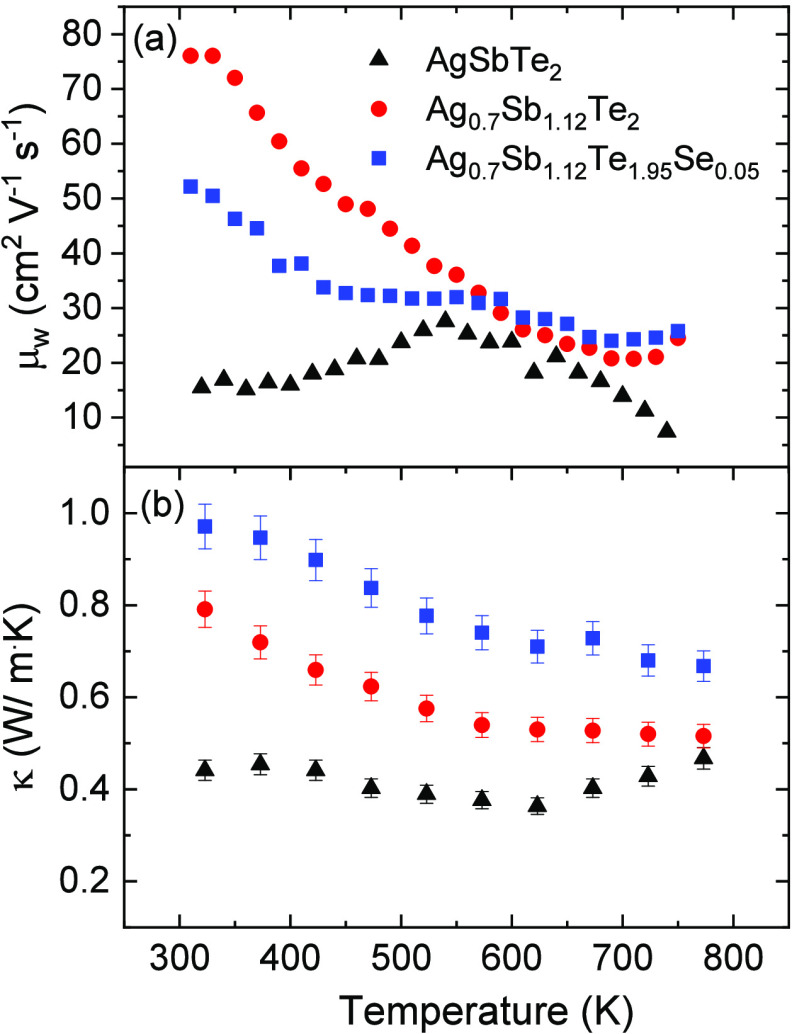
Figure 7a represents the temperature dependence of the weighted mobility of the arc-melted samples. Characterizing charge carrier mobility through experimental means is of paramount importance for comprehending and engineering thermoelectric materials. This parameter can easily be calculated from the measured values of the Seebeck coefficient and the electrical conductivity as described by Snyder et al.(47) As expected, this parameter is higher for Ag0.7Sb1.12Te2 and Ag0.7Sb1.12Te1.95Se0.05 than for AgSbTe2, due to the higher purity of the samples, as lattice boundaries with Ag2Te impurities and different Sb-rich domains are not present in these samples by using phase-pure compositions. Moreover, Ag-deficient samples have been shown to increase cationic Ag/Sb order and allow for better carrier mobility in this material, as Ag vacancies favor the rearrangement of cation in the AgSbTe2 structure.32 At room temperature, the maximum value of weighted mobility was 76 cm2 V–1 s–1 in Ag0.7Sb1.12Te2, whereas stoichiometric AgSbTe2 exhibits a value of 15 cm2 V–1 s–1. This disparity becomes less pronounced at higher temperatures, with values of 7, 24, and 26 cm2 V–1 s–1 for AgSbTe2, Ag0.7Sb1.12Te2, and Ag0.7Sb1.12Te1.95Se0.05, respectively. The weighted mobility agrees well with the Hall mobility of the minority n-type carriers at 300 K but is an order of magnitude higher than that of the majority carriers (Hall mobility and carrier concentrations are given in Supporting Information, section SI5), calculated using the two-band model of Jovovic et al.(48))
Figure 7.
Temperature dependence of (a) weighted mobility and (b) total thermal conductivity of the arc-melted AgSbTe2-based samples. Error bars are indicated in the graphics.
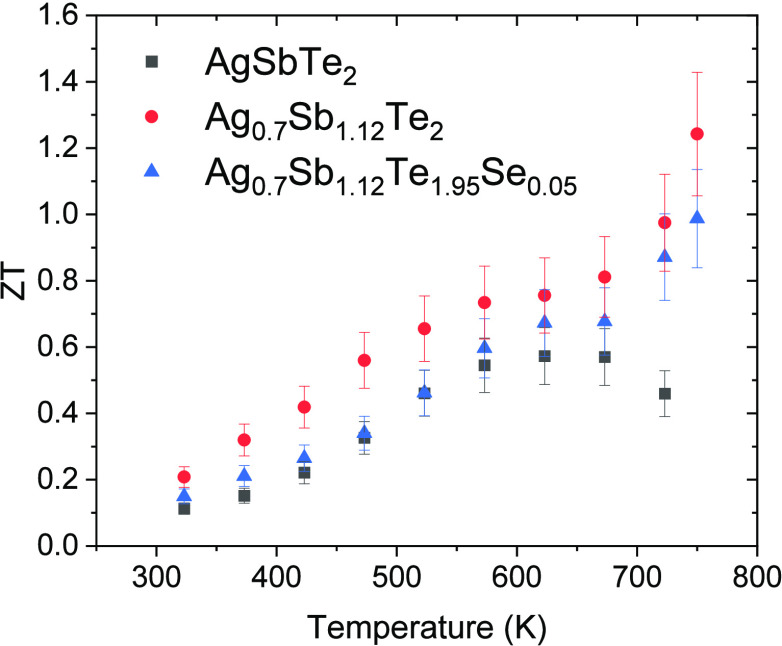
AgSbTe2 presents an exceptionally low intrinsic thermal conductivity due to the anharmonic nature of the Sb–Te bonds, which is primarily attributed to the stereochemically active 5s2 lone pairs of Sb atoms. This anharmonicity is a consequence of the electrostatic repulsion between the lone electron pairs of Sb and the valence bonding charge of Se. Furthermore, the disorder of Ag/Sb on the face-centered lattice reduces the thermal conductivity, as it creates effective scattering of heat-carrying phonons. In the Ag-deficient samples, synthesized in this work (Ag0.7Sb1.12Te2 and Ag0.7Sb1.12Te1.95Se0.05), there is a clear decrease in the thermal conductivity as temperature increases (Figure 7b), although the thermal conductivity is slightly higher at room temperature. This reduction in thermal conductivity eventually leads to values of 0.50 and 0.64 W m–1 K–1 at 773 K in Ag0.7Sb1.12Te2 and Ag0.7Sb1.12Te1.95Se0.05, respectively, which are close to the thermal conductivity value of 0.50 W m–1 K–1 in AgSbTe2. According to the literature, the glass-like thermal conductivity values for AgSbTe2 systems fall within a range of 0.4–0.6 W m–1 K–1,8,49 exhibiting a relatively consistent behavior over a range of temperature changes. These low values found in the Ag-deficient samples prepared by arc-melting with the higher electronic conductivity might be attributed to the nanostructured nature of the samples, leading to strong phonon scattering at grain boundaries. The presence of vacancies in an Ag/Sb position and the cation disorder in the rock-salt structure hinder phonon transport due to random fluctuations in the local force constants of Ag/Sb cations. Since Ag and Sb atoms share identical crystallographic positions with varying valence electron configurations, nanoscale deviations from crystalline lattice periodicity emerge in regions enriched with Ag or Sb, resulting in an increased number of phonon scattering centers.8 The electronic and lattice contributions of thermal conductivity, along with the verification of reproducibility of the thermoelectric properties across different samples, are detailed in the Supporting Information, sections SI6 and SI7. It is observed that due to the lower electrical conductivity (and reduced total thermal conductivity) in Ag0.7Sb1.12Te2, the lattice thermal conductivity is considerably lower than in Ag0.7Sb1.12Te1.95Se0.05. Disordered, al-scale hierarchical morphology has previously shown lattice contribution below the amorphous limit in SnTe, reaching almost negligible values.4,50 In AgSbTe2, this limit is closer to 0.2 W m–1 K–1 that our sample slightly crosses at higher temperatures (Supporting Information, section SI6).19 Taking into account the enhanced power factor and similar thermal conductivity, the figure of merit (zT) calculated for the three samples is higher for Ag0.7Sb1.12Te2 and Ag0.7Sb1.12Te1.95Se0.05. In the case of Ag0.7Sb1.12Te2, a maximum zT of 1.25 at 750 K was determined, while Ag0.7Sb1.12Te1.95Se0.05 exhibited a maximum of zT of 1.01 at the same temperature (Figure 8). These results demonstrate that compositional engineering, achieved by introducing Ag vacancies into the AgSbTe2 system, yields properties promising for the thermoelectric energy conversion sector, particularly in the mid-temperature region.
Figure 8.
Temperature dependence of the figure of merit (zT) of the arc-melted AgSbTe2-based samples. Error bars are indicated in the graphic.
Conclusions
This study describes the arc-melting synthesis, structural analysis, and thermoelectric characteristics of Ag0.7Sb1.12Te2 and Ag0.7Sb1.12Te1.95Se0.05.These Ag-deficient materials were prepared as an approach to understand the effect of compositional engineering by introducing Ag vacancies within the well-known AgSbTe2 thermoelectric material. These vacancies induce an enlargement of the unit cell, and this suggests the filling of antibonding states with SbAg and the weakening of covalent bonding interactions within the crystalline structure. Additionally, enlargement of ADP ellipsoids indicates further anharmonic bonding and contributes to a reduced lattice thermal conductivity. The nanostructured nature of the samples significantly contributes to their thermoelectric performance, creating effective phonon scattering at grain boundaries. This effect coupled with the anharmonic nature of their chemical bonds generates a glass-like low thermal conductivity, reaching values of 0.50 and 0.64 W m–1 K–1 at 773 K in Ag0.7Sb1.12Te2 and Ag0.7Sb1.12Te1.95Se0.05, respectively. The relatively high Seebeck coefficient values found for these samples, combined with a decrease of an order of magnitude in the resistivity of the Ag-deficient samples compared to arc-melted AgSbTe2, result in a power factor of approximately 0.9 mW m–1 K–2 at 750 K. Furthermore, cation ordering and weakened localization could be related to the reduced scattering of charge carriers, primarily resulting from the stabilization of the AgSbTe2 rock-salt structure, particularly by silver vacancies, as observed from the weighted mobility. Consequently, high zT figures of merit of 1.25 at 750 K for Ag0.7Sb1.12Te2 and 1.01 for Ag0.7Sb1.12Te1.95Se0.05 have been reached. These findings demonstrate that compositional engineering can enhance the thermoelectric properties of materials and offer valuable insights into the development of efficient thermoelectric materials, particularly in the mid-temperature range.
Acknowledgments
This publication is part of the R+D+i projects CNS2022-135302, TED2021-129569A-I00, TED2021-129254B-C21, and TED2021-129254B-C22, financed by MCIN/AEI/10.13039/501100011033/ and by the “European Union NextGenerationEU/PRTR”, and PID2020-112848RB-C21 and PID2021-122477OB-I00, financed by MCIN/AEI/10.13039/501100011033/. F.S.-S. thanks the MICIN and grant RYC2021-033518-I. We also wish to express our gratitude to the ESRF, CNME, ICMM, and UCM CAIs technical staff for providing the facilities for the characterization of the materials.
Supporting Information Available
The Supporting Information is available free of charge at https://pubs.acs.org/doi/10.1021/acsaelm.3c01653.
Differential scanning calorimetry (DSC), sample cutting process, EDX analysis, atomic displacement parameters of nominal AgSbTe2, Hall carrier concentration and mobility, thermal conductivity, and reproducibility study (PDF)
The authors declare no competing financial interest.
Supplementary Material
References
- Snyder G. J.; Toberer E. S. Complex thermoelectric materials. Nature materials 2008, 7 (2), 105–114. 10.1038/nmat2090. [DOI] [PubMed] [Google Scholar]
- Zeier W. G.; Zevalkink A.; Gibbs Z. M.; Hautier G.; Kanatzidis M. G.; Snyder G. J. Thinking like a chemist: intuition in thermoelectric materials. Angew. Chem., Int. Ed. 2016, 55 (24), 6826–6841. 10.1002/anie.201508381. [DOI] [PubMed] [Google Scholar]
- Shi X.-L.; Zou J.; Chen Z.-G. Advanced thermoelectric design: from materials and structures to devices. Chem. Rev. 2020, 120 (15), 7399–7515. 10.1021/acs.chemrev.0c00026. [DOI] [PubMed] [Google Scholar]
- Wang L.; Hong M.; Sun Q.; Wang Y.; Yue L.; Zheng S.; Zou J.; Chen Z.-G. Hierarchical structuring to break the amorphous limit of lattice thermal conductivity in high-performance SnTe-based thermoelectrics. ACS Appl. Mater. Interfaces 2020, 12 (32), 36370–36379. 10.1021/acsami.0c09781. [DOI] [PubMed] [Google Scholar]
- Powell A. V.; Vaqueiro P., Chalcogenide thermoelectric materials. In Thermoelectric Materials and Devices; The Royal Society of Chemistry: 2016; pp 27–59. [Google Scholar]
- Zhao L.-D.; Lo S.-H.; Zhang Y.; Sun H.; Tan G.; Uher C.; Wolverton C.; Dravid V. P.; Kanatzidis M. G. Ultralow thermal conductivity and high thermoelectric figure of merit in SnSe crystals. nature 2014, 508 (7496), 373–377. 10.1038/nature13184. [DOI] [PubMed] [Google Scholar]
- Chen Z.; Jian Z.; Li W.; Chang Y.; Ge B.; Hanus R.; Yang J.; Chen Y.; Huang M.; Snyder G. J.; et al. Lattice dislocations enhancing thermoelectric PbTe in addition to band convergence. Adv. Mater. 2017, 29 (23), 1606768. 10.1002/adma.201606768. [DOI] [PubMed] [Google Scholar]
- Cui J.; Tang X.; Tan G. Advances and Challenges of AgSbSe2 based Thermoelectric Materials. ChemNanoMat 2022, 8 (10), e202200301. 10.1002/cnma.202200301. [DOI] [Google Scholar]
- Freer R.; Powell A. V. Realising the potential of thermoelectric technology: A Roadmap. Journal of Materials Chemistry C 2020, 8 (2), 441–463. 10.1039/C9TC05710B. [DOI] [Google Scholar]
- Schröder T.; Rosenthal T.; Giesbrecht N.; Nentwig M.; Maier S.; Wang H.; Snyder G. J.; Oeckler O. Nanostructures in Te/Sb/Ge/Ag (TAGS) thermoelectric materials induced by phase transitions associated with vacancy ordering. Inorganic chemistry 2014, 53 (14), 7722–7729. 10.1021/ic5010243. [DOI] [PubMed] [Google Scholar]
- Skrabek E.; Trimmer D., Properties of the general TAGS system. In CRC handbook of thermoelectrics; CRC Press: 2018; pp 267–276. [Google Scholar]
- Chen N.; Gascoin F.; Snyder G. J.; Müller E.; Karpinski G.; Stiewe C. Macroscopic thermoelectric inhomogeneities in (AgSbTe2)x(PbTe)1-x. Appl. Phys. Lett. 2005, 87 (17), 171903. 10.1063/1.2056590. [DOI] [Google Scholar]
- Li Y.; Ma B.; Zhu L.; Liu S.; Zhang F.; Li X.; Liang P.; Chao X.; Yang Z.; He J.; et al. Identifying polymorphic lattice positioning of copper and the effects on the thermoelectric performance of δ-LAST. Materials Today Physics 2022, 27, 100833. 10.1016/j.mtphys.2022.100833. [DOI] [Google Scholar]
- Wang H.; Li J.-F.; Zou M.; Sui T. Synthesis and transport property of AgSbTe2 as a promising thermoelectric compound. Appl. Phys. Lett. 2008, 93 (20), 202106. 10.1063/1.3029774. [DOI] [Google Scholar]
- Guin S. N.; Chatterjee A.; Negi D. S.; Datta R.; Biswas K. High thermoelectric performance in tellurium free p-type AgSbSe2. Energy Environ. Sci. 2013, 6 (9), 2603–2608. 10.1039/c3ee41935e. [DOI] [Google Scholar]
- Xu J.; Li H.; Du B.; Tang X.; Zhang Q.; Uher C. High thermoelectric figure of merit and nanostructuring in bulk AgSbTe2. J. Mater. Chem. 2010, 20 (29), 6138–6143. 10.1039/c0jm00138d. [DOI] [Google Scholar]
- Cao J.; Dong J.; Saglik K.; Zhang D.; Solco S. F. D.; You I. J. W. J.; Liu H.; Zhu Q.; Xu J.; Wu J.; et al. Non-equilibrium strategy for enhancing thermoelectric properties and improving stability of AgSbTe2. Nano Energy 2023, 107, 108118. 10.1016/j.nanoen.2022.108118. [DOI] [Google Scholar]
- Wu Y.; Qiu P.; Yu Y.; Xiong Y.; Deng T.; Cojocaru-Miredin O.; Wuttig M.; Shi X.; Chen L. High-performance and stable AgSbTe2-based thermoelectric materials for near room temperature applications. Journal of Materiomics 2022, 8 (6), 1095–1103. 10.1016/j.jmat.2022.07.005. [DOI] [Google Scholar]
- Taneja V.; Das S.; Dolui K.; Ghosh T.; Bhui A.; Bhat U.; Kedia D. K.; Pal K.; Datta R.; Biswas K. High Thermoelectric Performance in Phonon Glass Electron Crystal Like AgSbTe2. Adv. Mater. 2023, 36, 2307058. 10.1002/adma.202307058. [DOI] [PubMed] [Google Scholar]
- Roychowdhury S.; Ghosh T.; Arora R.; Samanta M.; Xie L.; Singh N. K.; Soni A.; He J.; Waghmare U. V.; Biswas K. Enhanced atomic ordering leads to high thermoelectric performance in AgSbTe2. Science 2021, 371 (6530), 722–727. 10.1126/science.abb3517. [DOI] [PubMed] [Google Scholar]
- Bhui A.; Das S.; Arora R.; Bhat U.; Dutta P.; Ghosh T.; Pathak R.; Datta R.; Waghmare U. V.; Biswas K. Hg Doping Induced Reduction in Structural Disorder Enhances the Thermoelectric Performance in AgSbTe2. J. Am. Chem. Soc. 2023, 145 (46), 25392–25400. 10.1021/jacs.3c09643. [DOI] [PubMed] [Google Scholar]
- Ghosh T.; Roychowdhury S.; Dutta M.; Biswas K. High-performance thermoelectric energy conversion: A tale of atomic ordering in AgSbTe2. ACS Energy Letters 2021, 6 (8), 2825–2837. 10.1021/acsenergylett.1c01184. [DOI] [Google Scholar]
- Mohanraman R.; Sankar R.; Chou F.; Lee C.; Chen Y.-Y. Enhanced thermoelectric performance in Bi-doped p-type AgSbTe2 compounds. J. Appl. Phys. 2013, 114 (16), 163712. 10.1063/1.4828478. [DOI] [Google Scholar]
- Du B.; Li H.; Tang X. Enhanced thermoelectric performance in Na-doped p-type nonstoichiometric AgSbTe2 compound. J. Alloys Compd. 2011, 509 (5), 2039–2043. 10.1016/j.jallcom.2010.10.131. [DOI] [Google Scholar]
- Du B.; Li H.; Xu J.; Tang X.; Uher C. Enhanced figure-of-merit in Se-doped p-type AgSbTe2 thermoelectric compound. Chem. Mater. 2010, 22 (19), 5521–5527. 10.1021/cm101503y. [DOI] [Google Scholar]
- Zhang H.; Luo J.; Zhu H.-T.; Liu Q.-L.; Liang J.-K.; Li J.-B.; Liu G.-Y. Synthesis and thermoelectric properties of Mn-doped AgSbTe2 compounds. Chinese Physics B 2012, 21 (10), 106101. 10.1088/1674-1056/21/10/106101. [DOI] [Google Scholar]
- Du R.; Zhang G.; Hao M.; Xuan X.; Peng P.; Fan P.; Si H.; Yang G.; Wang C. Enhanced Thermoelectric Performance of Mg-Doped AgSbTe2 by Inhibiting the Formation of Ag2Te. ACS Appl. Mater. Interfaces 2023, 15 (7), 9508–9516. 10.1021/acsami.2c22930. [DOI] [PubMed] [Google Scholar]
- Du B.; Yan Y.; Tang X. Variable-temperature in situ X-ray diffraction study of the thermodynamic evolution of AgSbTe2 thermoelectric compound. J. Electron. Mater. 2015, 44, 2118–2123. 10.1007/s11664-015-3682-z. [DOI] [Google Scholar]
- Nielsen M. D.; Jaworski C. M.; Heremans J. P. Off-stoichiometric silver antimony telluride: An experimental study of transport properties with intrinsic and extrinsic doping. AIP Advances 2015, 5 (5), 053602. 10.1063/1.4916217. [DOI] [Google Scholar]
- Morelli D.; Jovovic V.; Heremans J. Intrinsically minimal thermal conductivity in cubic I- V- VI 2 semiconductors. Physical review letters 2008, 101 (3), 035901. 10.1103/PhysRevLett.101.035901. [DOI] [PubMed] [Google Scholar]
- Ye L.-H.; Hoang K.; Freeman A.; Mahanti S.; He J.; Tritt T. M.; Kanatzidis M. First-principles study of the electronic, optical, and lattice vibrational properties of AgSbTe2. Phys. Rev. B 2008, 77 (24), 245203. 10.1103/PhysRevB.77.245203. [DOI] [Google Scholar]
- Pathak R.; Xie L.; Das S.; Ghosh T.; Bhui A.; Dolui K.; Sanyal D.; He J.; Biswas K. Vacancy Controlled Nanoscale Cation Ordering Leads to High Thermoelectric Performance. Energy Environ. Sci. 2023, 16, 3110–3118. 10.1039/D3EE01033C. [DOI] [Google Scholar]
- Serrano-Sánchez F.; Funes M.; Nemes N.; Dura O.; Martínez J.; Prado-Gonjal J.; Fernández-Díaz M.; Alonso J. Low lattice thermal conductivity in arc-melted GeTe with Ge-deficient crystal structure. Appl. Phys. Lett. 2018, 113 (8), 083902. 10.1063/1.5043359. [DOI] [Google Scholar]
- Gainza J.; Moltó S.; Serrano-Sánchez F.; Dura O. J.; Fernández-Díaz M. T.; Biškup N.; Martínez J. L.; Alonso J. A.; Nemes N. M. SnSe:Kx intermetallic thermoelectric polycrystals prepared by arc-melting. J. Mater. Sci. 2022, 57 (18), 8489–8503. 10.1007/s10853-021-06864-4. [DOI] [Google Scholar]
- Fitch A.; Dejoie C.; Covacci E.; Confalonieri G.; Grendal O.; Claustre L.; Guillou P.; Kieffer J.; Nolf W. d.; Petitdemange S.; et al. ID22-the high-resolution powder-diffraction beamline at ESRF. Journal of Synchrotron Radiation 2023, 30 (5), 1003–1012. 10.1107/S1600577523004915. [DOI] [PMC free article] [PubMed] [Google Scholar]
- Rodríguez-Carvajal J. Recent advances in magnetic structure determination by neutron powder diffraction. Physica B: Condensed Matter 1993, 192 (1–2), 55–69. 10.1016/0921-4526(93)90108-I. [DOI] [Google Scholar]
- Digital Micrograph, 1.71.38; Gatan, Inc.: 2010.
- Gainza J.; Serrano-Sánchez F.; Dura O. J.; Nemes N. M.; Martínez J. L.; Fernández-Díaz M. T.; Alonso J. A. Reduced Thermal Conductivity in Nanostructured AgSbTe2 Thermoelectric Material, Obtained by Arc-Melting. Nanomaterials 2022, 12 (21), 3910. 10.3390/nano12213910. [DOI] [PMC free article] [PubMed] [Google Scholar]
- Cordero B.; Gómez V.; Platero-Prats A. E.; Revés M.; Echeverría J.; Cremades E.; Barragán F.; Alvarez S. Covalent radii revisited. Dalton Transactions 2008, (21), 2832–2838. 10.1039/b801115j. [DOI] [PubMed] [Google Scholar]
- Zhang Y.; Li Z.; Singh S.; Nozariasbmarz A.; Li W.; Genç A.; Xia Y.; Zheng L.; Lee S. H.; Karan S. K.; et al. Defect Engineering Stabilized AgSbTe2 with High Thermoelectric Performance. Adv. Mater. 2023, 35 (11), 2208994. 10.1002/adma.202208994. [DOI] [PubMed] [Google Scholar]
- Lee J. K.; Ryu B.; Park S.; Son J. H.; Park J.; Jang J.; Oh M.-W.; Park S. Effect of microstructure on thermoelectric conversion efficiency in metastable δ-phase AgSbTe2. Acta Mater. 2022, 222, 117443. 10.1016/j.actamat.2021.117443. [DOI] [Google Scholar]
- Serrano-Sánchez F.; Gharsallah M.; Bermúdez J.; Carrascoso F.; Nemes N. M.; Dura O. J.; de la Torre M. A. L.; Martínez J. L.; Fernández-Díaz M. T.; Alonso J. A., Nanostructured state-of-the-art thermoelectric materials prepared by straight-forward arc-melting method. In Thermoelectrics for Power Generation-A Look at Trends in the Technology; InTech Open: 2016; Chapter 8. [Google Scholar]
- Gharsallah M.; Serrano-Sanchez F.; Nemes N. M.; Martinez J. L.; Alonso J. A. Influence of doping and nanostructuration on n-type Bi2(Te0.8Se0.2)3 alloys synthesized by Arc melting. Nanoscale Res. Lett. 2017, 12, 1–8. 10.1186/s11671-016-1823-9. [DOI] [PMC free article] [PubMed] [Google Scholar]
- Chen Z.-G.; Han G.; Yang L.; Cheng L.; Zou J. Nanostructured thermoelectric materials: Current research and future challenge. Progress in Natural Science: Materials International 2012, 22 (6), 535–549. 10.1016/j.pnsc.2012.11.011. [DOI] [Google Scholar]
- Guin S. N.; Negi D. S.; Datta R.; Biswas K. Nanostructuring, carrier engineering and bond anharmonicity synergistically boost the thermoelectric performance of p-type AgSbSe2-ZnSe. Journal of Materials Chemistry A 2014, 2 (12), 4324–4331. 10.1039/c3ta14901c. [DOI] [Google Scholar]
- Ghosh T.; Dutta M.; Sarkar D.; Biswas K. Insights into low thermal conductivity in inorganic materials for thermoelectrics. J. Am. Chem. Soc. 2022, 144 (23), 10099–10118. 10.1021/jacs.2c02017. [DOI] [PubMed] [Google Scholar]
- Snyder G. J.; Snyder A. H.; Wood M.; Gurunathan R.; Snyder B. H.; Niu C. Weighted mobility. Adv. Mater. 2020, 32 (25), 2001537. 10.1002/adma.202001537. [DOI] [PubMed] [Google Scholar]
- Jovovic V.; Heremans J. Measurements of the energy band gap and valence band structure of AgSbTe 2. Phys. Rev. B 2008, 77 (24), 245204. 10.1103/PhysRevB.77.245204. [DOI] [Google Scholar]
- Wojciechowski K.; Schmidt M.; Tobola J.; Koza M.; Olech A.; Zybała R. Influence of doping on structural and thermoelectric properties of AgSbSe2. Journal of electronic materials 2010, 39, 2053–2058. 10.1007/s11664-009-1008-8. [DOI] [Google Scholar]
- Zhang J.-W.; Wu Z.-W.; Xiang B.; Zhou N.-N.; Shi J.-L.; Zhang J.-X. Ultralow lattice thermal conductivity in SnTe by incorporating InSb. ACS Appl. Mater. Interfaces 2020, 12 (19), 21863–21870. 10.1021/acsami.0c03315. [DOI] [PubMed] [Google Scholar]
Associated Data
This section collects any data citations, data availability statements, or supplementary materials included in this article.


