Abstract
Segmental dynamics of specifically labeled poly(propylene oxide), PPO, based bottlebrush polymers, PNB-g-PPO, were studied using quasi-elastic neutron scattering. The focus was set to different parts of the side chains to investigate the hypothetical gradual relaxation behavior within the side chains of a bottlebrush polymer. Different sections of the side chains were highlighted for QENS via sequential polymerization of protonated and deuterated monomers to allow the study of the relaxation behavior of the inner and outer parts of the side chain separately. A comparison of these two parts reveals a slowdown due to the grafting process happening across the different regions. This is seen for the segmental relaxation time as well as on the time-dependent mean-square displacement. Additionally, the non-Gaussian parameter, α, shows a decreasing difference from Gaussian behavior with the distance to the backbone. Altogether, this leads to the conclusion that gradual relaxation behavior exists.
Introduction
Understanding the dynamic behavior of polymers is very important for a deeper knowledge of their materials’ characteristics and properties. Bottlebrush polymers show extraordinary viscoelastic behavior.1−3 Therefore, the dynamics of bottlebrush polymers became the subject of several studies.4−9 In bottlebrush polymers, linear side chains are covalently bonded to a linear backbone. High grafting density of side chains leads to chain stretching, resembling a brush-like structure. This morphology can be tuned into elongated as well as spherical objects by changing the size ratio of backbone to side chain.5,10,11 Tethering one end of a linear chain changes the dynamics, including the segmental motion.5 Previous studies on homo- and hetero-bottlebrush polymers showed a slower relaxation of tethered side chains than the untethered chains. This observation is dependent on the length of the side chain. The slowdown is strongest for short side chains and decreases with increasing length and eventually yield equal relaxation times.5 However, the backbone experiences a plasticizer effect with a faster motion.5,12
More details were revealed by quasi-elastic neutron scattering (QENS) experiments on fully protonated bottlebrush polymers that indicate a stronger length scale dependence for shorter side chains. This points to heterogeneous dynamics over the entire Q range of the experiments.4 Both studies suggest a side-chain length-dependent gradual relaxation behavior in which the segmental relaxation time of the side chains seems to change systematically with the distance from the backbone. The innermost segments are likely to experience the strongest influence from the grafting point, which would explain why the effect diminishes for sufficiently long side chains. This results in the hypothesis that gradual relaxation behavior exists within the side chains. In the presented study, we are focusing on this fact more in detail to test whether such a gradual relaxation behavior exists in bottlebrush polymers.
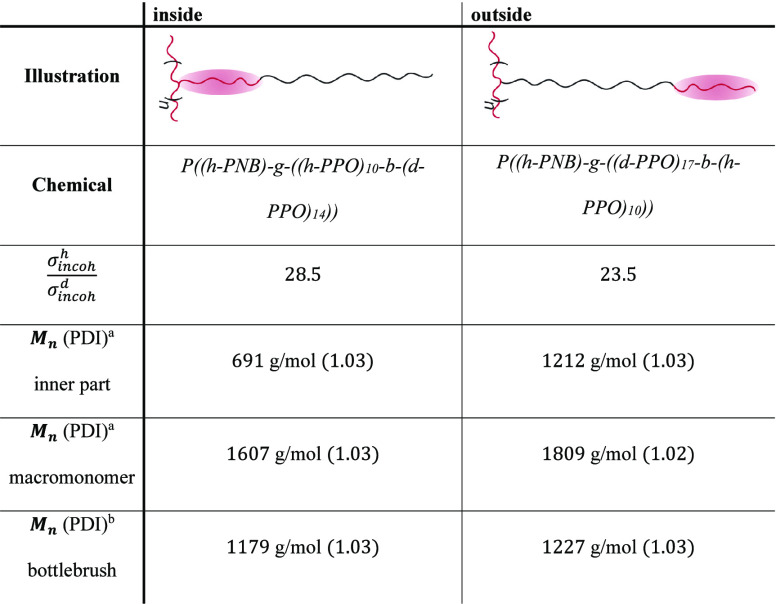
For this purpose, partially deuterated bottlebrush polymers were synthesized to highlight specific parts of the side chains, using the difference in the incoherent scattering cross sections of deuterium and hydrogen for labeling in quasi-elastic neutron scattering (QENS). Having labeled parts in the inner or outer sections of the side chains allows to draw conclusions about the dynamical behavior along the side chains and finally about the hypothesis of the gradual relaxation behavior. More specifically, we have used bottlebrush polymers with 10 protonated units in the side chains located either at the grafting point or at the dangling end, while the remaining 14 or 17 units are deuterated to minimize their scattering contribution for QENS (Table 1).
Table 1. Schematic Illustration of the Two Different Samples Together with the Respective Sample Names, the Ratio of σhincoh/σdincoh, Their Number Averaged Molecular Weight, and Dispersity.
Determined by MALDI-TOF.
Determined by GPC. Red color indicates protonated parts, whereas black color indicates deuterated parts.
Theory and Analysis
Quasi-elastic neutron scattering measures the dynamic structure
factor, S(Q,ω), depending
on the time and length scale, Q, whereby the former
part is encoded in the energy transfer, ω. In total, S(Q,ω) is a composition of coherent
and incoherent parts,  .4,13−15 Despite the contrast between the protonated and deuterated
parts
of our samples, the incoherent cross section of the protonated parts
still dominates within the available Q range. This
is particularly evident by comparing the incoherent scattering cross
sections of the different parts of the side chains. Taking 10 protonated
units (
 cm–1) in relation to
14 or 17 deuterated units (
 cm–1) results in the
ratio
  = 28.5 (Table 1).
Therefore, the measured dynamic structure
factor is
  , also known as the self-correlation
function,
giving information about the segmental dynamics and faster processes
like methyl group dynamics, in the case of polymers.
The experiment
provides  , which is a
convolution of
  with the instrumental resolution,
  . This turns into multiplication if Fourier
transformed into the time domain leading to the intermediate scattering
function,
  . However, only
  or
or  contains dynamical information on the sample.
| 1 |
For
analysis in the time domain,  can be simply extracted by a division with
the resolution function, R(Q,t)
| 2 |
whereas analysis in the frequency domain requires
a numerical convolution of the model function with the instrumental
resolution. For convenience,  .
.
In this work, we focus on the analysis of the intermediate scattering function in the time domain, which allows the combination of different spectrometers to enlarge the available time range more easily. This has the advantage of covering dynamic processes over an extended time range, which is essential for polymers. As shown in the Analysis section, in the available time range, t ∼ 1 ps to t ∼ 1.5 ns, together with the selected temperatures, we cover segmental dynamics, similar as reported previously.16
The studies
of partially deuterated side chains continue the previous
QENS studies of fully protonated side chains. Therefore, a similar
approach was used to analyze the experimental data. This includes
a stretched exponential function for the segmental relaxation with
relaxation time,  , and stretching parameter,
  .
.
However, due to the partial deuteration, the ratio of protons in the side chains vs backbone is reduced compared to a previous study16 with 17% of total protons situated in the backbone. Their slower motions are outside the available time range and therefore can be treated as an elastic contribution. Accounting for that, we introduce the elastic contribution (EC), which is not participating in the dynamics.
| 3 |
As seen in eq 3, the relaxation time,  , is associated with the stretching parameter,
  . For a better comparison across the two
samples, we will use the average relaxation time,
  , calculated as
| 4 |
which takes the contributions of  into account.17
Furthermore, the
mean-square displacement will be evaluated by
applying eq 5 to the
intermediate scatting function in a  vs Q2 representation,
leading to the mean-square displacement,
  , and the non-Gaussian parameter,
  , as fit parameters.
| 5 |
Experimental Section
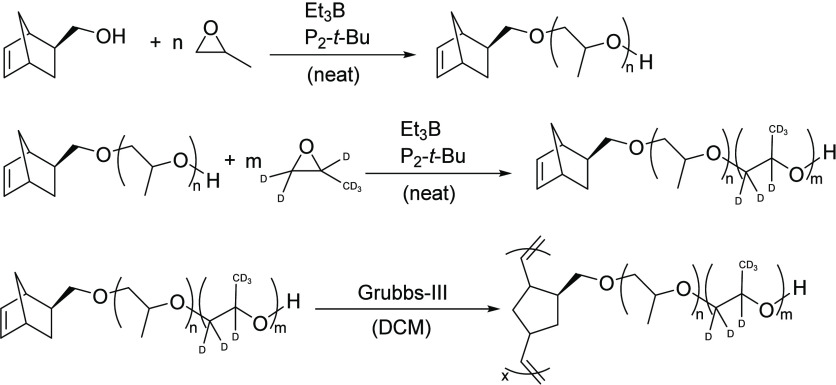
The macromonomers were synthesized following Jakobi et al.18 in two separate polymerization steps—first for the inner part initiated by exo-5-norbornene- 2-methanol and after purification and drying initiated by the hydroxy chain end (see Scheme 1).18 A direct block copolymerization was not possible due to precipitation of the catalyst/base after completion of the reaction due to the absence of solvent.
Scheme 1. Synthetic Route toward Labeled PNB-g-PPO Macromonomers and Bottlebrushes on the Example of the Inside Labeled Bottlebrush.
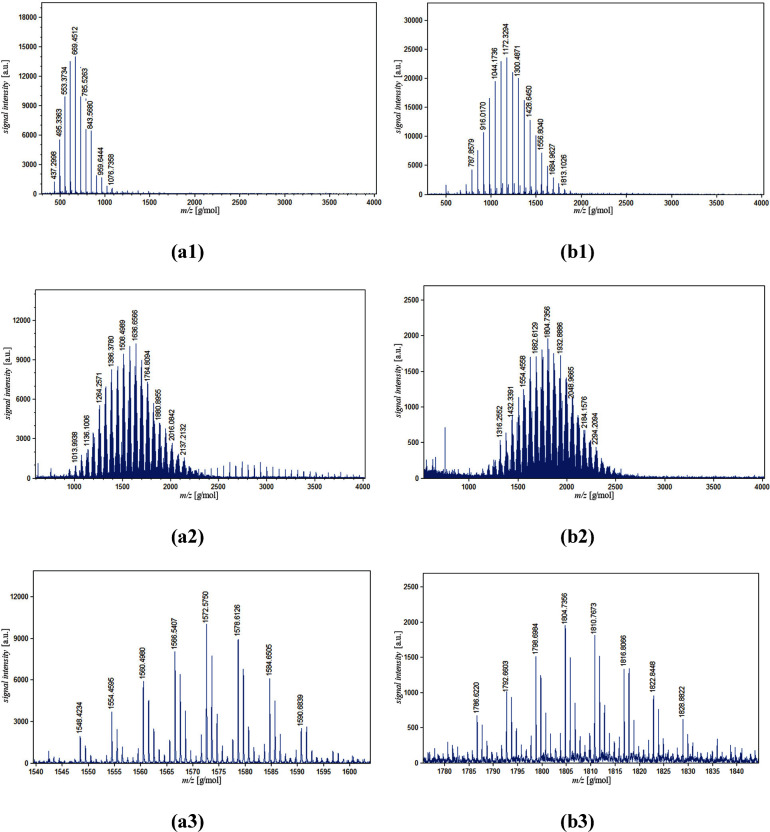
The blue traces in Figure 1 show the matrix-assisted laser desorption/ionization (MALDI) mass spectrometry of the inner part and the complete macromonomer of the samples with the protonated part of the side chains inside and outside. For the first step of the block copolymers, only one series of peaks can be identified, spaced either 58 g/mol, in the case of the inside label (a1), or 64 g/mol, outside label (a2), apart. In both cases the mass values correspond to an initiation with exo-5-norbornene- 2-methanol in combination with a sodium ion. After the second polymerization a more complex pattern is shown for both macromonomers.
Figure 1.
MALDI spectra of the inner part (top) of the labeled macromonomers, the complete macromonomers (middle), and zoom in (bottom) for the samples inside (a1, a2, a3) and outside (b1, b2, b3).
The trace shows groupings of peaks spaced apart between 58 and 64 g/mol. Focusing only on one grouping of peaks (c1 and c2) shows a spacing of 6 g/mol, equivalent to the difference between the deuterated and protonated monomers. The spacing between groupings can be attributed to the difference between the combined number of repeating units in the macromonomers. The spacing inside a grouping resembles a constant combined number of repeating units with a different ratio of deuterated and protonated units. This assessment is confirmed by 1H NMR and the shifting singular peaks of the gel permeation chromatography (GPC) chromatogram (see the Supporting Information). The molecular weight characteristics as well as an illustration of the different parts highlighted for neutron scattering are listed in Table 1.
The glass transition temperature of protonated PNB is around Tg∼ 310–320 K, which indicates that the dynamics of the PNB backbone is outside the frequency/time window of our QENS experiment.19 The relaxation time at Tg is roughly τ ∼100 s, whereas backscattering measures up to 3.8 ns, resulting in a relaxation time of PNB that is a factor of 100–10000 slower than the dynamics that can be measured with the instrument.20,21 Therefore, any relaxation contribution arising from the protonated PNB backbone itself is far outside the experimental time/frequency window, and thus, the relaxation signal is dominated by the side chains only. However, the protons located in the backbone lead to an elastic contribution, which was taken into account.
Neutron Backscattering Instrument—Emu
Quasi-elastic
neutron scattering experiments have been done at the neutron backscattering
instrument Emu located at ANSTO, Lucas Heights, Australia.22 A wavelength of λ = 6.28 Å selected
by a pyrolytic graphite crystal premonochromator via its (002) Bragg
reflection was used. The instrument has a resolution of  μeV with a maximum
energy range of E = −28 to 28 μeV or
a corresponding Fourier
time range of
  ns. The Q range
used was
  Å–1 binned
in increments
of
  Å–1. For shifting
the segmental dynamics within the time window of QENS, temperatures
of T = 325 K and T = 350 K were
measured. The samples measured at T < 30 K were
used as instrument resolution for data reduction. Additionally, measurements
of the empty can as well as of the empty cryostat and vanadium for
detector efficiency were also included in the data reduction. Therefore,
no additional background was assumed during data analysis. The temperature
was adjusted by a closed-cycle cryostat with a secondary helium circulation
loop controlled by a needle valve. The samples were loaded in cylindrical
annular aluminum cans with gap size of 0.2 mm, ensuring 90% transmission.
Additionally, an aluminum heat shield was used to minimize the temperature
gradient across the sample. For data reduction and analysis, the program
MANTID was used.23,24
Neutron Time-of-Flight Instrument—Pelican
Time-of-flight
experiments were performed at the instrument Pelican, located at ANSTO,
Lucas Heights, Australia.25 The setup using
a wavelength of λ = 6 Å with an instrument resolution of  μeV was used,
giving the theoretically
accessible time range of 1–63 ps. The used Q range of Q = 0.2–1.8 Å–1 was binned in increments of
  Å–1 to combine it
with the backscattering experiment. The instrument resolution was
measured at T < 30 K using the respective samples.
To reach the measurement temperatures of T = 325
K and T = 350 K a closed-cycle cryostat with a secondary
helium circulation loop controlled by a needle valve was used. The
samples were loaded in cylindrical annular aluminum cans with gap
size of 0.2 mm, ensuring 90% transmission. Additionally, an aluminum
heat shield was used to minimize the temperature gradient across the
sample. All the data reduction was done similar to Emu using MANTID.23,24
In order to combine the two different instruments, all data were Fourier transformed to the time domain by using MANTID.23,24 Subsequentially, the backscattering data are renormalized according to the time-of-flight data.
Gel-Permeation Chromatography (GPC)
For all chromatography, an Agilent 1260 Infinity II GPC with a dRI detector, an isocratic pump, and an autosampler in combination with three MZ Analysentechnik columns, and a Wyatt Dawn Helios II detector, running with THF at 1 mL/min as the eluent, was used. The data were collected and analyzed with the Astra software package.
Matrix-Assisted Laser Desorption/Ionization Mass Spectrometry (MALDI)
For all mass spectrometry measurements, a Bruker UltrafleXtrme MALDI TOF/TOF spectrometer was used. The samples were suspended in DCM at a concentration of 1 mg/mL and mixed with a DCTB solution (20 mg/mL in DCM) at a matrix:analyte ratio of 20:1. One microliter of the suspension was used for deposition on the target, together with 20% attenuation and 20% laser energy. Each spot was irradiated at 40 random locations for a total of 1000. The measurement was accumulated over all shots to be representative of the complete sample.
1H Nuclear Magnetic Resonance (NMR)
All samples were measured by a Bruker AVIII-500 instrument with a 5 mm Prodigy TCI probe with deuterated chloroform as the solvent. The spectra were referenced to the residual signal of the solvent chloroform, and chemical shifts are reported in parts per million.
Experimental Procedures
All reactions and manipulations were performed in a glovebox filled with argon at an oxygen and moisture content below 0.5 ppm or using standard Schlenk and high-vacuum techniques. THF was dried over the Na/K alloy and benzophenone, degassed, and distilled under high vacuum prior to use. Toluene was dried over a sodium–potassium alloy, degassed, and distilled under high vacuum prior to use. Anhydrous DCM (Sigma-Aldrich) was used as received. Pentane was used as received. Propylene oxide (Sigma-Aldrich) and deuterated propylene oxide (Cambridge Isotope) were degassed, stirred over calcium hydride, distilled, and degassed prior to use. 1-tert-Butyl-2,2,4,4,4-pentakis(dimethylamino)-2λ5,4λ5-catenadi(phosphazene) (P2-t-Bu solution in THF 1.9M) and triethylborane (Et3B in THF 1.0 M) were diluted with propylene oxide prior to use. Exo-5-norbornene-2-methanol was synthesized from exo-5-norbornene-2-carboxylic acid (Sigma-Aldrich) using an established procedure and dried via evaporation of toluene at 40 °C.26 Grubbs third-generation catalyst (Grubbs-III) was synthesized from the second-generation catalyst (Sigma-Aldrich) using an established procedure.27
Macromonomer Synthesis
Inner Part
In a 50 mL vial with screw cap and stir bar, exo-5-norbornene-2-methanol and triethylborane were dissolved in propylene oxide, and the polymerization is started via addition of P2-t-Bu. The reaction was stirred for 20 h. After completion the catalyst precipitates as colorless flakes. The suspension was diluted with pentane, filtered through basic alumina and a 0.22 μm PTFE syringe filter, and dried under a N2 stream. The resulting polymer was twice dried via evaporation of toluene at 40 °C under high vacuum and directly used for the second step.
Outer Part
In a 50 mL vial with screw cap and stir bar the already placed inner part of the macromonomer and triethylborane were dissolved in propylene oxide, and the polymerization is started via addition of P2-t-Bu. The reaction mixture was stirred for 20 h. After completion, the catalyst precipitates as colorless flakes. The suspension was diluted with pentane, filtered through basic alumina and a 0.22 μm PTFE syringe filter, and dried under a N2 stream.
Bottlebrush Synthesis
In a 100 mL flask, the macromonomer was dissolved in DMC as a 0.1 g/mL solution, and Grubbs-III catalyst was added as a 2 mg/mL solution. The reaction is stirred for 15 min, terminated via addition of 1 mL ethyl vinyl ether, diluted with acetone, filtered through basic alumina and a 0.22 μm PTFE syringe filter, and dried under a N2 stream. Traces of residual free PPO are removed via three consecutive fractional precipitations by dissolving the polymer in a pentane, with minimal amounts of acetone added to enable solubility at RT, and cooled to −20 °C. The supernatant was discarded, and the precipitated polymer was dried under vacuum at 50 °C for 3 days and prepared for measurement in a glovebox.
Results and Discussion
Quasi-elastic neutron scattering data are combined among two different instruments and measured for two different temperatures, T = 325 K and T = 350 K. This combination allows one to capture the segmental dynamics of the side chains in the available time window.
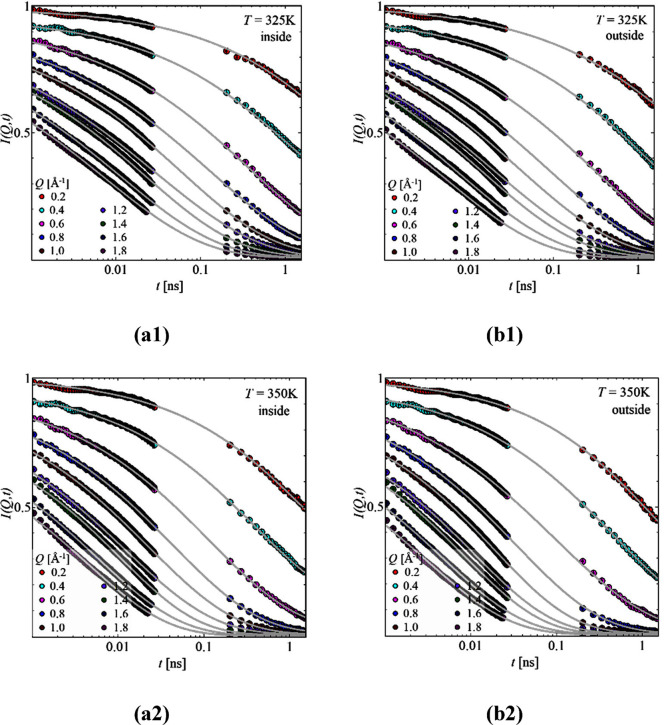
Figure 2 shows the time-dependent intermediate scattering function, I(Q,t), for our two samples with labeled parts at (a) inside and (b) outside. Both temperatures have a well pronounced decay, which intensifies for the higher temperature, T = 350 K. This indicates that the dynamics progresses through the available time window.
Figure 2.
Intermediate scattering function, I(Q,t), as a function of time, t, for T = 325 K (top) and T = 350 K (bottom) for the samples inside (a1, a2) and outside (b1, b2) for the different Q values as indicated. Solid lines are the best description with eq 3.
The scattering data (Figure 2) contain information regarding the segmental relaxation of
the highlighted parts within the side chains. This can be well described
by eq 3. It leads to
the Q-dependent relaxation time, τ(Q), associated with the Q-dependent stretching
parameter, β(Q). For having a better comparison
across the different samples and temperatures, eq 4 was employed giving the average relaxation
time,  .
.
As seen in Figure 3, the stretching parameters for the different
samples are on average
constant for one temperature across all the Q values,
but different with respect to T. While at T = 325 K,  , the stretching parameter increases
to
  at the higher temperature, T = 350 K.
Figure 3.
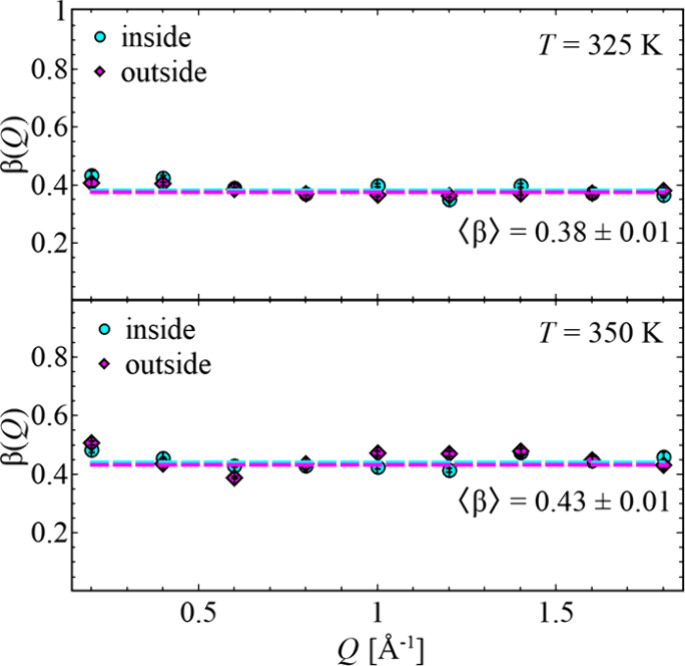
Stretching parameter,  , as a function of momentum transfer, Q, for T = 325 K (top) and T = 350 K (bottom)
for both samples. Dashed lines are the average
values for each sample.
In general,  indicates a single-exponential
decay, transferring
to a Debye-like relaxation behavior with one uniform relaxation time.
In polymers, the segmental relaxation itself is of non-Debye nature,
which is indicated by
  .28
.28
Setting the obtained values of  in context to a distribution of relaxation
times and comparing it with the ideal relaxation process, it is obvious
that larger
  values, as seen for the higher temperature,
indicate a more uniform relaxation.16 However,
contrary to an assumption of gradual relaxation, for the different
locations within the side chains, there is no difference in the distribution
of relaxation time, as seen at the on average constant
  value.
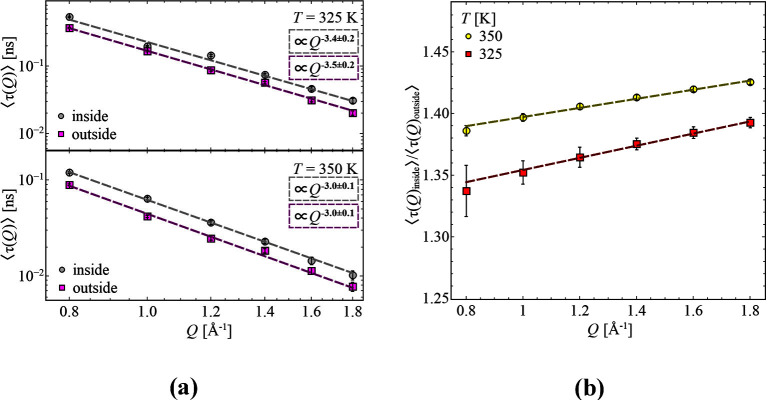
Continuing with the average relaxation times,  , of the samples inside and outside, a pronounced Q dependence with a power law behavior is seen (Figure 4a). Across both samples,
the exponent stays constant within one temperature and slightly increases
with increasing temperature. Overall, a reduction in relaxation time
is seen while comparing the outside to the inside of the attached
side chains. This effect was hypothesized as the grafting process
mostly affects segments close to the backbone and is assumed to restrict
their relaxation ability. For a better judgment regarding the actual
effect, the ratio of
  for both temperatures is considered
(Figure 4b).
Figure 4.
(a) Average
relaxation time,  , as a function of momentum transfer, Q, for the sample inside and outside at temperatures T = 325 K (top) and T = 350 K (bottom).
Dashed lines are the best description with a power law. (b) Ratio
of average relaxation times,
  , as a function of momentum transfer, Q, for T = 325 K and T = 350 K. Dashed lines are the best description with a linear function.
Here it is obvious that at higher temperature the slowdown of the process is more pronounced, resulting in a position-dependent temperature dependence. Also, an increase is visible while increasing the momentum transfer, which indicates a stronger reduction on a local length scale.
As stated earlier, the samples have 10 protonated monomeric
units
within the side chains, while the remaining 14 or 17 units are deuterated
and do not significantly contribute to the scattering signal. Therefore,
it is reasonable that the segmental relaxation, based on the power
law dependence as illustrated in Figure 3a, can be classified as heterogeneous. This
might have the origin in the combination of the very short, protonated
part of the side chain giving the scattering signal together with
the bottlebrush nature itself. Previous studies on bottlebrush polymers
also report heterogeneous dynamics for the segmental relaxation.4,16,18 In the case of homogeneous dynamics,
the power law for  vs Q needs to be −4.6
for T = 325 K and −5.3 for T = 350 K, based on the relationship of
  .29−31
Taking
the heterogeneous nature of the segmental relaxation into
account, the mean-square displacement is extracted considering the
non-Gaussian nature, similar to previous work.4,16 As
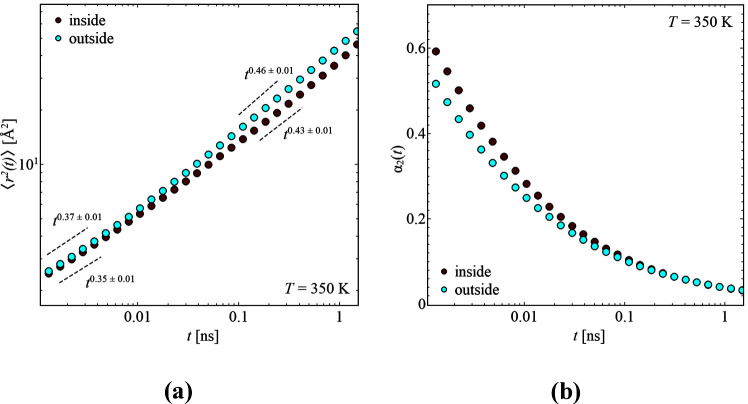
seen in Figure 5a,
the mean-square displacement increases with time, together with a
slight slope change at t ∼ 0.01 ns. Comparing
both samples shows that the segments close to the backbone are more
restricted in their movement, and thus the  is smaller compared to those for the sample
having the label on the outside. This is also reflected in the power
laws. While at long times the mean-square displacement of the inner
segments is proportional to
  , the segments at the
outside propagate
with
  . Especially the power
law dependence of
the outer segments is very similar to that known for Rouse dynamics
of linear polymer, t0.5, which would indicate
a dynamics similar to a free chain.32 However,
the size of the contributing part of the side chain is very small,
for which the Rouse model can usually not be applied, but it can be
seen as a rough comparison in regard to the dynamical behavior.
Figure 5.
(a) Mean-square
displacement,  , as a function of time, t, and (b) non-Gaussian
parameter,
  , as a function of time, t, for the samples labeled
on the inside and outside at T = 350 K. Dashed lines
illustrate the power law proportionality.
As already noted, the dynamics are of a heterogeneous nature, which
is also seen in the non-Gaussian parameter, illustrated in Figure 5b. Here, values of  would indicate Gaussian behavior with homogeneous
dynamics. This might be reached at even lower Q values,
independent of the labeling. For now, the
  values are higher for the inner segments,
indicating more heterogeneity due to the grafting to the backbone,
whereas at longer times the inside and the outside equalize.
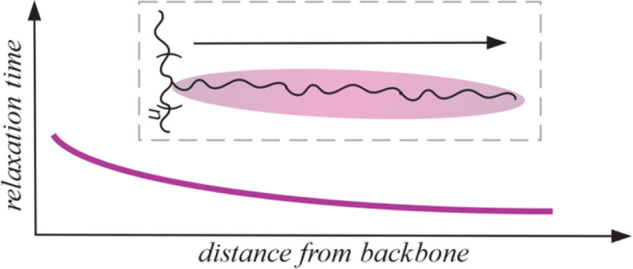
All results together support our hypothesis that the inner segments are slower and more restricted in their movement compared to the outer segments within the side chain. A simplified illustration of the obtained results regarding the relaxation behavior within the side chain is shown in Figure 6, including the slight gradual relaxation behavior across the entire side chain.
Figure 6.
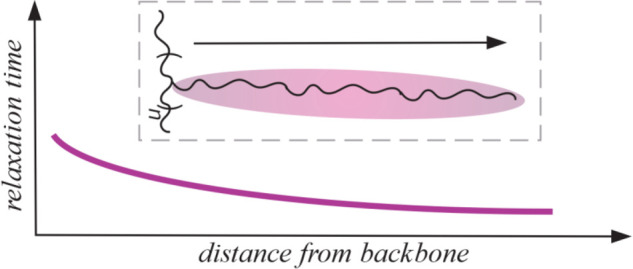
Schematic illustration of relaxation behavior within the side chain. Red parts indicate the inner segments, and black parts indicate the outer part of the side chain.
Summary and Conclusion
We used quasi-elastic neutron scattering and partial deuteration to further follow the segmental dynamics of the side chains from bottlebrush polymers. Previous studies pointed to a gradual relaxation behavior along the segments from the grafting point toward the dangling ends.4,16 To elaborate this in more detail, partially protonated samples were used. This means specific parts of the samples were highlighted for quasi-elastic neutron scattering, whereas the contributions from the other parts were minimized. Specifically, each sample has 10 monomeric units protonated, while the remaining 14 or 17 segments are deuterated. The difference across the samples is the location of the protonated parts. It is on either the inside or the outside of the side chain. This allows one to get information about the relaxation behavior from the different parts of the side chain.
Combining all results gives faster dynamics, associated with larger mean-square displacement and less heterogeneity for the outermost segments. Going inward along the side chains toward the backbone, the relaxation slows down and is more restricted due to the tethering to the backbone. This is reflected in the relaxation times as well as in the mean-square displacement by showing lower values. Across both measurement temperatures, this effect is similar to a slight intensifying at the higher temperature, T = 350 K.
Acknowledgments
We acknowledge funding by the U.S. Department of Energy (DoE) under Grant DE-SC0019050. We are also grateful for the access to the neutron scattering instruments, provided by ACNS, Sydney, Australia (Pelican: P15734 and Emu: P15710). Mass spectrometry experiments were performed at the LSU Mass Spectrometry Facility (MSF). The Bruker UltrafleXtreme MALDI instrument was supported by NIH (Grant 1S10RR024520-01A1).
Supporting Information Available
The Supporting Information is available free of charge at https://pubs.acs.org/doi/10.1021/acs.macromol.4c00243.
GPC and 1H results of the precursor and samples (PDF)
The authors declare no competing financial interest.
Supplementary Material
References
- Pesek S. L.; Xiang Q.; Hammouda B.; Verduzco R. Small-Angle Neutron Scattering Analysis of Bottlebrush Backbone and Side Chain Flexibility. J. Polym. Sci., Part B: Polym. Phys. 2017, 55 (1), 104–111. 10.1002/polb.24251. [DOI] [Google Scholar]
- Daniel W. F.; Burdynska J.; Vatankhah-Varnoosfaderani M.; Matyjaszewski K.; Paturej J.; Rubinstein M.; Dobrynin A. V.; Sheiko S. S. Solvent-Free, Supersoft and Superelastic Bottlebrush Melts and Networks. Nat. Mater. 2016, 15 (2), 183–9. 10.1038/nmat4508. [DOI] [PubMed] [Google Scholar]
- Cai L.-H.; Kodger T. E.; Guerra R. E.; Pegoraro A. F.; Rubinstein M.; Weitz D. A. Soft Poly(dimethylsiloxane) Elastomers from Architecture-Driven Entanglement Free Design. Adv. Mater. 2015, 27 (35), 5132–5140. 10.1002/adma.201502771. [DOI] [PMC free article] [PubMed] [Google Scholar]
- Bichler K. J.; Jakobi B.; Sakai V. G.; Klapproth A.; Mole R. A.; Schneider G. J. Short-Time Dynamics of PDMS-g-PDMS Bottlebrush Polymer Melts Investigated by Quasi-Elastic Neutron Scattering. Macromolecules 2020, 53 (21), 9553–9562. 10.1021/acs.macromol.0c01846. [DOI] [PMC free article] [PubMed] [Google Scholar]
- Jakobi B.; Bichler K. J.; Sokolova A.; Schneider G. J. Dynamics of PDMS-g-PDMS Bottlebrush Polymers by Broadband Dielectric Spectroscopy. Macromolecules 2020, 53 (19), 8450–8458. 10.1021/acs.macromol.0c01277. [DOI] [PMC free article] [PubMed] [Google Scholar]
- Haugan I. N.; Maher M. J.; Chang A. B.; Lin T.-P.; Grubbs R. H.; Hillmyer M. A.; Bates F. S. Consequences of Grafting Density on the Linear Viscoelastic Behavior of Graft Polymers. ACS Macro Lett. 2018, 7 (5), 525–530. 10.1021/acsmacrolett.8b00116. [DOI] [PubMed] [Google Scholar]
- López-Barrón C. R.; Tsou A. H.; Hagadorn J. R.; Throckmorton J. A. Highly Entangled α-Olefin Molecular Bottlebrushes: Melt Structure, Linear Rheology, and Interchain Friction Mechanism. Macromolecules 2018, 51 (17), 6958–6966. 10.1021/acs.macromol.8b01431. [DOI] [Google Scholar]
- López-Barrón C. R.; Hagadorn J. R. Dynamic Fragility of α-Olefin Molecular Bottlebrushes. J. Polym. Sci., Part B: Polym. Phys. 2019, 57 (19), 1293–1299. 10.1002/polb.24803. [DOI] [Google Scholar]
- Grigoriadis C.; Nese A.; Matyjaszewski K.; Pakula T.; Butt H.-J.; Floudas G. Dynamic Homogeneity by Architectural Design - Bottlebrush Polymers. Macromol. Chem. Phys. 2012, 213 (13), 1311–1320. 10.1002/macp.201200064. [DOI] [Google Scholar]
- Pesek S. L.; Li X.; Hammouda B.; Hong K.; Verduzco R. Small-Angle Neutron Scattering Analysis of Bottlebrush Polymers Prepared via Grafting-Through Polymerization. Macromolecules 2013, 46 (17), 6998–7005. 10.1021/ma401246b. [DOI] [Google Scholar]
- Bichler K. J.; Jakobi B.; Huber S. O.; Gilbert E. P.; Schneider G. J. Structural Analysis of Ultrasoft PDMS-g-PDMS Shell -Only Particles. Macromolecules 2020, 53 (1), 78–89. 10.1021/acs.macromol.9b01598. [DOI] [Google Scholar]
- Grigoriadis C.; Nese A.; Matyjaszewski K.; Pakula T.; Butt H. J.; Floudas G. Dynamic homogeneity by architectural design-Bottlebrush polymers. Macromol. Chem. Phys. 2012, 213 (13), 1311–1320. 10.1002/macp.201200064. [DOI] [Google Scholar]
- Bée M.Quasielastic Neutron Scattering; Adam Hilger: 1988. [Google Scholar]
- Sakai V. G.; Alba-Simionesco C.; Chen S. H.. Dynamics of Soft Matter: Neutron Applications; Springer: 2011. [Google Scholar]
- Gerstl C.; Schneider G. J.; Fuxman A.; Zamponi M.; Frick B.; Seydel T.; Koza M.; Genix A. C.; Allgaier J.; Richter D.; Colmenero J.; Arbe A. Quasielastic Neutron Scattering Study on the Dynamics of Poly(alkylene oxide)s. Macromolecules 2012, 45 (10), 4394–4405. 10.1021/ma3003399. [DOI] [Google Scholar]
- Bichler K. J.; Jakobi B.; Klapproth A.; Tominaga T.; Mole R. A.; Schneider G. J. Side Chain Dynamics of Poly(norbornene)-g-Poly(propylene oxide) Bottlebrush Polymers. Macromol. Rapid Commun. 2023, 44 (7), 2200902. 10.1002/marc.202200902. [DOI] [PubMed] [Google Scholar]
- Alvarez F.; Alegra A.; Colmenero J. Relationship between the time-domain Kohlrausch-Williams-Watts and frequency-domain Havriliak-Negami relaxation functions. Phys. Rev. B 1991, 44 (14), 7306–7312. 10.1103/PhysRevB.44.7306. [DOI] [PubMed] [Google Scholar]
- Jakobi B.; Bichler K. J.; Juranyi F.; Schneider G. J.. Reversed Dynamics of Bottlebrush Polymers with Stiff Backbone and Flexible Side Chains. J. Chem. Phys. 2024. (accepted). [DOI] [PubMed] [Google Scholar]
- Mark J. E.Polymer Data Handbook; Oxford University Press: 2009. [Google Scholar]
- Lund R.; Alegria A.; Goitandia L.; Colmenero J.; González M. A.; Lindner P. Dynamical and Structural Aspects of the Cold Crystallization of Poly (Dimethylsiloxane)(PDMS). Macromolecules 2008, 41 (4), 1364–1376. 10.1021/ma702055b. [DOI] [Google Scholar]
- Bichler K. J.; Jakobi B.; Schneider G. J. Dynamical Comparison of Different Polymer Architectures-Bottlebrush vs Linear Polymer. Macromolecules 2021, 54 (4), 1829–1837. 10.1021/acs.macromol.0c02104. [DOI] [PMC free article] [PubMed] [Google Scholar]
- de Souza N. R.; Klapproth A.; Iles G. N. EMU: High-Resolution Backscattering Spectrometer at ANSTO. Neutron News 2016, 27 (2), 20–21. 10.1080/10448632.2016.1163985. [DOI] [Google Scholar]
- Taylor J.; Arnold O.; Bilheaux J.; Buts A.; Campbell S.; Doucet M.; Draper N.; Fowler R.; Gigg M.; Lynch V.. Mantid, a high performance framework for reduction and analysis of neutron scattering data. Bull. Am. Phys. Soc. 2012, 57. [Google Scholar]
- Arnold O.; Bilheux J. C.; Borreguero J. M.; Buts A.; Campbell S. I.; Chapon L.; Doucet M.; Draper N.; Ferraz Leal R.; Gigg M. A.; Lynch V. E.; Markvardsen A.; Mikkelson D. J.; Mikkelson R. L.; Miller R.; Palmen K.; Parker P.; Passos G.; Perring T. G.; Peterson P. F.; Ren S.; Reuter M. A.; Savici A. T.; Taylor J. W.; Taylor R. J.; Tolchenov R.; Zhou W.; Zikovsky J. Mantid—Data analysis and visualization package for neutron scattering and μ SR experiments. Nuclear Instruments and Methods in Physics Research Section A: Accelerators, Spectrometers, Detectors and Associated Equipment 2014, 764, 156–166. 10.1016/j.nima.2014.07.029. [DOI] [Google Scholar]
- Yu D.; Mole R.; Noakes T.; Kennedy S.; Robinson R. Pelican — a Time of Flight Cold Neutron Polarization Analysis Spectrometer at OPAL. J. Phys. Soc. Jpn. 2013, 82 (Suppl. A), SA027. 10.7566/JPSJS.82SA.SA027. [DOI] [Google Scholar]
- Radzinski S. C.; Foster J. C.; Matson J. B. Preparation of Bottlebrush Polymers via a One-Pot Ring-Opening Polymerization (ROP) and Ring-Opening Metathesis Polymerization (ROMP) Grafting-Through Strategy. Macromol. Rapid Commun. 2016, 37 (7), 616–621. 10.1002/marc.201500672. [DOI] [PubMed] [Google Scholar]
- Love J. A.; Morgan J. P.; Trnka T. M.; Grubbs R. H. A Practical and Highly Active Ruthenium-Based Catalyst that Effects the Cross Metathesis of Acrylonitrile. Angew. Chem., Int. Ed. 2002, 41 (21), 4035–4037. . [DOI] [PubMed] [Google Scholar]
- Colmenero J.; Arbe A. A.; Alegría A.; Ngai K. L. Q-dependence pf the relaxation times of the α-relaxation as observed by quasielastic neutron scattering. J. Non-Cryst. Solids 1994, 172–174, 229–233. 10.1016/0022-3093(94)90440-5. [DOI] [Google Scholar]
- Arbe A.; Colmenero J.; Monkenbusch M.; Richter D. Dynamics of glass-forming polymers:“Homogeneous” versus “heterogeneous” scenario. Phys. Rev. Lett. 1998, 81 (3), 590. 10.1103/PhysRevLett.81.590. [DOI] [Google Scholar]
- Arbe A.; Colmenero J.; Alvarez F.; Monkenbusch M.; Richter D.; Farago B.; Frick B. Non-Gaussian Nature of the $\ensuremath{\alpha}$ Relaxation of Glass-Forming Polyisoprene. Phys. Rev. Lett. 2002, 89 (24), 245701. 10.1103/PhysRevLett.89.245701. [DOI] [PubMed] [Google Scholar]
- Colmenero J.; Alvarez F.; Arbe A. Self-motion and the α relaxation in a simulated glass-forming polymer: Crossover from Gaussian to non-Gaussian dynamic behavior. Phys. Rev. E 2002, 65 (4), 041804. 10.1103/PhysRevE.65.041804. [DOI] [PubMed] [Google Scholar]
- Richter D.; Monkenbusch M.; Arbe A.; Colmenero J.. Neutron Spin Echo in Polymer Systems; Springer-Verlag: Berlin, 2005; ppIX–246. [Google Scholar]
Associated Data
This section collects any data citations, data availability statements, or supplementary materials included in this article.


