Abstract
Hyperinsulinemia and hyperglycemia in prediabetic and diabetic patients are thought to increase the risk of developing neoplasms because insulin is a growth factor with pre‐eminent metabolic but also mitogenic effects. To determine the effect of hypoinsulinemic diabetic conditions on carcinogenesis, we examined N‐Methyl‐N′‐nitro‐N‐nitrosoguanidine (MNNG)‐induced forestomach carcinogenesis in hypoinsulinemic diabetic WBN/Kob rats aged about 45 weeks (DM) compared with non‐diabetic younger WBN/Kob rats (C1), non‐diabetic Wistar rats age‐matched to DM (C2), and non‐diabetic Wistar rats age‐matched to C1 (C3). All rats were treated with MNNG by gavage and were killed at 40 weeks after dosing. Various‐sized tumors were disseminated throughout the forestomach of all rats, and the ratio of the area of tumors to the whole forestomach area was 23.3% in the DM group and was higher than in the C1–3 (4.2–14.3%) groups. The incidence of carcinoma was much higher in the DM group (36.8%) than in the C1–3 (7.1–16.7%) groups, and the incidence of papilloma was also significantly higher in the DM group (84.2%) than in the C1–3 (28.5–50.0%) groups. The average thickness of the squamous epithelium in the non‐neoplastic mucosa was significantly greater in the DM group (50.8 μm) than in the C1–3 (29.6–37.9 μm) groups. Immunohistochemically, the Ki‐67‐positive index in the non‐tumorous mucosa of the DM group (42.0%) was significantly higher than that of the C1–3 groups (18.8–33.3%). These results suggest that prolonged hyperglycemic conditions without hyperinsulinemia enhance tumorigenesis of MNNG‐induced tumors by enhanced proliferative activity of the squamous epithelium in the rat forestomach. (Cancer Sci 2010)
Current epidemiologic studies have reported that diabetes mellitus may be one of the risk factors for carcinogenesis.( 1 , 2 , 3 , 4 ) Although the underlying carcinogenic mechanism in patients with diabetes mellitus remains unclear, concomitant hyperinsulinemia,( 5 ) hyperglycemia,( 6 , 7 , 8 , 9 , 10 ) and obesity( 11 , 12 ) have been postulated as the factors causing the increased risk for tumor development from some experimental and epidemiologic studies. Hyperinsulinemia most likely favors cancer in diabetic patients, as insulin is not only a growth factor with pre‐eminent metabolic effects but is also mitogenic to many kinds of cells.( 5 ) However, the clinical relevance of the cancer‐promoting effect of insulin in diabetic patients is still unclear.( 13 )
Hypoinsulinemic hyperglycemic conditions had been reported to increase the risk for cancer in streptozotocin‐induced diabetic animals.( 14 , 15 , 16 ) However, streptozotocin is also a mutagen,( 17 ) so it remains unclear if the hyperglycemia‐enhanced carcinogenesis is exclusive in this model. Insulin‐independent promotion of chemically‐induced liver tumor has been recently reported in hypoinsulinemic diabetic Akita mice,( 18 ) and it is suggested that hyperinsulinemia has no relevance to tumorigenesis promotion. However, there are as yet few reports about hypoinsulinemic diabetic conditions related to carcinogenesis.
WBN/Kob rats are an inbred strain of Wistar rats and have been established as one of the diabetic model animals that spontaneously develop long‐lasting diabetic symptoms in aged males.( 19 ) The diabetic conditions are characterized by low‐level serum insulin, hyperglycemia, and glucosuria without obesity with onset at approximately 40 weeks of age.( 20 )
In the present study, to determine the effect of hypoinsulinemic diabetic conditions on the development of neoplastic lesions, we examined chemically induced forestomach tumorigenesis in hypoinsulinemic diabetic old WBN/Kob rats compared with non‐diabetic young WBN/Kob and age‐matched Wistar rats.
Materials and Methods
Animals and diets. Male WBN/Kob rats and Wistar rats were obtained from Japan SLC (Shizuoka, Japan). They were reared in a barrier‐sustained animal room maintained at a temperature of 23 ± 2°C and a relative humidity of 55 ± 10% with 12‐h light/dark cycles, and ventilated at least 10 times/h by high‐efficiency particulate air‐filtered fresh air. All rats were housed and reared in fiber‐reinforced plastic cages with a stainless steel wire‐mesh cage floor. To protect against infection, the cages were changed at least once each week. Rats were given a pellet diet (CRF‐1; Oriental Yeast, Tokyo, Japan) and chlorinated water ad libitum.
All procedures for animal handling and experimental treatment were in accordance with the Guidelines for the Care and Use of Laboratory Animals of the Committee for Animal Experiments of Hiroshima International University and the Japanese Association for Laboratory Animal Science. The level of care provided to the animals met the basic requirements outlined in the National Institutes of Health guidelines (Humane endpoints for animals used in biomedical research and testing, ILAR Journal Vol. 41(2), 2000; National Institute of Health Guide For the Care and Use of Laboratory Animals, NIH Publication, 1996).
Glucosuria and glycemia monitoring. Urinary glucose levels were measured semi‐quantitatively by a urine test paper (Wako Pure Chemical Industries, Osaka, Japan) using fresh urine. Blood glucose levels were also measured semi‐quantitatively by the glucose oxidase method (Glutest Pro R; Sanwakagaku, Aichi, Japan) using blood samples from the tail vein. Urinary glucose levels and blood glucose levels were measured once every month. Samples of fresh urine and blood from the tail vein were collected from 13:00 to 16:00 h.
Experimental design. Experimental design is shown in Figure 1. A total of 34 male WBN/Kob rats and 31 male Wistar rats were divided into the following four groups. The DM group consisted of 19 male, approximately 45‐week‐old diabetic WBN/Kob rats; the C1 group consisted of 15 male 8‐week‐old non‐diabetic WBN/Kob rats; the C2 group consisted of 15 male 45‐week‐old non‐diabetic Wistar rats as an age‐matched control of the DM group; and the C3 group consisted of 16 male 8‐week‐old non‐diabetic Wistar rats as an age‐matched control of the C1 group. All rats were treated once with 100 mg/kg N‐Methyl‐N′‐nitro‐N‐nitrosoguanidine (MNNG) (GL Sciences, Tokyo, Japan) suspended in corn oil (Wako Pure Chemical Industries) by gavages and were killed for pathologic examination at 40 weeks after dosing.
Figure 1.
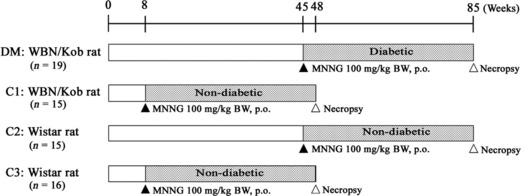
Experimental design. MNNG, N‐Methyl‐N′‐nitro‐N‐nitrosoguanidine.
Macroscopic analysis. Four animals were excluded from this study due to premature death (one rat each in the C1 and C2 groups) or elevated blood‐glucose level (two rats in the C1 group) during the examination period. A moribund animal of the DM group was sacrificed during the examination period, and provided for macroscopic and histopathological analyses. All remaining rats were killed by exsanguination from the abdominal aorta under deep anesthesia at the end of each scheduled period, or when they began to show a moribund condition. The blood samples were collected from the abdominal aorta, and the serum insulin level was measured by ELISA (Ultra Sensitive Rat Insulin kit; Morinaga Institute of Biological Science, Kanagawa, Japan). The entire alimentary tract was immediately removed following autopsy. The representative tissues and organs including the alimentary canals of all rats were fixed by immersion in 10% phosphate‐buffered formalin solution immediately after necropsy. At the time of tissue fixation, the stomach was incised along the greater curvature from the pylorus to the cardia and was pinned out flat on a cork plate. In order to analyze tumor severity of the forestomach mucosa in rats from each group, the ratio of the area of tumors to the whole forestomach area was calculated using Adobe Photoshop’s histogram function as follows:
Scale rate of tumors in forestomach (severity) = total number of pixels in tumor area / number of pixels in whole forestomach area × 100 (%)
Histopathological analysis. After macroscopic examination, the fixed organs were trimmed, dehydrated by an automated processor, and embedded in paraffin. Sections (4‐μm thick) of tissue specimens were stained with hematoxylin–eosin for histopathological examination. Measurement of the thickness of the forestomach mucosa without any macroscopic abnormalities was done using the scale function of a DP controller with an Olympus DP70 digital camera. The average thickness of the forestomach epithelium in each rat was calculated from five randomly selected sites excluding the neoplastic or focal hyperplastic lesions throughout the whole forestomach mucosa.
Immunohistochemical analysis (Ki‐67) for cell proliferation marker. The expression of Ki‐67, a cell proliferation marker, was examined immunohistochemically in the forestomach sections of all rats. Those sections were deparaffinized in xylene, and rehydrated through graded ethanol at room temperature. Rehydrated sections were microwaved in 10 mM citrate buffer (pH 6.0) for 20 min to retrieve the antigen. To prepare solutions and washes between the various steps, 0.05 M Tris‐buffered saline (TBS, pH 7.6) with 0.01% Tween 20 was used. Non‐specific endogenous peroxidase activity was blocked by exposure to 0.03% hydrogen peroxide in 100% methanol for 5 min, and masking was conducted with 1% bovine serum albumin for 5 min at room temperature. Incubation was carried out overnight at 4°C with a primary antibody, Ki‐67 rabbit monoclonal antibody (diluted 1:500, 4203‐1; Epitomics, Burlingame, CA, USA). The slides were subsequently rinsed with TBS plus Tween 20, treated for 30 min at room temperature with Histofine simple stain MAX PO rat (R) (Nichirei, Tokyo, Japan), rinsed with TBS plus Tween 20, incubated in diaminobenzidine solution containing 0.01% hydrogen peroxide for a peroxidase coloring reaction, and counterstained with Mayer’s hematoxylin. The Ki‐67‐positive cell index of each group was estimated as the percentage of Ki‐67‐labeled nuclei/1000 squamous epithelial cells in the forestomach mucosa without neoplastic changes.
Statistical analysis. Student’s t‐test was used for statistical analysis of the macroscopic severity data, histopathologic morphometrical data, and Ki‐67‐positive index data. The χ2‐test was used for statistical analysis of the frequency.
Results
Glycemia, glucosuria monitoring, and body weight. Hyper‐glycemia (>200 mg/dL) and glucosuria (>250 mg/dL) continued for 23.4–49.9 weeks from approximately 50 weeks of age in the DM group. In contrast, the blood glucose levels of the C1, C2, and C3 groups were kept under 200 mg/dL and glucose was negative for all urine samples from all but two rats. During the experimental period, two rats of the C1 group were excluded from this study because of elevated blood‐glucose levels. One rat each in the C1 and C2 groups died from leukemia and emaciation with severe anemia.
The final average body weight of the DM (407 g ± 71.3) group was not significantly different from the C1 (435 g ± 17.1) group. The C2 (574 g ± 61.3) group was comparable to the C3 (562 g ± 40.2) group. The mean serum insulin level was low in the DM group (0.965 ± 0.644 ng/mL) compared to the C1 (1.398 ± 0.446 ng/mL), C2 (1.788 ± 0.764 ng/mL), and C3 (1.030 ± 0.335 ng/mL) groups.
Macroscopic findings. Various‐sized multiple polypoid or cauliflower‐like tumor masses were observed in the forestomach mucosa in all rats of the DM, C1, C2, and C3 groups. The typical forestomach lesions of each group are shown in Figure 2. In the DM group, larger tumor masses were predominant, and the total number of masses was much larger than those in the non‐diabetic C1–C3 groups. The scale ratio of tumors in the forestomach (severity) was 22.3 ± 18.2% in the DM group, and the severity of the DM group was higher than in the non‐diabetic C1 (14.3 ± 13.7%), C2 (4.3 ± 4.3%), and C3 groups (4.2 ± 3.5%) (Fig. 3). The difference between the DM group and the C2 or C3 group was significant (P < 0.001).
Figure 2.
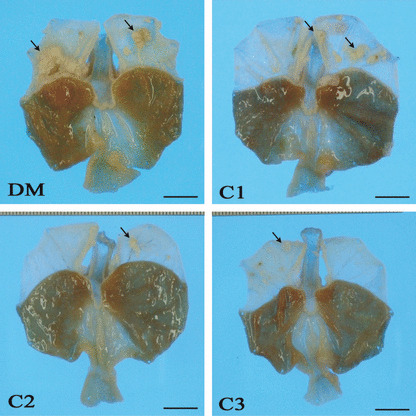
Gross findings of gastric mucosa. Various‐sized multiple neoplastic nodules and masses were observed in the forestomach of all groups (arrows). Nodules and masses in the DM (hypoinsulinemic diabetic WBN/Kob rats) group are larger than those of other groups. Bar: 1 cm.
Figure 3.
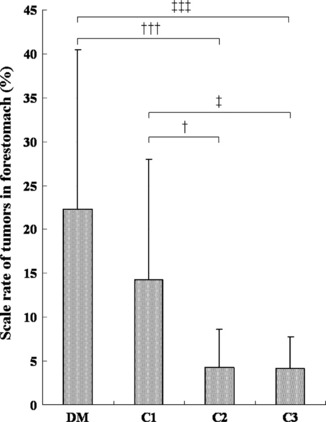
Scale rate of forestomach tumors (severity) in each group. The ratio in the DM (hypoinsulinemic diabetic WBN/Kob rats) group is higher than in the non‐diabetes C1, C2, and C3 groups. Values represent the mean ± SD. †P < 0.05, †††P < 0.001 compared to the C2 group; ‡P < 0.05, ‡‡‡P < 0.001 compared to the C3 group.
Histopathology. Histopathological findings of the forestomach are summarized in Table 1. The incidence of carcinoma was higher in the DM group (36.8%) than in the non‐diabetic C1 (16.7%), C2 (7.1%), and C3 (12.5%) groups. The difference between the DM group and C2 group was statistically significant (Table 1). Almost all carcinomas were diagnosed as well‐differentiated squamous cell carcinoma (SCC) (Fig. 4a), and only a tumor mass originating in the region of the limiting ridge of one case was diagnosed as adenosquamous carcinoma. All SCCs invaded the submucosal layer. In the 28.6% of rats with SCC in the DM group, tumor cells further invaded the muscular and serosal layers. Metastasis to the lymph node or the other organs was not observed. The incidence of squamous cell papilloma was significantly higher in the DM group (84.2%) than in the non‐diabetic C1 (50.0%), C2 (28.6%), and C3 (37.5%) groups (Table 1). Squamous cell papilloma was characterized by exophytic projection of the tumor tissue above the stratified squamous epithelium (Fig. 4c).
Table 1.
Frequency of lesions in forestomach
| Group | No. of rats | Frequency of lesions | |
|---|---|---|---|
| Carcinoma (%) | Papilloma (%) | ||
| DM | 19 | 7 (36.8)† | 16 (84.2)*,‡,§ |
| C1 | 12 | 2 (16.7) | 6 (50.0) |
| C2 | 14 | 1 (7.1) | 4 (28.6) |
| C3 | 16 | 2 (12.5) | 6 (37.5) |
*P < 0.05 compared to the C1 group, †P < 0.05; ‡P < 0.01 compared to the C2 group, §P < 0.01 compared to the C3 group.
Figure 4.
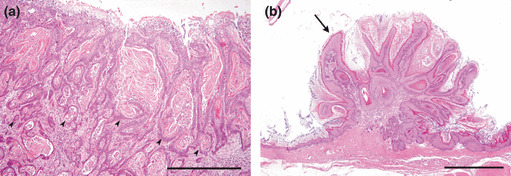
Histopathologic features in forestomach. (a) Squamous cell carcinoma (SCC) in the forestomach in the DM (hypoinsulinemic diabetic WBN/Kob rats) group. Well‐differentiated SCC invaded the submucosal layer (arrowheads). Bar: 500 μm. (b) Squamous cell papilloma of the forestomach in the DM group (arrow). Bar: 1 mm.
The average thickness of the mucosal epithelium in non‐neoplastic areas was significantly greater in the DM group (50.8 μm) than in the C1 (37.9 μm), C2 (29.6 μm), and C3 (31.4 μm) groups (Fig. 5). Ki‐67‐positive cells in the same area were located in the basal cell layer of the squamous epithelium despite the increased cell layers (Fig. 6a,b). The mean Ki‐67‐positive index of the DM group (42.0 ± 3.3%) was significantly higher than that of the non‐diabetic C1 (33.3 ± 2.8%), C2 (20.0 ± 4.8%), and C3 (18.8 ± 3.5%) groups (Fig. 7).
Figure 5.
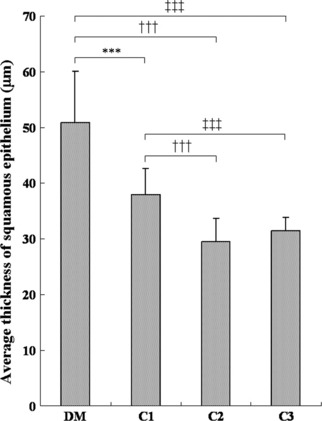
Average thickness of squamous epithelium of non‐tumorous area in each group. DM (hypoinsulinemic diabetic WBN/Kob rats) group thickness is significantly greater than in the C1, C2, and C3 groups. Values represent the mean ± SD. ***P < 0.001 compared to the C1 group; †††P < 0.001 compared to the C2 group; ‡‡‡P < 0.001 compared to C3 group.
Figure 6.

Immunohistochemistry for Ki‐67. Ki‐67‐positive cells are observed in the basal cell layer of squamous epithelium (arrowheads). Bar: 100 μm.
Figure 7.
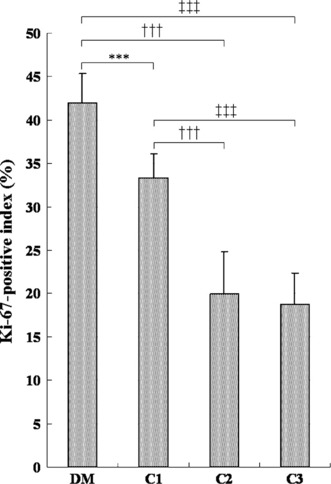
Ki‐67 antigen‐positive cell indices of forestomach squamous cell epithelium of non‐tumorous area. Ki‐67 antigen‐positive index of the DM (hypoinsulinemic diabetic WBN/Kob rats) group is significantly higher than that of the non‐diabetes C1–C3 groups. Values represent mean ± SD. ***P < 0.001 compared to the C1 group; †††P < 0.001 compared to the C2 group; ‡‡‡P < 0.001 compared to the C3 group.
Discussion
The present study demonstrated that hypoinsulinemic diabetic conditions enhanced tumorigenesis of MNNG‐induced tumors in the forestomach, and these tumors increased their malignancy more prominently in diabetic rats compared with non‐diabetic rats. Although MNNG‐induced mucosal tumors in both non‐diabetic and diabetic rats were squamous papillomas and carcinomas, the scale ratio (total number of pixels in the tumor area/number of pixels in the whole forestomach area) in the rats of diabetic group was apparently much larger than that of the non‐diabetic group. Moreover, the mucosal epithelium without neoplastic changes was associated with increased cell layers and higher cell proliferative indices of squamous epithelial cells in the diabetic rats. These facts suggest that hyperglycemia has a direct effect of its own on the proliferation of mucosal epithelial cells and may be a cancer promoter in this model in which there is no relationship between insulin level and tumorigenesis.
Many investigations have reported that the endogenous hyperinsulinemia and exogenous insulin should play a role in promoting cancer development in diabetic patients.( 5 , 13 , 21 , 22 ) One epidemiological report from the USA described the overall cancer risk to be more pronounced in insulin‐resistant, pre‐diabetic humans with hyperinsulinemia than with uncompensated overt type 2 diabetes mellitus.( 23 ) On the other hand, it is also worth paying attention to one recent report of a Korean cohort with diabetes mellitus indicating that cancer risk is simply influenced by fasting blood glucose levels in a dose‐dependent manner and is uncorrelated with the body mass index or insulin resistance.( 2 ) These facts seemed to cast simple doubt on the supposed direct action of insulin on the promotion of cancers.
Recently, we reported that a single dose of alloxan, a non‐genotoxic diabetogenic chemical, frequently induced proliferative lesions of squamous epithelium in the forestomach of diabetic WBN/Kob rats, and about 20% of these lesions progressed to squamous cell carcinoma.( 24 ) Alloxan induces a loss of insulin‐producing islet β‐cells and causes a hypoinsulinemic condition. Thus, hypoinsulinemic hyperglycemic conditions promoted carcinogenesis in alloxan‐induced diabetic WBN/Kob rats. Furthermore, continuous control of the blood glucose level by a subcutaneous insulin implant resulted in a notable suppression of neoplastic changes in alloxan‐induced diabetic rats.( 25 ) In addition, insulin‐deficient conditions possibly increased the risk for oral cancer in streptozotocin‐induced diabetic rats( 16 ) and chemically‐induced hepatocellular tumor in genetically diabetic mice.( 18 ) Results from these experimental studies strongly suggest that tumorigenesis was promoted by a hyperglycemic condition alone in diabetic animals and was independent of the insulin level.
In the present study, since we used animals of different ages and strains, we cannot exclude the possibility that the different incidence of tumors between the DM and C1–3 groups was due to age‐related or strain‐dependent gene expression. No age‐related differences in cell proliferation were observed in the forestomach of male and female rats.( 26 ) The incidence of adenocarcinomas of the glandular stomach induced by MNNG was also significantly decreased with the advance in age.( 27 ) In our study, there was no age difference in tumor incidence and severity between old (C2) and young Wistar rats (C3). Thus, we considered that tumorigenesis induced by MNNG is less affected by aging in this study. The difference between old WBN/Kob rats (DM) and young WBN/Kob rats (C1) may not be affected by aging but rather diabetic conditions. Therefore, we concluded that hyperglycemia itself may have a direct effect on the proliferation of mucosal epithelial cells in this model.
The direct action of hyperglycemia and its related conditions as a carcinogenic factor have also been postulated. Dandona et al. ( 6 ) have demonstrated in a clinical study with diabetic subjects and healthy volunteers that diabetes is associated with increased production of reactive oxygen species and greater oxidative damage to DNA. High glucose itself was shown to induce DNA damage in cultured endothelial cells.( 9 ) Thus, it is possible that increased production of reactive oxygen species or high glucose itself contributes to DNA damage, which may lead to mutational changes in oncogenes and tumor suppressor genes. Given this concept, the enhancement of tumorigenesis, or progression of the forestomach tumors in the present study might have resulted in further mutation of MNNG‐initiated cells by oxidative stress due to the diabetic condition. The chemically induced oral oncogenesis process in diabetic rats was considered to promote the activation of the Ras/Raf/MAPK signal transduction pathway by induction of receptors erbB2 and erbB3, mainly leading to increased cell proliferation.( 16 ) Additionally, the expression of the proliferation marker Ki‐67 was significantly higher in diabetic rats both in previous chemically induced oral oncogenesis( 28 ) and the present study. Judging from the common findings in previous and present studies, it is also evident that diabetic conditions result in increased cell proliferation during tumorigenesis by enhanced proliferative activity of squamous epithelium.
Male WBN/Kob rats spontaneously developed acute pancreatitis from 12 weeks of age, and the acute inflammation is reduced with advancing age and advances to the fibrosis and fatty infiltration as the end‐stage of inflammation.( 19 ) In the present study, the inflammatory changes of the pancreas were observed in all rats of the DM and C1 groups. These changes consisted of fibrosis and fatty infiltration in all but three rats of the C1 group which showed acute inflammation. Inflammation in the pancreas may affect the tumorigenesis in the C1 group rather than the DM group. Thus, we consider that pancreatitis was unlikely to enhance tumorigenesis of the forestomach.
Non‐diabetic WBN/Kob rats (C1) had a greater tendency to tumorigenesis in the forestomach than age‐matched non‐diabetic Wistar rats (C3) in this study. We previously reported that the incidence of alloxan‐induced proliferative lesions was higher in WBN/Kob rats compared with F344 rats.( 24 , 29 ) These results suggest that WBN/Kob rats tend to be more sensitive or predisposed to tumorigenesis in the forestomach and are a suitable animal to investigate carcinogenesis.
In conclusion, our study provides more substantial evidence that hypoinsulinemic and non‐obese diabetic conditions enhance tumorigenesis of MNNG‐induced tumors in the forestomach. It is suggested that prolonged hyperglycemic conditions without hyperinsulinemia enhance tumorigenesis by promoting the proliferative activity of squamous epithelium in the rat forestomach.
References
- 1. Inoue M, Iwasaki M, Otani T, Sasazuki S, Noda M, Tsugane S. Diabetes mellitus and the risk of cancer: results from a large‐scale population‐based cohort study in Japan. Arch Intern Med 2006; 166: 1871–7. [DOI] [PubMed] [Google Scholar]
- 2. Jee SH, Ohrr H, Sull JW, Yun JE, Ji M, Samet JM. Fasting serum glucose level and cancer risk in Korean men and women. JAMA 2005; 293: 194–202. [DOI] [PubMed] [Google Scholar]
- 3. Steenland K, Nowlin S, Palu S. Cancer incidence in the National Health and Nutrition Survey I. Follow‐up data: diabetes, cholesterol, pulse and physical activity. Cancer Epidemiol Biomarkers Prev 1995; 4: 807–11. [PubMed] [Google Scholar]
- 4. Strickler HD, Wylie‐Rosett J, Rohan T et al. The relation of type 2 diabetes and cancer. Diabetes Technol Ther 2001; 3: 263–74. [DOI] [PubMed] [Google Scholar]
- 5. Gupta K, Krishnaswamy G, Karnad A, Peiris AN. Insulin: a novel factor in carcinogenesis. Am J Med Sci 2002; 323: 140–5. [DOI] [PubMed] [Google Scholar]
- 6. Dandona P, Thusu K, Cook S et al. Oxidative damage to DNA in diabetes mellitus. Lancet 1996; 347: 444–5. [DOI] [PubMed] [Google Scholar]
- 7. Dankner R, Chetrit A, Segal P. Glucose tolerance status and 20 year cancer incidence. Isr Med Assoc J 2007; 9: 592–6. [PubMed] [Google Scholar]
- 8. Krone CA, Ely JT. Controlling hyperglycemia as an adjunct to cancer therapy. Integr Cancer Ther 2005; 4: 25–31. [DOI] [PubMed] [Google Scholar]
- 9. Lorenzi M, Montisano DF, Toledo S, Barrieux A. High glucose induces DNA damage in cultured human endothelial cells. J Clin Invest 1986; 77: 322–5. [DOI] [PMC free article] [PubMed] [Google Scholar]
- 10. Yamagata H, Kiyohara Y, Nakamura S et al. Impact of fasting plasma glucose levels on gastric cancer incidence in a general Japanese population: the Hisayama study. Diabetes Care 2005; 28: 789–94. [DOI] [PubMed] [Google Scholar]
- 11. Adami HO, Trichopoulos D. Obesity and mortality from cancer. N Engl J Med 2003; 348: 1623–4. [DOI] [PubMed] [Google Scholar]
- 12. Vigneri P, Frasca F, Sciacca L, Frittitta L, Vigneri R. Obesity and cancer. Nutr Metab Cardiovasc Dis 2006; 16: 1–7. [DOI] [PubMed] [Google Scholar]
- 13. Vigneri P, Frasca F, Sciacca L, Pandini G, Vigneri R. Diabetes and cancer. Endocr Relat Cancer 2009; 16: 1103–23. [DOI] [PubMed] [Google Scholar]
- 14. Bell RH, Brinck‐Johnsen T, Longnecker DS. Inhibitory effect of streptozotocin on tumor development in transgenic mice bearing an elastase I‐SV40 T‐antigen fusion gene. Pancreas 1991; 6: 475–8. [DOI] [PubMed] [Google Scholar]
- 15. Lauder I, Abascal J, Cartwright RA, Farndon JR, Johnston ID. Liver tumours following streptozotocin administration in rats and the effects of pancreatic islet cell transplantation. Carcinogenesis 1981; 2: 799–803. [DOI] [PubMed] [Google Scholar]
- 16. Vairaktaris E, Spyridonidou S, Goutzanis L et al. Diabetes and oral oncogenesis. Anticancer Res 2007; 27: 4185–93. [PubMed] [Google Scholar]
- 17. Gabridge MG, Denunzio A, Legator MS. Microbial mutagenicity of streptozotocin in animal‐mediated assays. Nature 1969; 221: 68–70. [DOI] [PubMed] [Google Scholar]
- 18. Yamasaki K, Hayashi Y, Okamoto S, Osanai M, Lee GH. Insulin‐independent promotion of chemically induced hepatocellular tumor development in genetically diabetic mice. Cancer Sci 2010; 101: 65–72. [DOI] [PMC free article] [PubMed] [Google Scholar]
- 19. Tsuchitani M, Saegusa T, Narama I, Nishikawa T, Gonda T. A new diabetic strain of rat (WBN/Kob). Lab Anim 1985; 19: 200–7. [DOI] [PubMed] [Google Scholar]
- 20. Nakama K, Shichinohe K, Kobayashi K et al. Spontaneous diabetes‐like syndrome in WBN/KOB rats. Acta Diabetol Lat 1985; 22: 335–42. [DOI] [PubMed] [Google Scholar]
- 21. Chang CK, Ulrich CM. Hyperinsulinaemia and hyperglycaemia: possible risk factors of colorectal cancer among diabetic patients. Diabetologia 2003; 46: 595–607. [DOI] [PubMed] [Google Scholar]
- 22. Schiel R, Beltschikow W, Steiner T, Stein G. Diabetes, insulin, and risk of cancer. Methods Find Exp Clin Pharmacol 2006; 28: 169–75. [DOI] [PubMed] [Google Scholar]
- 23. Saydah SH, Loria CM, Eberhardt MS, Brancati FL. Abnormal glucose tolerance and the risk of cancer death in the United States. Am J Epidemiol 2003; 157: 1092–100. [DOI] [PubMed] [Google Scholar]
- 24. Kodama Y, Ozaki K, Sano T, Matsuura T, Akagi H, Narama I. Induction of squamous cell carcinoma of forestomach in diabetic rats by single alloxan treatment. Cancer Sci 2006; 97: 1023–30. [DOI] [PMC free article] [PubMed] [Google Scholar]
- 25. Sano T, Ozaki K, Kodama Y, Matsuura T, Narama I. Prevention of proliferative changes of forestomach mucosa by blood glucose control with insulin in alloxan‐induced diabetic rats. Cancer Sci 2009; 100: 595–600. [DOI] [PMC free article] [PubMed] [Google Scholar]
- 26. Eldridge SR, Goldsworthy SM. Cell proliferation rates in common cancer target tissues of B6C3F1 mice and F344 rats: effects of age, gender, and choice of marker. Fundam Appl Toxicol 1996; 32: 159–67. [DOI] [PubMed] [Google Scholar]
- 27. Kimura M, Fukuda T, Sato K. Effect of aging on the development of gastric cancer in rats induced by N‐methyl‐N′‐nitro‐N‐nitrosoguanidine. Gann 1979; 70: 521–5. [PubMed] [Google Scholar]
- 28. Vairaktaris E, Kalokerinos G, Goutzanis L et al. Diabetes enhances cell proliferation but not Bax/Bcl‐2‐mediated apoptosis during oral oncogenesis. Int J Oral Maxillofac Surg 2008; 37: 60–5. [DOI] [PubMed] [Google Scholar]
- 29. Sano T, Ozaki K, Kodama Y, Matsuura T, Narama I. Paradoxical effects of a selective cyclooxygenase‐2 inhibitor, etodolac, on proliferative changes of forestomach in alloxan‐induced diabetic rats. Exp Toxicol Pathol 2009; 61: 371–80. [DOI] [PubMed] [Google Scholar]


