

Abstract
Colorectal carcinoma (CRC) remains the major cause of cancer death in humans. Although chromosomal structural anomaly is presumed to play an important role in the carcinogenesis of CRC, chromosomal copy number alterations (CNA) and loss of heterozygosity (LOH) have not yet been analyzed extensively at high resolution in CRC. Here we aim to identify recurrent CNA and LOH in human CRC with the use of single nucleotide polymorphism‐typing microarrays, and to reveal their relevance to clinical outcome. Surgically resected CRC specimens and paired normal mucosa were obtained from a consecutive series of 94 patients with CRC, and both of them were subjected to genotyping with Affymetrix Mapping 50K arrays. CNA and LOH were inferred computationally on every single nucleotide polymorphism site by integrating the array data for paired specimens. Our large dataset reveals recurrent CNA in CRC at chromosomes 7, 8, 13, 18, and 20, and recurrent LOH at chromosomes 1p, 4q, 5q, 8p, 11q, 14q, 15q, 17p, 18, and 22. Frequent uniparental disomy was also identified in chromosomes 8p, 17p, and 18q. Very common CNA and LOH were present at narrow loci of <1 Mbp containing only a few genes. In addition, we revealed a number of novel CNA and LOH that were linked statistically to the prognosis of the patients. The precise and large‐scale measurement of CNA and LOH in the CRC genome is efficient for pinpointing prognosis‐related genome regions as well as providing a list of unknown genes that are likely to be involved in CRC development. (Cancer Sci 2008; 99: 1835–1840)
Colorectal carcinoma (CRC) remains the fourth most prevalent cancer and the second highest cause of cancer death in the USA.( 1 ) The life expectancy of individuals with CRC is mainly dependent on the clinical stage when CRC is detected, and the current chemotherapeutic regimens can only marginally improve the prognosis of advanced cases.( 2 ) To achieve better outcomes for such individuals, it would be desirable to identify and target cellular molecules involved in the carcinogenesis of CRC.
A variety of genetic alterations take place, in a defined order, during the development of CRC.( 3 ) In addition to nucleotide sequence mutations and epigenetic abnormalities of genes, structural changes of chromosomes and chromosomal instability (CIN) are known to play a major role in the carcinogenesis of CRC.( 4 ) Gene amplification may induce oncogenic activity in a subset of protooncogenes, such as MYC, MYCN, ERBB2, and CCND1. In contrast, deletion or truncation of tumor‐suppressor genes may confer inactivation of their function. These chromosomal copy number alterations (CNA) can be as large as numerical anomaly of entire chromosomes, or as small as segmental amplification or deletion of <10 kb.
Further, loss of heterozygosity (LOH) of the genome is frequently present in cancer cells, where one allele of a chromosome is deleted (chromosome copy number of one) or the remaining allele is further duplicated (chromosome copy number of two), referred to as uniparental disomy (UPD). It has been hypothesized that such regions likely harbor mutated or epigenetically silenced tumor‐suppressor genes. However, recent evidence indicates that these regions may also carry activated oncogenes, as demonstrated for mutated JAK2 in myeloproliferative disorders.( 5 )
In addition to the conventional array‐based comparative genomic hybridization (CGH) technique,( 6 , 7 ) microarrays developed originally for single nucleotide polymorphism (SNP) typing are now being applied to CIN investigation.( 8 , 9 , 10 ) The main advantage of the latter system over the former is that it readily screens CIN at very high resolution in an allele‐specific manner. The SNP arrays are thus able to screen for both CNA and LOH throughout the genome.
A few studies have been conducted recently for the SNP array‐based CIN analysis of CRC,( 11 , 12 , 13 , 14 ) but the interpretation of such data may be hampered by the small number of clinical specimens and the lack of paired normal samples for the analysis (especially in the cases of LOH examination).
Here we have collected CRC and paired normal specimens from a total of 94 individuals with CRC, and hybridized each DNA to Affymetrix Mapping 50K Xba 240 microarrays (Affymetrix, Santa Clara, CA, USA), which are able to examine CNA and LOH at a mean resolution of 47.2 kb. Application of bioinformatics to these large datasets has identified a number of novel prognosis‐related regions in the CRC genome.
Materials and Methods
Preparation of genomic DNA. Primary tumors and paired colonic mucosal specimens (as normal controls) were surgically resected and frozen from a total of 94 individuals with sporadic CRC (from January 2002 to March 2003 at Jichi Medical University Hospital). The clinical characteristics of these study subjects are summarized in Suppl. Table S1. Informed consent was obtained from each subject according to the protocols approved by the ethics committees of Jichi Medical University. Genomic DNA was extracted from the samples with the use of the QIAamp DNA Mini Kit (Qiagen, Valencia, CA, USA) according to manufacturer's instructions. The microsatellite instability (MSI) status of each tumor was determined on the basis of the analysis of nine microsatellite repeat loci as described previously.( 15 )
Hybridization with SNP‐typing arrays. Each DNA sample (250 ng) was digested with XbaI, ligated to Adaptor‐Xba (Affymetrix), amplified by polymerase chain reaction (PCR), and subjected to hybridization with Mapping 50K Xba 240 arrays (Affymetrix). SNP genotyping calls were generated using GDAS software version 3.0 (Affymetrix) with a confidence score threshold of 0.05. Chromosome copy number and allele‐specific copy number at each SNP site were calculated from the hybridization signal intensity for both CRC and paired normal mucosa specimens with the use of CNAG software (http://www.genome.umin.jp).( 8 ) Only the CNAG data for autosomes were analyzed in the present study. Genotype‐call data and original CEL files are available at the Gene Expression Omnibus website (http://www.ncbi.nlm.nih.gov/geo) under the accession number GSE11417, and CNAG output data are available upon request. We considered chromosome copy number changes or LOH data reliable only when contiguous SNP probes presented the same data.
Quantitative real‐time PCR. RNA was isolated from the samples with the use of an RNeasy Mini column (Qiagen) and was used to synthesize cDNA with PowerScript reverse transcriptase (Clontech, Palo Alto, CA, USA). Portions of genomic DNA or cDNA were subjected to PCR with the QuantiTect SYBR Green PCR Kit (Qiagen). The amplification protocol comprised incubations at 94°C for 15 s, 60°C for 30 s, and 72°C for 60 s. Incorporation of the SYBR Green dye into the PCR products was monitored in real time with the ABI PRISM 7700 sequence detection system (Applied Biosystems, Foster City, CA, USA), thereby allowing determination of the threshold cycle (C T) at which exponential amplification of products begins. To quantitate the genomic DNA, the C T values for genomic DNA corresponding to the glyceraldehyde‐3‐phosphate dehydrogenase (GAPDH) gene and the target regions were used to calculate the abundance of target regions relative to that of GAPDH DNA. The primer sequences used for PCR were: 5′‐AGGACATTTGTAATCAGTATCTGTG‐3′ and 5′‐AGGGCAGTCAATAAGCTAAGGAA‐3′ for period homolog 3 (PER3); 5′‐CTCAACTTCCTTGAGCACC TCCTG‐3′ and 5′‐TACCTTGGACAGCTTGCTCTGTTG‐3′ for invasion inhibitory protein 45 (IIP45); 5′‐ACTGGTGCTCTCACTGTCCAAAAC‐3′ and 5′‐CGCAGAGTAGACATCCTGGG TAAA‐3′ for FAT tumor suppressor homolog (FAT); 5′‐AGCGAA TGGAAGTTAAATTTTGG‐3′ and 5′‐TGCATCTGTCCTAACTC ACTCCT‐3′ for breast cancer cell 2 (BRCC2); 5′‐AGAGACTGT ATTGCAGGGTGAAGA‐3′ and 5′‐CTTTCCATTATATGTCCCG ACTCC‐3′ for v‐maf musculoaponeurotic fibrosarcoma oncogene homolog K (MAFK); 5′‐CTACTCTCTTGCCAGCATTTTCAC‐3′ and 5′‐ACCTAAGCCTTATCCACACCTCAC‐3′ for protein tyrosine phosphatase, non‐receptor type 1 (PTPN1); 5′‐GCTCATAGCCCTGCCTTCCT‐3′ and 5′‐GGTCCCCAAAA CGCACACTC‐3′ for CSMD1; and 5′‐CTGACCTGCCGTCTAG AAAAACCT‐3′ and 5′‐CAGGAAATGAGCTTGACAAAGTGG‐3′ for GAPDH.
Similarly, the relative quantity of cDNA was calculated using the C T value of PCR for each cDNA and that for the GAPDH cDNA. The primer sequences for reverse transcription (RT)‐PCR were: 5′‐CGGTTTTCTCACAACACATTAGCA‐3′ and 5′‐ACTGGAAGGTGGGAAATCAATAGG‐3′ for PER3 cDNA; 5′‐CTGGAACTCAGGCAGCAGACAAG‐3′ and 5′‐GACTCCTGGGGGAGAACAGCATT‐3′ for IIP45 cDNA; 5′‐GTGAGTAATCCGCGCTGTTCTTT‐3′ and 5′‐CAGTAGTTGGGACACTGGAAATGG‐3′ for FAT cDNA; 5′‐GACAGATTTCGCCCATTATTCAGG‐3′ and 5′‐TGTTTCTCTGCACAATTTGAACCA‐3′ for BRCC2 cDNA; 5′‐GCCATATACCACTCTCCCTTCCAC‐3′ and 5′‐TGGAGTGTGCCTTGATTTCATACA‐3′ for CSMD1; and 5′‐GTCAGTGGTGGACCTGACCT‐3′ and 5′‐TGAGCTTGACAAAGTGGTCG‐3′ for GAPDH cDNA. The primer sets for MAFK and PTPN1 cDNA were the same ones used for genomic amplification of the corresponding genes.
Statistical analysis. Hierarchical clustering of the dataset and Student's t‐test were carried out using GeneSpring 7.0 software (Agilent Technologies, Santa Clara, CA, USA), and survival analyses were carried out with SAS software (version 8.0.2: SAS Inc., Cary, NC, US) and the ‘Survival’ package in R version 2.6.0 (http://www.R‐project.org.). The q‐values for the false discovery rate were calculated directly from the ordered P‐values above using the ‘Q‐value’ software (http://genomics.princeton.edu/storeylab/qvalue/) developed by Storey et al.( 16 ) with parameters defined by Jones et al.( 17 )
Results
Frequent CAN. Genomic DNA was extracted from both CRC specimens and normal mucosa obtained from the same study subjects (n = 94). Both data were integrated into the CNAG software to infer chromosome copy number at every SNP site for each CRC sample. Incorporation of the data for paired normal mucosa markedly increased the accuracy of the calculation; the mean probe‐signal intensity at diploid chromosomes in CRC was inferred from the data of control samples (where the majority of the chromosomes were expected to be diploid). Chromosome copy number data at each SNP probe site (n = 57 290 for all autosomal SNP) was thus calculated for all CRC specimens, and a hierarchical clustering analysis for the study subjects was conducted based on the overall CNA profile. As shown in Figure 1a and Suppl. Fig. S1, approximately one‐quarter of the subjects (the right side branch in the figure) had stable chromosomes, but the remaining samples had frequent CNA of various sizes. For instance, gross amplification was found commonly in chromosomes 7, 8q, 13, and 20, whereas large deletions of chromosomes were identified in 8p and 18.
Figure 1.
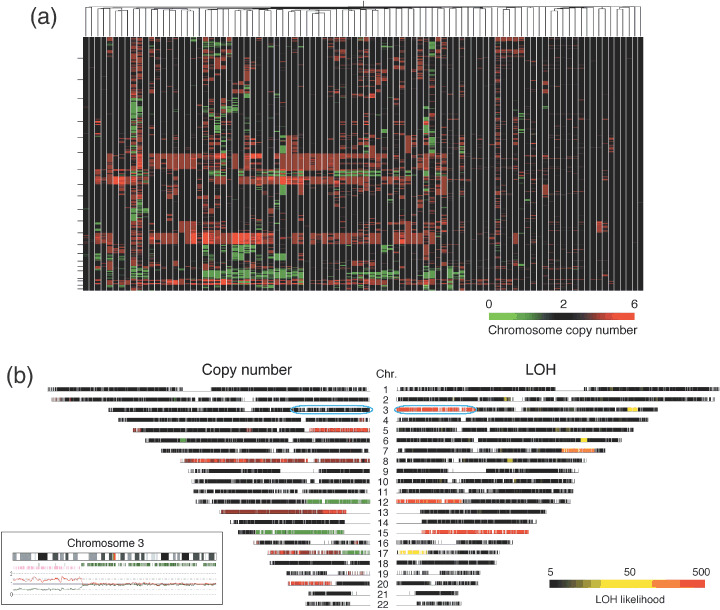
Chromosomal copy number alterations and loss of heterozygosity (LOH) in the colorectal carcinoma genome. (a) The study subjects (n = 94) were subjected to a hierarchical clustering analysis based on the inferred copy number for all autosomal single nucleotide polymorphism (SNP) sites. Copy number is color coded according to the indicated scheme at the bottom. SNP sites are ordered by their physical position from top to bottom, and the borders between chromosomes are indicated by small bars at the left. (b) Chromosome copy number (left panel) and LOH likelihood score (right panel) are demonstrated for patient ID#002 in a chromosome view in a symmetrical manner. Copy number value is color coded as in (a), and LOH likelihood score is colored according to the scheme indicated at the bottom. Chromosome numbers are shown at the center. The allele‐specific copy number data for the 3p region (indicated by a blue circle) is demonstrated in the inset as pink and green lines. Below the cytoband figure, the positions of SNP sites with a hetero‐ or discordant‐call are indicated by green or pink bars, respectively.
Further, in‐depth analysis of the dataset identified amplifications of various magnitudes at various frequencies. For instance, a high‐grade amplification of the genome (copy number of five or greater) was found at three different loci in the genome of ≥15 subjects (Table 1), the size of which ranged from 547 to 201 961 bp. Surprisingly, amplification of one of these loci at chromosome 8q was found among as many as 25 patients (the most common, highly amplified region in our dataset). As expected, low‐grade amplifications of the genome were found more commonly; a region of ~2.7 Mbp at chromosome 20q was, for example, amplified to four or more copies in more than 30 subjects, and this grade of amplification was also identified at many loci throughout the genome. For instance, genome regions with a copy number of four or greater in ≥10% of the patients were mapped to choromosmes 7p, 8q, 13, 20q, and others, comprising a total of 1921 SNP sites (3.4% of all sites).
Table 1.
Frequent regions of chromosomal copy number alterations or loss of heterozygosity (LOH) in colorectal carcinoma patients
| Change | Chromosome | Nucleotide position | Mapped RefSeq gene | GenBank accession no. |
|---|---|---|---|---|
| Gain (chromosome copy no. ≥5 in ≥15 subjects) | ||||
| 6 | 16,176,003–16,176,549 | None | ||
| 8 | 70,887,465–71,089,425 | SLCO5A1 | NM_030958.1 | |
| 20 | 31,768,314–31,919,527 | PXMP4 | NM_007238.4 | |
| ZNF341 | NM_032819.3 | |||
| CHMP4B | NM_176812.3 | |||
| Decrease (chromosome copy no. ≤1 in ≥35 subjects) | ||||
| 18 | 60,114,744–61,522,755 | None | ||
| 18 | 64,600,350–65,380,261 | CCDC102B | NM_024781.1 | |
| DOK6 | NM_152721.2 | |||
| 18 | 67,791,010–68,366,009 | CBLN2 | NM_182511.2 | |
| Homozygous deletion (common in two subjects) | ||||
| 3 | 60,393,402–60,490,818 | FHIT | NM_002012.1 | |
| 20 | 14,796,659–15,040,864 | C20orf133 | NM_080676.5 | |
| LOH (common in ≥55 subjects) | ||||
| 5 | 108,765,615–112,484,272 | APC | NM_000038.3 | |
| 17 | 5,265,130–8,883,455 | TP53 | NM_000546.3 | |
| XAF1 | NM_017523.2 | |||
| DVL2 | NM_004422.2 | |||
| 17 | 11,076,427–12,490,201 | Others | ||
Similarly, a decrease in chromosome copy number (n ≤ 1) was also frequently identified throughout the genome; three distinct loci had such decreases in ≥35 subjects (Table 1). Further, a less‐frequent decrease (found in ≥10% of patients) was mapped to chromosomes 1p, 5q, 8p, 14q, 17p, and others, comprising 3899 SNP sites in total (6.8% of all sites).
In our dataset, common homozygous deletions were unexpectedly rare. Only two loci demonstrated a chromosome copy number of zero in two individuals (Table 1). Interestingly, one such loci on chromosome 3 is known to be a common fragile region containing the fragile histidine triad gene (FHIT, GenBank accession no. NM_002012.1), a putative tumor suppressor.( 18 ) The other homozygous deletion site at chromosome 20 spans 244 206 bp containing only one unknown gene, C20orf133 (GenBank accession no. NM_080676.5).
Frequent LOH. With the SNP‐typing array platform, we can carry out SNP genotyping by comparing the signal intensity between two alleles, which reflects the DNA amount of each allele. In the present study, with a moving window for 21 contiguous SNP, allele‐specific copy number decreases were examined to identify LOH regions. Three most common LOH loci (found in 55 cases) were thus mapped to chromosomes 5 and 17 (Table 1). Other frequent LOH (found in ≥20% of patients) were identified on chromosomes 1p, 4q, 5q, 8p, 11q, 14q, 15q, 17p, 18, and 22. Less‐frequent LOH were seen in two large loci (chromosomes 10 and 16), which contain a tumor necrosis factor receptor superfamily member (FAS, GenBank accession no. NM_000043.3) and ataxin‐2 binding protein 1 (A2BP1, GenBank accession no. NM_018723.2).
Genome regions with UPD may contain tumor‐suppressor genes (where both alleles carry a mutated, inactivated tumor‐suppressor gene) or oncogenes (where cancer cells have two copies of a mutated and activated oncogene). CRC may have UPD at specific loci as demonstrated by Andersen et al.( 19 ) In our dataset, we readily identified UPD regions that were characterized by a chromosome copy number of two and an LOH likelihood score of ≥50 defined by the CNAG software. In the data for patient ID# 002, for instance, a very high LOH likelihood score was inferred on chromosomes 3p and 15q (right panel of Fig. 1b). Although the latter region of the genome had a decreased copy number (left panel), the former was supposed to be diploid, indicating the presence of UPD. SNP array‐based analysis can measure in detail changes in copy number in an allele‐specific manner. With such analysis, as shown in the inset in Figure 1b, one allele at 3p was indeed amplified to a copy number of two (pink line), but the other allele was deleted (green line) in the same region, thus confirming the presence of UPD. Similar UPD was also identified on chromosomes 5q, 8p, 11, 14, 15, 17p, and 18q in our dataset.
Verification of the CNA data. The inferred copy number of chromosomes was then verified by quantitative real‐time PCR. First, four genes (BRCC2, GenBank accession no. NM_001001786.1; FAT, GenBank accession no. NM_005245.3; IIP45, GenBank accession no. NM_021933.2; and PER3, GenBank accession no. NM_016831.1) mapped to independent loci with a frequent copy number loss were chosen to measure DNA quantity. The amount of DNA of each gene relative to that of GAPDH was examined in the patients with an inferred copy number of two and those with a copy number of one. As shown in the left panel of Figure 2a, the relative DNA amount of each gene was decreased to 0.7‐0.5 in the patients with the copy number loss; 0.65 ± 0.52 (mean ± SD), 0.56 ± 0.26, 0.65 ± 0.22, and 0.73 ± 0.33 for BRCC2, FAT, IIP45, and PER3, respectively. The correlation coefficients between inferred copy number by array hybridization and DNA quantification by PCR were 0.219, 0.383, 0.216, and 0.314, respectively.
Figure 2.
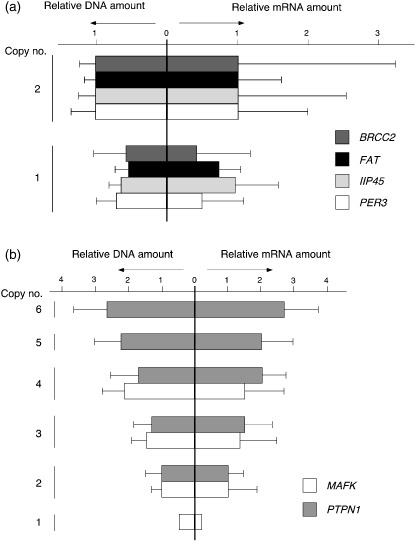
Verification of copy number changes. (a) The DNA quantities of PER3, IIP34, FAT, and BRCC2 (relative to that of GAPDH) were measured by real‐time polymerase chain reaction in the subjects with inferred copy number two (n = 2) or one (n = 1). The mean + SD value for each gene was normalized to the corresponding mean value for the group with diploid chromosomes, and is shown in the left panel. The mRNA amount for each gene (relative to that of GAPDH) was also quantitated by real‐time reverse transcription–polymerase chain reaction and is shown in a similar way. (b) The relative DNA (left panel) or mRNA (right panel) of MAFK and PTPN1 was calculated as in (a).
For the same gene set, we also examined how copy number changes affect mRNA level. Quantitative real‐time reverse transcription‐PCR was used to quantify the relative amount of each mRNA to that of GAPDH (right panel of Fig. 2a). Similar to the chromosome copy number, the mean mRNA level in the samples with copy number loss was decreased compared to the level in those without the loss; 0.47 ± 075, 0.80 ± 0.29, 0.97 ± 0.64, and 0.54 ± 0.69 for BRCC2, FAT, IIP45, and PER3, respectively. However, a relatively large SD in each mRNA amount indicates that transcriptional level was also influenced significantly by other factors such as epigenetic regulation and transcriptional factors.
We also measured the DNA amount of two genes (MAFK, GenBank accession no. NM_002360.3, and PTPN, GenBank accession no. NM_002827.2) that showed various levels of copy number amplification in our dataset. As shown in the left panel of Figure 2b, the calculated DNA amount of MAFK relative to that of GAPDH by quantitative PCR paralleled the copy number inferred from SNP arrays. Similarly, DNA quantity measured by real‐time PCR for PTPN1 generally followed the inferred copy number (n = 2–6). Again, the mRNA from each gene was quantified by real‐time reverse transcription‐PCR, revealing that amount of DNA significantly affects mRNA level (right panel).
Prognosis‐related CNA and LOH. To directly search for CNA and LOH linked to the survival of patients, we utilized Cox's proportional‐hazard regression analysis( 20 ) coupled with the false‐discovery rate correction on the copy number profile of all autosomal SNP sites.
From the CNA dataset, several loci at chromosomes 5, 6, 10, and 18 were proved to be significantly related to prognosis (P < 0.001 and q < 0.1) (Table 2). For all loci except one at chromosome 10, chromosomal loss had a negative impact on the outcome of the patients (Fig. 3a). One locus at chromosome 5 contains the cyclin G1 gene (CCNG1, GenBank accession no. NM_004060), which belongs to the cyclin gene superfamily. In contrast to the other cyclins, expression of CCNG1 is stable throughout the cell cycle, and becomes activated in mouse cells by exposure to ionizing radiation, which also induces cell cycle arrest.( 21 ) Further, disruption of WT1 function is linked to the downregulation of CCNG1 expression.( 22 ) These data together indicate a pro‐apoptotic role for CCNG1, and our discovery of a relationship between loss of CCNG1 and poor prognosis may imply a function of CCNG1 as a tumor suppressor in CRC.
Table 2.
Prognosis‐related regions of copy number alterations (CNA) or loss of heterozygosity (LOH) in colorectal carcinoma patients
| Change | Chromosome | Position | Size (Mbp) | P‐value | q‐value | Mapped RefSeq gene | GenBank accession no. |
|---|---|---|---|---|---|---|---|
| CNA | 5 | 113,733,368–117,078,267 | 3.34 | <0.001 | 0.095 | SEMA6A and others | NM_20796.3 and others |
| 5 | 121,427,436–122,773,632 | 1.35 | <0.001 | 0.095 | LOX and others | NM_002317.3 and others | |
| 5 | 123,233,993–126,057,451 | 2.82 | <0.0005 | 0.095 | Others | ||
| 5 | 142,509,574–142,681,049 | 0.17 | <0.001 | 0.095 | Others | ||
| 5 | 160,137,590–160,786,796 | 0.65 | <0.001 | 0.098 | Others | ||
| 5 | 162,659,919–162,863,325 | 0.20 | <0.0005 | 0.095 | CCNG1 and others | NM_004060.3 and others | |
| 6 | 109,126,299–109,435,125 | 0.31 | <0.0005 | 0.095 | SESN1 and others | NM_014454.1 and others | |
| 10 | 110,674,541–111,338,259 | 0.66 | <0.0005 | 0.095 | None | ||
| 18 | 51,345,876–52,332,836 | 0.99 | <0.0005 | 0.095 | TCF4 and others | NM_003199.2 and others | |
| 18 | 53,401,262–55,536,937 | 2.14 | <0.0005 | 0.095 | RAX and others | NM_013435.2 and others | |
| LOH | 16 | 4,858,366–6,679,934 | 1.82 | <0.0001 | 0.046–0.224 | UBN1 and others | NM_002705.4 and others |
| 16 | 7,010,644–7,608,397 | 0.60 | <0.0005 | 0.181 | A2BP1 | NM_018723.2 |
Figure 3.
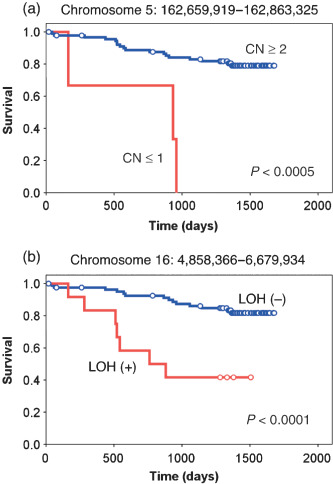
Prognosis‐related copy number (CN) loss and loss of heterozygosity (LOH). The survival of the subjects with or without copy number loss of a locus at (a) chromosome 5 or (b) chromosome 16 was compared using Kaplan–Meier analysis. The P‐value for each comparison was calculated using the log rank test.
In addition to CNA analysis, we further searched for prognosis‐related LOH with the following approach. There were many recurrent LOH regions in our dataset at various frequencies. We thus examined whether some of those recurrent alterations (observed in five or more samples) were preferentially present in the patients who died of CRC compared to those who survived in our observation period. For these potentially outcome‐related genomic regions, prognosis was compared statistically between the two subject groups by the log‐rank test with the false‐discovery rate correction. We finally isolated two loci of LOH where the presence of LOH was related to a short survival time (P < 0.0005) (Table 2; Fig. 3b). One such prognosis‐related LOH locus contains the ubinuclein 1 gene (UBN1, GenBank accession no. NM_016936). Because UBN1 associates physically with AP1 and interferes with its DNA‐binding activity,( 23 ) UBN1 may also function to suppress tumor development.
Discussion
We have here calculated chromosome copy number as well as LOH likelihood throughout the genome of 94 CRC specimens. Together with the clinical information for the study subjects, we identified many loci whose DNA quantity or LOH is associated with the survival and various characteristics of CRC subjects. Some of the RefSeq genes mapped on such loci are well‐known cancer‐related genes. One frequent LOH was mapped to a genomic region of approximately 235 kb only containing the MCC gene, which had already been shown to be prone to somatic mutations and deletions in CRC and other cancers.( 24 , 25 ) Overexpression of MCC suppresses the G1 to S transition of the cell cycle, whereas such activity is lost for an MCC mutant identified in CRC,( 26 ) supporting the tumor‐suppressor activity of MCC.
In addition to the analysis presented in the present manuscript, our large dataset can also be utilized to characterize other aspects of CRC. CRC may be subdivided into microsatellite‐stable cancer and MSI‐high cancer. Comparison of our copy number data between the two subgroups has identified a locus of only 56 kb long, the copy number of which was statistically different between the subgroups (P < 0.001). This region contains only one RefSeq gene, ribosomal protein S6 kinase 90‐kDa 5 (RPS6KA5, GenBank accession no. NM_004755.2), discovering another unexpected linkage between MSI and mitogen‐activated protein kinase (MAPK) functions. A similar comparison of our data between the CRC with or without lymph node metastasis has identified two distinct loci in the genome (Suppl. Table S2). Also, a narrow genomic region was identified, the LOH of which is linked to the presence of liver metastasis (P < 0.001). However, that locus does not contain any RefSeq genes. Given the high resolution of SNP‐typing arrays for CNA and LOH analysis, many genomic regions identified in this manuscript are <100 kb and contain only a few RefSeq genes per locus (1, 2). Thus, our analysis is highly useful in narrowing down the list of genes associated with various characteristics of CRC.
Copy number alterations of CRC specimens have been studied with bacterial artificial chromosome array‐based CGH,( 13 , 27 , 28 ) and large segmental changes of chromosomes in such reports and publicly available databases match well with those identified in our study (see, for example, http://www.cghtmd.jp/CGHDatabase/tumor?lang=en). Although SNP‐typing array‐based CNA and LOH analyses have been reported recently for CRC, information for genes involved directly in such CNA and LOH is scarce.( 11 , 12 , 13 , 14 ) Lips et al. examined the LOH status of paraffin‐embedded CRC specimens (n = 4) and found recurrent LOH at chromosomes 5q, 17p, 18, and 20,( 14 ) the former three of which were indeed identified in our study. However, Gaasenbeek identified LOH at the TP53 locus in MSI‐positive CRC.( 13 ) In our cohort, however, there was only one MSI‐positive case among 55 cases with LOH at TP53, whereas four were positive for MSI among 39 individuals without LOH at the locus, indicating no significant linkage between MSI and LOH at TP53 (Fisher's exact test, P = 0.186).
It should, however, be noted that the RefSeq genes may not be the sole players in carcinogenesis. Long non‐coding RNA is known to be involved in methylation of the genome,( 29 ) and short non‐coding RNA such as microRNA may be involved directly in cell growth and differentiation.( 30 ) These transcripts, despite their inability to synthesize proteins, may thus contribute to the characteristics of CRC. As the discovery and annotation of these non‐coding RNAs is still in its infancy,( 31 , 32 ) many loci identified through our analysis may contain yet‐undiscovered non‐coding RNA, and these transcripts, not protein‐coding mRNA, may play an important role in carcinogenesis as well. Indeed, one of the loci linked to lymph node metastasis has no RefSeq genes but only one non‐coding RNA (Suppl. Table S2).
Our analysis provides a large‐scale, accurate CNA and LOH dataset together with detailed information of clinical characteristics (including survival information in Suppl. Table S1) for the subjects. These data may become a framework for further analysis on structural alterations of the cancer genome in CRC.
Supporting information
Fig. S1. Hierarchical clustering tree in Figure 1a is demonstrated with subject ID indicated at the bottom.
Table S1. Clinical characteristics of the study subjects
Table S2. Chromosomal copy number alterations (CNA) and loss of heterozygosity (LOH) related to clinical characteristics of colorectal carcinoma
Please note: Blackwell Publishing are not responsible for the content or functionality of any supporting materials supplied by the authors. Any queries (other than missing material) should be directed to the corresponding author for the article.
Supporting info item
Supporting info item
Supporting info item
Acknowledgments
The present study was supported in part by a Grant‐in‐Aid for Third‐Term Comprehensive Control Research for Cancer from the Ministry of Health, Labor, and Welfare of Japan, and by a grant for ‘High‐Tech Research Center’ Project for Private Universities: Matching Fund Subsidy, from the Ministry of Education, Culture, Sports, Science, and Technology of Japan (2002‐06) to HM.
References
- 1. Jemal A, Siegel R, Ward E et al . Cancer statistics, 2006. CA Cancer J Clin 2006; 56: 106–30. [DOI] [PubMed] [Google Scholar]
- 2. Portier G, Elias D, Bouche O et al . Multicenter randomized trial of adjuvant fluorouracil and folinic acid compared with surgery alone after resection of colorectal liver metastases: FFCD ACHBTH AURC 9002 trial. J Clin Oncol 2006; 24: 4976–82. [DOI] [PubMed] [Google Scholar]
- 3. Fearon ER, Vogelstein B. A genetic model for colorectal tumorigenesis. Cell 1990; 61: 759–67. [DOI] [PubMed] [Google Scholar]
- 4. Lengauer C, Kinzler KW, Vogelstein B. Genetic instabilities in human cancers. Nature 1998; 396: 643–9. [DOI] [PubMed] [Google Scholar]
- 5. Kralovics R, Passamonti F, Buser AS et al . A gain‐of‐function mutation of JAK2 in myeloproliferative disorders. N Engl J Med 2005; 352: 1779–90. [DOI] [PubMed] [Google Scholar]
- 6. Jiang JK, Chen YJ, Lin CH, Yu IT, Lin JK. Genetic changes and clonality relationship between primary colorectal cancers and their pulmonary metastases – an analysis by comparative genomic hybridization. Genes Chromosomes Cancer 2005; 43: 25–36. [DOI] [PubMed] [Google Scholar]
- 7. Kleivi K, Teixeira MR, Eknaes M et al . Genome signatures of colon carcinoma cell lines. Cancer Genet Cytogenet 2004; 155: 119–31. [DOI] [PubMed] [Google Scholar]
- 8. Nannya Y, Sanada M, Nakazaki K et al . A robust algorithm for copy number detection using high‐density oligonucleotide single nucleotide polymorphism genotyping arrays. Cancer Res 2005; 65: 6071–9. [DOI] [PubMed] [Google Scholar]
- 9. Lin M, Wei LJ, Sellers WR, Lieberfarb M, Wong WH, Li C. dChipSNP: significance curve and clustering of SNP‐array‐based loss‐of‐heterozygosity data. Bioinformatics 2004; 20: 1233–40. [DOI] [PubMed] [Google Scholar]
- 10. Redon R, Ishikawa S, Fitch KR et al . Global variation in copy number in the human genome. Nature 2006; 444: 444–54. [DOI] [PMC free article] [PubMed] [Google Scholar]
- 11. Andersen CL, Wiuf C, Kruhoffer M, Korsgaard M, Laurberg S, Orntoft TF. Frequent occurrence of uniparental disomy in colorectal cancer. Carcinogenesis 2007; 28: 38–48. [DOI] [PubMed] [Google Scholar]
- 12. Tsafrir D, Bacolod M, Selvanayagam Z et al . Relationship of gene expression and chromosomal abnormalities in colorectal cancer. Cancer Res 2006; 66: 2129–37. [DOI] [PubMed] [Google Scholar]
- 13. Gaasenbeek M, Howarth K, Rowan AJ et al . Combined array‐comparative genomic hybridization and single‐nucleotide polymorphism–loss of heterozygosity analysis reveals complex changes and multiple forms of chromosomal instability in colorectal cancers. Cancer Res 2006; 66: 3471–9. [DOI] [PubMed] [Google Scholar]
- 14. Lips EH, Dierssen JW, Van Eijk R et al . Reliable high‐throughput genotyping and loss‐of‐heterozygosity detection in formalin‐fixed, paraffin‐embedded tumors using single nucleotide polymorphism arrays. Cancer Res 2005; 65: 10 188–91. [DOI] [PubMed] [Google Scholar]
- 15. Miyakura Y, Sugano K, Konishi F et al . Extensive methylation of hMLH1 promoter region predominates in proximal colon cancer with microsatellite instability. Gastroenterology 2001; 121: 1300–9. [DOI] [PubMed] [Google Scholar]
- 16. Storey JD, Tibshirani R. Statistical significance for genomewide studies. Proc Natl Acad Sci USA 2003; 100: 9440–5. [DOI] [PMC free article] [PubMed] [Google Scholar]
- 17. Jones HE, Ohlssen DI, Spiegelhalter DJ. Use of the false discovery rate when comparing multiple health care providers. J Clin Epidemiol 2008; 61: 232–40. [DOI] [PubMed] [Google Scholar]
- 18. Zanesi N, Fidanza V, Fong LY et al . The tumor spectrum in FHIT‐deficient mice. Proc Natl Acad Sci USA 2001; 98: 10 250–5. [DOI] [PMC free article] [PubMed] [Google Scholar]
- 19. Andersen CL, Wiuf C, Kruhoffer M, Korsgaard M, Laurberg S, Orntoft TF. Frequent occurrence of uniparental disomy in colorectal cancer. Carcinogenesis 2006; 28: 38–48. [DOI] [PubMed] [Google Scholar]
- 20. Cox DR. Regression models and life tables. J R Stat Soc 1972; 34: 187–220. [Google Scholar]
- 21. Sugihara T, Magae J, Wadhwa R et al . Dose and dose‐rate effects of low‐dose ionizing radiation on activation of Trp53 in immortalized murine cells. Radiat Res 2004; 162: 296–307. [DOI] [PubMed] [Google Scholar]
- 22. Wagner KJ, Patek CE, Miles C, Christie S, Brookes AJ, Hooper ML. Truncation of WT1 results in downregulation of cyclin G1 and IGFBP‐4 expression. Biochem Biophys Res Commun 2001; 287: 977–82. [DOI] [PubMed] [Google Scholar]
- 23. Aho S, Buisson M, Pajunen T et al . Ubinuclein, a novel nuclear protein interacting with cellular and viral transcription factors. J Cell Biol 2000; 148: 1165–76. [DOI] [PMC free article] [PubMed] [Google Scholar]
- 24. Kinzler KW, Nilbert MC, Vogelstein B et al . Identification of a gene located at chromosome 5q21 that is mutated in colorectal cancers. Science 1991; 251: 1366–70. [DOI] [PubMed] [Google Scholar]
- 25. Cawkwell L, Lewis FA, Quirke P. Frequency of allele loss of DCC, p53, RBI, WT1, NF1, NM23 and APC/MCC in colorectal cancer assayed by fluorescent multiplex polymerase chain reaction. Br J Cancer 1994; 70: 813–18. [DOI] [PMC free article] [PubMed] [Google Scholar]
- 26. Matsumine A, Senda T, Baeg GH et al . MCC, a cytoplasmic protein that blocks cell cycle progression from the G0/G1 to S phase. J Biol Chem 1996; 271: 10 341–6. [DOI] [PubMed] [Google Scholar]
- 27. Fijneman RJ, Carvalho B, Postma C, Mongera S, Van Hinsbergh VW, Meijer GA. Loss of 1p36, gain of 8q24, and loss of 9q34 are associated with stroma percentage of colorectal cancer. Cancer Lett 2007; 258: 223–9. [DOI] [PubMed] [Google Scholar]
- 28. Jones AM, Douglas EJ, Halford SE et al . Array‐CGH analysis of microsatellite‐stable, near‐diploid bowel cancers and comparison with other types of colorectal carcinoma. Oncogene 2005; 24: 118–29. [DOI] [PubMed] [Google Scholar]
- 29. Chang SC, Tucker T, Thorogood NP, Brown CJ. Mechanisms of X‐chromosome inactivation. Front Biosci 2006; 11: 852–66. [DOI] [PubMed] [Google Scholar]
- 30. Carrington JC, Ambros V. Role of microRNAs in plant and animal development. Science 2003; 301: 336–8. [DOI] [PubMed] [Google Scholar]
- 31. Carninci P, Kasukawa T, Katayama S et al . The transcriptional landscape of the mammalian genome. Science 2005; 309: 1559–63. [DOI] [PubMed] [Google Scholar]
- 32. Takada S, Berezikov E, Yamashita Y et al . Mouse microRNA profiles determined with a new and sensitive cloning method. Nucleic Acids Res 2006; 34: e115. [DOI] [PMC free article] [PubMed] [Google Scholar]
Associated Data
This section collects any data citations, data availability statements, or supplementary materials included in this article.
Supplementary Materials
Fig. S1. Hierarchical clustering tree in Figure 1a is demonstrated with subject ID indicated at the bottom.
Table S1. Clinical characteristics of the study subjects
Table S2. Chromosomal copy number alterations (CNA) and loss of heterozygosity (LOH) related to clinical characteristics of colorectal carcinoma
Please note: Blackwell Publishing are not responsible for the content or functionality of any supporting materials supplied by the authors. Any queries (other than missing material) should be directed to the corresponding author for the article.
Supporting info item
Supporting info item
Supporting info item