

Abstract
Epigenetic gene inactivation plays a key role in the development of various types of cancer. Using methylated CpG island amplification coupled with representational difference analysis to identify genes inactivated by DNA methylation in gastric cancer, we identified seven DNA fragments corresponding to the 5′ CpG islands of the affected genes. One of the clones recovered was identical to the 5′ flanking region of DFNA5, a gene previously shown to be associated with deafness and induced by DNA damage. Further analysis revealed that DFNA5 is expressed in normal tissues but is downregulated in gastric cancer cell lines due to methylation of the region around its transcription start site. Treating gastric cancer cells that lacked DFNA5 expression with a methyltransferase inhibitor, 5‐aza‐2′‐deoxycytidine, restored the gene's expression. Methylation of DFNA5 was detected in 50% of primary gastric tumors, and was correlated with positivity for Epstein–Barr virus and the absence of metastasis. Moreover, introduction of exogenous DFNA5 into silenced cells suppressed colony formation. Taken together, these data suggest that the silencing of DFNA5 occurs frequently in gastric cancer and may play a key role in development and progression of the disease. (Cancer Sci 2007; 98: 88–95)
Gastric cancer is the leading cause of cancer death in the world( 1 ) and its prognosis remains poor, especially in patients with more advanced stages. It is known that pathogens such as Helicobacter pylori and Epstein–Barr virus (EBV) are involved in the development of gastric cancer, though the molecular mechanisms by which these pathogens induce tumorigenesis are not fully understood. Gastric cancer may arise through accumulation of genetic changes, such as mutation of p53 and/or K‐ras, but the frequencies of such mutations within known oncogenes and tumor suppressor genes are relatively low in gastric cancer, as compared to colorectal cancer, for example.( 2 , 3 )
Epigenetic changes such as DNA methylation and histone modification have recently been shown to play important roles in tumorigenesis.( 4 , 5 , 6 ) Moreover, genes involved in cell cycle checkpoints,( 7 , 8 ) apoptosis,( 7 ) differentiation,( 9 ) metastasis,( 10 ) cell signaling( 11 , 12 ) and gene transcription( 13 ) all have been shown to be silenced by DNA methylation in gastric cancer. Genes silenced by DNA methylation can be identified efficiently using a microarray to screen for genes upregulated by treatment with a methyltransferase inhibitor.( 14 , 15 ) Aberrantly methylated DNA fragments also can be used as molecular markers to identify genes silenced in cancer, and various methylation‐based genome screening techniques, including methylation‐sensitive representational difference analysis (MS‐RDA), restriction landmark genome scanning (RLGS) and methylation‐sensitive arbitrarily primed‐polymerase chain reaction (MS‐APPCR) have been developed to identify genes differentially methylated in cancer and normal tissues.( 16 , 17 , 18 ) These methods have the advantage of being able to identify genes silenced by DNA methylation regardless of the expression level of the target genes. In addition, we have developed a genome screening technique, methylated CpG island (CGI) amplification (MCA),( 19 ) which is unique in that it enables us to amplify only methylated CpG‐rich regions. Using MCA coupled with representational difference analysis (RDA) or a bacteria artificial chromosome (BAC) array, genes aberrantly methylated in cancer can be identified.( 19 , 20 , 21 , 22 )
Our aim in the present study was to apply MCA–RDA to identify genes inactivated by DNA methylation in gastric cancer. Using this approach, we identified seven novel targets of epigenetic inactivation, including the deafness gene DFNA5, which our findings suggest may play a key role in of the development and progression of gastric cancer.
Materials and Methods
Cell lines and specimens. The 11 gastric cancer cell lines used in this study were obtained from the Japanese Collection of Research Bioresources (Tokyo, Japan) or the American Tissue Type Collection (Manassas, VA, USA) and were cultured in the appropriate medium. A gastric cancer cell line, SH1101, was kindly provided by Dr K. Yanagihara (National Cancer Center Research Institute, Tokyo, Japan) and was described previously.( 23 ) The 89 gastric tumor and paired normal tissue specimens were from 89 randomly selected Japanese patients; these specimens were removed surgically and immediately frozen and stored at −80°C until use. Informed consent was obtained from all patients before collection of the samples. DNA was extracted using the standard phenol–chloroform method. Total RNA was extracted using Trizol (Invitrogen, Carlsbad, CA, USA).
Methylated CGI amplification coupled with representational difference analysis. Methylated CGI amplification was carried out as described previously.( 19 ) We used the MCA amplicon from the MKN28 and MKN45 gastric cancer cell lines as testers and the amplicon from normal stomach tissue as the driver. After two rounds of subtraction by RDA, the polymerase chain reaction (PCR) products were digested with XmaI and ligated into pBluescriptII (Stratagene, La Jolla, CA, USA), after which the inserts were sequenced using an ABI3100 Genetic Analyzer (Applied Biosystems, Foster City, CA, USA). Database analysis was carried out using Blast (http://www.ncbi.nlm.nih.gov/BLAST/) and BLAT (http://genome.ucsc.edu).
Bisulfite PCR. Bisulfite treatment of DNA, combined bisulfite restriction analysis (COBRA) and bisulfite genomic sequencing were carried out as described previously.( 24 ) The primers and restriction enzymes used are shown in Table 1. Percentages of methylated alleles were calculated using a CS Analyzer (ATTO, Tokyo, Japan). Bisulfite sequencing was carried out using the primers region B (B), regions C‐F and D‐R (C‐D), S3‐F and S3‐R (S3), region F‐F and S4‐R (S4). PCR products were cloned into the pCR4 vector using a TOPO‐TA Cloning Kit (Invitrogen), after which the plasmid DNA was purified using PI100 (Kurabo, Tokyo, Japan). The sequencing reaction was then carried out using a BigDye terminator kit (Applied Biosystems), and the DNA was sequenced using an ABI 3100 automated sequencer (Applied Biosystems).
Table 1.
Primer sequences used in this study
| CpG islands | Primer | Restriction enzyme |
|---|---|---|
| AG121 | F: 5′‐ATATGAGAATYGTTAAATAYGAAAGAG‐3′ R: 5′‐CCCAACTTAACRCCCAACTAC‐3′ | TaqI |
| AG125 | F: 5′‐AGGTATYGGTTTTATTTTTATTTATG‐3′ R: 5′‐ATACAAACAATAACRAAAAAAAAC‐3′ | TaiI |
| AG140 | F: 5′‐GGATTTGGTAGGTYGGGTGTAGAGT‐3′ R: 5′‐CRCTAACCTCRCTACCTTCCTAAC‐3′ | BstUI |
| AG322 | F: 5′‐ATTTYGGGTGGGGGAAGAGAG‐3′ R: 5′‐ACCAAACCCRAAACRAAACTATACA‐3′ | MboI |
| AG341 | F: 5′‐GAAGGTTTTAATGGTTTTGGGA‐3′ R: 5′‐CCTAAAAAAACTAACRAAAAACAATC‐3′ | HhaI |
| AG390 | F: 5′‐GGAGGTYGTTGGGTATAGGGAG‐3′ R: 5′‐CRAACCAACCCCAACTAAAAAATC‐3′ | TaqI |
| Region A | F: 5′‐TTGTTATAGYGAGGTAGAGTTAAAAT‐3′ R: 5′‐ATCTTCTAAACCTAAAAACRAATCA‐3′ | TaiI |
| Region C | F: 5′‐GGTTYGGGTTAGATTTTTTAGAAG‐3′ R: 5′‐AAAAACAAACRCAACCCACTC‐3′ | HhaI |
| Region B | F: 5′‐GGGGTTTTTYGGGAAGAGTG‐3′ R: 5′‐CAAACTAAACAAACCTTAAACTTTCCT‐3′ | MboI |
| HhaI | ||
| Region D | F: 5′‐GAGYGAGGGGAGGGTGGTTTAG‐3′ R: 5′‐ACRCAAACTCCTCCRACTC‐3′ | HhaI |
| Region E | F: 5′‐GGAGAGGATGGGAAGGGGATG‐3′ R: 5′‐CCCTCRCTCCTTCCTAAAAAAAAC‐3′ | MboI |
| Region F | F: 5′‐GGGGTTTGGTTTTTTTTTTAAGTTAG‐3′ R: 5′‐CCCATTCRTTCATCCTTTATATTC‐3′ | TaqI |
| Region G | F: 5′‐ATTTGGATTTGTTTTATTTGTTTG‐3′ R: 5′‐CATTTAAAAACCTCTAACCCTTTC‐3′ | MboI |
| Region H | F: 5′‐TAGTTAYGGGTGTATGGGAGGA‐3′ R: 5′‐TTAAACCCAAACCATTAAATAAATCT‐3′ | MboI |
| S3 | F: 5′‐AGAAGAGATYGGAATATAAAGGATGAA‐3′ R: 5′‐AAATCCRCTCCRAACTCCAC‐3′ | |
| S4 | R: 5′‐CTAACTTAAAAAAAAAACCAAACCC‐3′ | |
| ChIP | F: 5′‐ATGTCGGGGCCTCTCGGGAAGAGT‐3′ R: 5′‐GGCATTAGGGGCTCCCACAGGCT‐3′ | |
| RT‐PCR | DFNA5A‐F: 5′‐AGCGCAGGCTCCTCCGACTC‐3′ DFNA5B‐F: 5′‐CCCCGACATCTCCCGGATAATCTG‐3′ DFNA5‐R: 5′‐GTTTGCAAACTTGCCCTCGTATTTC‐3′ |
Y = C or T, R = A or G. ChIP, chromatin immunoprecipitation; RT‐PCR, reverse transcription–polymerase chain reaction.
Reverse transcription–polymerase chain reaction. Five micrograms of total RNA were reverse transcribed using SuperScript III Reverse Transcriptase (Invitrogen), after which PCR was carried out using primers specific for DFNA5‐a and DFNA5‐b (Table 1). The integrity of the cDNA was confirmed by amplifying glyceraldehyde‐3‐phosphate dehydrogenase (GAPDH) as described previously. To analyze restoration of DFNA5, JRST and SNU638 cells were incubated for 72 h with 2 µM 5‐aza‐2′‐deoxycytidine (5‐aza‐dC) (Sigma, St Louis, MO, USA). KatoIII cells were treated with 0.2 µM 5‐aza‐dC, 300 nM trichostatin A (TSA) or 0.2 µM 5‐aza‐dC + 300 nM TSA. For quantitative real‐time PCR, reactions were carried out using a 7900 Sequence Detection System (Applied Biosystems). The reaction mixture contained 1× TaqMan Universal PCR Master Mix, primers and probes for DFNA5 (Hs‐00189346; Applied Biosystems) and 1 µL cDNA. The integrity of the cDNA was confirmed by amplifying GAPDH as described previously.( 25 )
Chromatin immunoprecipitation. Chromatin immunoprecipitation (ChIP) was carried out as described previously.( 26 ) Briefly, cells were harvested and then incubated in 1.0% formaldehyde for 10 min at 37°C to cross‐link the proteins and DNA. The resultant suspensions of fixed cells were put on ice and allowed to settle for 10 min, after which they were spun down by brief centrifugation, and the supernatant was aspirated carefully. The cells were then washed with ice‐cold phosphate‐buffered saline containing protease inhibitors and resuspended in lysis buffer (1% sodium dodecylsulfate, 10 mM ethylenediaminetetracetic acid, 50 mM Tris‐HCl pH 8.0, and protease inhibitor), after which the nucleoprotein complexes were sonicated to reduce the DNA to fragments ranging from 200 to 1000 bp in size. Immunoprecipitation was then carried out for 16 h at 4°C with rotation using anti‐acetylated histone H3 (Upstate Biotechnologies, Lake Placid, NY, USA) and antidimethylated histone H3K9 antibodies( 27 ) as probes. The resultant immune complexes were collected using protein A–agarose beads, after which the DNA was purified by phenol–chloroform extraction, precipitated with ethanol and resuspended in water. Approximately 1/100 of the precipitated DNA was used for PCR; 1/100 of the solution before adding antibody was used as an internal control for the amount of DNA. PCR was carried out in solution containing 1× PCR buffer (TaKaRa, Tokyo, Japan), 1 µM primers, 0.25 mM dNTP mixture and 1.0 IU of Hot Start Taq polymerase (TaKaRa). The primer sequences for the PCR reaction are shown in Table 1. The amplified products were subjected to agarose gel electrophoresis.
Colony formation assay. Cells (2 × 10⁶) were transfected with 5 µg of pcDNA3.1‐DFNA5 or empty pcDNA3.1 vector using a Cell Line Nucleofector Kit V (Amaxa, Cologne, Germany) and a Nucleofector I electroporation device (Amaxa) according to the manufacturer's instructions. The cells were then plated on 60‐mm culture dishes and selected for 14 days with 0.6 mg/mL G418, after which the resultant colonies were stained with Giemsa and counted using National Institute of Health IMAGE software.
Adenoviral gene transfer of DFNA5 and flow cytometric analysis. A recombinant adenoviral vector encoding DFNA5 was constructed using the replication‐deficient E1‐deleted Ad5 vector pJM17 (Microbix Biosystem, Toronto, ON, Canada). Expression of DFNA5 was under the control of a human cytomegalovirus promoter/enhancer and a bovine growth hormone polyadenylation signal. To determine the relative efficiency of the adenovirus‐mediated gene transfer, cells also were infected with Ad‐lacZ. The NUGC3 human gastric cancer cell line was used for these experiments because it showed relatively high efficiency for gene transfer. Seventy‐two hours after infection, cells were harvested, fixed in 70% ethanol, incubated with 2 mg/mL RNase, and stained in 50 µg/mL propidium iodide (PI) solution. Approximately 5 × 10⁴ stained cells were analyzed using a Becton Dickinson FACScan flow cytometer (Braintree, MA, USA).
Statistical analysis. Statistical analyses were carried out using StatView software (SAS Institute, Cary, NC, USA). Fisher's exact test (two‐sided), Student's t‐test and the Mann–Whitney test were used to evaluate the association between methylation of DFNA5 and clinicopathological features. Values of P < 0.05 were considered significant.
Results
Identification of aberrantly methylated DNA fragments in gastric cancer using MCA–RDA. To identify genes methylated in gastric cancer, we carried out MCA coupled with RDA using amplicons from gastric cancer cell lines as testers and an amplicon from normal stomach tissues as the driver. Upon sequencing 390 randomly selected clones obtained with MCA–RDA, 39 were found to be independent. BLAST and BLAT searches of each clone confirmed that all were homologous to Genbank sequences located in the high‐throughput genomic sequence database. Of the clones analyzed, 19 had CGI, six were associated with the 5′ CGI of annotated genes, and one was associated with the 5′ CGI of uncharacterized expressed sequence tag (EST) (Table 2). When we examined the methylation status of seven genes associated with MCA clones in gastric cancer cells, we found all seven to be densely methylated (Fig. 1). The locations of the fragments obtained using MCA–RDA, the distribution of the CPG sites, the transcription start sites and the restriction sites analyzed are shown in Fig. 2A and Fig. 3.
Table 2.
Clones recovered from regions around genes related 5′ CpG islands
| Clone | Size (bp) | %GC | CpG/GpC | Chromosome | Position | Gene |
|---|---|---|---|---|---|---|
| AG1 | 514 | 57 | 0.65 | 7p15.3 | 24 570 565–24 571 078 | DFNA5 |
| AG121 | 498 | 76 | 0.93 | 8q11.2 | 55 542 124–55 542 621 | BC028018 |
| AG125 | 458 | 75 | 0.91 | 1q41 | 217 090 046–217 090 503 | MARK1 |
| AG140 | 197 | 70 | 0.65 | 3q21.3 | 129 694 841–129 695 037 | GATA2 |
| AG322 | 351 | 72 | 0.59 | 1p35.2 | 31 838 536–31 838 886 | COL16A1 |
| AG341 | 455 | 70 | 0.65 | 9q34.1 | 132 484 951–132 485 405 | BARHL1 |
| AG390 | 510 | 75 | 0.8 | 11q13.2 | 68 208 754–68 209 263 | GAL1 |
Figure 1.
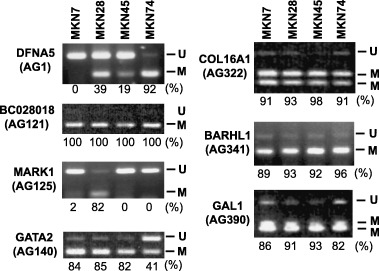
Methylation analysis of genes identified by methylated CpG island amplification coupled with representational difference analysis. Combined bisulfite restriction analysis was carried out using primers that amplify the region around the transcription start site of the genes. The cell lines examined are shown at the top; the genes and clones analyzed are shown on the left. The relative percentages of methylated alleles are shown below the columns.
Figure 2.
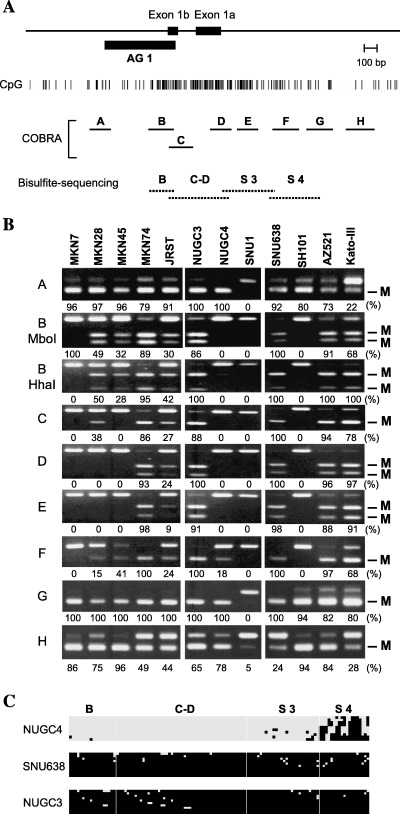
Methylation analysis of DFNA5 in gastric cancer cell lines. (A) Schematic representation of the DFNA5 CpG island. The solid box indicates the location of exon 1. The position of the DNA fragments obtained by methylated CpG island (CGI) amplification coupled with representational difference analysis is shown by the solid box designated as AG1. The solid horizontal lines indicate the regions analyzed by combined bisulfite restriction analysis (COBRA), the dotted lines the regions analyzed using bisulfite sequencing. (B) COBRA was carried out using eight sets of primers that covered the entire DFNA5 CGI. M, methylated alleles. Percentages of methylated alleles are shown below the column. Cell lines are shown on the top. (C) Bisulfite sequence analysis of DFNA5: □, unmethylated alleles; ▪, methylated alleles. Cell lines examined are shown on the left. The regions analyzed are shown on the top.
Figure 3.
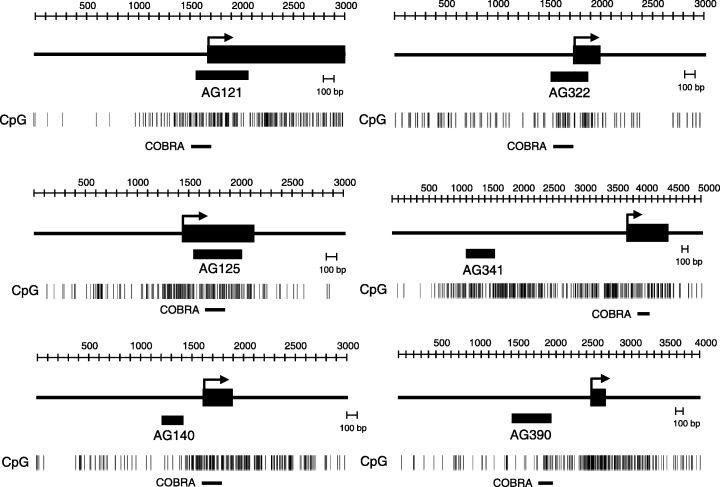
Schematic representation of the CGI obtained by MCA/RDA. The solid box indicates the location of exon 1. The hatched box shows the position of the DNA fragments obtained by MCA/RDA. CpG sites are shown by vertical bar. The solid horizontal lines indicate the regions analyzed by COBRA.
Methylation analysis of the 5′ CGI of DFNA5 in gastric cancer cell lines. One of the clones recovered was identical to the 5′ flanking region of DFNA5 (Genbank accession no. NM_004403). DFNA5 is reportedly downregulated in etoposide‐resistant melanoma, which contributes to the acquired etoposide resistance.( 28 , 29 ) This prompted us to examine the methylation of DFNA5 in detail. DFNA5 is mapped on chromosome 7p15.3 and is comprised of 11 exons that span approximately 110 kb. The cDNA sequence contains a predicted 1488‐bp open reading frame encoding a 496‐amino acid protein. A search for transcripts and EST of this gene suggested the presence of two alternatives for exon 1 (1a and 1b) within the same CGI (GC content, 60.3; CpG/GpC ratio of 0.812 in a 1711‐bp region; http://www.uscnorris.com/cpgislands2/cpg.aspx). However, because the first ATG is present within exon 2, the alternatively spliced isoforms encode identical proteins.
To explore the role of DFNA5 methylation in gastric cancer, we used COBRA to analyze the methylation status of DFNA5 CGI in 12 gastric cancer cell lines (Fig. 2A). We found that all of the cell lines showed aberrant methylation at the edge of the CGI (Fig. 2B). By contrast, methylation of the regions around the transcription start site differed among the cell lines tested. We then carried out bisulfite sequencing to examine in more detail the methylation status of each CpG dinucleotide within the DFNA5 CGI (Fig. 2C). Two gastric cancer cell lines, SNU‐638 and NUGC3, which COBRA showed to have fully methylated alleles displayed methylation of almost all CpG sites. However, NUGC4 displayed no methylation, except in region S4, which is consistent with the results of the COBRA analysis.
Epigenetic silencing of DFNA5 in gastric cancer cell lines. We next carried out reverse transcription (RT)‐PCR analyses using cDNAs from normal organ tissues to clarify which alternative exon 1 was predominantly expressed. We found that exon 1a was ubiquitously expressed in all of the organs tested, including stomach. By contrast, the transcript derived from exon 1b was barely detectable (Fig. 4A,B). Real‐time RT‐PCR carried out using cDNA from 12 gastric cancer cell lines revealed substantial levels of DFNA5 expression in normal stomach, colon and pancreatic tissues, and in five cell lines; four other cell lines expressed low levels of DFNA5, whereas three did not express it at all (Fig. 4C). Dense methylation of region D, but not of the edges of the CpG island, was closely associated with gene silencing (Fig. 4C).
Figure 4.
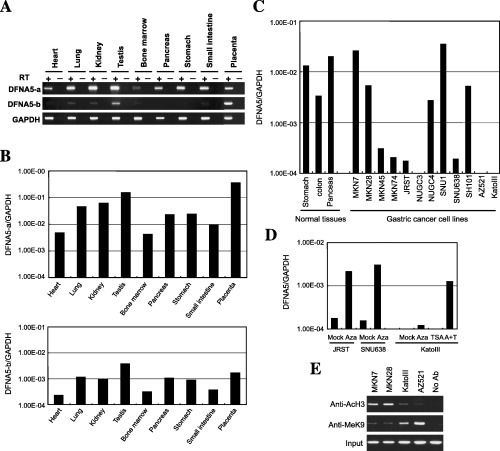
Analysis of DFNA5 expression in gastric cancer cell lines. (A) Expression of two isoforms of DFNA5 in normal tissues. Reverse transcription–polymerase chain reaction (PCR) was carried out using primers that specifically amplified DFNAa and DFNAb. (B) Quantitative analysis of DFNA5a (top) and DFNA5b (bottom) in normal tissues. Real‐time PCR was carried out to determine the expression levels of the two DFNA5 isoforms. The tissues analyzed are shown below the column. (C) Expression of DFNA5 in gastric cancer cell lines. Real‐time PCR was carried out using cDNA from the indicated cell lines. The tissues and cell lines examined are shown below the columns. (D) Restoration of DFNA5 by treatment with 5‐aza‐2′‐deoxycytidine (5‐aza‐dC) and/or trichostatin A (TSA). JRST and SNU638 cells were treated with mock or 2.0 µM 5‐aza‐dC (Aza) for 96 h and harvested, after which the RNA was extracted. KatoIII cells were treated with mock, 0.2 µM 5‐aza‐dC (Aza) for 72 h, 300 nM TSA for 24 h or 0.2 µM 5‐aza‐dC for 72 h plus 300 nM TSA for 24 h (A + T). (E) Acetylation and methylation status of histone in cancer cells, with or without methylation of DFNA5. Chromatin immunoprecipitation (ChIP)‐PCR was carried out using four sets of primers that covered the 5′ region of DFNA5. The antibodies used for ChIP analysis are shown on the left, the cell lines used are shown at the top.
To confirm that the gene silencing was related to the observed DNA methylation, cell lines displaying low levels of DFNA5 expression or none at all were treated with the methyltransferase inhibitor 5‐aza‐dC, the histone deacetylase inhibitor TSA or both (Fig. 4D). Treatment with 5‐aza‐dC restored DFNA5 expression in JRST and SNU638 cells, and 5‐aza‐dC + TSA acted synergistically to reactivate gene expression in KatoIII cells. However, treatment with TSA alone did not restore gene expression.
To further evaluate the role of histone acetylation and methylation in DFNA5 silencing, we carried out ChIP assays using anti‐acetylated H3 and anti‐K9 methylated H3 antibodies as probes. We found that histone was deacetylated in cell lines where DFNA5 was methylated at regions C and D (Fig. 4E). By contrast, methylation of H3K9 was inversely correlated with gene expression. Thus both methylation of the promoter region within CGI and histone deacetylation and methylation appear to be crucially involved in the silencing of DFNA5 expression in human tumors.
The levels of methylation in each of the regions tested and the levels of DFNA5 expression are summarized in Fig. 5. Although methylation of regions A, H and I occurred frequently, such methylation at the edge of the CGI did not affect DFNA5 expression. By contrast, little or no expression of DFNA5 was detected in cell lines that showed dense methylation of regions C and D (KatoIII, SNU638, MKN74, NUGC3 and AZ521). Three cell lines that showed varying levels of methylation in regions B to F (MKN45, MKN28, JRST) expressed low levels of DFNA5. Apparently, methylation of the region around the transcription start site plays a key role in silencing DFNA5 expression.
Figure 5.

Summary of expression and methylation of DFNA5. The 5′ CpG island of DFNA5 was divided into nine regions shown at the top. The percentages of methylated alleles were determined as shown in Fig. 1, and shown in black in the circles. The expression status of DFNA5 is shown on the right. The cell lines analyzed are shown on the left.
Aberrant methylation of DFNA5 in primary gastric cancers. To determine whether aberrant methylation of DFNA5 is involved in primary gastric cancers, we first evaluated the methylation of region C using COBRA. Of the 89 gastric cancers examined, 46 (52%) showed aberrant methylation (Fig. 6A). Although methylation was barely detectable in the gastric mucosa adjacent to the tumors, gastric cancers showed dense methylation; indeed, methylation of region C was cancer specific. Subsequent bisulfite sequencing of the region around the transcription start site revealed that in the specimens shown by COBRA to be methylated, all of the CpG sites analysed were densely methylated (Fig. 6B). Moreover, expression of DFNA5 was barely detectable in five primary tumors that showed methylation (Fig. 6C), whereas gastric cancers without methylation of DFNA5 expressed the gene at varying levels. Thus methylation‐dependent silencing of DFNA5 is not a cell line‐specific event.
Figure 6.
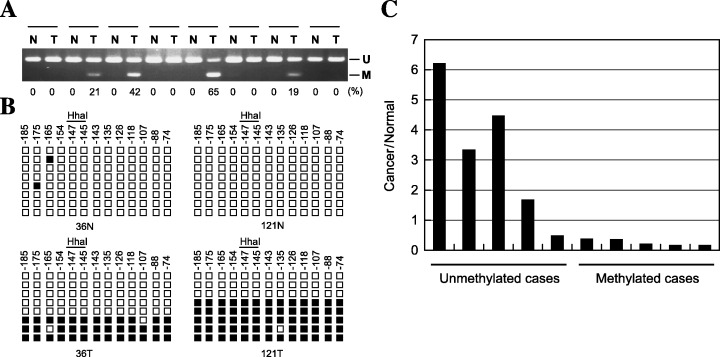
Epigenetic inactivation of DFNA5 in primary gastric cancers. (A) The methylation status of DFNA5 was determined by combined bisulfite restriction analysis (COBRA): N, normal tissues; T, tumors. (B) Bisulfite sequencing of DFNA5. Each square represents a CpG site. The distance from the transcription start site is shown above, as is the restriction enzyme site used for COBRA: □, unmethylated alleles; ▪, methylated alleles. (C) Correlation between expression and methylation of DFNA5. Expression levels of DFNA5 were determined using the ΔΔCT method with ABI7900.
Fifty‐nine of the gastric cancers examined had been analyzed previously for the presence of the CGI methylator phenotype (CIMP).( 30 ) Fifteen of the 17 (88%) CIMP‐high cases and 13 (43%) of the 30 CIMP‐low cases showed methylation of DFNA5, but only one of the 12 (8%) CIMP‐negative cases showed DFNA5 methylation. There was thus a significant correlation between DFNA5 methylation and the presence of CIMP (P < 0.01, Fisher's exact test). In addition, methylation of DFNA5 was detected significantly less frequently in metastatic gastric cancers (P = 0.0211) and more frequently in gastric cancers showing EBV positivity (P = 0.0019). The correlations between DFNA5 methylation and clinicopathological features are summarized in Table 3. In a multiple logistic regression model in which methylation of DFNA5 was the dependent variable, three clinicopathological features (the pM category, the presence of CIMP and EBV positivity) were investigated as independent variables. Only the presence of CIMP correlated significantly (P < 0.01) with methylation of DFNA5, indicating that DFNA5 is one of the genes targeted in CIMP.
Table 3.
Clinicopathological features of gastric cancer with or without DFNA5 methylation
| Characteristics | Total (n = 59) | No. cases (%) methylated (n = 29) | Unmethylated (n = 30) | P‐value |
|---|---|---|---|---|
| Age (years, mean ± SD) | 64.41 ± 13.27 | 64.73 ± 11.37 | ||
| Sex | ||||
| Male | 29 | 20 | 21 | 1 |
| Female | 18 | 9 | 9 | |
| Tumor location | ||||
| Upper third | 13 | 4 | 9 | 0.1752 |
| Middle third | 22 | 8 | 14 | |
| Lower third | 24 | 12 | 12 | |
| Macroscopic type | ||||
| 0 | 4 | 3 | 1 | 0.8238 |
| 1 | 4 | 2 | 2 | |
| 2 | 25 | 13 | 12 | |
| 3 | 20 | 9 | 11 | |
| 4 | 6 | 2 | 4 | |
| Histology | ||||
| Intestinal | 28 | 13 | 15 | 0.7961 |
| Diffuse | 31 | 16 | 15 | |
| Lymphatic invasion | ||||
| Negative | 15 | 9 | 6 | 0.3817 |
| Positive | 44 | 20 | 24 | |
| Venous invasion | ||||
| Negative | 30 | 17 | 13 | 0.3015 |
| Positive | 29 | 12 | 17 | |
| pT category | ||||
| pT1 | 6 | 3 | 3 | 0.8608 |
| pT2 | 32 | 17 | 15 | |
| pT3 | 20 | 9 | 12 | |
| pT4 | 1 | 0 | 1 | |
| pN category | ||||
| pN0 | 14 | 7 | 7 | 1 |
| pN1 | 21 | 11 | 10 | |
| pN2 | 13 | 6 | 7 | |
| pN3 | 11 | 5 | 6 | |
| pM category | ||||
| pM0 | 47 | 27 | 20 | 0.0211 |
| pM1 | 12 | 2 | 19 | |
| Stage (pTNM) | ||||
| I | 12 | 7 | 5 | 0.313 |
| II | 10 | 5 | 5 | |
| III | 16 | 10 | 6 | |
| IV | 21 | 7 | 14 | |
| CIMP | ||||
| High | 17 | 15 | 2 | <0.001 |
| Low | 30 | 13 | 17 | |
| Negative | 12 | 1 | 11 | |
| Helicobactor pylori infection | ||||
| Positive | 44 | 20 | 24 | 0.3817 |
| Negative | 15 | 9 | 6 | |
| Epstein–Barr virus infection | ||||
| Positive | 8 | 8 | 0 | 0.0019 |
| Negative | 51 | 21 | 30 | |
| p53 mutation | ||||
| Positive | 15 | 5 | 10 | 0.2326 |
| Negative | 44 | 24 | 20 | |
| K‐ras mutation | ||||
| Positive | 4 | 3 | 1 | 0.3533 |
| Negative | 55 | 26 | 29 | |
CIMP, CpG island methylator phenotype.
DFNA5 suppresses cell growth. Having previously demonstrated that reduced expression of DFNA5 correlates with tumor cell resistance to chemotherapeutic drugs( 29 ) we examined the tumor suppressor activity of DFNA5 using in vitro colony formation assays. With the cell line tested, transfection with DFNA5 significantly reduced the number of neomycin‐resistant colonies, as compared with transfection with control vector (Fig. 7), which suggests that DFNA5 may act as a growth suppressor in gastric cancer cells.
Figure 7.
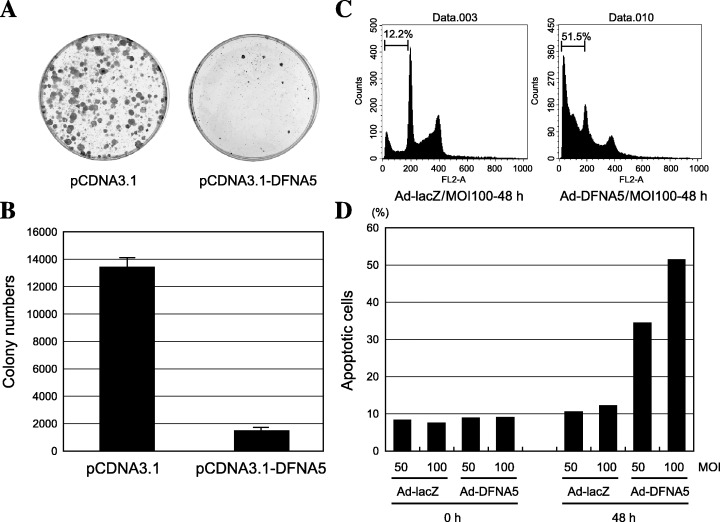
Growth suppressive and proapoptotic activity of DFNA5. (A) Colony formation assay. NUGC3 cells were transfected with pcDNA3.1 or pcDNA3.1‐DFNA5 and plated. After 2 weeks the cells were fixed with methanol and stained with Giemsa. (B) Quantitative analysis of colony numbers after transfecting NUGC3 cells with pcDNA3.1 or pcDNA3.1‐DFNA5. Each experiment was repeated three times; the average numbers of colonies are shown. (C) Representative results of a flow cytometric analysis carried out after infecting NUGC3 cells with Ad‐lacZ and Ad‐DFNA5. The incidence of sub‐G1 cells was determined 72 h after infection. (D) Quantitative analysis of sub‐G1 cells. Percentages of sub‐G1 cells are shown on the y‐axis.
To investigate the proapoptotic effects of DFNA5, a recombinant adenoviral vector encoding DFNA5 (Ad‐DFNA5) was constructed and used to infect NUGC3 cells. Alternatively, some cells were infected with the control Ad‐lacZ vector. Flow cytometric analysis carried out 72 h after infection showed a three to five‐fold increase in sub‐G1 content in cells infected with Ad‐DFNA5, indicating that expression of DFNA5 may exert a proapoptotic effect (Fig. 7C,D).
Discussion
Using MCA coupled with RDA, we identified seven DNA fragments corresponding to 5′ CGI aberrantly methylated in gastric cancer cell lines. Among the clones identified, MARK1 was previously shown to be upregulated by 5‐aza‐dC in gastric cancer cell lines.( 15 ) However, the other six genes were not recovered in previous studies, indicating that the combination of expression‐based and methylation‐based approaches is a useful method for screening genes silenced by DNA methylation in cancer.
We found that methylation of the region around the transcription start site of DFNA5 correlated with silencing of the gene; methylation of the edge of the CGI occurred frequently but was not associated with gene silencing. Evidence suggests, however, that methylation first seen at the edge of a CGI may eventually spread to the region around the transcription start site, silencing the affected gene. For example, variation in the CGI methylation status has been reported for CACNA1G, DAP‐kinase, HRK and RASSF2, suggesting that progressive methylation from the border to the transcription start site may be a common event in cancer‐related gene silencing.( 21 , 31 , 32 , 33 ) That expression of DFNA5 could be restored by treating cells with 5‐aza‐dC confirms that DNA methylation, not the absence of a critical transcription factor, is the cause of the gene silencing. In addition, ChIP analysis showed involvement of deacetylation of histone H3 and methylation of histone H3K9 in the DNA methylation‐dependent silencing of DFNA5. Although there was a significant correlation between DNA methylation and the silencing of DFNA5, DNA methylation may not be the only factor involved. For example, expression of DFNA5 in JRST cells, which retain an unmethylated allele, can be reactivated by 5‐aza‐dC, indicating that 5‐aza‐dC may induce gene expression in a manner independent of DNA demethylation.
DFNA5 was originally identified as a gene involved in non‐syndromic hearing impairment( 34 ) but because DFNA5 lacks a distinct functional domain, little information about its physiological function in the ear is available. DFNA5 has also been identified as a gene downregulated in etoposide‐resistant melanoma,( 28 ) though its role in mediating the effects of etoposide remains unclear. Lage et al.( 29 ) showed that introduction of DFNA5 increased the susceptibility of tumor cells to etoposide by increasing their predisposition to apoptosis mediated by activated caspase‐3 following etoposide exposure. Perhaps therefore silencing DFNA5 enables gastric cancer cells to escape apoptosis induced by stimuli such as DNA damage, thereby providing them with a survival advantage. While we were preparing our manuscript, Masuda et al. reported that DFNA5 is one of the target genes of p53.( 35 ) That gastric cancer specimens showing methylation of DFNA5 also show infrequent mutation of p53 suggests that epigenetic inactivation of DFNA5 may lead to impaired p53 function in some tumors.
The molecular mechanism by which DNA methylation occurs during the course of tumorigenesis remains unknown, though several lines of evidence suggest that overexpression of DNMT1 is involved.( 36 , 37 ) But because overexpression of DNA methyltransferase 1 (DNMT)1 in cancer is not associated with expression of proliferating cell nuclear antigen (PCNA), it may simply not be correlated with cell proliferation. We previously reported that simultaneous methylation of multiple CGI occurs in a subset of cases that show CIMP.( 30 , 38 , 39 , 40 ) The molecular mechanism by which multiple genes are methylated concurrently in a subset of gastric cancers remains unknown. However, one factor known to affect CIMP is EBV, and our present findings are consistent with earlier reports indicating that EBV is associated with methylation of multiple genes in gastric cancer.( 30 , 36 ) Another important factor associated with aberrant methylation in gastric cancer is H. pylori infection. Maekita et al. recently reported that specific CGI are aberrantly methylated in H. pylori‐positive, non‐cancerous tissues.( 41 ) However, methylation of genes specifically methylated in cancer was not associated with H. pylori.( 30 , 42 ) Further study will be necessary to determine precisely how DNA methylation occurs in cancer.
In summary, we have identified DFNA5 as a target of epigenetic inactivation in gastric cancer. Its expression was frequently lost in gastric cancer cell lines and primary gastric cancers due to aberrant methylation of the region around its transcription start site. Moreover, introduction of DFNA5 into tumor cells suppressed their growth, suggesting that DFNA5 has tumor suppressor activity. Taken together, these findings suggest that DFNA5 may be a useful target for epigenetic therapy in gastric cancer.
Acknowledgments
The authors thank Dr William F. Goldman for editing the manuscript. This study was supported in part by Grants‐in‐Aid for Scientific Research on Priority Areas from the Ministry of Education, Culture, Sports, Science, and Technology (M. T., K. I. and T. T.).
References
- 1. Nardone G. Review article: molecular basis of gastric carcinogenesis. Aliment Pharmacol Ther 2003; 17 (Suppl. 2): 75–81. [DOI] [PubMed] [Google Scholar]
- 2. Nanus DM, Kelsen DP, Mentle IR, Altorki N, Albino AP. Infrequent point mutations of ras oncogenes in gastric cancers. Gastroenterology 1990; 98: 955–60. [DOI] [PubMed] [Google Scholar]
- 3. Strickler JG, Zheng J, Shu Q, Burgart LJ, Alberts SR, Shibata D. p53 mutations and microsatellite instability in sporadic gastric cancer: when guardians fail. Cancer Res 1994; 54: 4750–5. [PubMed] [Google Scholar]
- 4. Baylin SB, Ohm JE. Epigenetic gene silencing in cancer − a mechanism for early oncogenic pathway addiction? Nat Rev Cancer 2006; 6: 107–16. [DOI] [PubMed] [Google Scholar]
- 5. Toyota M, Issa JP. Epigenetic changes in solid and hematopoietic tumors. Semin Oncol 2005; 32: 521–30. [DOI] [PubMed] [Google Scholar]
- 6. Ushijima T, Okochi‐Takada E. Aberrant methylations in cancer cells: where do they come from? Cancer Sci 2005; 96: 206–11. [DOI] [PMC free article] [PubMed] [Google Scholar]
- 7. Satoh A, Toyota M, Itoh F et al. Epigenetic inactivation of CHFR and sensitivity to microtubule inhibitors in gastric cancer. Cancer Res 2003; 63: 8606–13. [PubMed] [Google Scholar]
- 8. Suzuki H, Itoh F, Toyota M, Kikuchi T, Kakiuchi H, Imai K. Inactivation of the 14‐3‐3 sigma gene is associated with 5′‐CpG island hypermethylation in human cancers. Cancer Res 2000; 60: 4353–7. [PubMed] [Google Scholar]
- 9. Wen XZ, Akiyama Y, Baylin SB, Yuasa Y. Frequent epigenetic silencing of the bone morphogenetic protein 2 gene through methylation in gastric carcinomas. Oncogene 2006; 25: 2666–73. [DOI] [PubMed] [Google Scholar]
- 10. Yoshiura K, Kanai Y, Ochiai A, Shimoyama Y, Sugimura T, Hirohashi S. Silencing of the E‐cadherin invasion‐suppressor gene by CpG methylation in human carcinomas. Proc Natl Acad Sci USA 1995; 92: 7416–19. [DOI] [PMC free article] [PubMed] [Google Scholar]
- 11. Li QL, Ito K, Sakakura C et al. Causal relationship between the loss of RUNX3 expression and gastric cancer. Cell 2002; 109: 113–24. [DOI] [PubMed] [Google Scholar]
- 12. Oshimo Y, Kuraoka K, Nakayama H et al. Epigenetic inactivation of SOCS‐1 by CpG island hypermethylation in human gastric carcinoma. Int J Cancer 2004; 112: 1003–9. [DOI] [PubMed] [Google Scholar]
- 13. Oshimo Y, Oue N, Mitani Y et al. Frequent epigenetic inactivation of RIZ1 by promoter hypermethylation in human gastric carcinoma. Int J Cancer 2004; 110: 212–18. [DOI] [PubMed] [Google Scholar]
- 14. Suzuki H, Gabrielson E, Chen W et al. A genomic screen for genes upregulated by demethylation and histone deacetylase inhibition in human colorectal cancer. Nat Genet 2002; 31: 141–9. [DOI] [PubMed] [Google Scholar]
- 15. Yamashita S, Tsujino Y, Moriguchi K, Tatematsu M, Ushijima T. Chemical genomic screening for methylation‐silenced genes in gastric cancer cell lines using 5‐aza‐2′‐deoxycytidine treatment and oligonucleotide microarray. Cancer Sci 2006; 97: 64–71. [DOI] [PMC free article] [PubMed] [Google Scholar]
- 16. Costello JF, Fruhwald MC, Smiraglia DJ et al. Aberrant CpG‐island methylation has non‐random and tumour‐type‐specific patterns. Nat Genet 2000; 24: 132–8. [DOI] [PubMed] [Google Scholar]
- 17. Liang G, Gonzalgo ML, Salem C, Jones PA. Identification of DNA methylation differences during tumorigenesis by methylation‐sensitive arbitrarily primed polymerase chain reaction. Methods 2002; 27: 150–5. [DOI] [PubMed] [Google Scholar]
- 18. Ushijima T, Morimura K, Hosoya Y et al. Establishment of methylation‐sensitive‐representational difference analysis and isolation of hypo‐ and hypermethylated genomic fragments in mouse liver tumors. Proc Natl Acad Sci USA 1997; 94: 2284–9. [DOI] [PMC free article] [PubMed] [Google Scholar]
- 19. Toyota M, Ho C, Ahuja N et al. Identification of differentially methylated sequences in colorectal cancer by methylated CpG island amplification. Cancer Res 1999; 59: 2307–12. [PubMed] [Google Scholar]
- 20. Imoto I, Izumi H, Yokoi S et al. Frequent silencing of the candidate tumor suppressor PCDH20 by epigenetic mechanism in non‐small‐cell lung cancers. Cancer Res 2006; 66: 4617–26. [DOI] [PubMed] [Google Scholar]
- 21. Obata T, Toyota M, Satoh A et al. Identification of HRK as a target of epigenetic inactivation in colorectal and gastric cancer. Clin Cancer Res 2003; 9: 6410–18. [PubMed] [Google Scholar]
- 22. Ueki T, Toyota M, Skinner H et al. Identification and characterization of differentially methylated CpG islands in pancreatic carcinoma. Cancer Res 2001; 61: 8540–6. [PubMed] [Google Scholar]
- 23. Yanagihara K, Ito A, Toge T, Numoto M. Antiproliferative effects of isoflavones on human cancer cell lines established from the gastrointestinal tract. Cancer Res 1993; 53: 5815–21. [PubMed] [Google Scholar]
- 24. Akino K, Toyota M, Suzuki H et al. The Ras effector RASSF2 is a novel tumor‐suppressor gene in human colorectal cancer. Gastroenterology 2005; 129: 156–69. [DOI] [PubMed] [Google Scholar]
- 25. Ueno M, Toyota M, Akino K et al. Aberrant methylation and histone deacetylation associated with silencing of SLC5A8 in gastric cancer. Tumour Biol 2004; 25: 134–40. [DOI] [PubMed] [Google Scholar]
- 26. Magdinier F, Wolffe AP. Selective association of the methyl‐CpG binding protein MBD2 with the silent p14/p16 locus in human neoplasia. Proc Natl Acad Sci USA 2001; 98: 4990–5. [DOI] [PMC free article] [PubMed] [Google Scholar]
- 27. Nakagawachi T, Soejima H, Urano T et al. Silencing effect of CpG island hypermethylation and histone modifications on O6‐methylguanine‐DNA methyltransferase (MGMT) gene expression in human cancer. Oncogene 2003; 22: 8835–44. [DOI] [PubMed] [Google Scholar]
- 28. Grottke C, Mantwill K, Dietel M, Schadendorf D, Lage H. Identification of differentially expressed genes in human melanoma cells with acquired resistance to various antineoplastic drugs. Int J Cancer 2000; 88: 535–46. [DOI] [PubMed] [Google Scholar]
- 29. Lage H, Helmbach H, Grottke C, Dietel M, Schadendorf D. DFNA5 (ICERE‐1) contributes to acquired etoposide resistance in melanoma cells. FEBS Lett 2001; 494: 54–9. [DOI] [PubMed] [Google Scholar]
- 30. Kusano M, Toyota M, Suzuki H et al. Genetic, epigenetic, and clinicopathologic features of gastric carcinomas with the CpG island methylator phenotype and an association with Epstein–Barr virus. Cancer 2006; 106: 1467–79. [DOI] [PubMed] [Google Scholar]
- 31. Endoh M, Tamura G, Honda T et al. RASSF2, a potential tumour suppressor, is silenced by CpG island hypermethylation in gastric cancer. Br J Cancer 2005; 93: 1395–9. [DOI] [PMC free article] [PubMed] [Google Scholar]
- 32. Satoh A, Toyota M, Itoh F et al. DNA methylation and histone deacetylation associated with silencing DAP kinase gene expression in colorectal and gastric cancers. Br J Cancer 2002; 86: 1817–23. [DOI] [PMC free article] [PubMed] [Google Scholar]
- 33. Toyota M, Ho C, Ohe‐Toyota M, Baylin SB, Issa JP. Inactivation of CACNA1G, a T‐type calcium channel gene, by aberrant methylation of its 5′‐CpG island in human tumors. Cancer Res 1999; 59: 4535–41. [PubMed] [Google Scholar]
- 34. Van Laer L, Huizing EH, Verstreken M et al. Nonsyndromic hearing impairment is associated with a mutation in DFNA5 . Nat Genet 1998; 20: 194–7. [DOI] [PubMed] [Google Scholar]
- 35. Masuda Y, Futamura M, Kamino H et al. The potential role of DFNA5, a hearing impairment gene, in p53‐mediated cellular response to DNA damage. J Hum Genet 2006; 51: 652–64. [DOI] [PubMed] [Google Scholar]
- 36. Etoh T, Kanai Y, Ushijima S et al. Increased DNA methyltransferase 1 (DNMT1) protein expression correlates significantly with poorer tumor differentiation and frequent DNA hypermethylation of multiple CpG islands in gastric cancers. Am J Pathol 2004; 164: 689–99. [DOI] [PMC free article] [PubMed] [Google Scholar]
- 37. Peng DF, Kanai Y, Sawada M et al. DNA methylation of multiple tumor‐related genes in association with overexpression of DNA methyltransferase 1 (DNMT1) during multistage carcinogenesis of the pancreas. Carcinogenesis 2006; 27: 1160–8. [DOI] [PubMed] [Google Scholar]
- 38. Issa JP, Shen L, Toyota M. CIMP, at last. Gastroenterology 2005; 129: 1121–4. [DOI] [PubMed] [Google Scholar]
- 39. Toyota M, Ahuja N, Ohe‐Toyota M, Herman JG, Baylin SB, Issa JP. CpG island methylator phenotype in colorectal cancer. Proc Natl Acad Sci USA 1999; 96: 8681–6. [DOI] [PMC free article] [PubMed] [Google Scholar]
- 40. Toyota M, Ahuja N, Suzuki H et al. Aberrant methylation in gastric cancer associated with the CpG island methylator phenotype. Cancer Res 1999; 59: 5438–42. [PubMed] [Google Scholar]
- 41. Maekita T, Nakazawa K, Mihara M et al. High levels of aberrant DNA methylation in Helicobacter pylori‐infected gastric mucosae and its possible association with gastric cancer risk. Clin Cancer Res 2006; 12: 989–95. [DOI] [PubMed] [Google Scholar]
- 42. Oue N, Mitani Y, Motoshita J et al. Accumulation of DNA methylation is associated with tumor stage in gastric cancer. Cancer 2006; 106: 1250–9. [DOI] [PubMed] [Google Scholar]