

Abstract
The transcriptional factor hypoxia‐inducible factor‐1 (HIF‐1) plays an important role in solid tumor cell growth and survival. Overexpression of HIF‐1α has been demonstrated in many human tumors and predicts a poor response to chemoradiotherapy. We examined the HIF‐1α‐induced survival pathways in human oral squamous cell carcinoma cell (OSCC) lines. The results showed that forced expression of HIF‐1α suppressed hypoxia‐induced apoptosis of OSCC lines by inhibiting cytochrome c release from mitochondria. Overexpression of HIF‐1α inhibited the generation of reactive oxygen species (ROS), elevation of intracellular Ca2+ concentration, reduction of mitochondrial membrane potential, and cytosolic accumulation of cytochrome c, which resulted in the inactivation of caspase‐9 and caspase‐3. In addition, antiapoptotic Bcl‐2 and Bcl‐XL levels were increased and pro‐apoptotic Bax and Bak levels were decreased in the HIF‐1α‐overexpressing OSCC line. Overexpression of HIF‐1α also increased the levels of phosphorylation of Akt and extracellular signal‐regulated kinases (ERK). These findings indicate that HIF‐1α prevents apoptotic cell death through two mechanisms, including inhibition of cytochrome c release and activation of Akt and ERK. (Cancer Sci 2005; 96: 394–402)
Abbreviations:
- [Ca2+]i
intracellular Ca2+ concentration
- DCFH‐DA
dichlorofluorescein diacetate
- DMEM, Dulbecco's modified Eagle's medium; ELISA
enzyme‐linked immunosorbent assay
- ERK
extracellular signal‐regulated kinase
- HIF‐1
hypoxia inducible factor‐1
- MAPK
mitogen‐activated protein kinase
- MEK
mitogen‐activated protein kinase kinase
- OSCC
oral squamous cell carcinoma cell
- PI3K
phosphatidylinositol 3‐kinase
- PMSF, phenylmethylsulfonyl fluoride pVHL
von Hippel Lindau protein
- ROS
reactive oxygen species
- VEGF
vascular endothelial growth factor
- Δψm
mitochondrial membrane potential.
The transcriptional factor hypoxia‐inducible factor‐1 (HIF‐1) is one of the key regulators of oxygen homeostasis. HIF‐1 is a heterodimer composed of HIF‐1α and HIF‐1β subunits, both belonging to the basic‐helix‐loop‐helix PER‐ARNT‐SIM family of transcriptional factors. HIF‐1β, an aryl hydrocarbon receptor nuclear translocator, is constitutively present in normoxic cells, whereas expression levels of HIF‐1α are dependent on intracellular oxygen concentration. Under normoxic conditions, HIF‐1α protein is rapidly degraded through the ubiquitin–proteasome pathway.( 1 , 2 ) Degradation of HIF‐1α is mediated by the ubiquitin E3 ligase complex, in which the von Hippel Lindau protein (pVHL) binds to the oxygen‐dependent degradation domain in the HIF‐1α subunits.( 3 , 4 ) However, under hypoxic conditions, HIF‐1α degradation is suppressed, and stabilized HIF‐1α activates the transcription of a repertoire of target genes such as glucose transporters, glycolytic enzymes and angiogenic factors.( 5 , 6 , 7 , 8 ) Solid tumors often have an insufficient blood supply because tumor cells grow faster than endothelial cells, so the newly formed vascular supply is frequently disorganized, which results in hypoxic regions in tumor tissues.( 9 , 10 , 11 ) HIF‐1α is therefore a resistive molecule against cancer therapy.
The transcriptional factor HIF‐1α is an important mediator in solid tumor development in vivo because of its promotion of angiogenesis and anaerobic metabolism and inhibition of apoptosis induction in tumor cells.( 12 , 13 , 14 ) In fact, overexpression of HIF‐1α protein coupled with a poor prognosis has been observed in human cancers.( 15 , 16 , 17 , 18 , 19 , 20 ) In addition, HIF‐1α inhibits the induction of apoptosis in tumor cells.( 21 , 22 )
Apoptosis is mediated by two distinct pathways: the mitochondrial apoptotic pathway and the death receptor (Fas‐FasL)‐mediated pathway. Decrease of the mitochondrial membrane potential (Δψm) and release of cytochrome c from mitochondria are important apoptotic processes and members of the Bcl‐2 family, including Bax, Bcl‐2 and Bcl‐XL, are critical in the regulation of the permeability of the mitochondrial outer membrane and Δψm.( 23 , 24 , 25 ) Decrease of Δψm is induced by an increase of intracellular Ca2+ levels ([Ca2+]i) and the generation of reactive oxygen species (ROS). However, there is evidence of a cytochrome c release pathway that is not associated with ROS. Released cytochrome c activates caspase‐9, which in turn activates the downstream executive caspase, caspase‐3.
Akt/protein kinase B, a major serine‐threonine kinase, phosphorylates various survival signaling molecules (including members of the Bcl‐2 family) and promotes cell survival. Akt‐induced phosphorylation of Bad promotes the sequestration of Bad by 14‐3‐3 proteins in the cytosol, resulting in the prevention of binding between Bad and Bcl‐2 and Bcl‐XL on the mitochondrial membrane.( 26 ) An antiapoptotic function of Akt at the postmitochondrial step has also been proposed.( 27 ) Akt directly phosphorylates and inactivates caspase‐9.( 28 ) When considered together, these studies suggest that in tumor cells, the Akt survival pathway is aberrantly activated, and increased antiapoptotic signals overcome the apoptotic signals of anticancer drugs, which results in the drug resistance of tumor cells.
To explore the role of HIF‐1α in tumor cell apoptosis, we examined the expression of HIF‐1α protein under normoxic and hypoxic conditions in human oral squamous cell carcinoma cell (OSCC) lines and overexpressed HIF‐1α in an OSCC line, that is, OSC‐4 cells. We show here that the inhibition of apoptosis by HIF‐1α is associated with both the inhibition of cytochrome c release from mitochondria and the activation of the Akt and ERK signal pathways.
Materials and Methods
Cell culture and treatments. Oral squamous cell carcinoma cell lines (OSC‐1 to ‐8) established from patients with oral cancer in our laboratory were cultured in DMEM medium supplemented with 10% fetal bovine serum, 10 mM glutamine, 100 units/mL penicillin and 100 µg/mL streptomycin.( 29 ) The direct DNA sequence analysis of exon 2 to 11 of the p53 gene revealed that OSC‐4 had one silent mutation and the other OSCC lines possessed at least one missense mutation. Under normoxic conditions (20% oxygen), OSCC were cultured at 37°C in a humidified 5% CO2/95% air atmosphere. Hypoxic conditions were produced by purging the incubator with 5% CO2/95% N2. Then, the incubator was sealed and maintained at 1% oxygen (hypoxic conditions) at 37°C. In some experiments, OSCC were cultured in the presence or absence of LY294002, an inhibitor of PI3K, and PD98059, an inhibitor of mitogen‐activated protein kinase kinase (MEK; Calbiochem, Darmstadt, Germany).
Plasmid construct and transfection. Full‐length human HIF‐1α cDNA was cloned into the pcDNA3.1/V5‐His TOPO expression vector (Invitrogen, San Diego, CA, USA). The fidelity of the construction vector was confirmed by sequencing. Transfection was performed with Trans IT polyamine (Pan Vera, Madison, WI, USA) 24 h after cell seeding. Stable transfectants were selected by culturing the cells in medium containing geneticin (200–400 µg/mL), and cell lines were developed individually from surviving colonies.
Analysis of apoptosis. Cells were trypsinized, washed once with complete medium, and stained with propidium iodide and fluorescein isothiocyanate (FITC)‐conjugated annexin V (Sigma, St. Louis, MO, USA) according to the manufacturer's instructions. The cells were then analyzed by a FACScan cytometer (using the CellQuest program; Becton Dickinson, San Jose, CA, USA). Caspase activity was blocked using the cell‐permeable irreversible caspase‐9 inhibitor Z‐LEHD‐FMK and caspase‐3 family inhibitor Z‐DEVD‐FMK (Trevigen, Gaithersburg, MD). Prior to treatment under hypoxic conditions, cells were preincubated for 1 h with 50 µM of each of the caspase inhibitors.
Intranucleosomal DNA fragmentation. DNA fragmentation was identified by a routine method using the Hoechst 33258 nuclear stain (Sigma).
Measurement of mitochondrial membrane potential (Δψm). The Δψm was measured with rhodamine 123 fluorescent dye (Molecular Probes, Eugene, OR, USA). At the end of the treatment, the culture medium was removed, and the cells were loaded with rhodamine 123 to a final concentration of 10 µM for 30 min. Cells were rinsed twice with phosphate‐buffered saline (PBS) and then analyzed by a FACScan cytometer.
Measurement of intracellular ROS generation. Intracellular ROS production was measured using a fluorescent dye, dichlorofluorescein diacetate (DCFH‐DA), which is converted to DCFH by esterases when it is taken up by cells. DCFH is reactive with ROS to give a new highly fluorescent compound, dichlorofluorescein, which can be analyzed by a FACScan cytometer. Treated cells were incubated with DCFH‐DA (10 µM) at 37°C for 1 h and the DCFH‐DA uptake was measured by a FACScan cytometer.
Analysis of intracellular Ca2+ concentration. Intracellular Ca2+ concentration ([Ca2+]i) was determined by using a fluorescent dye, Fluo‐3 AM (Molecular Probes). After the indicated treatments, cells were washed twice with PBS and incubated with 5 µM Fluo‐3 AM at 37°C for 30 min. Then the cells were washed and analyzed by using a FACScan cytometer.
Cellular fractionation. Cells were treated with 0.05% digitonin in isotonic sucrose buffer to collect the cytosol. The digitonin‐insoluble fraction was further extracted with 2% sodium dodecylsulfate (SDS) to collect the membrane‐bound organellar fraction.
Western blot analysis. Cells were solubilized with ice‐cold lysis buffer containing 1% Triton X‐100, 50 mM NaCl, 25 mM N‐2‐hydroxyethylpiperazine‐N′‐2‐ethanesulfonic acid (HEPES; pH 7.4), 1 mM ethylenediamine tetraacetic acid (EDTA), 1 mM ethyleneglycol‐bis(β‐aminoethyl ether)‐N,N,N′,N′‐tetraacetic acid (EGTA), 1 mM PMSF and 10 µg/mL leupeptin. Extracted proteins (50 µg per lane) were separated by sodium dodecyl sulfate‐polyacrylamide gel electrophoresis‐polyacrylamide gel electrophoresis (SDS‐PAGE) and transferred onto Immobilon‐P membrane (Immobilon, Millipore Corporation, Bedford, MA, USA). Blocking was performed in Tris‐buffered saline containing 5% skim milk powder and 0.1% Tween‐20. The membranes were probed with the following diluted antibodies: HIF‐1α (Transduction Laboratories, Lexington, KY, USA) at 1:500, Bax, Bak, Bcl‐2, Bcl‐XL, cytochrome c, phosphorylated (Thr‐202/Tyr‐204) p44/p42 MAP kinases, total p44/p42 MAP kinases and total Akt (Santa Cruz Biotechnology, Santa Cruz, CA, USA) at 1:1000 and phosphorylated (Ser‐473) Akt, caspase‐9 and caspase‐3 (Cell Signaling Technology, Beverly, MA, USA) at 1:1000 dilution. Detection was performed with an ECL system (Amersham, Piscataway, NJ, USA). Protein content was determined by using the Bradford method, with bovine serum albumin as the standard.
Measurement of caspase activity. Caspase activity was determined with a colorimetric caspase activity assay kit (Sigma). Briefly, the cell lysate was incubated with 50 µM Ac‐LEHD‐pNA, a caspase‐9 substrate, or Ac‐DEVD‐pNA, a caspase‐3 substrate for 1 h at 37°C. The amounts of released p‐nitroanilide were measured in a microtiter plate reader at a wavelength of 405 nm.
Vascular endothelial growth factor assay. Levels of vascular endothelial growth factor (VEGF) protein in the cell lysates were determined by ELISA using a commercial kit (R&D Systems, Minneapolis, MN, USA). Briefly, 200 µL of standards or cell lysate were added to the wells of a microplate that was precoated with a monoclonal antibody specific for VEGF and incubated for 2 h at room temperature. After washing away any unbound substances, an enzyme‐linked polyclonal antibody against VEGF conjugated to horseradish peroxidase was added to the wells and incubated for 2 h at room temperature. Following another wash, 200 µL of substrate solution was added to the wells and incubated for 30 min, and 50 µL of stop solution was added to stop color development. The optimal density of each well was determined using a microplate reader at 405 nm.
Immunoprecipitation. The interactions between 14‐3‐3 protein and Bad as well as between Bad, Bcl‐2 and Bcl‐XL were detected by immunoprecipitation. Briefly, cells were collected in ice‐cold lysis buffer. Aliquots of protein samples (100 µg) obtained from cell lysates were incubated with 2 µg of anti‐14‐3‐3 and anti‐Bad antibodies (Santa Cruz Biotechnology) at 4°C for 1 h. Immunoprecipitates were captured with 20 µL of protein A or protein G Sepharose beads (Amersham) overnight. The beads were then spun down and washed four times with lysis buffer. The complexes were eluted from the beads with 40 µL of SDS sample buffer, boiled for 3 min, and resolved by 12% sodium dodecyl sulfate–polyacrylamide gel electrophoresis (SDS‐PAGE).
Statistical analysis. Results are expressed as mean ± SEM. Differences were compared using the unpaired two‐tailed t‐test and P‐values of less than 0.05 were considered statistically significant.
Results
Expression of HIF‐1α and VEGF proteins under normoxic and hypoxic conditions. Of the examined human OSCC lines (OSC‐1 to ‐8), induction of HIF‐1α protein production following hypoxia was observed in OSC‐4, ‐5, ‐6, ‐7 and ‐8 cells (Fig. 1a). OSC‐5, ‐6 and ‐8 cells expressed high levels of HIF‐1α protein even in normoxic conditions. The HIF‐1α protein expression of OSC‐4 and ‐7 cells in normoxic conditions was only in trace amounts and expression levels were slightly increased in hypoxia. In the remaining cell lines, that is, OSC‐1, ‐2 and ‐3 cells, HIF‐1α protein expression was undetectable in both normoxia and hypoxia. In accordance with the expression levels of HIF‐1α protein, differential levels of VEGF expression were observed: OSC‐5, ‐6 and ‐8 cells expressed high levels of VEGF proteins, especially in hypoxia, and intermediate expression levels were observed in OSC‐4 and ‐7 cells. In OSC‐2 and ‐3 cells, VEGF protein levels were extremely low, even under hypoxic conditions (Fig. 1b).
Figure 1.
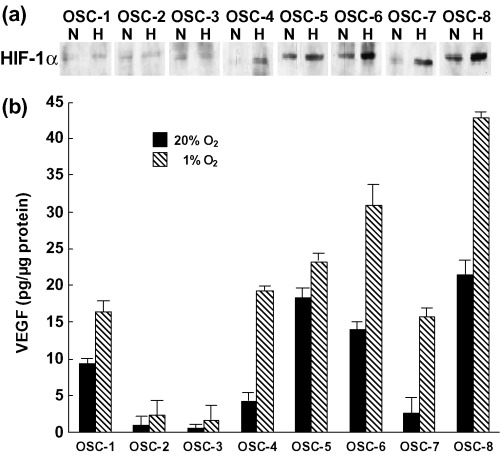
Expression of HIF‐1α and VEGF proteins in the cell lines examined. (a) Cells were cultured under normoxic (20% O2; N) and hypoxic (1% O2; H) conditions for 24 h, and whole cell extracts obtained from cells were subjected to western blot analysis for HIF‐1α protein expression. (b) VEGF protein levels in the whole cell lysates were determined using ELISA. The experiment was repeated three times and this is a representative example.
Effects of HIF‐1α overexpression on VEGF expression and hypoxia‐induced apoptosis. To explore the precise role of HIF‐1α in hypoxia‐induced apoptosis of OSCC lines, we transfected HIF‐1α expression vectors into OSC‐4 cells because the expression level of HIF‐1α in OSC‐4 cells was lower than the other OSCC lines and exposure of OSC‐4 cells to hypoxic conditions induced apoptosis efficiently. High levels of expression of HIF‐1α in the transfectants were confirmed under both normoxic and hypoxic conditions (Fig. 2a). When the HIF‐1α expression vector‐transfected cells were cultured in 1% O2 for 24 h, VEGF protein levels became higher, especially after exposure to hypoxia (Fig. 2b). HIF‐1α‐overexpressing cells were cultured under normoxic and hypoxic conditions, and analyzed by flow cytometry after annexin V/propidium iodide staining (Fig. 2c). Apoptotic cells were detected 6 h after hypoxic treatment and apoptotic cell numbers reached a maximal level after 24 h (data not shown). They were then stained with Hoechst 33258 fluorescent DNA‐binding dye, for the detection of highly condensed chromatin (Fig. 2d). We found that hypoxia treatment increased the number of apoptotic cells, whereas the hypoxic effects were inhibited in HIF‐1α‐transfected cells.
Figure 2.
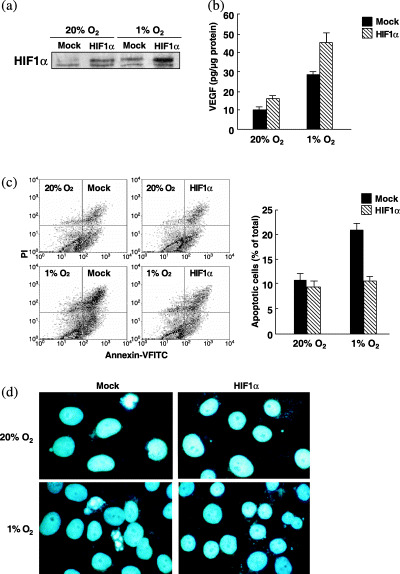
Effects of forced expression of HIF‐1α on apoptosis of OSC‐4 cells. OSC‐4 cells transfected with vector alone (mock) or HIF‐1α cDNA (HIF‐1α) were cultured under normoxic and hypoxic conditions for 24 h. (a) Whole cell extracts from the cells were subjected to western blot analysis for HIF‐1α protein expression. (b) ELISA for VEGF protein levels. (c) Apoptotic cell death was determined by flow cytometric analysis after cell incubation under normoxic and hypoxic conditions for 24 h. (d) DNA fragmentation. After incubation under normoxic and hypoxic conditions for 24 h, cells were stained with Hoechst 33258.
Influences of HIF‐1α overexpression on [Ca2+]i, generation of ROS and Δψm. The [Ca2+]i was enhanced by hypoxia treatment, but the induction of [Ca2+]i under hypoxic conditions was suppressed in HIF‐1α‐transfected cells (Fig. 3a). In accordance with the increase of [Ca2+]i in control cells, generation of ROS was also increased under hypoxic conditions, but the increase of ROS was suppressed in HIF‐1α‐transfected cells (Fig. 3b). As shown in Fig. 3c, the reduction of Δψm was observed in control cells after hypoxic treatment, but the reduction was suppressed in HIF‐1α‐transfected cells.
Figure 3.
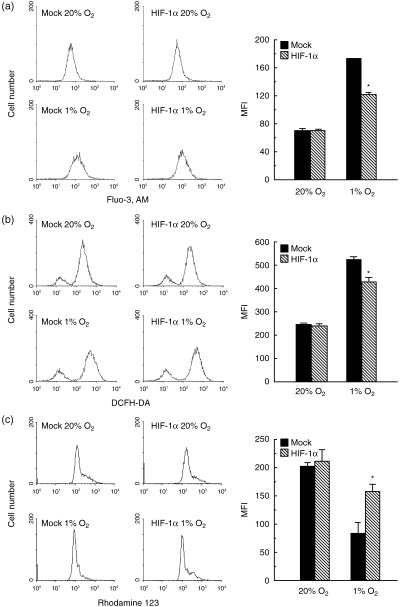
The [Ca2+]i, generation of ROS and Δψm in control cells and HIF‐1α‐overexpressing cells. Both cell types were cultured under normoxic and hypoxic conditions for 24 h. (a) [Ca2+]i was determined by the fluorescence obtained from Fluo‐3 AM using a FACScan cytometer. (b) ROS levels were measured using flow cytometry after loading cells with DCFH‐DA. (c) Δψm was measured by the relative fluorescence intensities of rhodamine‐123 using flow cytometry. The experiment was repeated three times and this is a representative example. Values are the mean ± SEM of determinations made in three independent cultures. *P < 0.05 compared with values for control cells (mock).
Influence of HIF‐1α overexpression on the levels of proteins of the Bcl‐2 family, cytochrome c release and caspase activity. We investigated the effects of hypoxia and HIF‐1α on the expression of Bcl‐2 family proteins and the release of cytochrome c in OSC‐4 cells. The expression of antiapoptotic proteins Bcl‐2 and Bcl‐XL was decreased and the expression of pro‐apoptotic proteins Bax and Bak was increased by hypoxia. In contrast with the effects of hypoxia, forced expression of HIF‐1α decreased Bax and Bak levels and increased Bcl‐2 and Bcl‐XL levels under both normoxic and hypoxic conditions. An increase in cytosolic cytochrome c levels was observed following exposure of cells to hypoxia for 24 h. In contrast, forced expression of HIF‐1α suppressed the release of cytochrome c into the cytosol (Fig. 4a,b).
Figure 4.
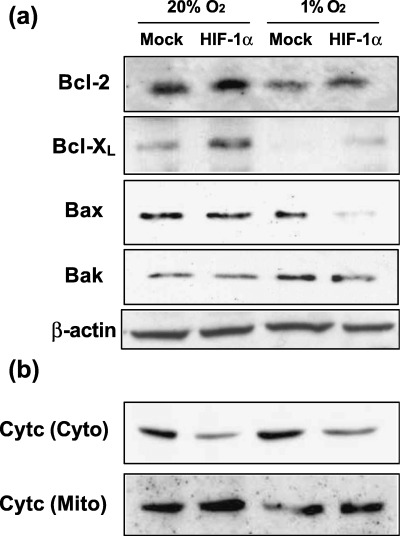
Effects of forced expression of HIF‐1α on the expression of Bcl‐2 family proteins and cytochrome c release. (a) Bcl‐2, Bcl‐XL, Bax and Bak protein levels in OSC‐4 cells after each indicated treatment were determined by western blots of total cell lysates. (b) Both cell types were cultured under normoxic and hypoxic conditions for 24 h and cytosolic and mitochondrial fractions were prepared for immunoblotting of cytochrome c. The experiment was repeated three times and this is a representative example.
The expression levels of cleaved caspase‐9 and ‐3 were low under normoxic conditions in both control and HIF‐1α‐transfected cells, but hypoxia induced the cleavage of both caspases in control cells, although the activation of these caspases was not induced in HIF‐1α‐transfected cells (Fig. 5a,b).
Figure 5.
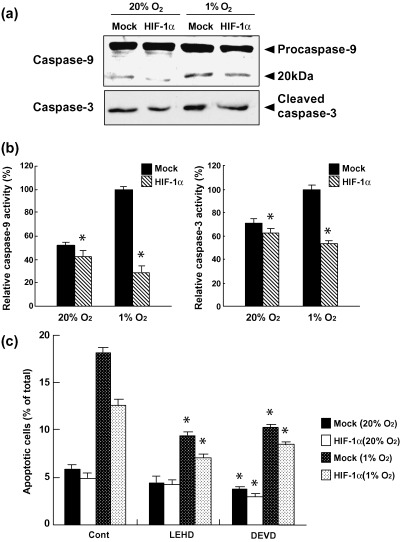
Effects of forced expression of HIF‐1α on the activation of caspase‐9 and ‐3. (a) Both cell types were cultured under normoxic and hypoxic conditions for 24 h, and cell lysates were prepared for immunoblotting of the processed and non‐processed caspase‐9 and ‐3. (b) Hydrolyzing activities of caspase‐9 and ‐3. Cell extracts obtained from cells after the indicated cultivation conditions were assessed for their ability to hydrolyze the peptides Ac‐LEHD‐pNA and Ac‐DEVD‐pNA. Values are the mean ± SEM of determinations made in three independent cultures. *P < 0.05 compared with values for control cells (mock). (c) Both cell types were pretreated with 50 µM caspase‐9 inhibitor Z‐LEHD‐FNK or caspase‐3 inhibitor Z‐DEVD‐FMK for 1 h, and cultured under normoxic and hypoxic conditions for 24 h. Apoptotic cell death was determined by flow cytometric analysis. The experiment was repeated three times and this is a representative example. Values are the mean ± SEM of determinations made in three independent cultures. *P < 0.05 compared with values for untreated cultures (control).
To confirm whether activation of caspases is essential for hypoxia‐induced apoptosis, inhibitors of caspase‐9 (Z‐LEHD‐FMK) and caspase‐3 (Z‐DEVD‐FMK) were used. As shown in Figure 5c, the inhibitors of caspase‐9 and ‐3 suppressed hypoxia‐induced apoptosis with a 48 and a 43% blockage in control cells, and a 44 and a 32% blockage in HIF‐1α‐transfected cells, respectively.
Influence of HIF‐1α overexpression on PI3K/Akt, ERK, phosphorylation of Bad and binding of Bad with 14‐3‐3, Bcl‐2 and Bcl‐XL. The induction of Akt phosphorylation was observed in HIF‐1α‐transfected cells. Phosphorylation of ERK was also increased in HIF‐1α‐transfected cells, although protein levels were not affected by HIF‐1α transfection (Fig. 6a). HIF‐1α overexpression induced Bad phosphorylation at Ser112 and Ser136 (Fig. 6b). In addition, hetero‐oligomerization of Bad with antiapoptotic Bcl‐2 and Bcl‐XL was suppressed in HIF‐1α‐transfected cells. However, hetero‐oligomerization of Bad with 14‐3‐3 was increased in HIF‐1α‐transfected cells (Fig. 6c).
Figure 6.
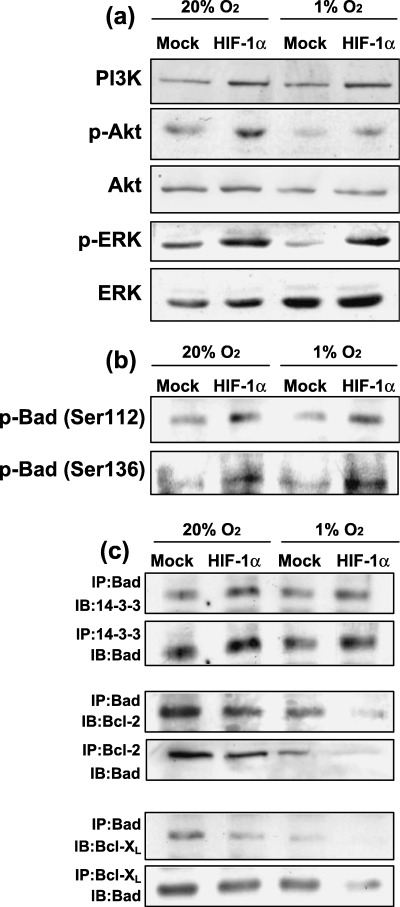
Effects of forced expression of HIF‐1α on the expression levels of PI3K, Akt and ERK and their phosphorylation levels. (a) Both cell types were cultured under normoxic and hypoxic conditions for 24 h. Cell lysates were then prepared and western blot analysis was performed to determine the levels of PI3K, Akt, p‐Akt (Ser473), total ERK1/2 and p‐ERK1/2. (b) Phosphorylation of Bad was determined by western blotting using antiphosphorylated Bad (Ser112 and Ser136) antibodies. (c) Hetero‐oligomerization between Bad, 14‐3‐3, Bcl‐2 and Bcl‐XL. Co‐immunoprecipitates were obtained using antibodies against each Bcl‐2 family protein and the obtained immunoprecipitates were blotted using each indicated antibody. The experiment was repeated three times and this is a representative example.
Effects of inhibitors against PI3K and MEK on hypoxia‐induced apoptosis. The levels of HIF‐1α increased under hypoxic conditions in control and HIF‐1α‐transfected cells in a time‐dependent manner. When cells were treated with PD98059 under hypoxic conditions, the increased HIF‐1α expression level was suppressed from 30 min to 6 h. Whereas LY294002 induced a biphasic effect on HIF‐1α expression in the cells depending on treatment time, LY294002 decreased HIF‐1α protein levels at 30 min, did not superficially affect protein expression levels at 2 h, and increased the levels at 6 h. Induction of phosphorylation of Akt and ERK was observed coincidently with the increased HIF‐1α protein expression in HIF‐1α‐transfected cells. Of these protein kinases, p‐Akt expression was suppressed by LY294002, but not affected by PD98052. However, p‐ERK expression was suppressed by PD98052 but increased by LY294002. When control and HIF‐1α‐transfected cells were cultured in the presence of these inhibitors and analyzed by flow cytometry after annexin V/propidium iodine staining, we found that hypoxic treatment increased the number of apoptotic cells, especially in the control cells, and hypoxia‐induced apoptosis of the HIF‐1α‐transfectants was suppressed in accordance with the results described in Fig. 2c,d. As described earlier, both LY294002 and PD98059 increased apoptosis in control and HIF‐1α‐transfected cells, but more prominent apoptosis was observed in cells treated with PD98059 (Fig. 7b).
Figure 7.
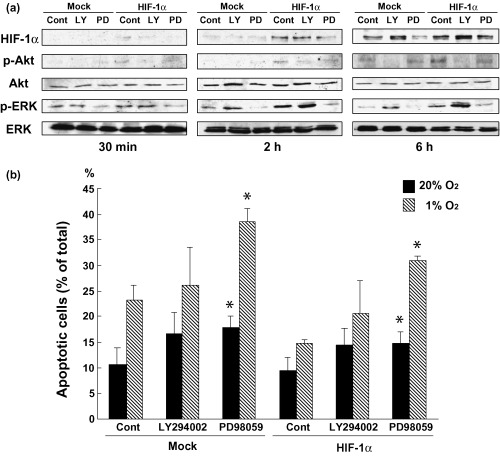
Effects of LY294002 and PD98059 on the expression of HIF‐1α, p‐Akt, Akt, p‐ERK, ERK and apoptosis. (a) The transfectants were pretreated with LY294002 (40 µM) and PD98059 (20 µM) for 30 min and cultured under normoxic and hypoxic conditions for 30 min to 6 h. Cell lysates were then prepared, and western blot analysis was performed. (b) Apoptotic cell death was analyzed by a FACScan cytometer after each treatment under normoxic and hypoxic conditions for 24 h. The experiment was repeated three times and this is a representative example. Values are the mean ± SEM of determinations made in three independent cultures. *P < 0.05 compared with values for untreated cultures (control).
Discussion
Cancer cells possess auto‐growth activities and they are more resistant to cell‐impairing stresses than normal non‐transformed cells. In their resistance, they utilize multiple defense systems against a variety of stresses, including hypoxia, cytotoxic cytokines, ultraviolet light, radiation and anticancer drugs. Among such stresses, hypoxia is a biologically inducible stress that induces apoptosis in most kinds of cells, including transformed cells. However, cancer cells are resistant to hypoxia and have the ability to remain alive under hypoxic conditions by inducing HIF‐1α expression. HIF‐1α plays a critical role as a key transcriptional factor in the survival of cells and, therefore, overexpression of HIF‐1α allows cells to resist stresses that usually induce apoptosis and cell impairment.
Many investigators have reported that overexpression of HIF‐1α in tumors is associated with a poor prognosis.( 15 , 16 , 17 , 18 , 19 , 20 ) In head and neck carcinomas, it has been reported that squamous cell carcinoma cells in tumor tissues overexpress HIF‐1α protein and that its overexpression is associated with the microvessel vascular density and VEGF expression.( 19 , 20 ) In the present study we found that some OSCC lines expressed HIF‐1α under normoxic conditions and that expression levels increased under hypoxic conditions. Furthermore, induction of apoptosis by hypoxia in HIF‐1α‐transfected cells was more difficult than in cell lines that did not overexpress HIF‐1α (Fig. 2c,d). We also ascertained that the enhanced expression of HIF‐1α in OSCC lines was associated with resistance to chemotherapeutic drugs and γ‐rays, and that the downregulation of HIF‐1α expression by siRNA enhanced the susceptibility of OSCC lines to chemotherapeutic drugs and γ‐rays (data not shown). These findings suggest that HIF‐1α overexpression confers resistance to apoptosis induced by hypoxia as well as cancer therapies. It is well known that the HIF‐1α protein induces the synthesis of pro‐angiogenic factors such as VEGF, endothelin‐1 and erythropoietin to adapt to hypoxia, which results in the neovascularization of tumor tissues.( 12 , 13 , 14 ) We occasionally observed that after chemoradiotherapy, surviving cells remained in the fibrous center portions of tongue tumors, where there is a poor concentration of blood vessels, which is indicative of low blood supply. Such a clinico‐histological finding appears to be explained by the overexpression of HIF‐1α in hypoxic cells in the center portion of the tumor.
Apoptotic signaling includes two main pathways: the Fas‐associated and cytochrome c‐associated pathways. In the latter, the released cytochrome c cleaves and activates Apaf‐1, and the activated signal streams down to caspase‐3 via caspase‐9.( 23 , 24 , 25 ) OSC‐4 cells cultured under hypoxic conditions induced an increase in [Ca2+]i and the generation of ROS with a reduction of Δψm, which resulted in the release of cytochrome c into the cytosol, although the expression of HIF‐1α was induced slightly. Meanwhile, the overexpression of HIF‐1α strongly prevented apoptosis of the cells, inhibiting the increase of Ca2+ levels and ROS. In addition, inhibitors of caspase‐9 (Z‐LEHD‐FMK) and caspase‐3 (Z‐LEHD‐FMK) blocked approximately 30–50% of hypoxia‐induced apoptosis in control and HIF‐1α‐transfected cells. These results suggest that the main signaling pathway associated with hypoxia‐induced apoptosis is the signal transduction involved in cytochrome c to caspase‐9, and apoptosis of squamous cell carcinoma cells can be induced even if HIF‐1α is induced by hypoxia, unless it is overexpressed.
Cytochrome c release is under the regulation of Bcl‐2 family proteins.( 23 , 24 , 25 ) The regulation of the expression of Bcl‐2 family proteins by HIF‐1α has, however, not yet been clarified in cancer cells. When OSC‐4 cells were cultured under hypoxic conditions for 24 h, pro‐apoptotic Bax and Bak levels increased and antiapoptotic Bcl‐2 and Bcl‐XL levels decreased. HIF‐1α‐overexpressing OSC‐4 cells revealed activated survival signaling with the suppression of Bax and Bak expression and upregulation of the expression of Bcl‐2 and Bcl‐XL, indicating that HIF‐1α regulates the expression of both pro‐ and antiapoptotic Bcl‐2 proteins. There are reports that genes for Bcl‐2/adenovirus E1B 19‐kDa‐interacting protein‐3 (BNIP3), a cell death factor belonging to the pro‐apoptotic Bcl‐2 proteins, and its homolog, NIP‐3‐like protein (NIX) are the targets for HIF‐1α.( 30 , 31 ) Regulation of Bcl‐2 family proteins by HIF‐1α is possible in the selection of cells that are resistant to death signals and in anticancer therapy, but details of the regulation process remain to be clarified.
Protein levels are regulated by a variety of systems. One of the systems involves regulation by the ubiquitin–proteasome pathway. Bcl‐2 family proteins are also under the regulation of this system, and degradation of Bcl‐2 family proteins by ubiquitins is influenced by their phosphorylation. For example, phosphorylation of Bad on serine residue 136 by PKB/Akt causes its sequestration by the 14‐3‐3 protein.( 26 ) Phosphorylation of Bcl‐2 family proteins is promoted by a variety of kinases, including PKB/Akt, PI3K and mitogen‐activated protein kinase (MAPK). Hetero‐dimerization of Bad with Bcl‐2 and Bcl‐XL was increased in HIF‐1α‐overexpressing cells, indicating that HIF‐1α overexpression induces a survival pathway that is associated with the PI3K/Akt activation and inactivation of Bad. This mechanism is probably involved in the suppression of apoptosis by HIF‐1α overexpression.
With regard to these pathways, the present study revealed that PI3K/Akt and MAPK pathways were also essential for the antiapoptotic signal in HIF‐1α‐overexpressing cells (Fig. 7b). It has already been reported that VEGF, upon binding to its receptor, leads to the activation of various signaling molecules, including PI3K/Akt and MAPK.( 32 , 33 ) Therefore, HIF‐1α‐induced VEGF was probably involved in the activation of these molecules in the present study. The fact that PI3K/Akt and MAPK induce HIF‐1α is well known.( 34 , 35 , 36 , 37 , 38 , 39 , 40 , 41 ) Therefore, both streams from PI3K/Akt, MAPK to HIF‐1α and from HIF‐1α to PI3K/Akt, MAPK appear to exist, at least in squamous cell carcinoma cells.
Our present study revealed that HIF‐1α expression increased in a time‐dependent manner in not only HIF‐transfected cells but also in control cells, and the increase of HIF‐1α expression coincided with increases in the expression of p‐Akt and p‐ERK (Fig. 7a). Under hypoxic conditions, the MAPK inhibitor PD98059 suppressed HIF‐1α expression in control cells as well as in HIF‐1α‐transfected cells. It is well known that phosphorylation of HIF‐1α is essential for the enhanced transcription activity of HIF‐1α under hypoxic conditions, and that activation of ERK1/2 is required for the phosphorylation of HIF‐1α. The mechanism of activation of HIF‐1α appears to support our present results. However, the PI3K inhibitor LY294002 suppressed the expression levels of HIF‐1α at 30 min and, conversely, upregulated these levels at 6 h. The mechanisms of the biphasic effects of LY294002 could not be clearly analyzed, but it has been reported that the PI3K/Akt pathway does not necessarily need to be activated in all cell types, but depends on the type of cell,( 37 , 38 , 39 , 40 ) and that a short‐term cultivation in hypoxia increases HIF‐1α expression, which depends on an active PI3K/Akt pathway; but a long‐term cultivation of cells in hypoxia suppresses HIF‐1α expression through inactivation of Akt and activation of GSK3β.( 41 ) These reports appear to explain the biphasic influence of LY294002 on HIF‐1α expression. PD98059 and LY294002 revealed different effects on the expression of p‐Akt and p‐ERK; that is, PD98059 strongly suppressed the expression of p‐ERK as well as HIF‐1α, but did not change p‐Akt expression levels. However, LY294002 decreased p‐Akt expression levels, but increased p‐ERK expression levels (Fig. 7a). These effects of the kinase inhibitors are complex, but the present result appears to indicate that cross‐talk between Akt and MAPK signaling pathways( 42 ) is probably involved in the inhibitory effects of apoptosis induced by HIF‐1α overexpression. In another respect, the expression levels of HIF‐1α coincided with those of p‐ERK in the presence of PD98059 and LY294002, and apoptosis was strongly induced when p‐ERK was suppressed by the MAPK inhibitor. However, the expression levels of p‐Akt were not correlated with apoptosis. These results suggest that HIF‐1α and ERK play a crucial role in the inhibition of apoptosis in squamous cell carcinoma cells.
It is unknown whether HIF‐1α directly induces the expression of p‐ERK and p‐Akt, or if both phosphorylated kinases were increased by hypoxia itself without association with HIF‐1α. In addition, there is a possibility that the activation of ERK and Akt was mediated by the cytokines that were increasingly generated from the HIF‐1α‐transfected cells under hypoxic conditions. It has already been reported that PI3K/Akt activation by HIF‐1α was mediated by VEGF.( 32 ) Other growth factors, such as IGF‐1 and EGF, may also be associated with the activation of ERK and Akt. In addition to these findings, a further detailed analysis is required to resolve the mechanisms of HIF‐1α‐associated suppression of apoptosis in squamous cell carcinoma cells.
References
- 1. Wang GL, Jiang BH, Rue EA, Semenza GL. Hypoxia‐inducible factor 1 is a basic‐helix‐loop‐helix‐PAS heterodimer regulated by cellular O2 tension. Proc Natl Acad Sci USA 1995; 92: 5510–4. [DOI] [PMC free article] [PubMed] [Google Scholar]
- 2. Salceda S, Caro J. Hypoxia‐inducible factor‐1α (HIF‐1α) protein is rapidly degraded by the ubiquitin‐proteasome system under normoxic conditions. J Biol Chem 1997; 272: 22642–7. [DOI] [PubMed] [Google Scholar]
- 3. Huang LE, Gu J, Schau M, Bunn HF. Regulation of hypoxia‐inducible factor 1α is mediated by an O2‐dependent degradation domain via the ubiquitin‐proteasome pathway. Proc Natl Acad Sci USA 1998; 95: 7987–92. [DOI] [PMC free article] [PubMed] [Google Scholar]
- 4. Sutter CH, Laughner E, Semenza GL. Hypoxia‐inducible factor 1α protein expression is controlled by oxygen‐regulated ubiquitination that is disrupted by deletions and missense mutations. Proc Natl Acad Sci USA 2000; 97: 4748–53. [DOI] [PMC free article] [PubMed] [Google Scholar]
- 5. Guillemin K, Krasnow MA. The hypoxic response: huffing HIFing. Cell 1997; 89: 9–12. [DOI] [PubMed] [Google Scholar]
- 6. Blancher C, Harris AL. The molecular basis of the hypoxia response pathway: tumor hypoxia as a therapy target. Cancer Metastasis Rev 1998; 17: 187–94. [DOI] [PubMed] [Google Scholar]
- 7. Dang CV, Semenza GL. Oncogenic alterations of metabolism. Trends Biochem Sci 1999; 24: 68–72. [DOI] [PubMed] [Google Scholar]
- 8. Semenza GL. Expression of hypoxia‐inducible factor 1: mechanisms and consequences. Biochem Pharmacol 2000; 59: 47–53. [DOI] [PubMed] [Google Scholar]
- 9. Vaupel P, Kallinowski F, Okunieff P. Blood flow, oxygen and nutrient supply, and metabolic microenvironment of human tumors: a review. Cancer Res 1989; 49: 6449–65. [PubMed] [Google Scholar]
- 10. Dachs GU, Patterson AV, Firth JD et al. Targeting gene expression to hypoxic tumor cells. Nat Med 1997; 3: 515–20. [DOI] [PubMed] [Google Scholar]
- 11. Richard DE, Berra E, Pouyssegur J. Angiogenesis: how a tumor adapts to hypoxia. Biochem Biophys Res Commun 1999; 266: 718–22. [DOI] [PubMed] [Google Scholar]
- 12. Maxwell PH, Dachs GU, Gleadle JM et al. Hypoxia‐inducible factor‐1 modulates gene expression in solid tumors and influences both angiogenesis and tumor growth. Proc Natl Acad Sci USA 1997; 94: 8104–9. [DOI] [PMC free article] [PubMed] [Google Scholar]
- 13. Ryan HE, Poloni M, McNulty W et al. Hypoxia‐inducible factor‐1α is a positive factor in solid tumor growth. Cancer Res 2000; 60: 4010–5. [PubMed] [Google Scholar]
- 14. Hockel M, Vaupel P. Biological consequences of tumor hypoxia. Semin Oncol 2001; 28: 36–41. [PubMed] [Google Scholar]
- 15. Zhong H, De Marzo AM, Laughner E et al. Overexpression of hypoxia‐inducible factor 1α in common human cancers and their metastases. Cancer Res 1999; 59: 5830–5. [PubMed] [Google Scholar]
- 16. Talks KL, Turley H, Gatter KC et al. The expression and distribution of the hypoxia‐inducible factors HIF‐1α and HIF‐2α in normal human tissues, cancers, and tumor‐associated macrophages. Am J Pathol 2000; 157: 411–21. [DOI] [PMC free article] [PubMed] [Google Scholar]
- 17. Birner P, Schindl M, Obermair A, Plank C, Breitenecker G, Oberhuber G. Overexpression of hypoxia‐inducible factor 1α is a marker for an unfavorable prognosis in early‐stage invasive cervical cancer. Cancer Res 2000; 60: 4693–6. [PubMed] [Google Scholar]
- 18. Aebersold DM, Burri P, Beer KT et al. Expression of hypoxia‐inducible factor‐1α: a novel predictive and prognostic parameter in the radiotherapy of oropharyngeal cancer. Cancer Res 2001; 61: 2911–6. [PubMed] [Google Scholar]
- 19. Koukourakis MI, Giatromanolaki A, Sivridis E et al. Hypoxia inducible factor (HIF‐1α and HIF‐2α), angiogenesis, and chemoradiotherapy outcome of squamous cell head‐and‐neck cancer. Int J Radiat Oncol Biol Phys 2002; 53: 1192–202. [DOI] [PubMed] [Google Scholar]
- 20. Beasley NJ, Leek R, Alam M et al. Hypoxia‐inducible factors HIF‐1α and HIF‐2α in head and neck cancer: relationship to tumor biology and treatment outcome in surgically resected patients. Cancer Res 2002; 62: 2493–7. [PubMed] [Google Scholar]
- 21. Piret JP, Lecocq C, Toffoli S, Ninane N, Raes M, Michiels C. Hypoxia and CoCl2 protect HepG2 cells against serum deprivation‐ and t‐BHP‐induced apoptosis: a possible anti‐apoptotic role for HIF‐1. Exp Cell Res 2004; 295: 340–9. [DOI] [PubMed] [Google Scholar]
- 22. Erler JT, Cawthorne CJ, Williams KJ et al. Hypoxia‐mediated down‐regulation of Bid and Bax in tumors occurs via hypoxia‐inducible factor 1‐dependent and ‐independent mechanisms and contributes to drug resistance. Mol Cell Biol 2004; 24: 2875–89. [DOI] [PMC free article] [PubMed] [Google Scholar]
- 23. Kuwana T, Newmeyer DD. Bcl‐2‐family proteins and the role of mitochondria in apoptosis. Curr Opin Cell Biol 2003; 15: 691–9. [DOI] [PubMed] [Google Scholar]
- 24. Sharpe JC, Arnoult D, Youle RJ. Control of mitochondrial permeability by Bcl‐2 family members. Biochem Biophys Acta 2004; 1644: 107–13. [DOI] [PubMed] [Google Scholar]
- 25. Festjens N, Van Gurp M, Van Loo G, Saelens X, Vandenabeele P. Bcl‐2 family members as sentinels of cellular integrity and role of mitochondrial intermembrane space proteins in apoptotic cell death. Acta Haematol 2004; 111: 7–27. [DOI] [PubMed] [Google Scholar]
- 26. Detta SR, Dudek H, Tao X et al. Akt phosphorylation of BAD couples survival signals to the cell‐intrinsic death machinery. Cell 1997; 91: 231–41. [DOI] [PubMed] [Google Scholar]
- 27. Zhou H, Li XM, Meinkoth J, Pittman RN. Akt regulates cell survival and apoptosis at a postmitochondial level. J Cell Biol 2000; 151: 483–94. [DOI] [PMC free article] [PubMed] [Google Scholar]
- 28. Cardone MH, Roy N, Stennicke HR et al. Regulation of cell death protease caspase‐9 by phosphorylation. Science 1998; 282: 1318–21. [DOI] [PubMed] [Google Scholar]
- 29. Yoneda K, Yamamoto T, Osaki T. p53‐ and p21‐independent apoptosis of squamous cell carcinoma cells induced by 5‐fluorouracil and radiation. Oral Oncol 1998; 34: 529–37. [DOI] [PubMed] [Google Scholar]
- 30. Bruick RK. Expression of the gene encoding the proapoptotic Nip3 protein is induced by hypoxia. Proc Natl Acad Sci USA 2000; 97: 9082–7. [DOI] [PMC free article] [PubMed] [Google Scholar]
- 31. Sowter HM, Ratcliffe PJ, Watson P, Greenberg AH, Harris AL. HIF‐1‐dependent regulation of hypoxic induction of the cell death factors BNIP3 and NIX in human tumors. Cancer Res 2001; 61: 6669–73. [PubMed] [Google Scholar]
- 32. Thakker GD, Hajjar DP, Muller WA, Rosengart TK. The role of phosphatidylinositol 3‐kinase in vascular endothelial growth factor signaling. J Biol Chem 1999; 274: 10002 7. [DOI] [PubMed] [Google Scholar]
- 33. Kroll J, Waltenberger J. The vascular endothelial growth factor receptor KDR activates multiple signal transduction pathways in porcine aortic endothelial cells. J Biol Chem 1997; 272: 32521–7. [DOI] [PubMed] [Google Scholar]
- 34. Minet E, Arnould T, Michel G et al. ERK activation upon hypoxia: involvement in HIF‐1 activation. FEBS Lett 2000; 468: 53–8. [DOI] [PubMed] [Google Scholar]
- 35. Minet E, Michel G, Mottet D, Raes M, Michiels C. Transduction pathways involved in Hypoxia‐Inducible Factor‐1 phosphorylation and activation. Free Radic Biol Med 2001; 31: 847–55. [DOI] [PubMed] [Google Scholar]
- 36. Mottet D, Michel G, Renard P, Ninane N, Raes M, Michiels C. Role of ERK and calcium in the hypoxia‐induced activation of HIF‐1. J Cell Physiol 2003; 194: 30–44. [DOI] [PubMed] [Google Scholar]
- 37. Zhong H, Chiles K, Feldser D et al. Modulation of hypoxia‐inducible factor 1α expression by the epidermal growth factor/phosphatidylinositol 3‐kinase/PTEN/AKT/FRAP pathway in human prostate cancer cells. Implications for tumor angiogenesis and therapeutics. Cancer Res 2000; 60: 1541–5. [PubMed] [Google Scholar]
- 38. Jiang BH, Jiang G, Zheng JZ, Lu Z, Hunter T, Vogt PK. Phosphatidylinositol 3‐kinase signaling controls levels of hypoxia‐inducible factor 1. Cell Growth Differ 2001; 12: 363–9. [PubMed] [Google Scholar]
- 39. Alvarez‐Tejado M, Alfranca A, Aragones J, Vara A, Landazuri MO, Del Peso L. Lack of evidence for the involvement of the phosphoinositide 3‐kinase/Akt pathway in the activation of hypoxia‐inducible factors by low oxygen tension. J Biol Chem 2002; 277: 13508–17. [DOI] [PubMed] [Google Scholar]
- 40. Arsham AM, Plas DR, Thompson CB, Simon MC. Phosphatidylinositol 3‐kinase/Akt signaling is neither required for hypoxic stabilization of HIF‐1 α nor sufficient for HIF‐1‐dependent target gene transcription. J Biol Chem 2002; 277: 15162–70. [DOI] [PubMed] [Google Scholar]
- 41. Mottet D, Dumont V, Deccache Y et al. Regulation of hypoxia‐inducible factor‐1α protein level during hypoxic conditions by the phosphatidylinositol 3‐kinase/Akt/glycogen synthase kinase 3β pathway in HepG2 cells. J Biol Chem 2003; 278: 31277–85. [DOI] [PubMed] [Google Scholar]
- 42. Porter AC, Vaillancourt RR. Tyrosine kinase receptor‐activated signal transduction pathways which lead to oncogenesis. Oncogene 1998; 17: 1343–52. [DOI] [PubMed] [Google Scholar]