

Abstract
Methylene blue (MB) is a widely studied agent currently under investigation for its properties relating to photodynamic therapy (PDT). Recent studies have demonstrated that MB exhibits profound phototoxicity affecting a variety of tumor cell lines. However, the mechanistic explanation for methylene‐blue‐mediated photodynamic therapy (MB‐PDT) in the context of melanoma therapy is still obscure. In the present study, B16F1 melanoma cells were treated by MB‐PDT under different conditions, and thereafter subjected to cell viability detection assays. MB‐PDT could induce intense apoptotic cell death through a series of steps beginning with the photochemical generation of reactive oxygen species that activate the caspase‐9/caspase‐3 apoptosis pathway. Blocking activation of caspase‐3 and induction of oxidative stress by caspase inhibitor and by glutathione, respectively, markedly reduced apoptotic cell death in vitro. Importantly, proteomics study defining altered protein expression in treated cells suggests the involvement of several mitochondrial proteins playing important roles in electron transfer chain, implying mitochondrial dysfunction during the treatment. Furthermore, a transplantable mouse melanoma model was utilized to estimate the effectiveness of MB‐PDT in vivo. The treated mice displayed decreased tumor size and prolonged survival days, which was associated with enhanced apoptotic cell death. These results, offering solid evidence of the induction of mitochondria‐related apoptosis in tumor cells, reveal new aspects of MB‐PDT having potential to be a palliative treatment of melanoma. (Cancer Sci 2008; 99: 2019–2027)
Abbreviations:
- MB
methylene blue
- PDT
photodynamic therapy
- MB‐PDT
methylene blue‐mediated photodynamic therapy
- ROS
reactive oxygen species
- DHR
dihydrorhodamine
- GSH
glutathione
- Δψ m,
mitochondrial membrane potential
- COQ9
ubiquinone biosynthesis protein COQ9
- GST‐piA
glutathione S‐transferase P 2
- GRP78
78 kDa glucose‐regulated protein precursor
- HSP86
heat shock protein 90‐alpha
- TRAP1
heat shock protein 75 kDa
- Complex I‐49 kDa
NADH:ubiquinone oxidoreductase 49 kDa subunit
Photodynamic therapy (PDT) involves the systemic or local administration of a tumor‐localizing photosensitizer followed by irradiation of the targeted lesion with light of the appropriate wavelength. This multistep procedure initiates a complex photochemical reaction to generate reactive oxygen species (ROS). The cytotoxic products generated by PDT trigger a cascade of molecular events that lead to apoptosis and/or necrosis of cells responsible for tumor destruction.( 1 , 2 ) Therefore PDT is considered to be a promising technology approved as an alternative treatment for a diverse array of cancers, such as cervical cancer, oesophageal cancer, head and neck cancer and skin malignancies.( 3 , 4 )
Melanoma is a cancer developing from malignant transformation of melanocytes, the pigment‐producing cells that are found predominantly in the skin.( 5 ) It is worth noting that melanocytes originating from highly motile cells have enhanced survival properties and are relatively resistant to drug‐induced apoptosis and chemotherapy.( 6 , 7 ) Previous studies have investigated the application of PDT with several photosensitizers, such as lutetium texaphyrin,( 8 ) chlorin e6,( 9 ) and 5‐aminolaevulinic acid,( 10 ) to induce cell death of melanocytes in vivo and in vitro. Although initial treatment responses after PDT are routinely positive; the difficulty in achieving good light excitation of these sensitizers and ethical considerations concerning the aggressiveness of the disease hinder the development of the application of PDT for treating melanomas.
Methylene blue (MB), from the phenothiazinium family, is a photosensitizer which has excellent photochemical properties. MB is well known to have a high quantum yield of intersystem crossing and singlet oxygen (1O2) generation, and can produce radical species in the presence of reducing agents.( 11 , 12 ) Importantly, MB possesses exceptional affinity to melanocyte‐produced melanin, which contributes to selective absorption of this compound by cutaneous melanomas.( 13 ) Compared with other photosensitizers, MB showed enhanced penetration efficiency into melanoma cells. It has been reported that PDT with methylene blue derivative localized in mitochondrial membranes induced apoptotic cell death by causing mitochondrial dysfunction.( 14 , 15 ) Indeed, previous studies have documented that methylene‐blue‐mediated photodynamic therapy (MB‐PDT) showed improved photodynamic action against melanoma in cell cultures and, efficiently treated relatively large melanoma lesions not eligible for surgery.( 16 ) Moreover, recent published data have implicated mitochondria in the process of MB‐PDT‐induced tumor regression, because MB is likely to bind to the negative electrochemical environment of the mitochondrial matrix.( 11 )
Based on these findings, we hypothesized that MB‐PDT will induce mitochondrial dysfunction by causing oxidative stress. This should lead to the initiation of apoptotic cascade in tumor cells, and thereby suppress tumor growth. To test our hypothesis, both cell culture and animal model were used to elucidate the molecular events happened during the treatment, while proteomics study was employed to identify altered proteins.
Materials and Methods
Reagents. The photosensitizer MB used for PDT was acquired from Aldrich (Milwaukee, WI, USA). The pancaspase inhibitor (benzyloxycarbonyl‐Val‐Ala‐Asp, Z‐VAD‐FMK) and the caspase‐3 inhibitor (Z‐DEVD‐FMK) were from Calbiochem. Unless otherwise indicated, other reagents were obtained from Sigma.
Cell culture and tumor model. B16F1 cells (Shanghai Institutes for Biological Sciences, Chinese Academy of Sciences, Shanghai, China), were seeded at 5 × 10⁴ cells/mL in phenol red free Dulbecco's Modified Eagle's Medium supplemented with 10% fetal calf serum (FCS), 100 units/mL Penicillin and 100 units/mL streptomycin. C57BL6 mice were maintained in a specific pathogen free (SPF) animal facility at the department of Laboratory of Animals. B16F1 cells (5 × 10⁶) were injected subcutaneously in the dorsal position of the mice. Tumors were used for PDT treatment one week after inoculation when reaching the size 0.625 cm3.
In vitro and in vivo treatment protocols. For in vitro treatments, cells were seeded in Petri dishes. Photosensitization experiments were done after 24 h when cells were grown to 80–90% confluence. Briefly, B16F1 cells were incubated in the dark in serum‐free medium containing different doses of MB (ranging from 0 to 20 µM) for 1 h at 37°C. This medium was then removed and replaced with fresh complete mudium. Then the cells were irradiated with 650‐nm light produced by a dye laser (Red Diode Laser, Tianjin GangDong Technical Co., China). After the indicated time, cells were collected and subjected to assays. Cell viability was measured by the 3‐(4,5‐dimethylthiazol‐2‐yl)‐2,5‐diphenyl tetrazolium bromide (MTT) assay and Annexin V‐FITC/PI flow cytometry as described.( 10 ) In vivo PDT treatment of melanomas involved an i.v. injection of MB (50 mg/kg) followed 24 h later with tumor irradiation. A light dose rate of 50 mW/cm2 and a total light dose of 100 J/cm2 were used for in vivo PDT treatments. MB injection and irradiation were performed once a week for 3 weeks. Tumor size was determined every other day until the mice died. The length (l) and the width (w) of tumor were measured with a digimatic calliper (Mitutoyo). From these dimensions, the tumor volume (v) (mm3) was calculated using the formula: v = 0.5 × l × w2. Animal welfare in experimental procedures was strictly maintained in accordance with the guide for the care and use of laboratory animals, and the related ethical regulations of Nanjing University.
Western blot. The following antibodies were used for Western blot analysis, including anti‐cleaved caspase‐9, anti‐caspase‐8, and anti‐cytochrome c, anti‐cleaved caspase‐3, anti‐poly (ADP‐ribose) polymerase (PARP), and anti‐β‐actin (Cell Signaling Technology). Subcellular fractionation (cytosolic versus mitochondrial) of samples was prepared according to the instruction manual of Mitochondrial Fractionation Kit (Active Motif, Carlsbad, CA, USA). In brief, cells were harvested, washed twice with ice‐cold PBS, resuspended in ice‐cold cytosolic buffer, and then incubated on ice for 15 min. The cells were homogenized on ice using 30 strokes with the homogenizer, and the nuclei and intact cells were removed by centrifugation at 2000 × g for 10 min at 4°C. The supernatant was further spun at 10 000 × g for 20 min at 4°C to separate the cytosolic fraction from contaminating with mitochondrial. The supernatant was centrifuged at 16 000 × g for 20 min at 4°C to remove any residual mitochondria. In some experiments, whole‐cell samples were also included. The concentration of samples was determined by the Bradford method to ensure equal sample loading as described before.( 17 ) Then the proteins were separated by sodium dodecyl sulfate–polyacrylamide gel electrophoresis (SDS‐PAGE) and electrophoretically transferred to polyvinylidene fluoride (PVDF) membranes (Amersham Biosciences). After being blocked for 4 h, the membranes were incubated with antibodies overnight at 4°C, and then with horseradish peroxidase‐labeled immunoglobulin G (IgG; Zymed Laboratories) for 2 h. The blots were visualized with an enhanced chemiluminescent method kit (Sino‐American Biotechnology, PR China).
Mitochondrial membrane potential (Δψ m ) assay. To assess the mitochondrial membrane potential (Δψm ) by the green‐fluorescent lipophilic cationic dye DiOC6 (Molecular Probes), the cells were seeded in 6‐well plates. At 1 h after treated by MB‐PDT (20 µM), the cells were applied with 40 nM DiOC6 dye (dissolved in Me2SO and diluted with complete medium) at 37°C for 30 min. The stained cells were then washed twice with phosphate‐buffered saline, harvested and analyzed by flow cytometry using a FACSCalibur (Becton Dickinson).
Determination of intracellular ROS. The generation of intracellular ROS was detected by using the fluorescence probe dihydrorhodamine 123 (DHR, Marker Gene). Cells were plated in a 96‐well plate (1 × 10⁵ cells/well). After 24 h when cells were grown to 80–90% confluence, they were loaded with DHR (final concentration 5 µM). The cells were incubated at 37°C for 20 min followed by in vitro PDT treatment as described above. Untreated cells were used as a control for basal level of fluorescence. Aliquots of cells were harvested at indicated time points and placed on ice to stop the reaction. The fluorescence intensity was measured at an excitation wavelength of 488 nm and an emission of 530 nm by using a fluorescent Mutilabel Counter (Safire, TECAN, Austria) at 30 min post‐treatment.
Intracellular glutathione (GSH) levels. GSH levels were determined by the ApoGSH Glutathione Detection Kit (Biovision) according to the manufacturer's instructions. Briefly, the treated cells were harvested at 4 h post‐treatment, and the samples were prepared by repeated freeze‐thaw cycles. The fluorescence value was measured by a fluorescent Mutilabel Counter (Safire, TECAN, Austria). The total glutathione amount was calculated by applying the sample readings to the standard curve.
Proteomics study. B16F1 cells were treated with MB alone and MB‐PDT (20 µM). Light alone were used as control. Cells were collected at 6 h after PDT. Sample preparation, in‐gel digestion, peptide extraction, and spectra acquisition were performed as described previously.( 18 ) In brief, mass spectra were recorded in the positive ion mode with delayed extraction. Monoisotopic masses of peptides were analyzed using the Mascot search engine. The identification parameters were set as follows: data base, Swissport; species, Mus musculus; all peptide masses are [M + H]+ and monoisotopic; cysteines were treated with iodoacetamide; mass tolerance, 60 p.p.m.; enzyme, trypsin; allow for one missed cleavage site. By combining observed molecular weight and pI on the 2‐DE gel, the identities of proteins were finally determined. All results were examined carefully for reliability and occurrence of multiple proteins in the same sample.
Immunohistochemical staining. Samples of melanoma tissues from individual mice were fixed in 10% formaldehyde and embedded in paraffin. Fixed tissues were cut into 4 µm serial sections and then mounted on slides. The Elivision plus immunohistochemistry kit (Maixin.Bio, PRC) was used according to the manufacturer's instructions. Slides were incubated with anti‐cleaved caspase‐3 (Cell Signaling Technology). PBS took the place of primary antibody as the negative staining control. The slides were observed under the microscope (Zeiss, Germany), and the images were captured by digital camera and analyzed by specific software (Axiovision, Germany).
Terminal 2′‐deoxyuridine‐5′‐triphosphate (dUTP) nick end labeling (TUNEL). Paraffin‐embedded melanoma sections were deparaffinized and rehydrated to PBS. Samples were treated with 10 µg/mL proteinase K (ICN) in 10 mM Tris‐HCl (pH 7.4) for 15 min at room temperature. Sections were washed three times in phosphate‐buffered saline (PBS) solution after proteinase treatment. TUNEL labeling was performed with the In Situ Cell Death detection kit with fluorescein (Roche Applied Science) according to manufacturer recommendations.
Statistical analysis. Data were expressed as mean ± SD. Statistically evaluated by Student's t‐test when only two value sets were compared, and one‐way ANOVA followed by Dunnett's test when the data involved three or more groups. P < 0.05 or P < 0.01 was considered statistically significant and indicated by * or **, respectively.
Results
MB‐PDT kills B16F1 melanoma cells. To evaluate whether MB‐PDT had a cell‐killing effect on B16F1 tumor cells, we used MTT assay to determine the phototoxicity of PDT with variable concentrations of MB (ranging from 0 to 25 µM) 18 h after irradiation. As shown in Fig. 1(a), the dose‐dependent effect of MB‐PDT on cell death was observed. More than half of the cells (approximately 54.7%) were killed when treated with PDT with 20 µM MB.
Figure 1.
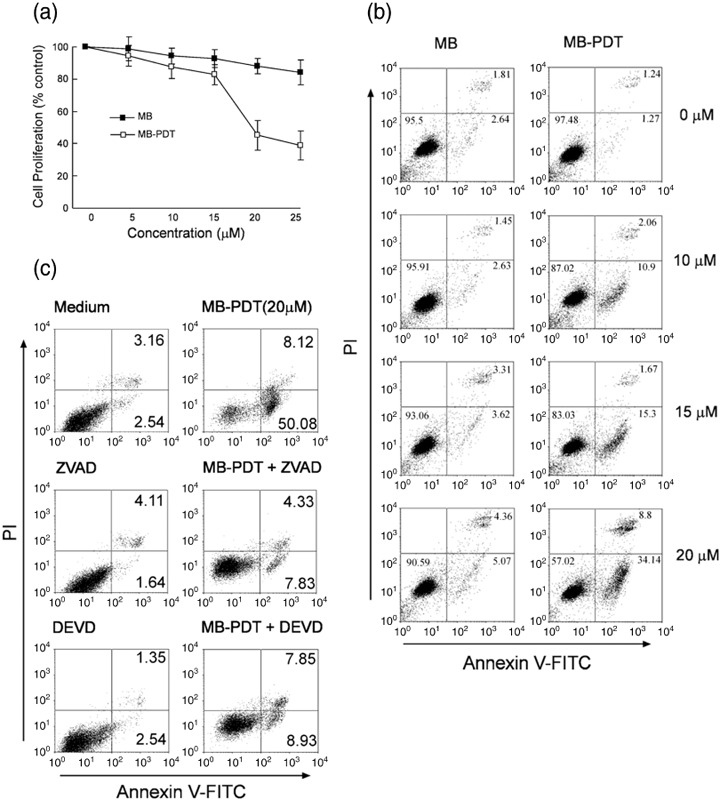
Photodynamic therapy (PDT) with methylene blue (MB) induces apoptosis in B16F1 cells. (a) Cell viability was determined by 3‐(4,5‐dimethylthiazol‐2‐yl)‐2,5‐diphenyl tetrazolium bromide (MTT) assay 18 h after treatment of MB‐PDT (ranging from 0 to 25 µM). Results are expressed as the percentage of viable cells compared with light alone‐treated control (mean ± SD, n = 3). (b) Apoptosis in B16F1 cells was assessed at 6 h post‐treatment by annexin V‐FITC/PI binding and measured by flow cytometry analysis. Numbers indicate the percentage of cells in each quadrant. (c) B16F1 cells were pretreated with 50 µM benzyloxycarbonyl‐Val‐Ala‐Asp (Z‐VAD‐FMK) or the caspase inhibitor Z‐DEVD‐FMK for 1 h followed by treatment with MB‐PDT, then apoptosis was determined by flow cytometry at 6 h post‐treatment.
To assess whether the cytotoxic effect of MB‐PDT was caused by apoptotic cell death, we determined apoptosis of B16F1 cells using annexin V binding assay followed by flow cytometry. Cells were treated by MB‐PDT (different doses of MB ranging from 0 to 20 µM) 6 h after the treatment. As illustrated in Fig. 1(b), MB‐PDT induced dose‐dependent increases in apoptotic B16F1 cells: approximately 34.1% of the cells were at early apoptosis in MB‐PDT (20 µM)‐treated group, compared with 5.1% of MB‐alone‐treated group. Annexin V‐ and PI‐positive cells were observed with only a small percentage of total cells in the treated groups, indicating low level of necrosis induced by MB‐PDT.
To further confirm that MB‐PDT‐induced cell death was apoptotic and was indeed caspase‐dependent, we treated B16F1 cells with MB‐PDT (20 µM) in the presence or absence of Z‐VAD‐FMK (50 µM), a pancaspase inhibitor. Using MB‐PDT‐treated cells as the control, approximately 50% of B16F1 cells underwent apoptosis 6 h after the treatment. Compared with the control group, addition of Z‐VAD‐FMK markedly reduced the apoptotic response induced by MB‐PDT, as indicated in Fig. 1(c). Similar result was observed with MB‐PDT‐treated cells that were pretreated with Z‐DEVD‐FMK (caspase‐3 inhibitor). Taken together, these findings demonstrated that MB‐PDT treatment could kill B16F1 cells through an apoptotic process.
Apoptosis induced by MB‐PDT via the intrinsic mitochondrial pathway. The molecular events activating the apoptotic cell death following PDT treatment were further studied. The time‐dependent effect of MB‐PDT (20 µM) was examined in B16F1 cells. As assessed by Western blot, activation of caspase‐3 was obvious at 6 h post‐treatment (Fig. 2a). Consequently, PARP was detected to be cleaved at 12 h in treated cells, corroborating the induction of apoptosis in B16F1 cells by MB‐PDT.
Figure 2.
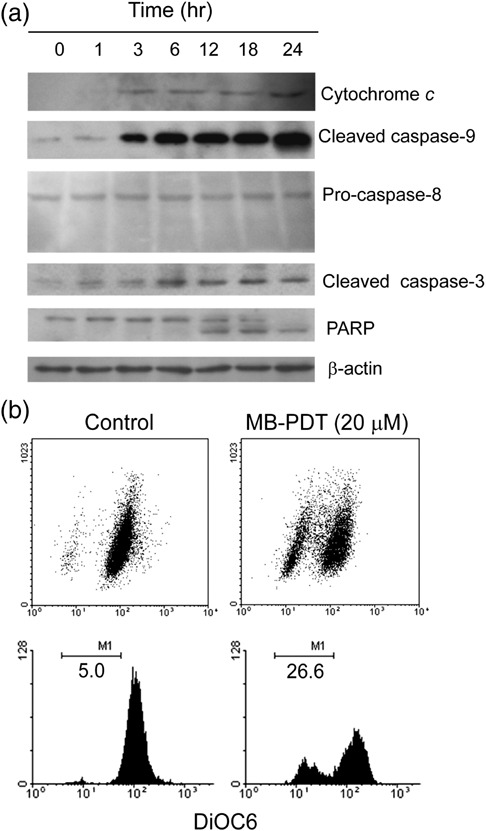
Methylene‐blue‐mediated photodynamic therapy (MB‐PDT)‐mediated apoptosis is effected through the intrinsic apoptotic pathway. (a) The time‐dependent apoptosis was measured in B16F1 cells. For this analysis, cells were treated with MB‐PDT (20 µM), and then harvested at 1, 3, 6, 12, 18 and 24 h post‐PDT, respectively. The blots were probed with specific antibodies as shown. (b) Treated cells were stained with fluorochrome dye DiOC6 to determine the mitochondrial membrane potential (Δψm ) as indicated. Similar results were obtained in three independent experiments.
There are two alternative pathways to initiate apoptosis known to date, that are the intrinsic, characterized by cytochrome c release and caspase‐9 activation, and the extrinsic, involving activation of caspase‐8 and 10.( 19 ) To assess which pathway is operative, we tested the expression level of cytochrome c, caspase‐9 and caspase‐8. As shown in Fig. 2(a), immunoblot with antibody against caspase‐9 showed a large increase in activated caspase‐9 after MB‐PDT treatment. Consistently, cytochrome c was released from mitochondria as well, indicating activation of the intrinsic pathway. By contrast, no cleavage of caspase‐8 was found in treated cells.
In mitochondria, cytochrome c plays an essential role in the generation of mitochondrial transmembrane potential (Δψm ).( 20 ) Release of cytochrome c observed in B16F1 cells prompted us to evaluate alteration in mitochondrial transmembrane potential by fluorochrome DiOC6 staining. As seen in Fig. 2(b), DiOC6 incorporation was 21.6% less in the MB‐PDT‐treated cells than that of the control cells, indicating the loss of mitochondrial membrane potential caused by MB‐PDT. These data strongly indicated that MB‐PDT‐mediated induction of apoptosis in B16F1 cells was executed by the intrinsic mitochondrial pathway.
Oxidative stress produced by MB‐PDT plays an essential role in initiating apoptotic cell death. Much evidence has established that photodynamic therapy begins its tumor ablation action with generation of ROS. To test the induction of a state of oxidative stress in melanoma cells by MB‐PDT and its role in regulating apoptosis, the ROS production was measured by flow cytometry using the ROS‐sensitive dye dihydrorhodamine 123 (DHR). In MB‐PDT‐treated group, the intensity of DHR fluorescence was significantly enhanced (P < 0.01), as shown by dose–response curves (Fig. 3a). In contrast, supplementing the cells with MB alone failed to significantly alter the DHR signal. Glutathione (GSH) is the principal detoxifying system capable of scavenging ROS and maintaining the redox state of the cell.( 21 ) Hence, excessive generation of ROS mediated by MB‐PDT may lead to GSH depletion. We next measured total GSH levels at 4 h after treatment of these cells with MB‐PDT (0–20 µM). As shown in Fig. 3(b), there was a clear concentration dependent reduction in GSH levels, which became as low as 23% of control levels.
Figure 3.
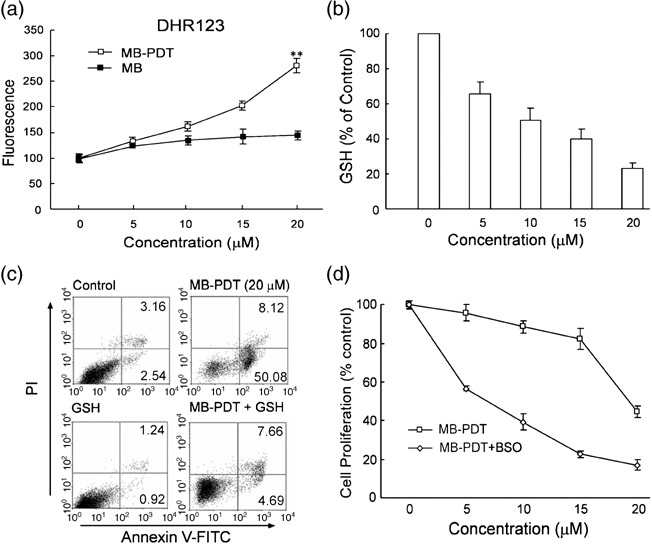
Methylene‐blue‐mediated photodynamic therapy (MB‐PDT)‐mediated apoptosis is oxidative stress dependent. (a) Reactive oxygen species (ROS) production was measured in treated cells labeled with DHR as indicated. Dose‐dependent increase in intracellular ROS production (mean ± SD) was shown. (b) Total cellular glutathione (GSH) levels after a 4‐h treatment of B16F1 cells with MB‐PDT. (c) Apoptosis was assessed at 6 h in B16F1 cells treated with 20 mM GSH for 1 h followed by treatment with MB‐PDT. (d) B16F1 cells were incubated with 10 µM DL‐buthionine (S,R)‐sulfoximine (BSO), followed by treatment with MB‐PDT. After the indicated time, cell death was measured by 3‐(4,5‐dimethylthiazol‐2‐yl)‐2,5‐diphenyl tetrazolium bromide (MTT) assay. Data are expressed as percent of the control.
If MB‐PDT mediated apoptosis is the result of oxidative stress, we should be able to detect depressed susceptibility to inductive apoptosis when we pretreated B16F1 cells with antioxidant (exogenous GSH). Consistent with this expectation, we found that the ratio of apoptosis was changed from 50.08% to 4.69%, indicating that addition of exogenous GSH almost completely reversed apoptotic cell death brought about by MB‐PDT (Fig. 3c). Conversely, preincubation with GSH synthesis inhibitor DL‐buthionine‐(S, R)‐sulfoximine (BSO), which led to GSH depletion, potentiated the response of cancer cells to MB‐PDT (Fig. 3d). MB‐PDT inhibited the growth of B16F1 cells (IC50~20.5 µM under our experimental protocol), but pretreatment with BSO reduced the IC50 to 6.4 µM. These observations demonstrate that MB‐PDT‐mediated activation of the cell death machinery is due to oxidative stress resulting from an imbalance between ROS generation and degradation.
Proteomics analysis indicates mitochondrial dysfunction in response to MB‐PDT. Disruption of mitochondrial transmembrane potential observed with treated cells implicated mitochondrial dysfunction during the treatment. In order to provide molecular evidence for mitochondrial dysfunction in MB‐PDT, we performed a comprehensive proteomics study to identify what alterations in protein expression have occurred. B16F1 cells were treated with light alone, MB alone and MB‐PDT, and then the whole cell homogenate was analyzed using 2‐DE.
Following Coomassie blue staining, the gels were subjected to PD Quest imaging analysis. Figure 4(a) shows the image of a representative 2‐DE gel of proteins from B16F1 cell culture after 6 h of MB‐PDT treatment. Protein spots that have biological differences, defined as having increased or decreased more than two folds of the control in MB‐PDT‐treated group, were chosen for further analysis. Fifty‐six such spots were found, 21 up‐regulated and 35 down‐regulated (see Suppl. Table S1). Table 1 shows the proteins classified as structural proteins (Vimentin), metabolite enzymes (ubiquinone biosynthesis protein COQ9 [COQ9], citrate synthase, glutathione S‐transferase P 2 [GST‐piA], peroxiredoxin 1 and 6, etc.), chaperone proteins (78 kDa glucose‐regulated protein precursor [GRP78], heat shock protein 90‐alpha [HSP86], heat shock protein 75 kDa [TRAP1]) and mitochondrial electron‐transport proteins (NADH:ubiquinone oxidoreductase 49 kDa subunit [complex I‐49 kDa]).
Figure 4.

Image of two‐dimensional (2‐D) gel stained with Coomassie Blue R‐250. B16F1 cells were treated with methylene‐blue‐mediated photodynamic therapy (MB‐PDT) (20 µM). 6 h after irradiation, the treated cells were lyzed in 4% CHAPS buffer and assayed for protein concentration. 1 mg of total protein was prepared for two‐dimensional gel separation. (a) Representative example of gel image from MB‐PDT treated group showing the entire pI range 3–10 (non‐linear) and molecular masses of 10–100 kDa. (b) Differential protein expression analysis with zoomed images of selected gel areas. The number in each zoomed image presents the reduction fold‐change compared with MB‐PDT. The selected subset of proteins, as listed in Table 1, is shown.
Table 1.
Selected subset of proteins that showed significantly changed upon methylene‐blue‐mediated photodynamic therapy (MB‐PDT) treatment
| Protein | Accession no. † | Mass ‡ (Da) | Score § | Regulation ¶ | |
|---|---|---|---|---|---|
| Structural protein | |||||
| Vimentin | P20152 | 53581 | 88 |
|
|
| Metabolite enzyme | Q8K1Z0 | 35232 | 79 |
|
|
| Ubiquinone biosynthesis protein COQ9 [COQ9] †† | |||||
| Citrate synthase †† | Q9CZU6 | 51988 | 55 |
|
|
| Glutathione S‐transferase P 2 [GST‐piA] | P46425 | 23562 | 56 |
|
|
| Peroxiredoxin 1 | P35700 | 22390 | 65 |
|
|
| Peroxiredoxin 6 | O08709 | 24838 | 112 |
|
|
| Chaperone protein | |||||
| 78 kDa glucose‐regulated protein precursor [GRP78] | P20029 | 72492 | 297 |
|
|
| Heat shock protein 90‐alpha [HSP86] | P07901 | 85003 | 79 |
|
|
| Heat shock protein 75 kDa [TRAP1] †† | Q9CQN1 | 80501 | 223 |
|
|
| Mitochondrial electron‐transport proteins | |||||
| NADH:ubiquinone oxidoreductase 49 kDa subunit [complex I‐49 kDa] †† | Q91WD5 | 52991 | 67 |
|
|
NOTE: The regulation is either indicated by  (point out up‐regulation) or by
  (for ‘down‐regulation’). The complete list of identified differential proteins, and further relevant data are presented in the Suppl. Table S1. All proteins were identified using matrix‐assisted laser desorption/ionization time of flight peptide mass fingerprinting.
Accession number according to entries in the Swiss‐Prot database.
Theoretical values, mass in Daltons.
Obtained by peptide mass fingerprinting.
Regulation of protein expression levels; based on the ratio of MB‐PDT/control.
Subcellular location at mitochondria.
Among these proteins, peroxiredoxin‐1 and 6 (2.4‐ and 2.5‐fold lower than control, respectively), are identified as negative regulators of ROS,( 22 ) indirectly supporting the increased oxidative stress in MB‐PDT‐treated cells. Citrate synthase is one of the most differentially expressed proteins (decreased by 27.9‐fold), which is visually presented by gray‐scale images (Fig. 4b). The reduction was a contributing factor to the decline of citrate synthase activity, which is a good marker of mitochondria integrity,( 23 ) implying the presence of mitochondrial disruption. Additionally, we have identified two other important mitochondrial proteins, complex I‐49 kDa and COQ9. Complex I‐49 kDa has been identified as part of the ‘catalytic core’ conducting ubiquinone reduction on complex I, which is considered to provide an appropriate index of the overall capacity of the electron transport chain.( 24 ) COQ9 participates in the biosynthesis of coenzyme Q,( 25 ) which plays essential roles in oxidative phosphorylation. Collectively, decreased levels of these mitochondrial proteins led to declining capacity for mitochondria, indicating functional impairment of mitochondria induced by MB‐PDT.
MB‐PDT delayed tumor growth in mouse melanoma model by causing apoptotic cell death. To further evaluate whether MB‐PDT had an effect to inhibit tumor growth in vivo, we tested the tumor volume and survival days in a xenograft tumor model in which B16F1 cells were injected s.c. into C57BL6 mice. One week after tumor implantation, mice were treated weekly for 3 weeks with the following: (a) light alone; (b) MB alone; and (c) MB‐PDT. The PDT effectiveness was determined using tumor growth curve, which showed that tumors in MB‐PDT treated mice grew much more slowly as compared with those in the control group (light alone) (Fig. 5a,b). Slopes of the growth curves were determined by linear regression analysis. The slope for the tumor growth curve for the MB‐PDT treatment was 2.8‐fold lower than that for the control. Specifically, two weeks and three weeks post‐treatment, the tumor volume was reduced by 69.6% (P < 0.01, n = 8) and 65.1% (P < 0.05, n = 8), respectively. Thus, as compared with control, MB‐PDT can cause significant reduction of tumor size in melanoma‐bearing mice. As is the case with MB‐PDT treated mice, animals treated by MB alone also displayed diminished tumor volume when compared with the control group, but these differences were not statistically significant. Meanwhile, we have examined the survival rate of the mice as treated above. As shown in Fig. 5(c), MB‐PDT treatment extended life span of tumor‐bearing mice to 51 days, whereas mice of the control group survived at most 30 days.
Figure 5.
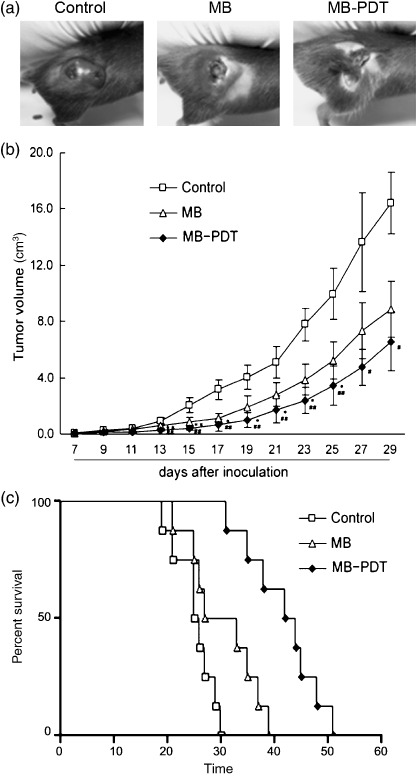
Methylene‐blue‐mediated photodynamic therapy (MB‐PDT) delayed tumor growth in mouse melanoma model. Mice with tumor were treated with the following treatments weekly for three weeks: light alone, MB alone, and MB‐PDT. Tumor volume was determined by direct measurement of tumor dimensions, using calipers. Results are presented as the mean tumor volume ± SEM (n = 8). (a) Morphology contrast of tumors from the three treated groups. (b) Tumor growth curve was expressed as the mean tumor diameters and calculated tumor volumes. (c) Survival plot of melanoma‐bearing mice after various treatments. The time of death, or when mice became moribund, was recorded and plotted as percentage of survival.
To determine whether the reduced tumor growth rate following MB‐PDT treatment could be explained by the induction of apoptosis, we used TUNEL assay and immune staining of caspase‐3 to characterize apoptosis in tumor sections. As seen in Fig. 6(a), TUNEL assay showed explicitly that apoptotic cells were induced by MB‐PDT in melanoma tissue, whereas few TUNEL‐positive cells were observed in tumors treated either by light alone or by MB alone. The induction of apoptosis effect of MB‐PDT was further documented by cleaved caspase‐3 immunohistochemistry assay (Fig. 6b). Consistently, the formation of DNA ladder was evident in melanoma cells of MB‐PDT‐treated mice (data not shown).The results from the in situ apoptosis assays have captured many significant features of apoptosis, which strongly suggest that MB‐PDT‐mediated inhibition of tumor growth in melanoma‐bearing mice is closely correlated with the enhanced apoptosis in cancer cells.
Figure 6.
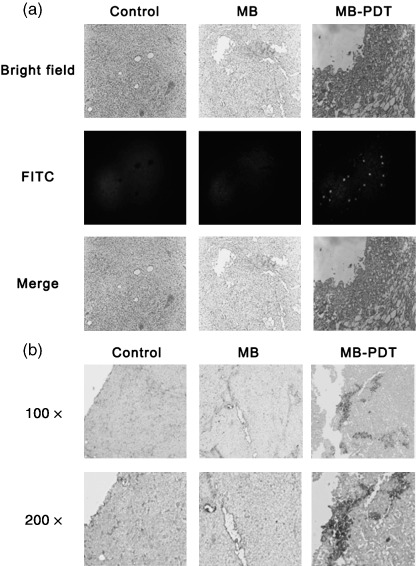
Methylene‐blue‐mediated photodynamic therapy (MB‐PDT) induces apoptotic cell death in vivo. Samples were gained from treated mice as described above. (a) In situ detection of apoptotic cells by fluorescence microscopy using the terminal 2′‐deoxyuridine‐5′‐triphosphate (dUTP) nick end labeling (TUNEL) assay. Bright‐field image (up), TUNEL reaction fluorescence (middle) and merge of both (down) sections from melanomas treated by MB‐PDT as indicated. (b) Immunohistochemical staining of melanoma sections using anti‐cleaved caspase‐3 antibody. Shown is 1 representative experiment of 3. Original magnifications: up ×100; down ×200.
Discussion
Photodynamic therapy (PDT) is a novel cancer treatment that has been approved by the US Food and Drug Administration. In the current study, MB‐PDT treatment of melanoma was probed in both cell culture and animal model. Our findings provide insights into the molecular mechanisms underlying MB‐PDT‐induced apoptosis and also document the profound photochemopreventive effects of MB‐PDT against melanoma in vivo.
Melanoma is notoriously resistant to most forms of chemotherapy and radiation, and there has been a distressing rise in its overall incidence over recent years, urging us to design new treatment strategies that restore apoptosis. As summarized in Fig. 7, we delineated a series of molecular events initiating the signaling cascades involved in MB‐PDT‐induced intrinsic apoptosis. First, we demonstrated that treated cells showed enhanced activation of caspase‐3, which was associated with elevated cleavage of PARP. It is believed that caspase‐3 can be activated only by upstream initiator caspases, which are capable of autocatalytic activation.( 26 ) Then activation of caspase‐9 and 8 was tested in MB‐PDT‐treated cells. The results of Western blot showed that caspase‐9 was obviously activated during the process; nonetheless caspase‐8 remained unchanged. Meanwhile, cytochrome c was released from mitochondria to cytoplasm, a hallmark of initiation of mitochondria‐mediated apoptosis. Furthermore, loss of Δψm serving as a key step in the mitochondria‐dependent apoptosis, provided another proof of the intrinsic apoptotic cascade induced by MB‐PDT.
Figure 7.
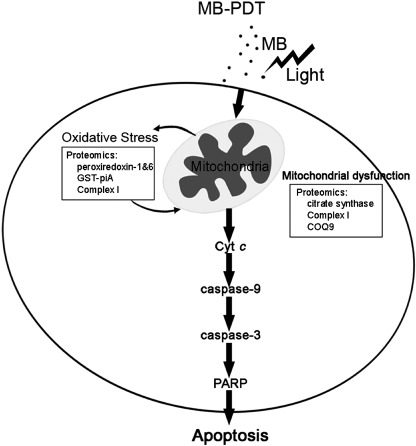
Methylene‐blue‐mediated photodynamic therapy (MB‐PDT) mediated induction of apoptosis by mitochondria‐dependent pathway. MB seems to selectively bind to mitochondria, where it produces reactive oxygen species (ROS) after excitation in combination with light. Then ROS act on mitochondria to induce an imbalance between ROS production and antioxidant capacity, which can be proved by proteomics study of alterations of proteins, such as peroxiredoxin‐1 and 6, GST‐piA, complex I‐49 kDa and COQ9. Consequently, MB‐PDT mediated oxidative stress causes impairment of mitochondrial integrity and function, resulting in release of cytochrome c and loss of mitochondrial membrane potential (Δψm ), which ultimately leads to apoptotic cell death and tumor destruction.
Proteomics analysis showed that MB‐PDT can lead to changes of several redoxins, e.g. peroxiredoxin‐1 and 6. In addition, GST‐piA is up‐regulated responding to MB‐PDT, which may account for, at least in part, GSH depletion observed in B16F1 cells. Importantly, down‐regulation of complex I‐49 kDa is a major contributor to generation of reactive oxygen species in mitochondria (endogenous ROS).( 27 , 28 ) MB‐PDT appears to be a robust system – in addition to producing ROS (exogenous ROS) directly through photochemical reaction, the treatment undermines the antioxidant defense system and the electron transport chain inside cells.
Notably, mitochondria, the major physiological source of reactive oxygen species, are also a sensitive target for the damaging effects of oxygen radicals,( 29 ). Mitochondrial citrate synthase functions as a rate‐limiting enzyme of the tricarboxylic acid cycle, which is essential to maintain mitochondrial function. A recent study has demonstrated that decline in the activity of citrate synthase and down‐regulation of its expression closely correlated with accumulating oxidative damage to mitochondria.( 30 ) Similarly, we report here B16F1 cells displayed sharp decrease in citrate synthase responding to MB‐PDT, using proteomics assay of MB‐PDT treatment‐related alterations. This finding, coupled with the result of loss of mitochondrial membrane potential (Fig. 2b), directly support the impairment of mitochondrial integrity and function after MB‐PDT. MB‐PDT also shifts the expression levels of vimentin and GRP78 (down‐regulated by 2.7‐fold and 14.2‐fold, respectively, as shown in Table 1), both of which are suggested to play important roles in carcinogenesis, either by promoting cell survival or by suppression of apoptosis.( 31 , 32 ) In addition, MB‐PDT induced expression of several heat shock proteins, including HSP86 and TRAP1, which are thought to protect cells from stress, conferring resistance to MB‐PDT‐induced apoptosis.( 33 , 34 ) We feel it significant that proteomics of protein alterations in tumor cells not only confirm the intrinsic apoptosis induced by MB‐PDT, but also unravel a more complete picture of the cellular responses to oxidative stress. There is hope that information gleaned from studies of the proteome in melanocytes might contribute to therapeutic advances in the development of molecular‐based intervention for enhancing MB‐PDT.
B16F1 cells subject to MB alone also displayed variations of protein expression by proteomic analysis, which may account for the observed outcome in MB‐alone treated group of mouse melanoma model (Fig. 5b,c). The fact that MB can intercalate with purine nucleotides resulting in helical unwinding, has been described in the literature.( 12 , 35 ) However, the outcome of MB‐alone treatment in mice with melanoma is not comparable with that of MB‐PDT, which caused significant decrease in tumor volume and improved survival time. Similarly, it has been demonstrated that different concentrations of methylene blue injected into xenotransplanted colonic tumors in mice could delay tumor growth without irradiation.( 36 ) In addition, MB‐PDT‐mediated inhibition of tumor growth is more remarkable in early treatment than late, which might be due to the metastasis performance of melanoma. Thus, combination therapy with antimetastasis drugs would be helpful in improving the therapeutic effect and enhancing the tumor‐free survival.
In conclusion, our findings suggest that MB‐PDT triggers oxidative stress resulting in the collapse of the mitochondrial transmembrane potential, which in turn leads to cytochrome c release and apoptosis via the intrinsic caspase‐9/caspase‐3 pathway. Understanding the signaling pathway involved in the process will hopefully shed light on strategies for improving therapeutic approaches for melanoma therapy. It should be kept in mind that melanoma is one of the aggressive malignancies, which cannot be cured by monotherapy. Our data may provide an update on the prospects for the MB‐PDT as a promising therapy, which could be combined with chemotherapy or radiotherapy, especially at the early stage of melanoma.
Supporting information
Table S1. Characteristics of all proteins that showed a significant change in response to methylene‐blue‐mediated photodynamic therapy (MB‐PDT) treatment. For each protein the following characteristics are given: the spot number as designated by the position, the accession number and protein name as given in the Swiss‐Prot database, the theoretical molecular weight and Score, the ratios in protein level showing the changes after 6 h of MB‐PDT and MB alone challenge compared with control. P, MB‐PDT treated group; M, MB alone treated group; C, Light alone treated group
Please note: Wiley‐Blackwell are not responsible for the content or functionality of any supporting materials supplied by the authors. Any queries (other than missing material) should be directed to the corresponding author for the article.
Supporting info item
Acknowledgments
This work was supported by the Program for New Century Excellent Talents in University (NCET‐06‐0445), the Key Project of Chinese Ministry of Education (NO107049) and the grants from National Basic Research Program of China (No.2006CB910103). We thank Dr Yi Qian (School of Medicine, Washington University) for critical reading and grammatical correction of the manuscript.
Y. Chen and W. Zheng contributed equally to this work.
References
- 1. Dougherty TJ, Gomer CJ, Henderson BW et al . Photodynamic therapy. J Natl Cancer Inst 1998; 90: 889–905. [DOI] [PMC free article] [PubMed] [Google Scholar]
- 2. Almeida RD, Manadas BJ, Carvalho AP et al . Intracellular signaling mechanisms in photodynamic therapy. Biochim Biophys Acta 2004; 1704: 59–86. [DOI] [PubMed] [Google Scholar]
- 3. Hopper C. Photodynamic therapy: a clinical reality in the treatment of cancer. Lancet Oncol 2000; 1: 212–19. [DOI] [PubMed] [Google Scholar]
- 4. Dolmans DE, Fukumura D, Jain RK. Photodynamic therapy for cancer. Nat Rev Cancer 2003; 3: 380–7. [DOI] [PubMed] [Google Scholar]
- 5. Chudnovsky Y, Khavari PA, Adams AE. Melanoma genetics and the development of rational therapeutics. J Clin Invest 2005; 115: 813–24. [DOI] [PMC free article] [PubMed] [Google Scholar]
- 6. Gray‐Schopfer V, Wellbrock C, Marais R. Melanoma biology and new targeted therapy. Nature 2007; 445: 851–7. [DOI] [PubMed] [Google Scholar]
- 7. Soengas MS, Lowe SW. Apoptosis and melanoma chemoresistance. Oncogene 2003; 22: 3138–51. [DOI] [PubMed] [Google Scholar]
- 8. Woodburn KW, Fan Q, Kessel D et al . Photodynamic therapy of B16F10 murine melanoma with lutetium texaphyrin. J Invest Dermatol 1998; 110: 746–51. [DOI] [PubMed] [Google Scholar]
- 9. Sheleg SV, Zhavrid EA, Khodina TV et al . Photodynamic therapy with chlorin e(6) for skin metastases of melanoma. Photodermatol Photoimmunol Photomed 2004; 20: 21–6. [DOI] [PubMed] [Google Scholar]
- 10. Córdoba F, Braathen LR, Weissenberger J et al . 5‐aminolaevulinic acid photodynamic therapy in a transgenic mouse model of skin melanoma. Exp Dermatol 2005; 14: 429–37. [DOI] [PubMed] [Google Scholar]
- 11. Gabrielli D, Belisle E, Severino D et al . Binding, aggregation and photochemical properties of methylene blue in mitochondrial suspensions. Photochem Photobiol 2004; 79: 227–32. [DOI] [PubMed] [Google Scholar]
- 12. Tardivo JP, Giglio AD, Oliveira C et al . Methylene blue in photodynamic therapy: from basic mechanisms to clinical applications. Photodiagnosis Photodynamic Ther 2005; 2: 175–91. [DOI] [PubMed] [Google Scholar]
- 13. Link EM, Brown I, Carpenter RN et al . Uptake and therapeutic effectiveness of 125I‐ and 211At‐methylene blue for pigmented melanoma in an animal model system. Cancer Res 1989; 49: 4332–7. [PubMed] [Google Scholar]
- 14. Noodt BB, Rodal GH, Wainwright M et al . Apoptosis induction by different pathways with methylene blue derivative and light from mitochondrial sites in V79 cells. Int J Cancer 1998; 75: 941–8. [DOI] [PubMed] [Google Scholar]
- 15. Ball DJ, Luo Y, Kessel D et al . The induction of apoptosis by a positively charged methylene blue derivative. J Photochem Photobiol B 1998; 42: 159–63. [DOI] [PubMed] [Google Scholar]
- 16. Tardivo JP, Giglio AD, Paschoal LHC et al . Treatment of melanoma lesions using methylene blue and RL50 light source. Photodiagnosis Photodynamic Ther 2004; 1: 345–6. [DOI] [PubMed] [Google Scholar]
- 17. Tong Z, Singh G, Rainbow AJ. Sustained activation of the extracellular signal‐regulated kinase pathway protects cells from photofrin‐mediated photodynamic therapy. Cancer Res 2002; 62: 5528–35. [PubMed] [Google Scholar]
- 18. Zhou B, Yang W, Ji JG et al . Differential display proteome analysis of PC‐12 cells transiently transfected with metallothionein‐3 gene. J Proteome Res 2004; 3: 126–31. [DOI] [PubMed] [Google Scholar]
- 19. Strasser A, O’Connor L, Dixit VM. Apoptosis signaling. Annu Rev Biochem 2000; 69: 217–45. [DOI] [PubMed] [Google Scholar]
- 20. Waterhouse NJ, Goldstein JC, Ahsen OV et al . Cytochrome C maintains mitochondrial transmembrane potential and ATP generation after outer mitochondrial membrane permeabilization during the apoptotic process. J Cell Biol 2001; 153: 319–28. [DOI] [PMC free article] [PubMed] [Google Scholar]
- 21. Magi B, Ettorre A, Liberatori S et al . Selectivity of protein carbonylation in the apoptotic response to oxidative stress associated with photodynamic therapy: a cell biochemical and proteomic investigation. Cell Death Differ 2004; 11: 842–52. [DOI] [PubMed] [Google Scholar]
- 22. Lee C, Kim HJ, Lee YR et al . Analysis of peroxiredoxin decreasing oxidative stress in hypertensive aortic smooth muscle. Biochim Biophys Acta 2007; 1774: 848–55. [DOI] [PubMed] [Google Scholar]
- 23. Houmard JA, Weidner ML, Gavigan KE et al . Fiber type and citrate synthase activity in the human gastrocnemius and vastus lateralis with aging. J Appl Physiol 1998; 85: 1337–41. [DOI] [PubMed] [Google Scholar]
- 24. Zickermann V, Bostina M, Hunte C et al . Functional implications from an unexpected position of the 49‐kDa subunit of NADH:ubiquinone oxidoreductase. J Biol Chem 2003; 278: 29072–8. [DOI] [PubMed] [Google Scholar]
- 25. Johnson A, Gin P, Marbois BN et al . COQ9, a new gene required for the biosynthesis of coenzyme Q in saccharomyces cerevisiae. J Biol Chem 2005; 280: 31397–404. [DOI] [PubMed] [Google Scholar]
- 26. Degterev A, Boyce M, Yuan J. A decade of caspases. Oncogene 2003; 22: 8543–67. [DOI] [PubMed] [Google Scholar]
- 27. Galkin A, Brandt U. Superoxide radical formation by pure complex I (NADH:ubiquinone oxidoreductase) from Yarrowia lipolytica. J Biol Chem 2005; 280: 30129–35. [DOI] [PubMed] [Google Scholar]
- 28. Kussmaul L, Hirst J. The mechanism of superoxide production by NADH:ubiquinone oxidoreductase (complex I) from bovine heart mitochondria. Proc Natl Acad Sci USA 2006; 103: 7607–12. [DOI] [PMC free article] [PubMed] [Google Scholar]
- 29. Galluzzi L, Larochette N, Zamzami N et al . Mitochondria as therapeutic targets for cancer chemotherapy. Oncogene 2006; 25: 4812–30. [DOI] [PubMed] [Google Scholar]
- 30. Short KR, Bigelow ML, Kahl J et al . Decline in skeletal muscle mitochondrial function with aging in humans. Proc Natl Acad Sci USA 2005; 102: 5618–23. [DOI] [PMC free article] [PubMed] [Google Scholar]
- 31. Ben‐Ze’ev A, Raz A. Relationship between the organization and synthesis of vimentin and the metastatic capability of B16 melanoma cells. Cancer Res 1985; 45: 2632–41. [PubMed] [Google Scholar]
- 32. Lee E, Nichols P, Spicer D et al . GRP78 as a novel predictor of responsiveness to chemotherapy in breast cancer. Cancer Res 2006; 66: 7849–53. [DOI] [PubMed] [Google Scholar]
- 33. Jean S, Bideau C, Bellon L et al . The expression of genes induced in melanocytes by exposure to 365‐nm UVA: study by cDNA arrays and real‐time quantitative RT‐PCR. Biochim Biophys Acta 2001; 1522: 89–96. [DOI] [PubMed] [Google Scholar]
- 34. Hua GQ, Zhang QX, Fan ZS. Heat shock protein 75 (TRAP1) antagonizes reactive oxygen species generation and protects cells from granzyme M‐mediated apoptosis. J Biol Chem 2007; 282: 20553–60. [DOI] [PubMed] [Google Scholar]
- 35. Hu Z, Tong C. Synchronous fluorescence determination of DNA based on the interaction between methylene blue and DNA. Anal Chim Acta 2007; 587: 187–93. [DOI] [PubMed] [Google Scholar]
- 36. Orth K, Beck G, Genze F et al . Methylene blue mediated photodynamic therapy in experimental colorectal tumors in mice. J Photochem Photobiol B 2000; 57: 186–92. [DOI] [PubMed] [Google Scholar]
Associated Data
This section collects any data citations, data availability statements, or supplementary materials included in this article.
Supplementary Materials
Table S1. Characteristics of all proteins that showed a significant change in response to methylene‐blue‐mediated photodynamic therapy (MB‐PDT) treatment. For each protein the following characteristics are given: the spot number as designated by the position, the accession number and protein name as given in the Swiss‐Prot database, the theoretical molecular weight and Score, the ratios in protein level showing the changes after 6 h of MB‐PDT and MB alone challenge compared with control. P, MB‐PDT treated group; M, MB alone treated group; C, Light alone treated group
Please note: Wiley‐Blackwell are not responsible for the content or functionality of any supporting materials supplied by the authors. Any queries (other than missing material) should be directed to the corresponding author for the article.
Supporting info item