Abstract
Exercise exerts a wide range of beneficial effects for healthy physiology1. However, the mechanisms regulating an individual’s motivation to engage in physical activity remain incompletely understood. An important factor stimulating the engagement in both competitive and recreational exercise is the motivating pleasure derived from prolonged physical activity, which is triggered by exercise-induced neurochemical changes in the brain. Here, we report on the discovery of a gut–brain connection in mice that enhances exercise performance by augmenting dopamine signalling during physical activity. We find that microbiome-dependent production of endocannabinoid metabolites in the gut stimulates the activity of TRPV1-expressing sensory neurons and thereby elevates dopamine levels in the ventral striatum during exercise. Stimulation of this pathway improves running performance, whereas microbiome depletion, peripheral endocannabinoid receptor inhibition, ablation of spinal afferent neurons or dopamine blockade abrogate exercise capacity. These findings indicate that the rewarding properties of exercise are influenced by gut-derived interoceptive circuits and provide a microbiome-dependent explanation for interindividual variability in exercise performance. Our study also suggests that interoceptomimetic molecules that stimulate the transmission of gut-derived signals to the brain may enhance the motivation for exercise.
Exercise is possibly the single most important and accessible lifestyle component that offers protection from a large range of diseases1. The sedentary lifestyle of modern human societies enhances the risk for metabolic, neurological and neoplastic conditions, highlighting the urgent need for targeted efforts to reverse this trend. The ability to exercise is the result of a complex interplay between the musculoskeletal system, cardiovascular and respiratory factors, and the motivational state2. In this study, we tested the exercise performance of deeply profiled, genetically and metagenomically diverse outbred mice and performed exercise studies during gnotobiotic and neurobiological intervention. We identified a metabolite-triggered gut–brain connection that regulates the motivation for exercise, linking the intestinal microbiome to midbrain dopamine signalling via afferent sensory neurons.
Metagenomic impact on exercise performance
To identify new regulators of exercise performance, we used a cohort of 199 diversity outbred (DO) mice for which the genomes were derived from eight defined intercrossed genetic backgrounds3. We deeply profiled this cohort by single nucleotide polymorphism genotyping, serum metabolomics, 16S ribosomal DNA (rDNA) sequencing of stool samples and multiparameter metabolic analysis (Fig. 1a), resulting in over 10,500 collected data points per mouse and close to 2.1 million data points in total. Subsequently, the mice underwent exercise profiling by either voluntary running in wheels or endurance running on treadmills. All mice were untrained before exercise. The performance data revealed marked variability between animals in both treadmill and wheel running (Fig. 1b,c and Extended Data Fig. 1a,b).
Fig. 1 |. The impact of the intestinal microbiome on exercise performance in genetically and metagenomically diverse mice.
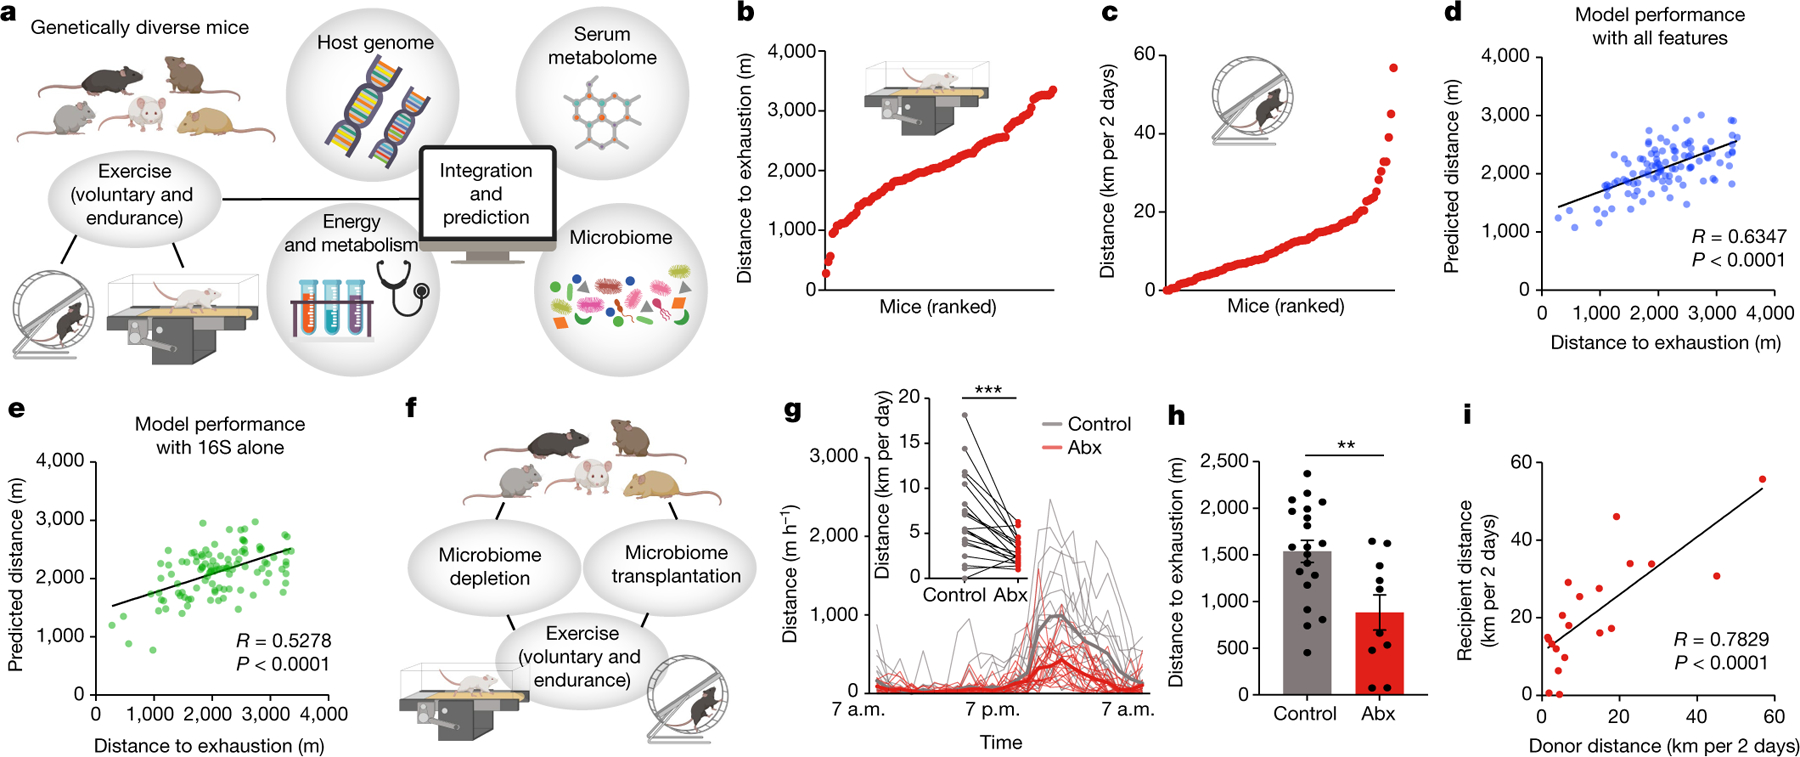
a, DO mice were profiled for genome, microbiome, metabolome and energy metabolism and assessed for exercise performance. b,c, Diversity of performance parameters on a treadmill (b) and running wheels (c). d,e, Algorithm-predicted versus measured treadmill distance based on a model including all assessed non-genetic features (d) and only features from 16S rDNA sequencing (e). f, Schematic of interventions to test for microbiome causality in DO mice. g,h, Wheel (g) and treadmill (h) running of DO mice treated with antibiotics (Abx). i, Correlation of treadmill running by donors and recipients of microbiome transfers from DO mice to germ-free mice. Error bars indicate means ± s.e.m. **, P < 0.01; ***, P < 0.001. Exact n and P values are presented in Supplementary Table 2.
To explore the factors underlying this variability, we first focused on the host genome. To this end, we genotyped the mice, constructed a genetic kinship matrix (Extended Data Fig. 1c), performed genome-wide association studies for each treadmill parameter (Extended Data Fig. 1d) and calculated narrow-sense heritability. For each endpoint, heritability was rather low (below 0.2, Extended Data Fig. 1e), consistent with previous estimates4 and suggesting that the genetic contribution to interindividual variability in exercise capacity was minor.
We thus turned to non-genetic parameters and assessed their relative contribution to exercise performance. Serum metabolomes, intestinal microbiome composition and metabolic parameters varied widely across the animal cohort (Extended Data Fig. 1f–o and Supplementary Table 1). We used a machine-learning approach to identify variables with a strong predictive contribution to exercise performance, again by using treadmill parameters as the endpoint. We trained a gradient-boosting decision trees algorithm with all available features to predict treadmill performance (Fig. 1d and Extended Data Fig. 1p,q). To identify features driving these predictions, we categorized all variables into ‘metagroups’ and determined their relative contribution (Extended Data Fig. 1r). Notably, a prediction based solely on 16S rDNA sequencing results achieved accuracies that were almost as high as those achieved with the serum metabolome or all measured parameters combined, despite encompassing a much smaller number of variables (Fig. 1e and Extended Data Fig. 1s–w). By contrast, major metabolic and behavioural features did not correlate with endurance capacity (Extended Data Fig. 1x–z).
Recent reports have highlighted a potential role for the intestinal microbiome in influencing exercise performance5–8, but its overall importance and underlying mechanisms remain unclear. To determine how much of the interindividual variability in exercise performance of DO mice was driven by the microbiome, we performed loss-of-function (microbiome depletion) and gain-of-function (microbiome transplantation) experiments (Fig. 1f). Microbiota ablation with broad-spectrum antibiotics diminished exercise performance on both running wheels (Fig. 1g and Extended Data Fig. 2a) and treadmills (Fig. 1h and Extended Data Fig. 2b–d). Transfer of microbiome samples from DO mice to germ-free mice led to a strong correlation between running wheel performances of donors and recipients (Fig. 1i). These results suggest a strong functional contribution of the microbiome to exercise capacity in DO mice.
To identify taxonomic elements of the microbiome that drive its contribution to physical performance, we turned to isogenic C57BL/6J mice, which allowed us to vary only microbiome parameters, while keeping all other factors constant. We first tested for microbiome causality in multiple orthogonal approaches. Microbiome ablation by broad-spectrum antibiotics reduced both treadmill and running wheel performance by about 50% (Fig. 2a,b and Extended Data Fig. 2e–i). To ascertain that these observations were not owing to potential side effects of oral antibiotics, we performed exercise tests under sterile conditions with germ-free mice, which showed a similarly reduced performance (Fig. 2c,d and Extended Data Fig. 3j–n). The microbiome dependency of optimal exercise performance was observed in both male and female mice (Extended Data Fig. 2e–i, o–s). Importantly, cessation of antibiotic treatment, as well as conventionalization of germ-free mice, fully restored the performance (Extended Data Fig. 2t–aa), indicating that the impact of microbiome ablation on exercise is acute and reversible. The effect of microbiome depletion was specific to exercise and did not affect movement in general, as neither home cage nor open field locomotion was impaired in antibiotic-treated mice (Extended Data Fig. 3a–e).
Fig. 2 |. Members of the microbiota contributing to exercise performance.
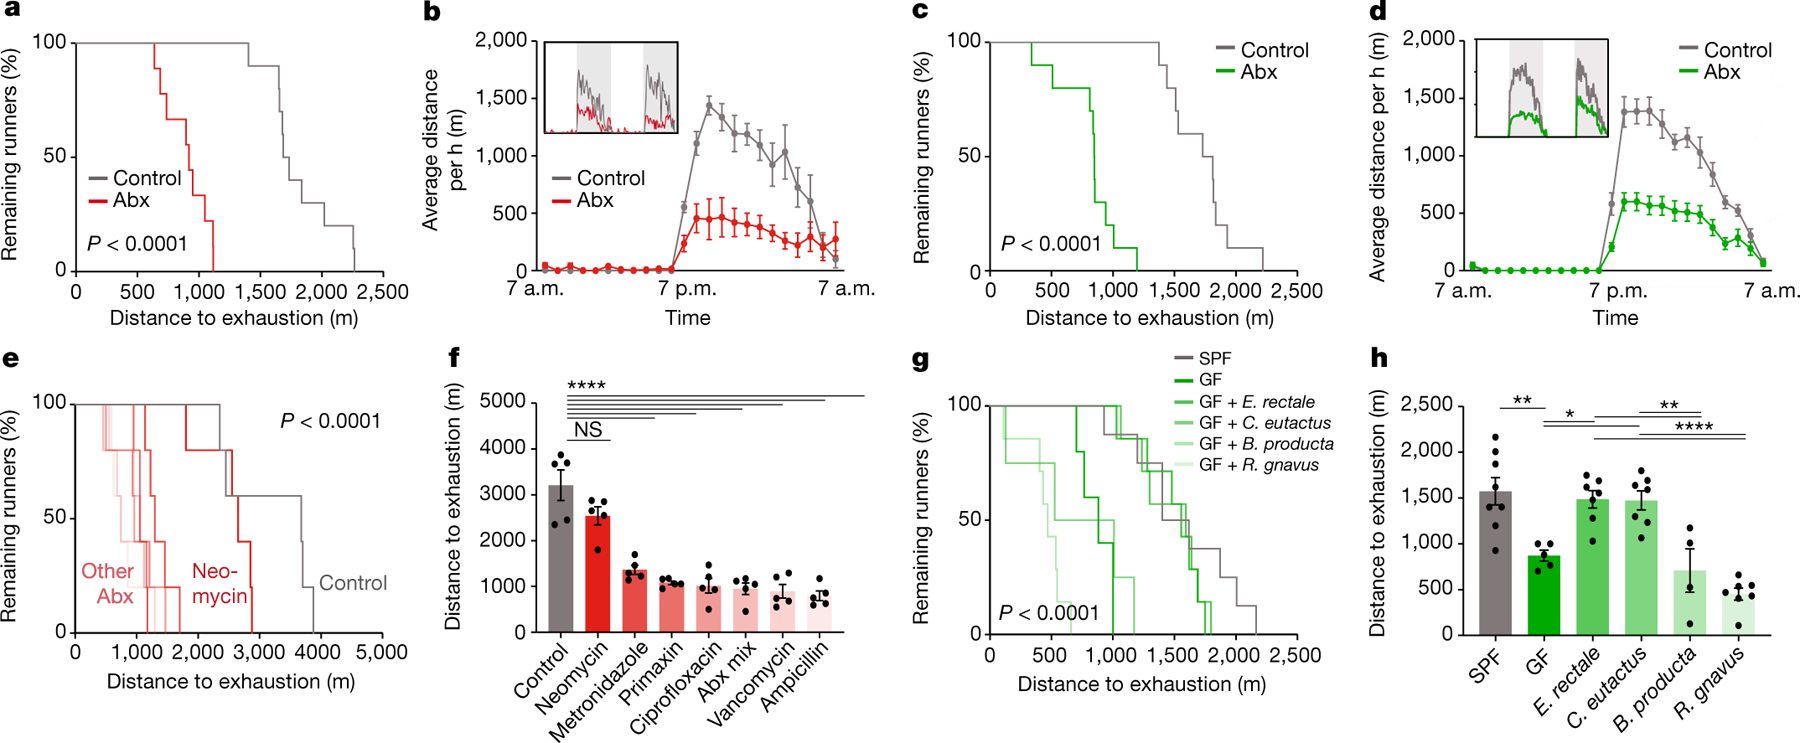
a, Kaplan–Meier plot of distance on treadmill of broad-spectrum antibiotic (Abx)-treated mice and controls. b, Averaged hourly distance of voluntary wheel activity of Abx mice and controls. Inset shows representative recording traces. c, Kaplan–Meier plot of distance on treadmill of germ-free (GF) mice and controls. d, Averaged hourly distance of voluntary wheel activity of GF mice and controls. Inset shows representative recording traces. e,f, Kaplan–Meier plot (e) and quantification (f) of distance on treadmill of mice treated with the indicated antibiotics. g,h, Kaplan–Meier plot (g) and quantification (h) of distance on treadmill of SPF mice, GF mice and GF mice mono-colonized with the indicated bacterial species. Error bars indicate means ± s.e.m. NS, not significant; *, P < 0.05; **, P < 0.01; ****, P < 0.0001. Exact n and P values are presented in Supplementary Table 2.
To narrow down possible members of the microbiome involved in the phenotype, we next reduced the spectrum of antibiotic combinations that we administered. Treatment with either only absorbable or only non-absorbable antibiotics similarly reduced treadmill running (Extended Data Fig. 3f–i), further excluding possible systemic side effects. When we applied each antibiotic individually at doses that did not affect body weight (Extended Data Fig. 3j), all antibiotics except for neomycin impaired performance in both the treadmill and wheel settings (Fig. 2e,f and Extended Data Fig. 3k–n). Consistently, germ-free mice reconstituted with faecal microbiome samples from neomycin-treated donors (which showed normal running ability) reached treadmill parameters of those reconstituted with samples from fully colonized conventional animals, whereas germ-free recipients of microbiome samples from ampicillin-treated donors (which showed diminished exercise performance) performed worse (Extended Data Fig. 3o–s). These results suggest that certain taxonomic elements of the microbiome are both necessary and sufficient for exercise regulation. To identify such taxonomic elements, we performed 16S rDNA sequencing of mice treated with neomycin and ampicillin (Extended Data Fig. 3t and Supplementary Table 1) and performed a comparative analysis of the results alongside those obtained from the DO cohort. We evaluated contributions of individual microbiome features in our predictive model by using SHapley Additive exPlanation (SHAP)9. We first ranked all variables from the microbiome metagroup (Extended Data Fig. 1r) by their mean absolute SHAP values, which nominated several members of the Erysipelotrichaceae and Lachnospiraceae families as possible drivers of exercise performance (Extended Data Fig. 3u). This was in line with Erysipelotrichaceae being resistant to neomycin but sensitive to ampicillin and thus positively correlated with running activity after microbiome transfer to germ-free mice (Extended Data Fig. 3v,w). We then tested the contribution of individual species by performing mono-colonization experiments in gnotobiotic mice. We inoculated germ-free mice with a member of the Erysipelotrichaceae family contributing to the prediction of exercise performance (Eubacterium rectale), a member of the Lachnospiraceae family likewise involved in the prediction of exercise (Coprococcus eutactus), a member of the Lachnospiraceae family with no predictive value for exercise (Blautia producta) and a taxonomically distinct member of the microbiota with high predictive power (Ruminococcus gnavus). We verified successful mono-colonization by 16S quantitative PCR (qPCR) and sequencing (Extended Data Figure 3x,y and Supplementary Table 1) and then exercised the recipient mice on treadmills. Eubacterium and Coprococcus enhanced exercise performance compared to germ-free mice, reaching levels that are comparable to conventionally colonized mice, whereas Blautia and Ruminococcus did not (Fig. 2g,h and Extended Data Fig. 3z,aa). Together, these data demonstrate the causative role of the microbiome in regulating exercise performance and highlight certain members of the Erysipelotrichaceae and Lachnospiraceae families as possible taxonomic contributors.
Microbiome impact on striatal dopamine
We next sought to determine the mechanisms by which the microbiome influences exercise performance. Based on previous reports, we hypothesized that an intact microbiome was required for optimal muscle function8,10. Indeed, we noted a reduction in the mass of the soleus, gastrocnemius and tibialis anterior muscles in antibiotic-treated mice (Extended Data Fig. 4a–c), whereas the extensor digitorum longus was not affected (Extended Data Fig. 4d). However, ex vivo tests of muscle function, oxygen consumption or transcriptomics did not reveal major effects of antibiotic treatment (Extended Data Fig. 4e–s), suggesting that the pronounced effect of the gut microbiome on voluntary and endurance exercise may not be mediated by changes in muscle physiology.
A major contributor to exercise performance apart from musculoskeletal function is the motivational state11. A brain region critically involved in motivated behaviour and the initiation of physical activity is the striatum. To explore the impact of the microbiome on the striatal response to exercise, we performed single-nucleus RNA-sequencing (RNA-seq) of the striatum of antibiotic-treated mice before and after treadmill exercise. We sequenced a total of 44,100 cells and identified cell types based on canonical markers (Extended Data Fig. 5a–h). We then focused on the neuronal population and identified the major groups of medium spiny neurons expressing the dopamine receptors D1 and D2 (Fig. 3a and Extended Data Fig. 5i). We noted that the expression of immediate-early genes, such as Arc and Fos, was strongly elevated by exercise; however, this elevation was dampened in the absence of the microbiome (Fig. 3b,c and Extended Data Fig. 5j,k). These data suggest that intestinal microbial colonization is important for exercise-triggered activation of the striatum.
Fig. 3 |. The microbiome impacts exercise-induced dopamine responses in the striatum.
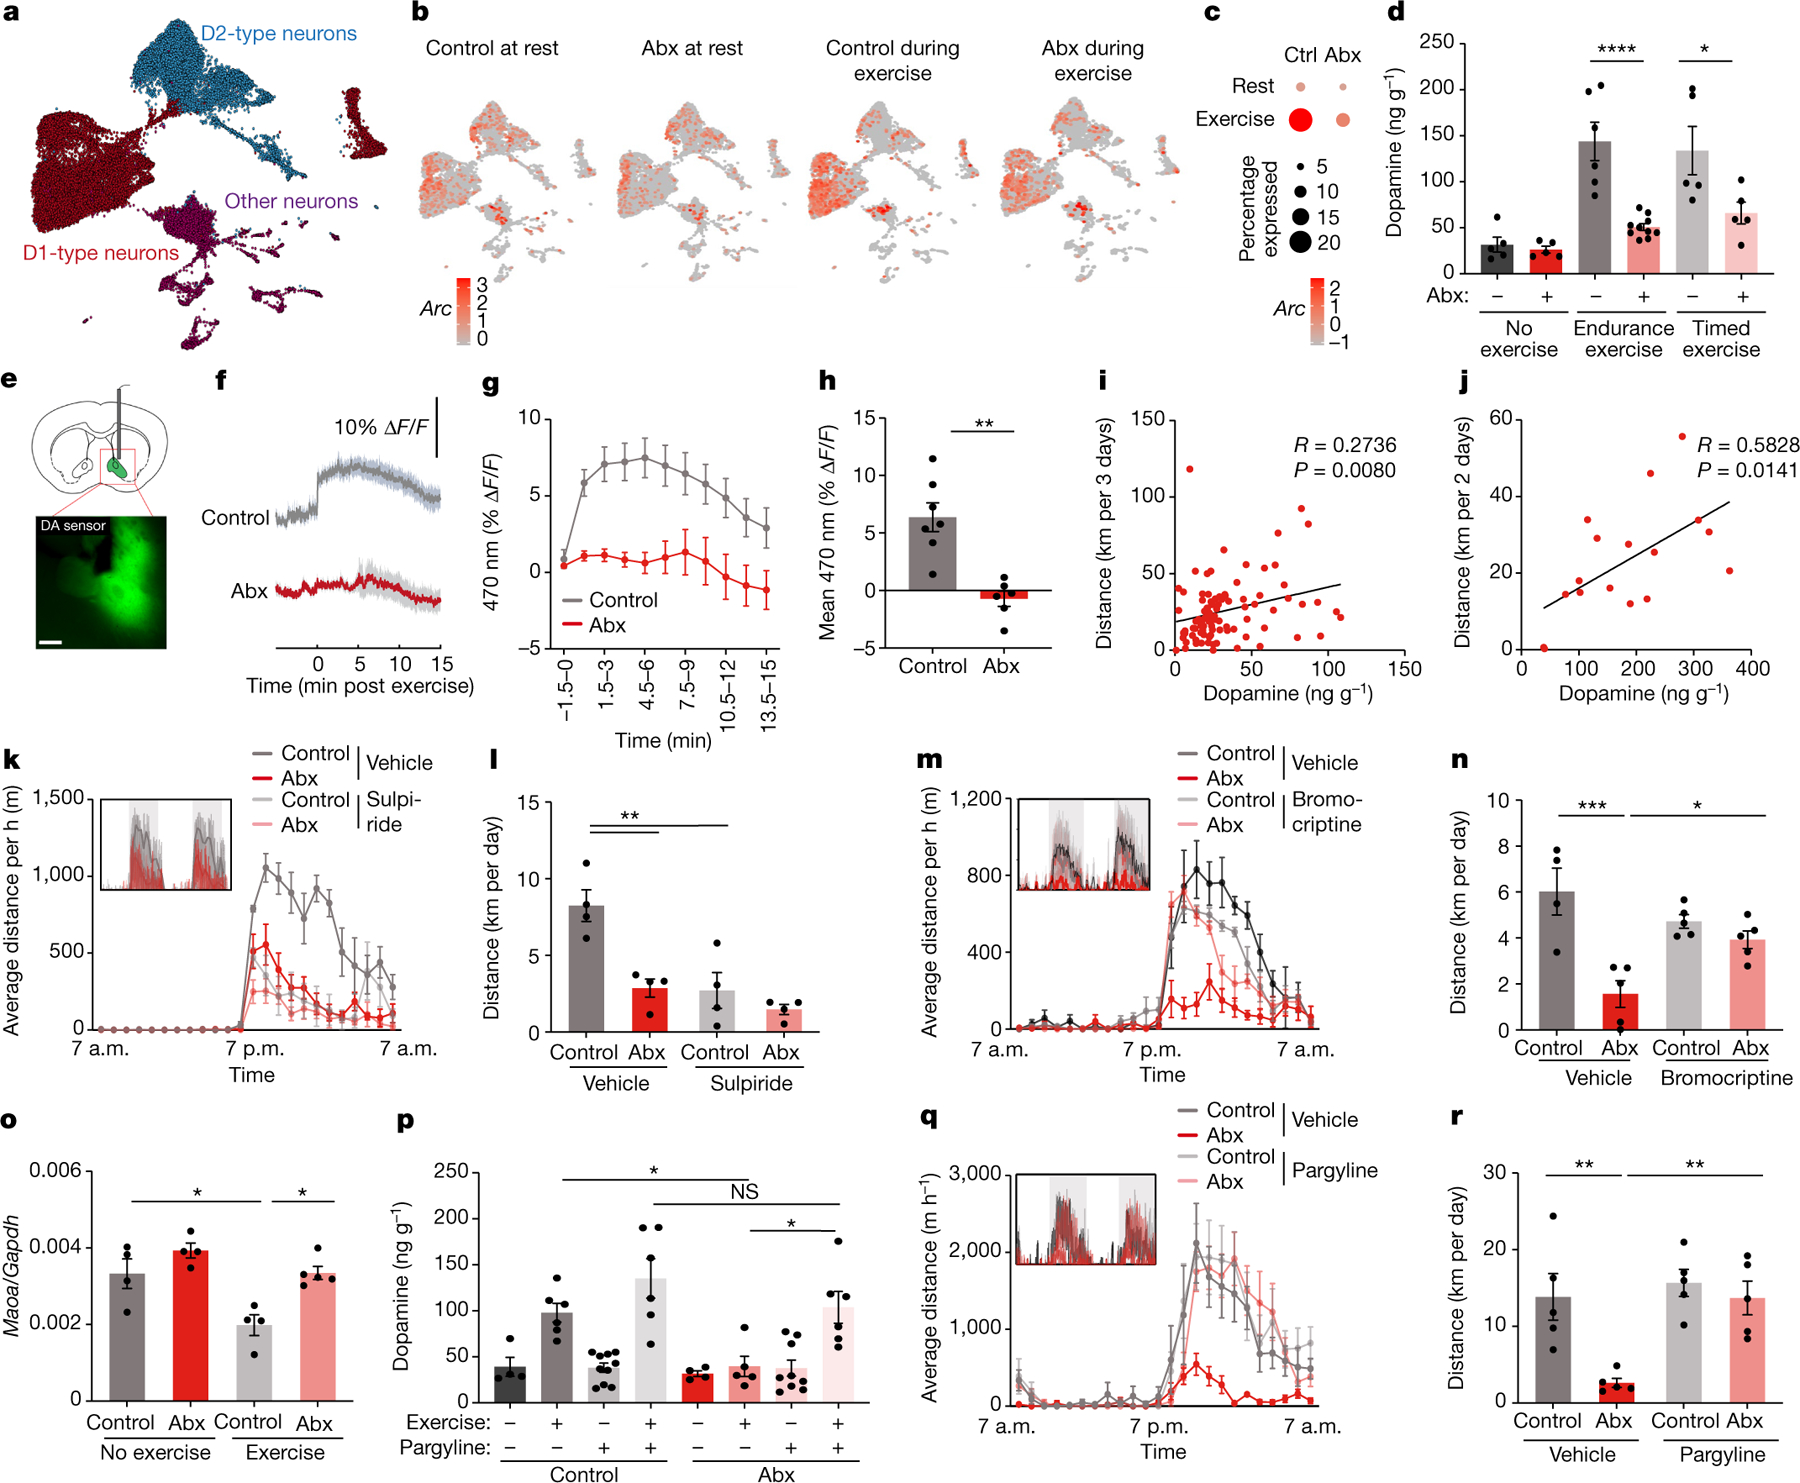
a, Uniform Manifold Approximation and Projection (UMAP) plot of neurons from single-nucleus RNA-seq of the striata of control and Abx-treated mice before and during exercise. b,c, UMAP plots (b) and quantification (c) of Arc expression in striatal neurons from control and Abx-treated mice before and during exercise. d, Dopamine levels in the brains of Abx-treated mice and controls, at steady state, after exhaustion from endurance exercise and after 60 min of timed exercise. e–h, Schematic (e), recording traces (f), quantification (g) and mean signals (h) of fibre photometry recording of a dopamine sensor injected into the nucleus accumbens. Mice were recorded at the end of the exercise protocol. i,j, Correlation of striatal dopamine concentration and distance ran in voluntary exercise by DO mice (i) and germ-free recipients of microbiota samples from DO mice ( j). k–n, Averaged hourly distance (k,m) and quantification (l,n) of voluntary wheel activity of Abx-treated mice injected with sulpiride (k,l) or bromocriptine (m,n). Insets show representative recording traces. o, Expression of Maoa in the striatum before and after exercise in control and Abx-treated mice. p, Dopamine levels in the brain of Abx-treated and control mice, both steady state and post-exercise, injected intraperitoneally with vehicle or the MAO inhibitor pargyline. q,r, Averaged hourly distance (q) and quantification (r) of voluntary wheel activity of Abx-treated mice injected with the MAO inhibitor pargyline. Inset shows representative recording traces. Error bars indicate means ± s.e.m. *, P < 0.05; **, P < 0.01; ***, P < 0.001; ****, P < 0.0001. Exact n and P values are presented in Supplementary Table 2.
Given that striatal medium spiny neurons are controlled by dopamine, which is a critical regulator of the drive for physical activity12, we next measured striatal dopamine levels in microbiome-depleted mice. As expected, striatal dopamine levels were increased after exercise. Notably, this elevation was blunted in microbiome-depleted mice (Fig. 3d), indicating that intestinal microbial colonization is required for efficient post-exercise dopamine release. This was not owing to the reduced exercise capacity of microbiome-deficient mice, as the dopamine response was likewise decreased when the exercise protocol was terminated before the first animal became exhausted (Fig. 3d). Real-time measurements of dopamine levels, by using a fluorescent dopamine sensor (Fig. 3e and Extended Data Fig. 6a), demonstrated a rapid and sustained upregulation of dopamine in the ventral and dorsal striatum following different durations of exercise (Extended Data Fig. 6b–d). Strikingly, this dopamine response was nearly eliminated in antibiotic-treated animals (Fig. 3f–h), further emphasizing the importance of the microbiome for striatal dopamine responses to physical activity. An impaired striatal dopamine response was only observed in the exercised state, whereas basal levels of dopamine were unaffected by the microbiome (Fig. 3d), consistent with intact basal locomotion in antibiotic-treated mice (Extended Data Fig. 3a–e). Other major striatal neurotransmitters, such as glutamate and acetylcholine, were neither affected by exercise nor the microbiome (Extended Data Fig. 6e,f).
We next evaluated whether the exercise-triggered dopamine response was mechanistically involved in the performance-stimulating effect of the microbiome. First, evidence came from the finding that post-exercise striatal dopamine levels correlated with wheel running in DO mice (Fig. 3i). Second, germ-free mice receiving exercise-enhancing microbiome transplantations, either from top-performing DO mice or from conventionally colonized C57BL/6 mice, also exhibited elevations in dopamine levels (Fig. 3j and Extended Data Fig. 6g). Third, inhibition of dopamine signalling, either by the pharmacological dopamine receptor antagonist sulpiride or by chemogenetic inhibition of dopaminergic neurons in the ventral tegmental area (VTA), phenocopied the effect of microbiome depletion (Fig. 3k,l and Extended Data Fig. 6h–m). Furthermore, activation of dopamine signalling by the pharmacological dopamine receptor agonist bromocriptine restored the exercise performance of antibiotic-treated mice (Fig. 3m,n). These experiments suggest that striatal dopamine signalling is an important mediator of the microbiome impact on exercise activity.
We thus sought to explore the mechanisms whereby microbiome ablation impaired exercise-induced dopamine levels in the striatum. Given the importance of dopaminergic VTA neurons in striatal activity regulation, we monitored their activity dynamics by using calcium imaging during exercise (Extended Data Fig. 6n). However, we did not observe any antibiotic-induced differences in calcium flux (Extended Data Fig. 6o–r), making it unlikely that the impact of the microbiome on dopamine levels and physical performance was mediated by differences in VTA neuron activity. Consistently, administration of leptin, which has been shown to inhibit the rewarding effects of exercise via the VTA13, had an additive effect with microbiome ablation in exercise suppression (Extended Data Fig. 7a–d). We next considered the possibility that dopamine levels might be post-synaptically influenced by differential turnover in the striatum. Dopamine degradation is regulated by the enzyme monoamine oxidase (MAO)14. Notably, striatal expression of Maoa was supressed in exercising mice, which did not occur in the absence of the gut microbiome (Fig. 3o). We thus hypothesized that sustained MAO levels are responsible for the blunted dopamine response to exercise in microbiome-depleted mice and that blockade of MAO would normalize dopamine signalling. Indeed, pharmacological MAO inhibition enhanced exercise-induced dopamine levels and restored running performance in antibiotic-treated mice (Fig. 3p–r and Extended Data Fig. 7e–h). These results suggest that intestinal microbial colonization enhances exercise-induced dopamine signalling in the striatum by limiting MAO-driven dopamine turnover.
Exercise regulation by sensory neurons
We next asked how intestinal microbial colonization impacts midbrain dopamine levels. Signal transduction from the intestinal lumen to the brain can occur either through circulating factors, such as microbial metabolites, or through afferent neuronal circuits15. We first focused on humoral factors, given that we observed markedly altered serum metabolite profiles in antibiotic-treated mice (Extended Data Fig. 7i). However, the correlations between microbiome-dependent and exercise-associated metabolites in the DO cohort were weak and did not yield any strong candidate humoral mediator (Extended Data Fig. 7j).
We thus focused on gut-innervating afferent sensory neurons. We used denervated Trpv1DTA mice, which lack a large fraction of spinal and vagal afferent neurons that express the vanilloid receptor TRPV1 (ref. 16). Notably, Trpv1DTA mice were impaired in their exercise capabilities in a similar manner as microbiome-depleted mice on both running wheels and treadmills, and antibiotic treatment did not further modulate their exercise performance (Fig. 4a–d and Extended Data Fig. 7k,l). A similar impairment of exercise performance was observed after chemogenetic silencing of TRPV1-expressing neurons (Extended Data Fig. 7m–p). Activation of TRPV1+ afferent neurons with low doses of the TRPV1 agonist capsaicin restored wheel and treadmill running in antibiotic-treated mice (Fig. 4e,f and Extended Data Fig. 7q–t).
Fig. 4 |. The microbiome influences exercise performance via afferent sensory neurons.
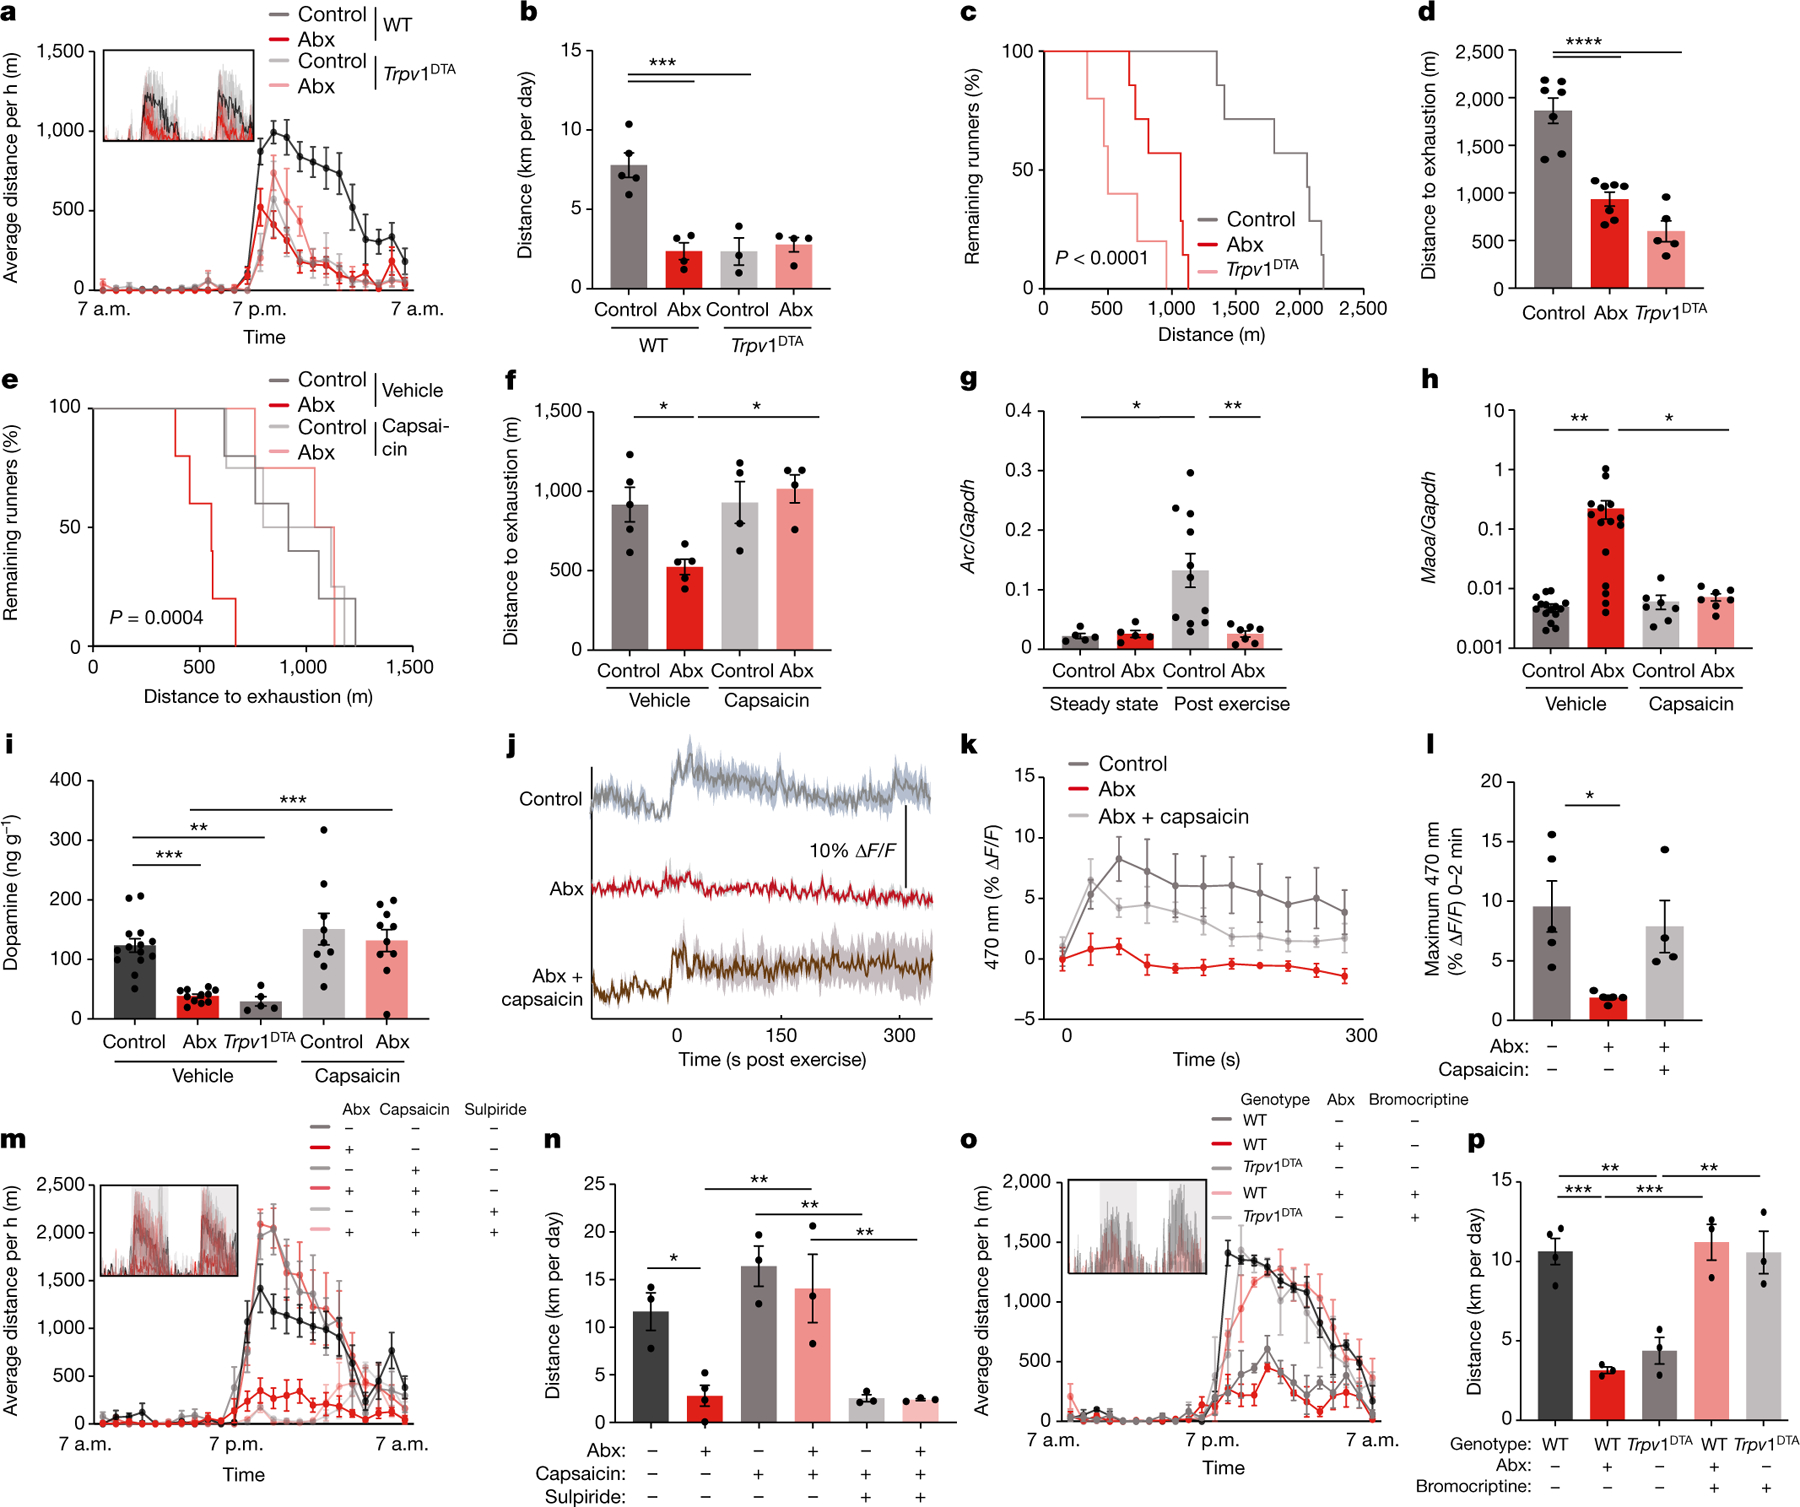
a,b, Averaged hourly distance (a) and quantification (b) of voluntary wheel activity of wild-type (WT) and Trpv1DTA mice, with and without Abx treatment. Inset shows representative recording traces. c,d, Kaplan–Meier plot (c) and quantification (d) of distance on treadmill of controls, Abx-treated mice and Trpv1DTA mice. e,f, Kaplan–Meier plot (e) and quantification (f) of treadmill distance of Abx-treated mice and controls, with or without capsaicin treatment. g, Expression of Arc in the DRG of sedentary and post-exercise mice, with or without Abx treatment. h, Expression of Maoa in the striatum of post-exercise Abx-treated and control mice, with or without capsaicin treatment. i, Dopamine levels in the brain of control mice, Abx-treated mice and Trpv1DTA mice, with or without capsaicin treatment. j–l, Recording traces ( j), quantification (k) and maximal signals (l) of post-exercise Abx-treated mice and controls, with or without capsaicin treatment. m,n, Averaged hourly distance (m) and quantification (n) of voluntary wheel activity of Abx-treated mice and controls, with or without capsaicin and sulpiride treatment. o,p, Averaged hourly distance (o) and quantification (p) of voluntary wheel activity of Abx-treated and Trpv1DTA mice, with or without bromocriptine treatment. Insets show representative recording traces. Error bars indicate means ± s.e.m. *, P < 0.05; **, P < 0.01; ***, P < 0.001; ****, P < 0.0001. Exact n and P values are presented in Supplementary Table 2.
Given that TRPV1 is broadly expressed by sensory neurons, we sought to determine whether spinal or vagal afferents were the primary mediator of the microbiome impact on exercise. To this end, we examined dorsal root ganglia (DRG) and nodose ganglia (NG) from exercising mice. We noted that treadmill running induced neuronal activity, as indicated by cFos, in TRPV1+ neurons (Extended Data Fig. 8a–c). Antibiotic treatment reduced exercise-induced neuronal activation in DRGs, but not NGs (Fig. 4g and Extended Data Fig. 8d–i), suggesting that the spinal pathway was more sensitive to microbiome-derived signals. Consistently, ablation of gut-innervating vagal afferents by NG injection of the cholecystokinin-conjugated neurotoxin saporin (CCK–SAP)17 did not affect running capacity (Extended Data Fig. 9a,b), whereas severing of gut-innervating spinal afferent fibres by surgical removal of the celiac/superior mesenteric ganglion (CSMG) reduced exercise performance similar to microbiome ablation (Extended Data Fig. 9c–j).
To explore whether stimulation of sensory neurons affected the MAO-dopamine pathway, we measured Maoa transcripts and post-exercise dopamine levels in the striatum. We found that capsaicin treatment restored both Maoa transcripts and normal dopamine levels in microbiome-depleted mice, whereas Trpv1DTA mice showed post-exercise dopamine levels that were as low as in mice lacking an intact microbiome (Fig. 4h,i). Similarly, CSMG removal elevated Maoa expression and suppressed dopamine levels (Extended Data Fig. 9k,l). Real-time recording of a dopamine sensor in the nucleus accumbens of the ventral striatum confirmed that post-exercise striatal dopamine levels were rescued by peripheral administration of capsaicin (Fig. 4j–l and Extended Data Fig. 9m). To determine whether the exercise-stimulating effect of capsaicin functionally depended on dopamine signalling, we first compared striatal dopamine levels with exercise performance on the level of individual animals and found a high degree of correlation (Extended Data Fig. 9n). We then co-treated microbiome-depleted and control mice with capsaicin and sulpiride, to inhibit dopamine signalling while stimulating afferent neurons. Importantly, sulpiride treatment blocked the exercise-enhancing effect of capsaicin (Fig. 4m,n), indicating that dopamine signalling was indeed required. Furthermore, dopamine receptor stimulation with bromocriptine bypassed the requirement for the microbiome and afferent sensory neurons and fully restored wheel running in Trpv1DTA and in antibiotic-treated mice (Fig. 4o,p). Collectively, these findings demonstrate that the impact of the microbiome on dopamine levels in the striatum and exercise performance requires TRPV1+ neurons.
Exercise regulation by gut metabolites
Next, we investigated possible mechanisms by which the microbiome shapes the activity of gut-innervating sensory nerves to influence exercise performance. To simulate sensing of luminal components by afferent neurons, we exposed isolated DRG neurons in vitro to stool extracts from antibiotic-treated mice, germ-free mice and conventionally colonized controls and recorded their activity by calcium imaging. The stimulatory potential was reduced in extracts from microbiome-deficient mice (Fig. 5a and Extended Data Fig. 9o), suggesting that a luminal component may be sensed by DRG neurons. Similarly, luminal content from germ-free mice showed reduced DRG neuron stimulation compared to colonized controls, which was reversible upon conventionalization of germ-free mice (Extended Data Fig. 9p,q). To explore whether DRG neuron stimulation by microbiome products was associated with striatal dopamine levels and exercise performance, we used stool extracts from the DO cohort and tested them for DRG neuron-stimulatory capacity. We observed a wide range in calcium signals, which correlated with both activity-induced dopamine release in the striatum and exercise performance (Extended Data Fig. 9r–u).
Fig. 5 |. Peripheral endocannabinoids drive exercise performance.
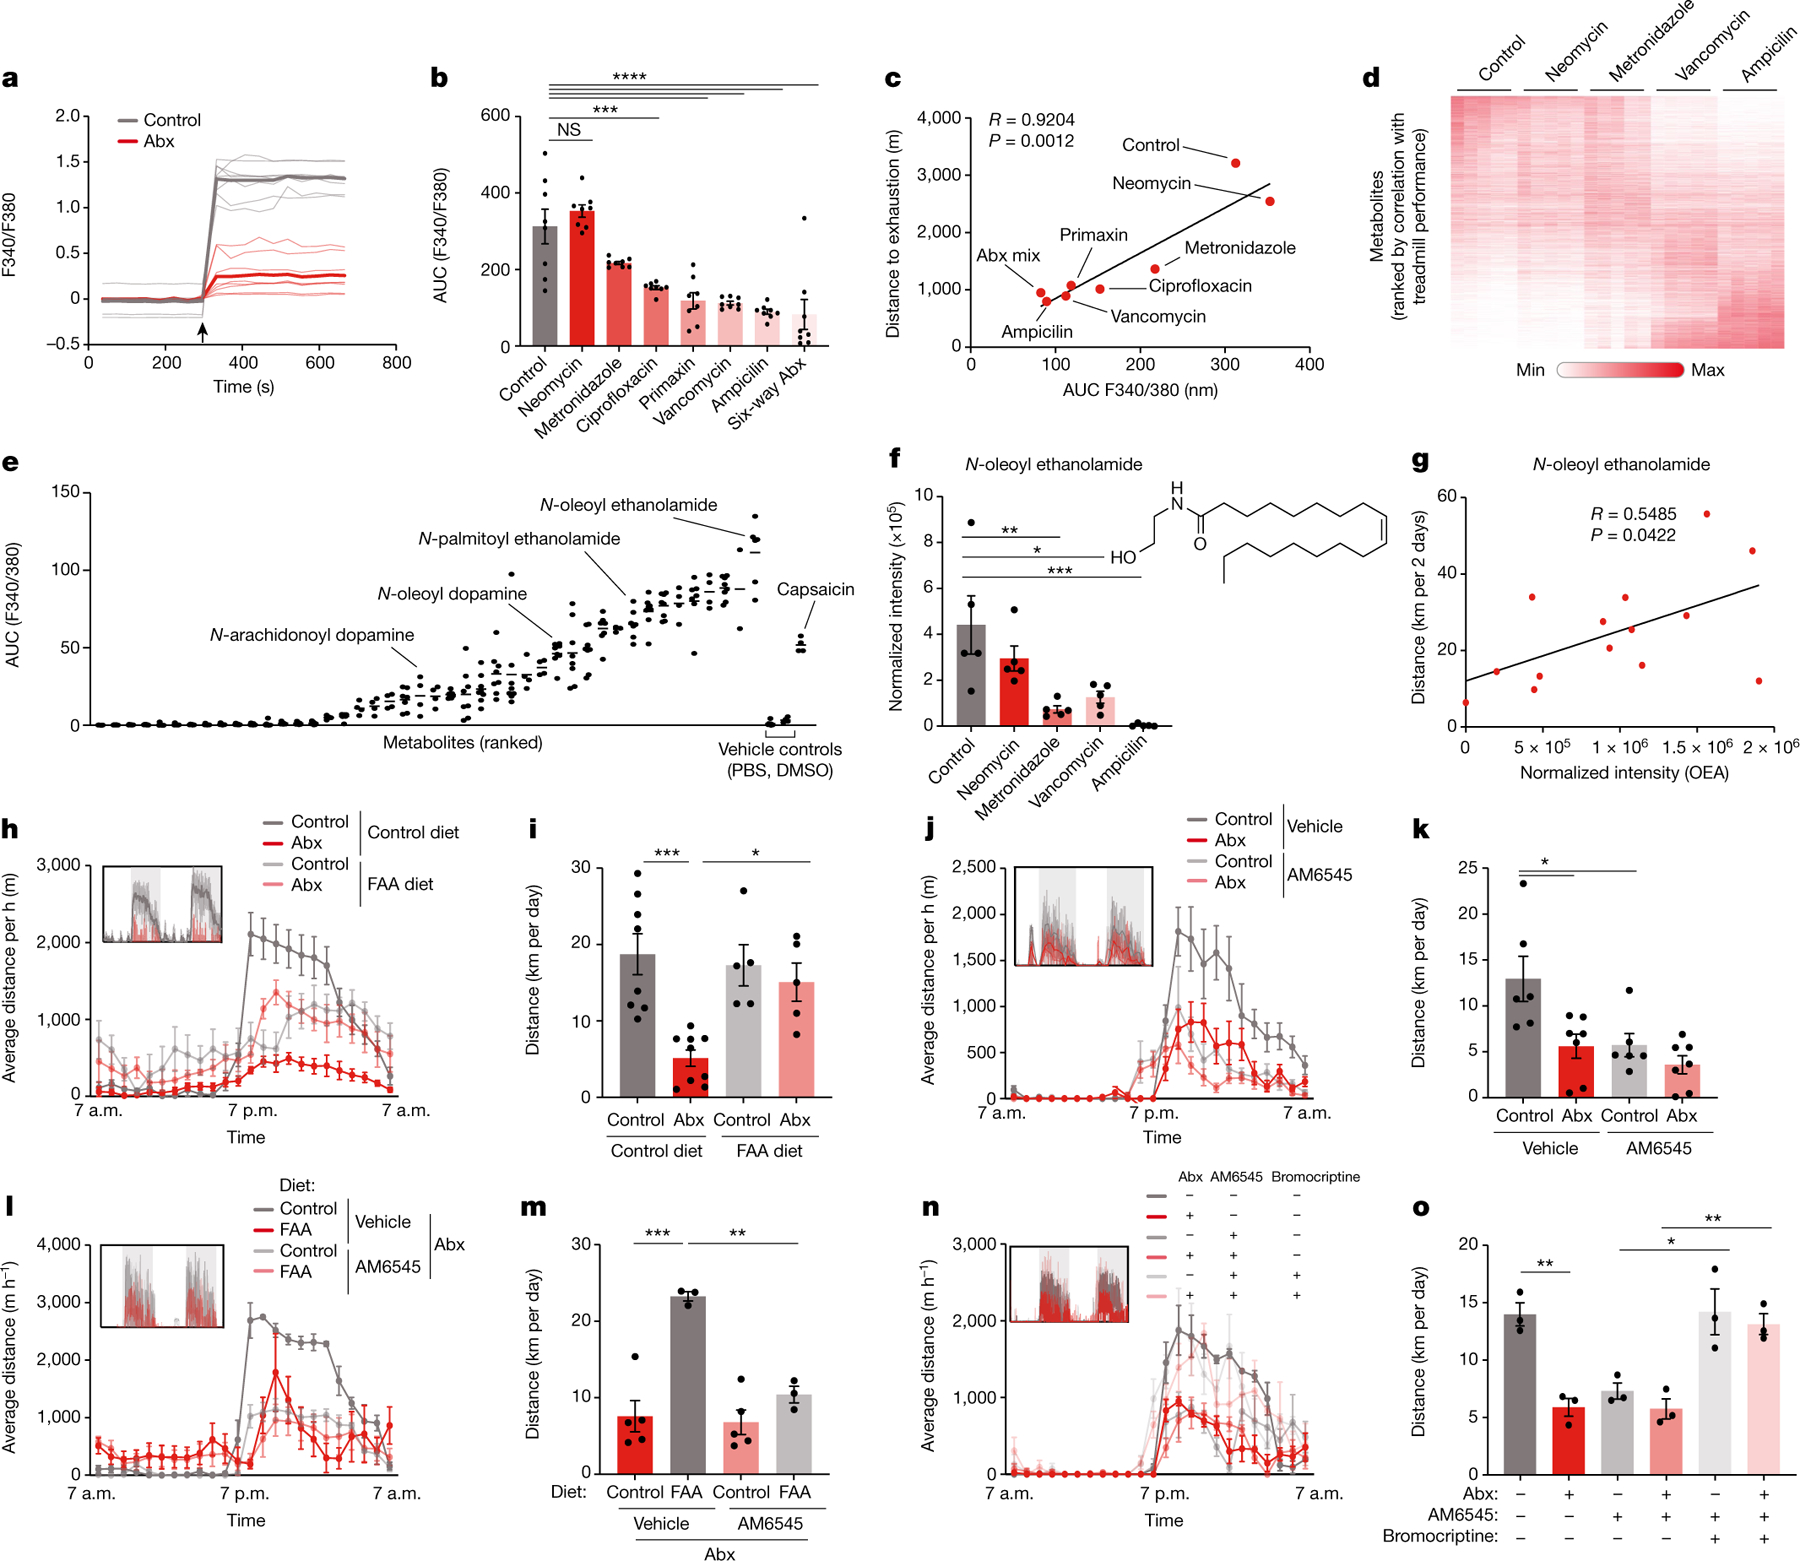
a, Recording traces of calcium imaging of DRG neurons exposed to stool filtrates from Abx-treated mice and controls. Arrow indicates treatment time. b,c, Quantification (b) and correlation with treadmill distance (c) of calcium imaging of DRG neurons exposed to stool filtrates from mice treated with different Abx. Arrow indicates treatment time. d, Heatmap of metabolites detected in caecal contents from mice treated with different Abx. e, Quantifications of calcium imaging of DRG neurons exposed to individual metabolites. f, Normalized abundance of OEA in caecal contents from mice treated with different Abx. g, Correlation between OEA abundance and wheel running in DO mice. h–o, Averaged hourly distance (h,j,l,n) and quantification (i,k,m,o) of voluntary wheel activity of Abx mice and controls, fed a FAA-supplemented or control diet (h,i,l,m), with or without treatment with the peripheral CB1 antagonist AM6545 ( j–o) and the dopamine receptor agonist bromocriptine (n,o). Insets show representative recording traces. Error bars indicate means ± s.e.m. *, P < 0.05; ** P < 0.01; *** P < 0.001; ****, P < 0.0001. Exact n and P values are presented in Supplementary Table 2.
To identify specific microbiome components that stimulate DRG neurons, we again used our strategy of differential antibiotic treatment. We first exposed DRG neurons to stool extracts from mice on different antibiotics and observed that the calcium signal strongly correlated with the exercise performance of the animals (Fig. 5b,c and Extended Data Fig. 9v). We then performed untargeted metabolomics and correlated the results with exercise parameters (Fig. 5d). We screened candidate molecules for their ability to activate calcium signalling in DRG neurons (Fig. 5e and Extended Data Fig. 9w). Interestingly, among the most potent metabolites were numerous fatty acid amides (FAAs), such as N-oleoylethanolamide (OEA), the DRG-stimulatory activity of which was comparable to that of capsaicin (Fig. 5e and Extended Data Fig. 9x,y). OEA levels were depleted by those antibiotics that impaired exercise performance and correlated with wheel running in DO mice (Fig. 5f,g), suggesting that FAA metabolites such as OEA may stimulate sensory neurons to promote physical activity.
To determine whether FAAs are sufficient to restore exercise capacity in the absence of the microbiome, we pursued a dietary supplementation approach. We selected five FAAs with DRG-stimulatory activity (Extended Data Fig. 10a,b) and supplemented them to a rodent diet (Extended Data Fig. 10c,d). When fed to antibiotic-treated mice, this FAA diet recovered the ability of stool extracts to induce neuronal calcium signalling (Extended Data Fig. 10e,f). Strikingly, it also restored DRG activity, striatal Maoa expression, dopamine levels and exercise performance in the absence of the microbiome (Fig. 5h,i and Extended Data Fig. 10g–l). It likewise enhanced running capacity in microbiome-ablated DO mice (Extended Data Fig. 10m–o). Given that OEA has been shown to stimulate dopamine release in the context of dietary reward18, we asked whether gastric infusion of FAAs was sufficient to recapitulate the effects of exercise on dopamine levels in the striatum. In sedentary mice, we did not observe a dopamine response to FAA infusion. However, upon treadmill exercise, intestinal FAAs potentiated the dopamine release induced by physical activity (Extended Data Fig. 10p,q). These results suggest that intestinal FAAs enhance the motivation for exercise.
Next, we investigated whether FAA production by the microbiome can account for its performance-stimulating effect. Elevated OEA levels in germ-free mice mono-colonized with exercise-enhancing bacteria suggested that microbiota production of FAAs might stimulate running performance (Extended Data Fig. 11a). Interestingly, certain commensal microorganisms, including Eubacterium from the Erysipelotrichaceae family and Coprococcus from the Lachnospiraceae family, have recently been found to contain a biosynthetic gene cluster responsible for FAA biosynthesis19. To test whether the presence of this gene cluster in the microbiome was sufficient to enhance exercise, we generated an Escherichia coli strain containing the essential genes of the cluster and colonized germ-free mice with E. coli strains that either harboured the FAA biosynthetic gene cluster or the empty vector (Extended Data Fig. 11b). We first verified that the gene cluster endowed E. coli with the ability to produce FAAs like OEA in vivo and to stimulate calcium signalling in DRG neurons (Extended Data Fig. 11c–e). We then exercised the mono-colonized mice to determine the impact of the engineered strain on physical activity. Notably, while the empty vector control strain did not improve the performance of germ-free mice, the FAA-producing strain enhanced running on both wheels and treadmills (Extended Data Fig. 11f–k). These findings highlight that a microbial gene cluster enabling the production of a metabolite family can influence host exercise capacity.
Finally, we explored the mechanisms by which intestinal FAAs may stimulate sensory neurons and their impact on exercise motivation. Several FAA metabolites serve as agonists of the endocannabinoid receptor CB1, which is expressed by TRPV1+ DRG neurons (Extended Data Fig. 11l, m)20,21. These observations thus raised the possibility that stimulation of CB1 by FAAs may drive sensory neuron activity, striatal dopamine release and exercise performance. Consistent with this hypothesis, CB1-deficient mice showed diminished DRG neuron activity in response to exercise, reduced striatal dopamine and impaired exercise capacity (Extended Data Fig. 11n–t), in line with previous findings22. Similarly, the CB1 receptor antagonist O-2050 inhibited wheel running, whereas the CB1 receptor agonist CP55,940 enhanced performance (Extended Data Fig. 12a–d). To disentangle the impact of peripheral CB1 signalling from endocannabinoid effects on the brain, we used the peripherally restricted CB1 inhibitor AM6545 (ref. 23), which phenocopied the effects of CB1 deficiency and resulted in a similar exercise impairment as microbiome ablation (Fig. 5j,k and Extended Data Fig. 12e–h). Importantly, the impact of intestinal interventions that enhance exercise, such as dietary supplementation of FAAs and mono-colonization with FAA-producing E. coli, was abolished by co-treatment with AM6545, indicating that these interventions act through peripheral CB1 signalling (Fig. 5l,m and Extended Data Fig. 12i–m). We wondered whether the impact of peripheral CB1 stimulation on exercise was mediated by dopamine signalling in the striatum. Indeed, AM6545 treatment elevated Maoa expression and blunted the exercise-induced surge of dopamine (Extended Data Fig. 12n,o). Furthermore, AM6545-treated mice regained full exercise capacity when receiving dopamine receptor stimulation with bromocriptine (Fig. 5n,o), demonstrating that the impact of peripheral CB1 signalling on exercise was mediated by dopamine.
Discussion
Adherence to the World Health Organization recommendation of at least 150 min of physical activity per week would greatly reduce the global burden of disease24. But exercise is strenuous and requires, in addition to cardiovascular and respiratory fitness, a strong motivational state in professional, recreational or therapeutic settings alike25. In this study, we demonstrate that the brain circuitry involved in regulating the motivation for physical activity is not strictly central nervous system autonomous but is shaped by peripheral influences that originate in the intestinal microbial community, suggesting a possible mechanistic basis for understanding interindividual variability in exercise motivation and performance.
We have integrated deeply profiled, genetically and metagenomically diverse mice, exercise trials under gnotobiotic conditions, neurobiological interventions and metabolomics to uncover the impact of the intestinal microbiome on brain circuits involved in exercise performance. Our results show that the gut microbiome contributes to the generation of intestinal FAA metabolites that trigger CB1-expressing TRPV1+ sensory neurons, which in turn send an exercise-induced afferent signal to the brain and promote the downregulation of MAO expression in the striatum. This downregulation of MAO contributes to higher levels of dopamine and enhanced exercise capability (Extended Data Fig. 12p). In the absence of the microbiome, the afferent signal is inhibited, MAO levels are sustained and thus the exercise-induced surge in dopamine is blunted, with profound consequences for physical performance.
These findings have several important implications. First, they suggest that the neurochemical effects underlying the ‘runner’s high’, the phenomenon of pleasure, reward, anxiolysis and analgesia that is driven by endocannabinoid release after prolonged physical activity26, might be influenced by the gastrointestinal tract. Consistently, we found that the analgesic effects of exercise are likewise dependent on intestinal microbial colonization and on peripheral CB1 signalling (Extended Data Fig. 12q,r), indicating that the pathway discovered in this study may regulate additional aspects of exercise physiology. Evolutionarily, the regulation of exercise-induced reward and motivation circuits by gut metabolites may serve to couple nutrient availability and the state of intestinal microbial colonization to the readiness and capacity to engage in prolonged physical activity.
Second, these results extend our knowledge about neuronal pathways communicating between the gut and the striatum. Our study demonstrates that this communication is enhanced by exercise and that the impact of exercise on the striatum is shaped by intestinal metabolites. It also shows that exercise-induced activity of spinal sensory neurons drives striatal dopamine signalling through the regulation of MAO. Thus far, our investigations do not uncover the precise (polysynaptic) circuitry by which sensory neuron activity regulates the expression of MAO in the striatum. More detailed insights into the neuronal identity and the polysynaptic circuit that controls forebrain MAO levels will provide a more precise handle on the modulation of this critical enzyme by non-invasive strategies focused on the gastrointestinal tract.
Finally, our study demonstrates that mesolimbic dopamine-dependent reward and motivation circuits can be modulated via an interoceptive pathway that originates in the gastrointestinal tract. This discovery may suggest that other behaviours that are dependent on striatal dopamine signalling could likewise be modifiable through lifestyle interventions, diet or metabolite supplementation. It thus paves the way for the more general concept of ‘interoceptomimetics’—molecules that stimulate afferent sensory pathways and thereby influence brain activity by peripheral intervention. If applicable to humans, our findings imply that interoceptomimetics that stimulate the motivation for exercise might present a powerful opportunity to counteract the detrimental health impact of a sedentary lifestyle.
Methods
No statistical methods were used to predetermine sample size. The experiments were not randomized and investigators were not blinded to allocation during experiments and outcome assessment.
Mice
Animals were obtained from The Jackson Laboratory and housed at the University Laboratory Animal Resources facility of the University of Pennsylvania. Mice were kept under strict light–dark cycles, with lights being turned on at 7 a.m. and turned off at 7 p.m.
The following mouse strains were purchased from The Jackson Laboratory: C57L/6J (stock. No. 000664), B6.SJL-Slc6a3tm1.1(cre)Bkmn/J (stock No. 006660), B6.129-Trpv1tm1(cre)Bbm/J (stock No. 017769), B6.129P2-Gt(ROSA)26Sortm1(DTA)Lky/J (stock No. 009669), B6.129-Gt(RO SA)26Sortm1(CAG−CHRM4*,−mCitrine)Ute/J (stock No. 026219) and J:DO (stock No. 009376). Cnr1-deficient mice were provided by G. Kunos (National Institutes of Health). All purchased mice were kept in the local animal facility for three weeks upon delivery and before experimental procedures.
In all experiments, age- and sex-matched littermates were used. Mice were 8–9 weeks of age at the beginning of experiments. Both male and female mice were used for experiments but, within each experiment, they were sex-matched. Mice were housed at 22.2 °C and 52.1% humidity. Mice were given access to food and water ad libitum and were maintained under a 12 h light–dark cycle. All mice were maintained in filter-topped cages and given autoclaved food and water. All experiments used cohoused littermates to ensure consistency of common microbiota and genetic background. No methods were used to predetermine sample sizes but, instead, sample sizes were determined by pilot experiments to assess effect sizes and variability. The precise numbers of animals used in each experiment are provided in Supplementary Table 2.
For antibiotic treatment, mice were given a combination of neomycin (1 g l−1), ampicillin (1 g l−1), vancomycin (0.5 g l−1), metronidazole (0.5 g l−1), imipenem (0.5 g l−1) and ciprofloxacin (0.2 g l−1) in their drinking water for three weeks. Stool samples were collected fresh for each individual mouse in 2 ml eppendorf tubes and immediately snap-frozen in liquid nitrogen before storage at −80 °C until DNA extraction. For antibiotic treatment with only absorbable antibiotics, mice were given a combination of metronidazole, ciprofloxacin and ampicillin; for non-absorbable antibiotic treatment, mice were given a combination of neomycin, vancomycin and imipenem. In the antibiotic cessation experiment mice were treated with broad-spectrum antibiotics for two weeks and upon successful bacterial depletion mice were given back free access to drinking water for four weeks. Mice were tested for endurance exercise performance after full microbial recolonization, which was verified by 16S qPCR.
For germ-free experiments, C57BL/6 mice were born and raised in isolators under sterile conditions at the University of Pennsylvania Gnotobiotic Animal Facility. Sterility was ensured by periodic microbiological checks. For microbiota transplantation experiments, three to five stool pellets from each donor group were collected, transferred to an anaerobic chamber, homogenized in 1.5 ml of phosphate-buffered saline (PBS−/−) and filtered through 70 μm filters. We then gavaged 250 μl of filtrates into germ-free recipient mice that were housed in sterile isocages upon colonization. Exercise tests were performed two weeks after microbial colonization.
All animal procedures were performed in accordance with protocols approved by the Institutional Animal Care and Usage Committee of the University of Pennsylvania Perelman School of Medicine.
Endurance exercise
To assess the maximal performance of each mouse, a forced endurance exercise experiment was performed by using treadmills with increasing speed and inclination (Exer-6; Columbus Instruments). The experiments were conducted under constant supervision. The protocol was started with an adjustment period, in which each mouse was placed into a treadmill lane (lanes 1 to 6) for 10 min. At this stage, the speed was 0 m min−1 and incline 0°. After 10 min, the treadmill started accelerating by 0.1 m min−1 to a final speed of 5 m min−1 and the mice ran at this speed for 20 min with 0° incline. The treadmills then accelerated every 20 min by another 2.5 m min−1 and every hour the inclination was increased by 5°. The maximum possible speed was 25 m min−1 and the maximum inclination was 15°. Mice that failed to continue the protocol fell onto a metal grid at the end of treadmill belt and were encouraged to resume running with a mild electric shock. Every second spent on the metal grid was counted. A mouse was considered exhausted once it accumulated 50 visits (50 s) to the metal grid. The distance and time to exhaustion were recorded.
Voluntary wheel exercise
Voluntary exercise was performed in single housed cages with free access to a running wheel (Coulbourn Instruments, catalogue No. ACT-551-FIL-MS-SS). Before experiment and data acquisition, mice were given three days of adjustment to the single housed setup and wheel presence. Data were acquired every 15 s, 1 min or 15 min from each mouse by a Panlab recording system and software. In experiments in which pharmacological modulators were administered, the baseline for each mouse was recorded for three consecutive days and then, based on the experiment, mice were intraperitoneally injected daily between 5 and 7 p.m. with pharmacological modulators or vehicle, and data were acquired for another seven days following the specific treatments below. For exercise under gnotobiotic conditions, exercise equipment was introduced into germ-free isolators.
Gastric catheter implantation
Mice were treated with subcutaneous analgesics meloxicam (5 mg kg−1), bupivacaine (2 mg kg−1) and buprenorphine (1 mg kg−1). Mice were anesthetized in an incubation chamber with isoflurane (3%) and transferred to a sterile drape, and then received continuous isoflurane (1–2%) administered through a nose cone. An intrascapular incision and an abdominal incision were made and the catheter was directed subdermally to the abdomen. A midline abdominal incision through the muscle was made and the stomach was isolated. Catheter tubing (7 mm length, Braintree Scientific, MRE-033) with an epoxy ball (Devcon Clear Epoxy Adhesive, 92926, Lowers) was inserted through a puncture hole in the fundus of the stomach and secured with surgical mesh (5 mm diameter piece, Bard, 0112660). Surgical mesh secured the other end of the catheter at the intrascapular incision and a metal cap sealed the exposed tubing. Mice were fed moistened chow and daily body weight was monitored until presurgical weight was regained. The gastric catheter was periodically flushed with water to prevent blockage. Mice were given at least two weeks to recover from surgery before starting experiments.
Central and gastric infusions
Catheters were connected to tubing and syringes regulated by an infusion pump (Harvard Apparatus, 703007). Gastric infusions were performed at a rate of 0.1 ml min−1 until a total volume of 0.2 ml was infused. Sterile water was used to flush catheters before and after experiments to prevent clogging. Central infusions were microinjected with a Hamilton syringe attached to an internal cannula cut 4.7 mm below the pedestal (Plastics One) by using a microlitre syringe pump. Central infusions were performed at a rate of 0.0024 ml min−1 until a total volume of 100 nl was infused.
Celiac-superior mesenteric ganglionectomy
To determine splanchnic contributions to gut–brain sensing, splanchnic afferents underwent a gangliectomy at the prevertebral celiac and superior mesenteric ganglia. Mice were anesthetized and treated with analgesia and an abdominal midline incision was made through skin and muscle. The celiac and superior mesenteric arteries were exposed by targeting the aorta at the arterial branching point medial to the left kidney. At the intersection of the three blood vessels, celiac and superior mesenteric ganglia and the surrounding tissue were gently teased away until the area between was cleared of nerve and lymphatic tissue. In sham animals, the area was exposed and a small tear was made in the lymphatic tissue, but the ganglia were left intact. Mice were given at least one week to recover and regain presurgical weight.
CCK–SAP treatment
Mice were anesthetized with isoflurane (2–5%). After hair removal and disinfection, an incision was made in the neck area and the sternohyoid and sternomastoid muscle connective tissue blunt dissected and moved aside to expose the carotid artery. The vagus nerve was gently exposed and followed to reach the nodose ganglion as it enters the foramen. The glass micropipette was advanced into the ganglion and CCK–SAP (catalogue No. IT-31, Advanced Targeting Systems, CA) or blank-SAP (catalogue No. IT-21) were injected (125 ng in 0.5 μl per ganglion). The procedure was repeated on the other side and the incision was closed by using a nylon suture. Mice were monitored until fully awake when they were placed back in the home cage. Analgesics (5 mg kg−1 Loxicom, SC) was administered once a day for the next 2 days.
Stereotaxic surgery, viral injections and fibre optic implantations
Viral injection.
Viral injections were performed as previously described27. In brief, mice were pretreated with subcutaneous injections of Meloxicam (5 mg kg−1, Norbrook Laboratories, 29-040-11) and bupivacaine (2mg kg−1, Moore Medical, 52683). Mice were anesthetized with isoflurane (3%, Clipper, 0010250) and placed into a stereotaxic frame (Stoelting, 51725D) with continuous isoflurane (1–2%). For VTA fibre photometry, 200 μl of AAV1-Syn-Flex-GCaMP6f-WPRE-SV40 was injected unilaterally at the following coordinates: bregma −3.2 mm, midline ± 1.2 mm and skull −4.4 mm at a 10° angle from the vertical in the medial/lateral axis. For nucleus accumbens and dorsal striatum fibre photometry, 200 μl of AAV9-hSyn-GRAB_DA1h was injected unilaterally at the following coordinates: nucleus accumbens: bregma +1.0 mm, midline ± 1.2 mm and skull −4.1 to 4.0 mm; dorsal striatum: bregma +1.0 mm, midline ± 1.3 mm and skull −2.7 mm. A ferrule-capped optical fibre (400 mm core, numerical aperture (NA) 0.48, Doric, MF2.5, 400/430-0.48) was implanted 0.2 mm above the injection site and secured to the skull with low-auto-fluorescent cements: metabond cement (Parkell, S380) and dental cement (Lang Dental Manufacturing, Ortho-jet BCA Liquid, B1306 and Jet Tooth Shade Powder, 143069). For central infusions, a unilateral 26-gauge guide cannula cut 3 mm below the pedestal (Plastics One) was implanted above the VTA at the following coordinates: bregma −3.2 mm, midline ± 1.2 mm and skull −2.6 mm at a 10° angle from the vertical in the medial/lateral axis. The cannula was secured to the skull with bone screws and dental cement, and capped to prevent clogging. Mice were given at least two weeks for recovery and viral expression before experiments were performed.
The following recombinant adeno-associated virus vectors were used: AAV1-Syn-Flex-GCaMP6f-WPRE-SV40 (Addgene No. 100833, titre 4.216 × 10¹³ GC ml−1) and AAV9-hSyn-GRAB_DA1h (Addgene No. 113050 2.4 × 10¹³ GC ml−1); Syn, Synapsin promoter; hSyn, human Synapsin 1 promoter; SV40, sequence motif promoting polyadenylation and termination; Flex, Cre-dependent flip-excision switch; WPRE, woodchuck hepatitis virus response element; GCaMP, genetically encoded calcium indicator resulting from a fusion of GFP, M13 and Calmodulin; GRAB, G protein-coupled receptor activation-based dopamine sensor; and DA1h, dopamine 1 high affinity.
Fibre photometry.
GCaMP6 was imaged by using dual-wavelength fibre photometry as we have previously described27,28. GRAB DA1m was imaged by using identical parameters except that the 405 nm wavelength was not used. In brief, for dual-wavelength fibre photometry, two excitation wavelengths (470 nm and 405 nm) were modulated at 211 and 566 Hz to avoid contamination from overhead lights and crosstalk between excitation lights. Excitation illumination was generated through fibre-coupled light-emitting diodes (LEDs) (Thorlabs, M470F3 and M405F1) and modulated by a real-time amplifier (Tucker–Davis Technologies, RZ5P or RZ10X). Excitation lights were filtered and combined by a fluorescence mini cube (Doric, FMC4_IE(400-410)_E(460-490)_F(500-550)_S). The combined excitation light was delivered through a 400 μm core, NA 0.48, low-fluorescence optical fibre (Doric, MFP_400/430/1100-0.48_1.5_FCM-MF) to an implanted fibre (Doric, MFC_400/430-0.66_6.5mm_MF2.5_FLT) secured by using a clamp (Thorlabs, ADAF2). LED power was set between 20 and 40 μW emitted from the fibre tip to minimize bleaching. GCaMP6f emission fluorescence was collected through the mini cube and focused onto a femtowatt photoreceiver (Newport, Model 2151, gain set to d.c. LOW). Fluorescence was sampled at 1,017 Hz and demodulated by the processor. LEDs were externally controlled by Synapse (Tucker–Davis Technology) and synchronized cameras (Ailipu Technology, ELP-USB-100W05MT-DL36) were used to video record mice during experiments.
Photometry during exercise.
A motorized treadmill (Exer-6; Columbus Instruments) was used for exercise experiments. All mice were habituated to the treadmill for three days before exercise: habituation day 1: 3 h rest on treadmill; habituation day 2: 2 h rest on treadmill followed by 15 min at 6 m min−1, 5 min at 8 m min−1 and 5 min at 10 m min−1; habituation day 3: 1 h rest on treadmill followed by 15 min at 10 m min−1, 5 min at 8 m min−1 and 15 min at 10 m min−1.
Mice were placed on the treadmill for a 1 h acclimation period before recordings. Following acclimation, recording began while mice were still stationary and running began 5 min later. Mice ran for 10 min at 10 m min−1. The treadmill was stopped and recording continued for 15 min following the run. Recordings were aligned to the end of exercise to plot traces, calculate average ∆F/F and calculate the maximum and mean ∆F/F after exercise. Mice underwent one or two baseline recordings separated by at least 24 h. They were then treated daily with 200 μl antibiotics via oral gavage for seven days, followed by another photometry session on the treadmill. In a subset of mice, 200 μl of 2 μM capsaicin was then administered intraperitoneally for four days. During these four days, antibiotics were given in the drinking water. A third photometry session was performed immediately following last capsaicin injection on the fourth day.
Fibre photometry analysis.
Data were exported to MATLAB (Math-Works) from Synapse by using a script provided by Tucker–Davis Technology. Custom MATLAB scripts were used to independently normalize the demodulated 470 nm and 405 nm signals. ∆F/F was calculated (F − Fbaseline)/Fbaseline, with Fbaseline being the median of the 300 s before the stimulus. Data were down-sampled to 1 Hz. Subsequent plotting and analysis were performed in MATLAB and Prism v.8 (GraphPad). Mean ∆F/F was calculated by integrating ∆F/F over a 5 min period after the end of exercise in the ventral striatum or over a 2 min period after the end of exercise in the VTA and then dividing by the integration time. Maximum ∆F/F values were calculated by taking the maximum ∆F/F value for each mouse over a 2 min period after the end of exercise.
Dietary supplementation
FAAs were supplemented into a normal chow diet (Teklad, NIH-07 Open formula mouse/rat diet (meal), catalogue No. 7022M). The mix contained 50 mg of each of the following metabolites: palmitoyl-dopamine (PALDA, Cayman Chemical Company, catalogue No. 10007697), N-arachidonoyl dopamine (NADA, Cayman Chemical Company, catalogue No. 90057), N-oleyol dopamine (NODA, Cayman Chemical Company, catalogue No. 10115), OEA (Cayman Chemical Company, catalogue No. 90265) and palmitoyl ethanolamide (Cayman Chemical Company, catalogue No. 90350). The mix was added into 250 g diet powder and supplemented with 250 ml of sterile water. A homogenous dietary mixture was distributed to singly housed mice and fed for the duration of five days. Control diet mice were fed the same diet (7022M) without metabolites being supplemented.
Hot plate test
A hot plate was preheated to 56 °C for 15 min before the experiment. Mice were placed on the plate after completion of an exercise protocol. Latency was recorded as the time until a mouse starts licking its paws.
Open field test
Mice were handled one day before testing and acclimated to the room for 30 min before testing. Mice were placed into a 40 × 40 cm2 box and allowed to explore for 15 min. Movement was recorded during the last 5 min of the trial with an iPhone 11 and analysed by using EthoVision software v.15 (Noldus).
Metabolic cage measurement
Food intake and other metabolic parameters were measured by using CLAMS cages (Columbus Instrument), which consist of a combination of sensitive feeding sensors for automated measurement, a photobeam-based activity monitoring system that records ambulatory movements, including rearing and climbing, as well as sensors for the detection of oxygen and carbon dioxide consumption in each cage. All parameters were measured continuously and simultaneously. Mice were trained singly housed in identical cages before data acquisition.
Pharmacological modulators
In experiments that used pharmacological modulators of dopamine receptor activity, bromocriptine (Sigma Aldrich, catalogue No. 1076501-150MG) was administered daily for five days by intraperitoneal injection at a concentration of 5 mg kg−1 body weight. Sulpiride (Sigma Aldrich, catalogue No. S8010-25G) was administered daily by intraperitoneal injection at a concentration of 15 mg kg−1 body weight for one week. Experiments involving mice with a knock-in chemogenetic human muscarinic receptor 4 (hM4Di, Jackson laboratory, stock No. 026219) were intraperitoneally injected daily with the DREADD agonist clozapine N-oxide hydrochloride (CNO, Cayman Chemical Company, catalogue No. 25780–25) at a concentration of 1 mg kg−1 body weight.
In experiments targeting CB1, mice were injected daily intraperitoneally with CB1 agonist CP55940 (Sigma Aldrich, catalogue No. C1112-10MG) at a concentration of 1 mg kg−1 for one week or CB1 antagonist O-2050 (Neta Scientific, catalogue No. C760X52) at a concentration of 10 mg kg−1 body weight. In experiments in which the peripheral CB1 antagonist AM6545 was used, mice were daily injected intraperitoneally at a concentration of 3 mg kg−1 body weight.
The MAO inhibitor pargyline hydrochloride (Sigma Aldrich, catalogue No. P8013-1G) was injected intraperitoneally every other day for eight days at a concentration of 150 mg kg−1 body weight. For specific TRPV1 stimulation, capsaicin (Sigma Aldrich, catalogue No. M2028-250MG) was injected intraperitoneally daily with 200 μl of 2 μM concentration for one week.
Leptin (Novus Biological, catalogue No. NBP2-76247-1mg) was centrally injected into the VTA 5 min before exercise at a total quantity of 200 ng. Systemic leptin injection was administered intraperitoneally at a concentration of 1 mg kg−1 body weight before exercise.
DRG extraction, culture and calcium imaging
DRG were extracted and cultured as previously described29. The lumbar DRGs from the mice were collected into Neurobasal-A medium (Thermofisher, catalogue No. 10888022). DRGs were dissociated in 1 mg ml−1 collagenase 1A (Gibco, catalogue No. 17100017) for 1 h at 37 °C in serum-free media containing advanced Dulbecco’s modified eagle medium (Corning, catalogue No. MT10013CV), pyruvate solution (Corning, catalogue No. MT25000CI) and HEPES (Thermofisher, catalogue No. 15-630-080) buffered saline (Gibco, catalogue No. 10010049). DRGs were washed and triturated with glass Pasteur pipettes 60 times and centrifuged at 500g at 4 °C for 5 min. The cell pellet was resuspended into culture media (10% FBS (Corning, catalogue No. MT35-010-CV), Neurobasal-A medium, B27 supplement (Gibco, catalogue No. 17504044), 50 ng ml−1 nerve growth factor (Gibco, catalogue No. 549 13-290-010) and penicillin and/or streptomycin (Thermofisher, catalogue No. 15140122), and subsequently seeded onto poly-L-lysine (Sigma Aldrich, catalogue No. P4707-50ML) coated (at least 2 h at 37 °C, 5% CO2) 96-well plates and cultured overnight at 37 °C in a 5% CO2 incubator.
For calcium imaging, the DRGs were washed with fresh serum-free culture media and loaded with 1 μM Fura-2-AM (Thermofisher, catalogue No. F-1221) for 1 h at 37 °C. The cells were then washed into modified extracellular Ringer’s solution containing 145 mM NaCl (Sigma Aldrich, catalogue No. S7653-250G), 4.7 mM KCl (Sigma Aldrich, catalogue No. P9333-500G), 3.4 mM CaCl2 (Sigma Aldrich, catalogue No. C5670-100G), 1.2 mM KH2PO4 (Sigma Aldrich, catalogue No. P5655-100G), 1.2 mM MgSO4 (Sigma Aldrich, catalogue No. M2643-500G), 1 mM MgCl2 (Sigma Aldrich, catalogue No. M4880-100G), 10 mM glucose (Sigma Aldrich, catalogue No. G7021-100G) and 10 mM HEPES. Baseline was measured before addition of 50 μl of either 2 μM Capsaicin, 50 mM OEA or filtered stool extracts in HBSS−/− (Thermofisher, catalogue No. 14175079), which were directly applied onto neurons. Imaging was conducted immediately in a plate reader at room temperature with wavelengths set to 340, 380 and 510 nm.
DRG metabolite candidate screening.
Metabolites were prepared in concentrations of 500 μM to 5 mM, unless otherwise stated, in PBS or dimethyl sulfoxide. The following metabolites were used for DRG stimulation: sodium propionate, sodium acetate, sodium butyrate, ethanol (1%), indol-3-butyric acid (short-chain fatty acids and conjugates); ʟ-isoleucine, glycine, ʟ-methionine, ʟ-leucine, ʟ-ornithine, ʟ-alanine, ʟ-valine, ʟ-lysine, ʟ-aspartate, ʟ-glutamine, creatine, trimethyl amine, dimethyl amine, choline, acetylcholine (amino acids, amines and peptides); oleic acid, palmitic acid, linoleic acid, quinolinic acid and arachidonic acid (fatty acids); dipalmitin, dihexanoin, 1,2-dipalmitoyl-sn-glycerol-3-phosphoethanolamine, 1,2-dipalmitoyl-sn-glycerol, 1-oleoyl-3-arachidonyl-glycerol, 1,2-dipalmitoyl-sn-glycerol-3-phosphatidylcholine, 6-glycero-phospho-N-oleoylethanolamine, 2-arachidonoyl glycerol, 1-palmitoyl-3-linolenoyl-glycerol and 1,2-dipalmitoyl-sn-glycerol-3-phosphate (mono- and/or diacyl-glycerol conjugates); N-stearoyl serotonin, N-arachidonoyl dopamine, N-oleoyl dopamine, N-palmitoyl-dopamine, N-stearoyl-taurine, N-arachidonoyl ethanolamide, N-palmitoyl ethanolamide and N-oleoyl ethanolamide (FAA conjugates). Capsaicin (2 μM) was used as positive control and dimethyl sulfoxide (5%) and PBS Tween (pH 7.2) were used as respective negative controls.
RNAScope and confocal microscopy
Probes RNAscope Probe-Mm-Trpv1-C2 (catalogue No. 313331-C2) and RNAscope Probe-Mm-Fos (catalogue No. 316921) were used. Pretreatment reagent (catalogue No. 3223100, including catalogue No. 322381 and catalogue No. 322000), fluorescent detection reagents (catalogue No. 323110), TSA buffer (catalogue No. 322809) and wash buffer reagents (catalogue No. 310091) were used.
First, lumbar DRG and NG were fixed in 4% PFA/PBS for 2 h and then switched to 20% sucrose and/or PBS solution overnight. Ganglia were mounted in optimal cutting temperature compound and sectioned at a thickness of 16 μm by a cryostat. Slides were stored at −80 °C until further processing.
Slides were processed based on the manufacturer’s protocol (fixed-frozen tissue sample preparation and pretreatment) with the following modifications. In brief, slides were washed with PBS Tween for 5 min and then baked for 5 min at 37 °C. Tissues were then dehydrated, dried and treated with hydrogen peroxide. Next, we used protease IV for 20 min at room temperature. Slides were then washed with preheated washing buffer for 10 min. Preheated probes Trpv1-C2 and cFos-C1 were prepared according to the manufacturer’s instructions. TSA plus cyanine 5 was used for cFos and TSA plus cyanine 3 was used for Trvp1-C2 probes at a final dilution of 1:1,150. Finally, probes were hybridized and signals were developed based on the manufacturer’s instructions. Slides were then imaged on a Zeiss lsm710 confocal microscope at ×10 and ×20 magnification.
Muscle ex vivo physiology
Muscle physiological analysis was performed on isolated extensor digitorum longus (EDL) muscles with an Aurora Mouse 1200A System and analysed by Dynamic Muscle Control v.5.415 software. To assess ex vivo muscle physiology, a previously published protocol was used30. In brief, EDL muscles were dissected and placed into constantly oxygenated Ringer’s extracellular solution containing 100 mM NaCl, 4.7 mM KCl, 3.4 mM CaCl2, 1.2 mM KH2PO4, 1.2 mM MgSO4, 25 mM HEPES and 5.5 mM glucose at 24 °C and the pH was adjusted to 7.4–7.5.
The twitch stimulation protocol applied a single stimulus lasted 0.2 ms. Muscle length was adjusted to obtain the maximal twitch response and this length was measured and recorded as the optimal length (L0) and used as reference for upcoming power normalization.
Maximal tetanic force generation was achieved by repeated stimuli at a frequency of 120 Hz for 500 ms.
To ensure muscle recovery before the next stimulus a 5 min break was allowed. For muscle fatigue induction the muscle was stimulated every second for a duration of 8 min by using 40 Hz pulses lasting 330 ms. Following the muscle-fatigue protocol, a burst protocol of 50 maximal tetanic contractions (120 Hz for 500 ms) was applied. At this point muscle fatigue is complete and almost no power can be generated.
The recovery protocol started immediately after the last burst contraction. A maximal tetanic stimulation (120 Hz for 500 ms) was applied every 5 min for 30 min and the force recovered was expressed as the percentage of the regained and starting power. Muscle cross-sectional area was calculated as a division of EDL muscle mass by the product of the muscle density coefficient (1.06 g cm−3), muscle baseline L0 and the fibre length coefficient (0.45 specific for EDL). The specific force generated by muscle was determined by normalizing the maximum tetanic force to cross-sectional area.
Dopamine ELISA
Striata were collected in 2 ml tubes and snap-frozen in liquid nitrogen and stored at −80 °C. Brains were homogenized in PBS−/− and centrifuged at 5,000g for 10 min at +4 °C, and then 50 μl of supernatant was used for quantification of dopamine in brain tissue following the manufacturer’s instructions (BioVision, K4219-100).
Amplex fluorometry assays
One brain hemisphere was collected in 2 ml tubes and snap-frozen in liquid nitrogen for storage at −80 °C. Brains were homogenized in PBS−/− and centrifuged at 5,000g for 10 min at +4 °C, and then 50 μl of supernatant was mixed with 50 μl of sample dilution buffer and the quantification of total acetylcholine and glutamic acid were performed according to manufacturers’ protocols (Amplex Acetylcholine/Acetlycholinesterase Assay Kit, catalogue No. A12217; and Amplex Red Glutamic Acid/Glutamate Oxidase Assay Kit, catalogue No. A12221).
Bacterial gene cluster cloning
The ere bacterial gene cluster from Eubacterium rectale containing the four biosynthetic genes ereS, ereT, ereA and ereC (lipid carrier, acyl carrier/thiolation, adenylation and condensation domain) was selected for the heterologous production of FAAs. The enzymes encoded in the gene cluster were annotated as follows: EreS: sterol carrier protein-2 sterol transfer family protein; EreT: acyl carrier protein; EreA: long-chain acyl-CoA synthethases (AMP-forming); and EreC: non-ribosomal peptide synthetase19.
The DNA sequences of the biosynthetic genes ereA and ereS from Eubacterium rectale were codon optimized, synthesized and cloned into pMK-RQ and pOA-RQ by GeneArt (ThermoFisher Scientific), yielding pMK-RQ-ereA and pOA-RQ-ereS.
The ereA gene was PCR amplified with the primer pair 5’-CC CATATGCTGTTTCATACCATTCCGGATATTC-3’ and 5’-CCCTCGAG TTAGCTGCGTTTGATTTTACGG-3’ (NdeI and XhoI restriction sites are underlined) by using pMK-RQ-ereA as a template. The PCR product fragment was digested with NdeI and XhoI and ligated into the NdeI and XhoI cloning sites of pCDF-tacI/tacI by T4 DNA ligation to generate pCDF-tacI/tacI-ereA.
The ereC gene was PCR amplified with the primer pair 5’-GGAATTC CATGAAGACGAGAAAGGGACAC-3’ and 5’-CGAGCTCCTACACTAA TTTAATGATTTCGCC-3’ (EcoRI and SacI restriction sites are underlined) by using genomic DNA of Eubacterium rectale as a template. The PCR product fragment was digested with EcoRI and SacI and ligated into the EcoRI and SacI cloning sites of pCDF-tacI/tacI-ereA by T4 DNA ligation to generate pCDF-tacI/tacI-ereA-ereC.
The ereS gene was PCR amplified with the primer pair 5’-GGAATTC CCATGACCTATGCCGATATGTTC-3’ and 5’-CGAGCTCTTAGGCT TTTTTGCTATCGATGATCT G-3’ (EcoRI and SacI restriction sites are underlined) by using pOA-RQ-ereS as a template. The PCR product fragment was digested with EcoRI and SacI and ligated into EcoRI and SacI cloning sites of pCOLA-tacI/tacI by T4 DNA ligation to generate pCOLA-tacI/tacI-ereS.
The ereT gene was PCR amplified with the primer pair 5’-CC CATATGTTTGATGAATTAGTGGAAATTATC-3’ and 5’-CCCTCGAG TTATGCGTCTTTTAATGTCTCAAG-3’ (NdeI and XhoI restriction sites are underlined) by using genomic DNA of E. rectale as a template. The PCR product fragment digested with NdeI and XhoI and ligated into the NdeI and XhoI cloning sites of pCOLA-tacI/tacI-ereS by T4 DNA ligation to generate pCOLA-tacI/tacI-ereS-ereT.
The resulting constructs were introduced into E. coli BAP1, which harbours a promiscuous phosphopantetheinyl transferase required for carrier protein activation.
Bacterial cultures and inoculations
Coprococcus eutactus (Holdeman and Moore, catalogue No. 27759) and Eubacterium rectale (Hauduroy et al., catalogue No. 33656) were purchased from ATCC and grown according to ATCC protocols for 24 to 48 h at 37 °C under anaerobic conditions.
Ruminococcus gnavus and Blautia producta were obtained from M. Abt (University of Pennsylvania) and grown in ATCC media (supplemented with hemin, ʟ-cystein, vitamin K1) in an anaerobic gas chamber at 37 °C for 24 to 48 h.
E. coli WT and Escherichia coli EreA-T knock-in mutant were grown in LB media (Thermofisher scientific, catalogue No. DF0446-17-3) under facultative anaerobic conditions at 37 °C overnight. FAA production in E. coli EreA-T strain was induced by supplementation of 10 mM isopropyl-β-d-thiogalactopyranoside (catalogue No. I56000-5.0, Research Products International) in the drinking water for 5 days.
Bacteria cultures were spun down for 3 min at 2,000g. Media were decanted and pellets resuspended. Then 250 μl per mouse were gavaged. After 5 days the colonization was confirmed by 16S RT–qPCR and 16S sequencing.
DNA stool extraction, 16S ribsomal RNA library preparation and microbiota analysis
Stool collected into 2 ml tubes was snap-frozen and stored in −80 °C until DNA extraction by using the DNeasy PowerSoil Kit (Qiagen, catalogue No. 12888–100) according to the manufacturer’s instruction. DNA was amplified by using the KAPA Hifi HotStart ReadyMix (Roche, KK2602) and 16S specific primers spanning the variable regions 1 and 2 (v1/v2) of the 16S ribosomal RNA gene were generated by using the following barcoded primers: Fwd i27- TATGGTAATTGTAGAGTTTGAT CCTGGCTCAG, Rev 338-XXXXXXXXXXXXTGCTGCCTCCCGTAGGAGT, in which each X represents a barcode base. After PCR amplification, the library was sequenced by using 500 bp paired-end sequencing (Illumina MiSeq, catalogue No. MS-102-2003). The paired-end reads were processed by using the QIIME 2 pipeline. In brief, fastq files and a sample mapping file including the unique barcode sequence corresponding to each sample were used as inputs for analysis. Paired-end reads were split according to the unique barcodes and then taxonomical classification was performed by using the Greengenes database with 97% operational taxonomic unit identity. Rarefaction was used to equalize the number of reads per sample and to exclude samples with insufficient reads.
Quantification of 16S amplicons by qPCR
The 16S variable regions were targeted by combination of four unique forward primers and one common reverse primer: Fwd1: 5’-CNACGCGA AGAACCTTANC-3’, Fwd2: 5’-ATACGCGARGAACCTTACC-3’, Fwd3: 5’-CTAA CCGANGAACCTYACC-3’, Fwd4: 5’-CAACGCGMARAACCTTACC-3’ and 115–1046 Rev: 5’-CGACRRCCATGCANCACCT-3’.
DNA was amplified by using Luna Universal qPCR Master Mix (New England Biolabs, catalogue No. M3003E) by using the following protocol: 12.5 μl of mix was combined with 0.5 μl of each forward and 2 μl of reverse primer, and then 4.5 μl of undiluted DNA was added. The E. coli K12 WT strain was used as an internal standard for absolute bacterial quantification.
Single-nucleus RNA-seq
For single-nucleus RNA-seq (SNuc-Seq), striatum was dissected from antibiotic-treated and SPF mice both at steady state and after exercise. Nuclei isolation was performed as previously described31. Sorted nuclei were then immediately encapsulated into droplets, libraries prepared by using the 10X Genomics platform and single-end sequencing performed on a NextSeq 550 instrument using the 75-cycle kit. Binary base call files were demultiplexed, aligned to the mouse mm10 genome and filtered; the unique molecular identifiers were counted by using CellRanger software (10X Genomics) and downstream analysis was performed with Seurat v.4. Data were filtered to remove cells with high mitochondrial reads (>5%), low gene detection (<200) and high gene detection (>4,000). In total, 44,100 nuclei passed these filtration parameters. Normalization was performed with SCTransform32 and was integrated. Subsequently, cells were clustered by using Louvain clustering (resolution = 0.5) and UMAP was used for visualization. Clusters were annotated as has previously been described for the striatum33. Expression levels for each cluster and condition were visualized by using the VlnPlot(), DotPlot() and FeaturePlot() functions in the Seurat package.
Single-cell datasets of mouse DRG were obtained from Gene Expression Omnibus (accession number GSE139088)20. Data were analysed with Seurat v.4.0. Normalization was performed with SCTransform32, clustered and UMAP was used for visualization. Clusters were annotated and reproduced as described20. Expression levels for each cluster were visualized by using the VlnPlot(), DotPlot() and FeaturePlot() functions in Seurat.
Transcriptional profiling by bulk RNA-seq
Libraries were prepared by using the illumina TruSeq stranded messenger RNA kit (catalogue no. 20020595) with Integrated DNA Technologies for illumina TruSeq Unique dual indexes (catalogue no. 20022371) according to the manufacturer’s instructions. Quality and quantity control of RNA and libraries were performed by using Agilent 4200 TapeStation and Qubit v.4, respectively. Libraries were sequenced on an Illumina NextSeq 550 to produce 75-base pair single-end reads with an average sequencing depth of seven million reads per sample. Raw reads were mapped to the mouse reference transcriptome (Ensembl; Mus musculus v.67) by using Kallisto v.0.46.0. Subsequent analysis was carried out by using the statistical computing environment R v.3.6.1 in RStudio v.1.2.5019 and Bioconductor v.3.8. In brief, transcript quantification data were summarized to genes by using the tximport package and were normalized by using the trimmed mean of M values method in edgeR. Genes with less than 1 count per million in n + 1 of the samples, where n is the size of the smallest group of replicates, were filtered out. Differentially expressed genes were identified with linear modelling by using limma (false discovery rate ≤ 0.05; absolute log fold change ≥ 1) after correcting for multiple testing by using a Benjamini–Hochberg procedure.
Quantitative real-time PCR
RNA was isolated by using phenol-chloroform extractions and complementary DNA (cDNA) was prepared by using 2,000 ng per 10 μl of RNA input by using a high-capacity cDNA reverse transcription kit (Applied Biosystems, catalogue No. 43-688-13). Quantitative real-time PCR was performed by using Luna Universal qPCR Master Mix (New England Biolabs, catalogue No. M3003E). cDNA (4 μl) was mixed with 5 μl of Luna Master Mix and 1 μl of primer mix was added. Amplification was set up by using the manufacturer’s protocol. The sequences for primers that were used to assess gene expression were as follows: Fos Fwd (5’-CAGCCTTTCCTACTACCATTCC-3’), Rev (5’-ACAG ATCTGCGCAAAAGTCC-3’), Arc Fwd (5’-ACAGAGGATGAGACTGAGG CAC-3’), Rev (5’-TATTCAGGCTGGGTCCTGTCAC-3’). As a housekeeping gene, Gapdh was used with the sequence Gapdh Fwd (5’-GGGTGTGAA CCACGAGAAATATG-3’) and Rev (5’-TGTGAGGGAGATGCTCAGTGTTG-3’). To further verify gene expression, quantitative real-time PCR was performed by using TaqMan Fast Advanced Master Mix (Applied Biosystems, catalogue No. 44-445-57), with TaqMan probes for Maoa (Thermofisher, catalogue No. Mm00558004_m1), Fos (Thermofisher, Mm00487425_m1), Arc (Thermofisher, Mm01204954_g1), Homer1 (Thermofisher, catalogue No. Mm00516275_m1), and Gapdh (Thermofisher, catalogue No. Mm99999915_g1) as the housekeeping gene. For assessing relative gene expression, 2(Ct Gapdh – Ct gene) was calculated.
In both protocols, an Applied Biosystems (Quantstudio v.6) thermal cycler was used and the cycling condition was set following the manufacturer’s instructions.
Untargeted metabolomics
Ice-cold 80% methanol (1 ml) containing 0.1% formic acid was added to 2 ml screw-top vials containing 25 or 50 mg of caecal contents and a mixture of 0.1 mm and 1 mm of zirconium oxide beads (tubes lacking caecal contents were used to generate the method blanks). Samples were homogenized twice for 30 s in a Precellys 24 homogenizer at 9,000 rpm and samples were allowed to cool on ice between cycles. Samples were centrifuged at 4 °C and more than 21,000g for more than 10 min to clarify the supernatants. Clarified supernatants were transferred to new 1.5 ml microfuge tubes and dried via a speedvac. Dried samples were stored at −80 °C until analysis. For analysis, samples were resuspended in 10% acetonitrile (ACN) containing 1 μM chlopropamide to a concentration of 0.25 mg μl−1, followed by vortexing and sonication until completely dissolved. Resuspended samples were centrifuged at 4 °C and more than 21,000g for more than 10 min to remove residual insoluble material. Clarified supernatant (5 μl) was then diluted to a final concentration of 12.5 μg μl−1 (1:20) in 10% ACN containing 1 μM chlopropamide. Samples were centrifuged at 4 °C and more than 21,000g for more than 10 min before being transferred to mass spectrometry (MS) vials for analysis. In addition, a portion of each extract was also pooled to generate a quality control sample. Samples were randomized and 1 μl was injected for analysis by using separate ddMS2 positive and negative ESI modes (Thermo Fisher Orbitrap Fusion Lumos) by using both hydrophilic interaction liquid chromatography and reversed-phase chromatography methods. A minimum of three quality control and blank injections were performed across each analysis to control for analytical drift and background signals, respectively. Data were mined by using MS-DIAL and were exported to Excel for further analysis.
Relative quantification of OEA in caecal content
Metal beads (0.5 cm) were added into 15 ml tubes with a caecum content. Tubeswerevortexedfor5 minuntil the contents werefully homogeneous. Next, we added 1 ml of ultra-pure water and samples were vortexed for 2 min, and then 1 ml of chloroform added and the solution vortexed for another 2 min. After separation, the chloroform layer was collected and samples were evaporated. Dry samples were stored at −20 °C before high-resolution high-performance liquid chromatography–mass spectrometry (HPLC–MS) analysis.
HPLC–MS was used to identify and relatively quantify OEA. For the identification, pure OEA was used as reference.
The extracts were dissolved in an ACN:methanol (7:1) mixture and centrifuged, and the supernatant utilized for liquid chromatography–mass spectrometry (LC–MS) measurements. A volume of 5 μl was injected into a Dionex Ultimate 3,000 HPLC coupled to a Bruker Impact II ESI-Q-OTOF instrument, set to positive ionization mode. Separation was performed on a C18 (Waters, ACQUITY UPLC BEH column, 50 mm × 2.1 mm × 1.7 μm) column with ACN (0.1% formic acid) and H2O (0.1% formic acid) as solvents. The flow rate was 0.4 ml min−1 with the following gradient: 0–2 min 5% ACN, 2–14 min 5–95% ACN, 14–15 min 95% ACN, 15–16 min 5 % ACN. The mass range was measured from 100 to 1,200 m/z. Data analysis was performed with the software DataAnalysis v.4.3 (Bruker). For relative quantification, the peak areas of the OEA signals were compared34.
SHAP computational models
We calculated SHAP values for the variables collected from the DO cohort to determine additive feature contributions to the variation in treadmill endurance performance by using the Shapr package for R. Each feature’s contribution to phenotype variability was assessed separately, and also in combination in groups with respect to the variable origin (metabolomics, 16S and so on).
Genetic analysis
DO mice specimens were collected, DNA was extracted and Illumina genotyping libraries were sequenced by Neogen Corporation. Data obtained from genotype sequencing of the DO cohort were analysed by using the broman, qtl2, qtlcharts, ggplot2, mclust, DOQTL, kableExtra, knitr, fst, dplyr, cluster, tidyr, optparse and rhdf5 packages for R. In brief, we first prepared the data into array form by using geneseek2qtl2.R and geneseek2intensity.R, and genoprobs were calculated by using qtl2. The genoprobs array was then analysed as outlined in https://kbroman.org/qtl2/assets/vignettes/do_diagnostics.html. Covariates such as sex and DO generation were used in the qtl2 analysis. All duplicate pairs were removed. Next, we calculated genotyping error logarithm of the odds (LOD) scores and apparent genotyping error. There were no samples detected with genotype error of more than 1%. We then assessed the marker missing data and marker genotype frequencies. Markers with higher rates of missing genotypes (missing more than 10% of markers) showing higher error rates were removed from the following analysis. These markers were mostly monomorphic, low-frequency markers. Markers with an error rate of more than 5% and samples lacking more than 5% of genotypes were also removed. Next, the founder proportions were plotted for all markers over all chromosomes. Kinship was assessed by using calc_kinship(), the genome was scanned by using scan1perm() and LOD peaks were found by using find_peaks(). The quantitative trait locus effect was estimated by using scan1coef(), scan1blup() and plot_coefCC(), and genome-wide association estimation for each phenotype was found and plotted by using scan1snps(). All details regarding the analysis can be found at Github (https://github.com/TheJacksonLaboratory/Thaiss_workflow/). Heritability was estimated by the est_herit() function of the qtl2 package from kinship matrix.
Statistical analysis and reproducibility
Data are expressed as mean ± s.e.m. Replicates represent biologically independent samples. P values of less than 0.05 were considered significant. The Benjamini–Hochberg procedure was used to control the false discovery rate, with a cut-off of q < 0.05. Results from animal experiments are representative of at least two independent repetitions. Two-group comparisons were done by using a Mann–Whitney U-test. Comparisons between multiple groups were done by using analysis of variance with a post-hoc test. The survival curve comparisons for P value assessment were analysed by using a log-rank Mantel–Cox test. P values for linear regressions were calculated by using Pearson’s correlation. Statistical analysis was performed in GraphPad Prism v.6. The exact n and P values and the statistical test used for each panel are reported in Supplementary Table 2.
Reporting summary
Further information on research design is available in the Nature Portfolio Reporting Summary linked to this article.
Extended Data
Extended Data Fig. 1 |. Prediction of exercise performance in diversity-outbred mice.
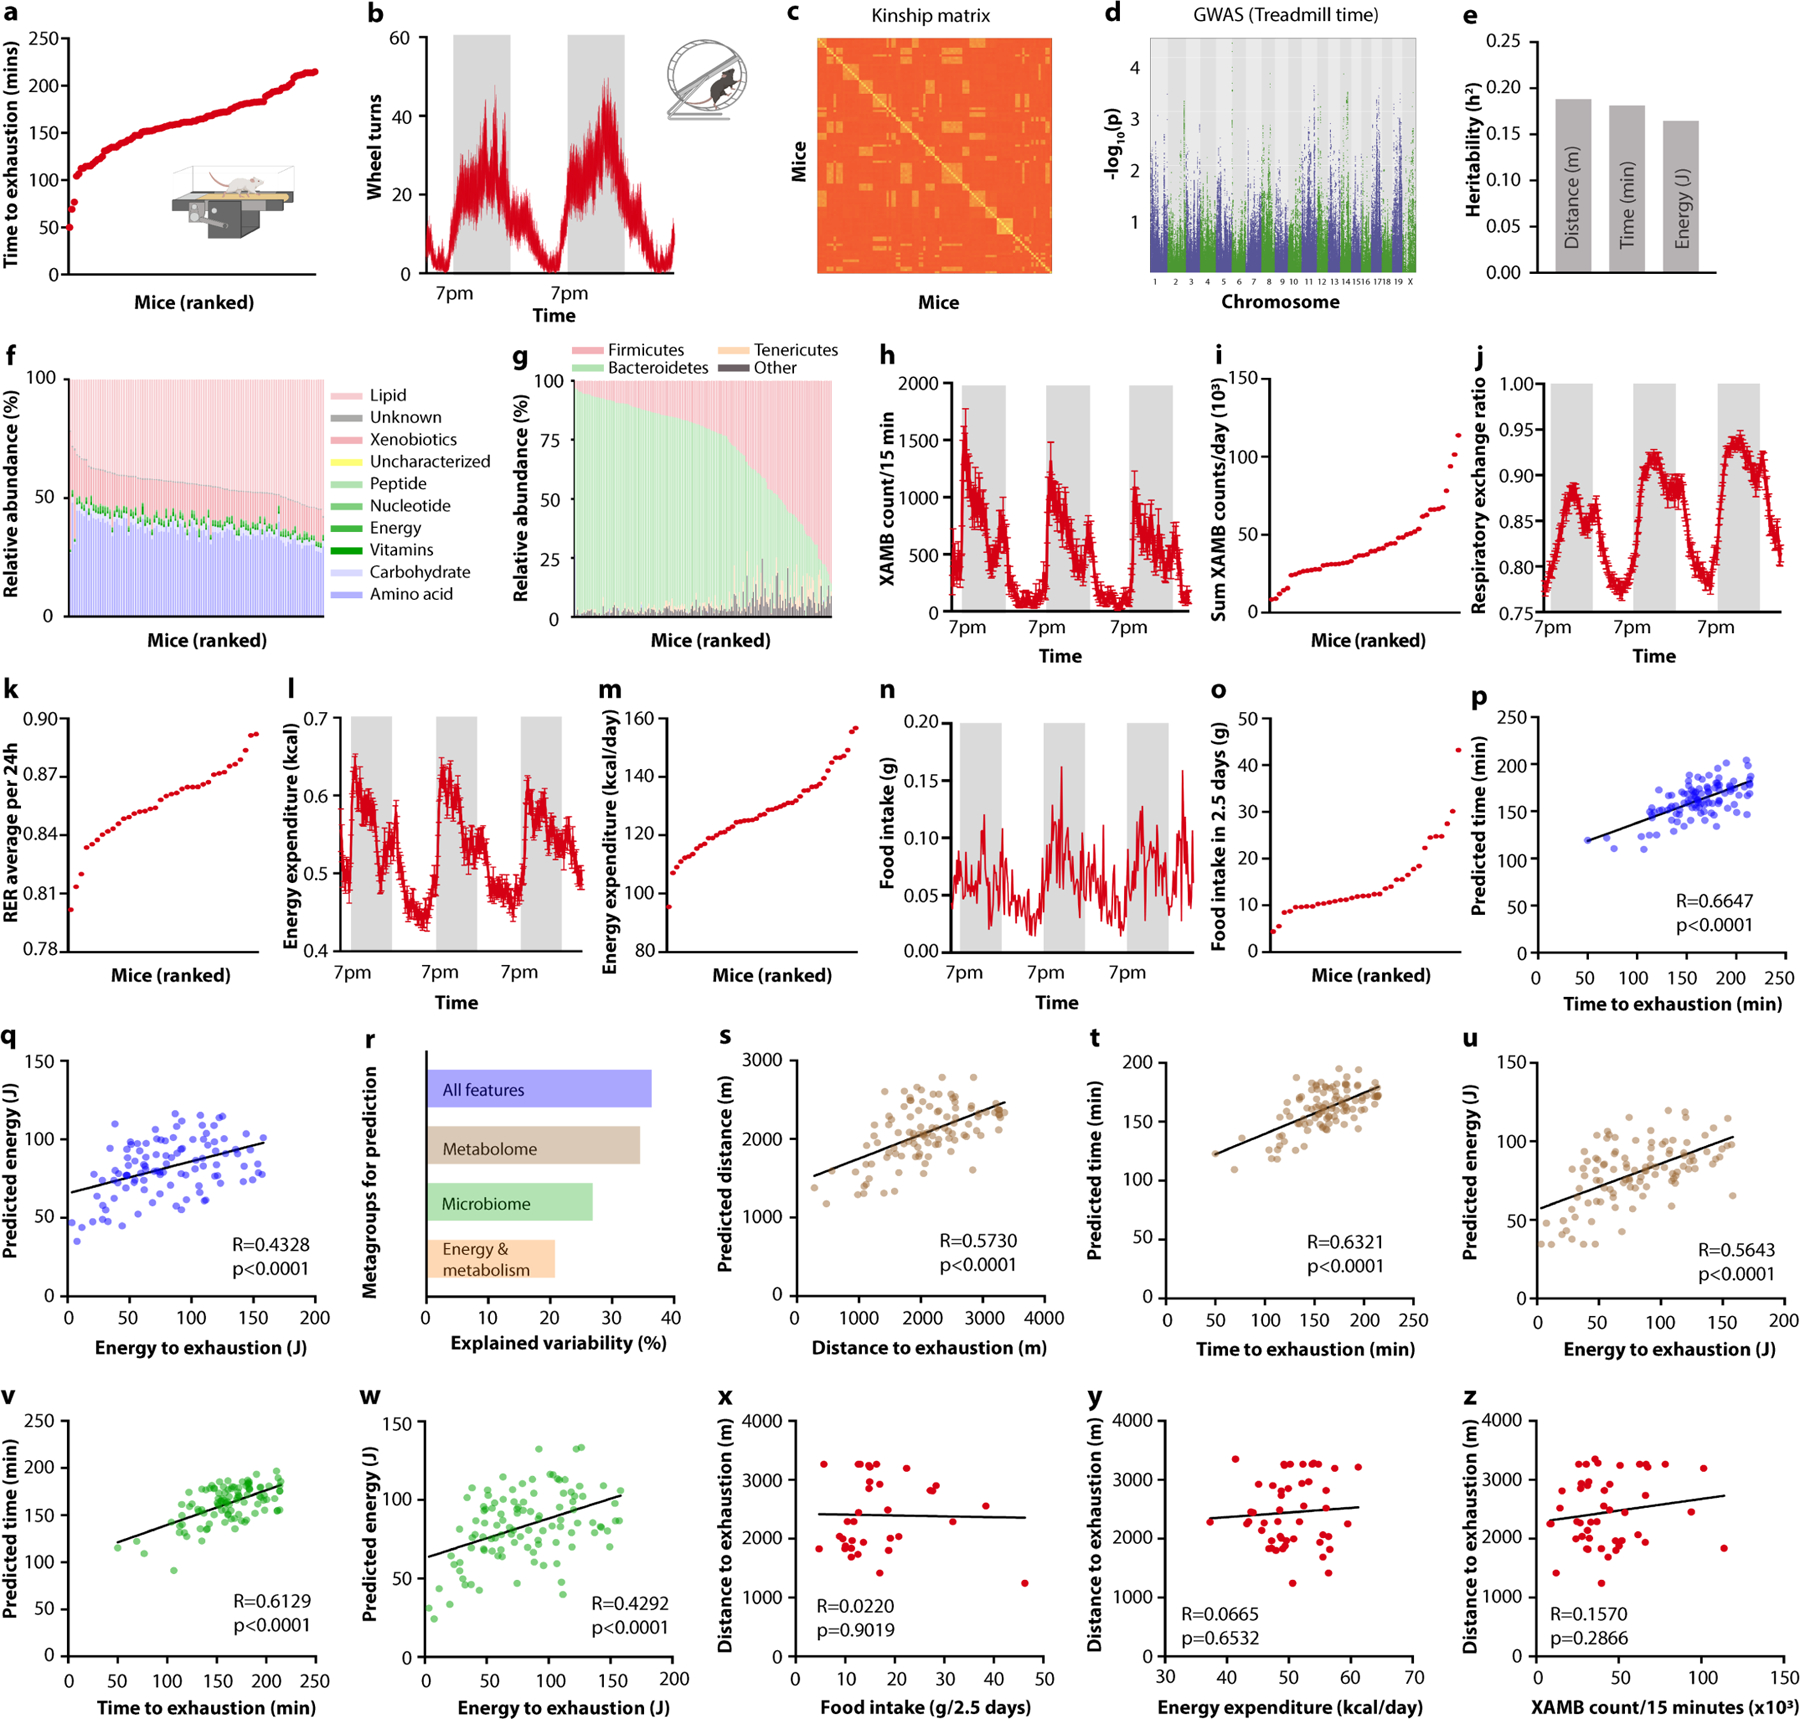
a, Ranking of diversity-outbred (DO) mice by time spent on treadmill until exhaustion. b, Wheel turn recording of DO mice over two consecutive days. c, Kinship matrix of DO mice. d, GWAS for time spent on treadmill during endurance exercise of DO mice. d, (D) Heritability (h2) calculated for distance, time, and energy spent on treadmills. f, Classification of serum metabolomes of DO mice. g, Taxonomies based on 16S rDNA sequencing of DO mice. h-o, Recording traces (h, j, l, n) and quantification (i, k, m, o) of horizontal movement (h, i), respiratory exchange ratio ( j, k), energy expenditure (l, m), and food intake (n, o) of DO mice. p, q, Algorithm-predicted versus measured treadmill time (p) and energy (q) based on a model including all assessed non-genetic features. r, Explained variability for “metagroups” of non-genetic variables used for prediction. s-w, Algorithm-predicted versus measured treadmill distance (s), time (t, v), and energy (u, w) based on a model including the serum metabolome (s-u), and microbiota features (v, w). x-z, Correlation of food intake (x), energy expenditure (y), and spontaneous locomotion (z) with treadmill distance. Error bars indicate means ± SEM. Exact n and p-values are presented in Supplementary Table 2.
Extended Data Fig. 2 |. The microbiome impact on exercise performance.
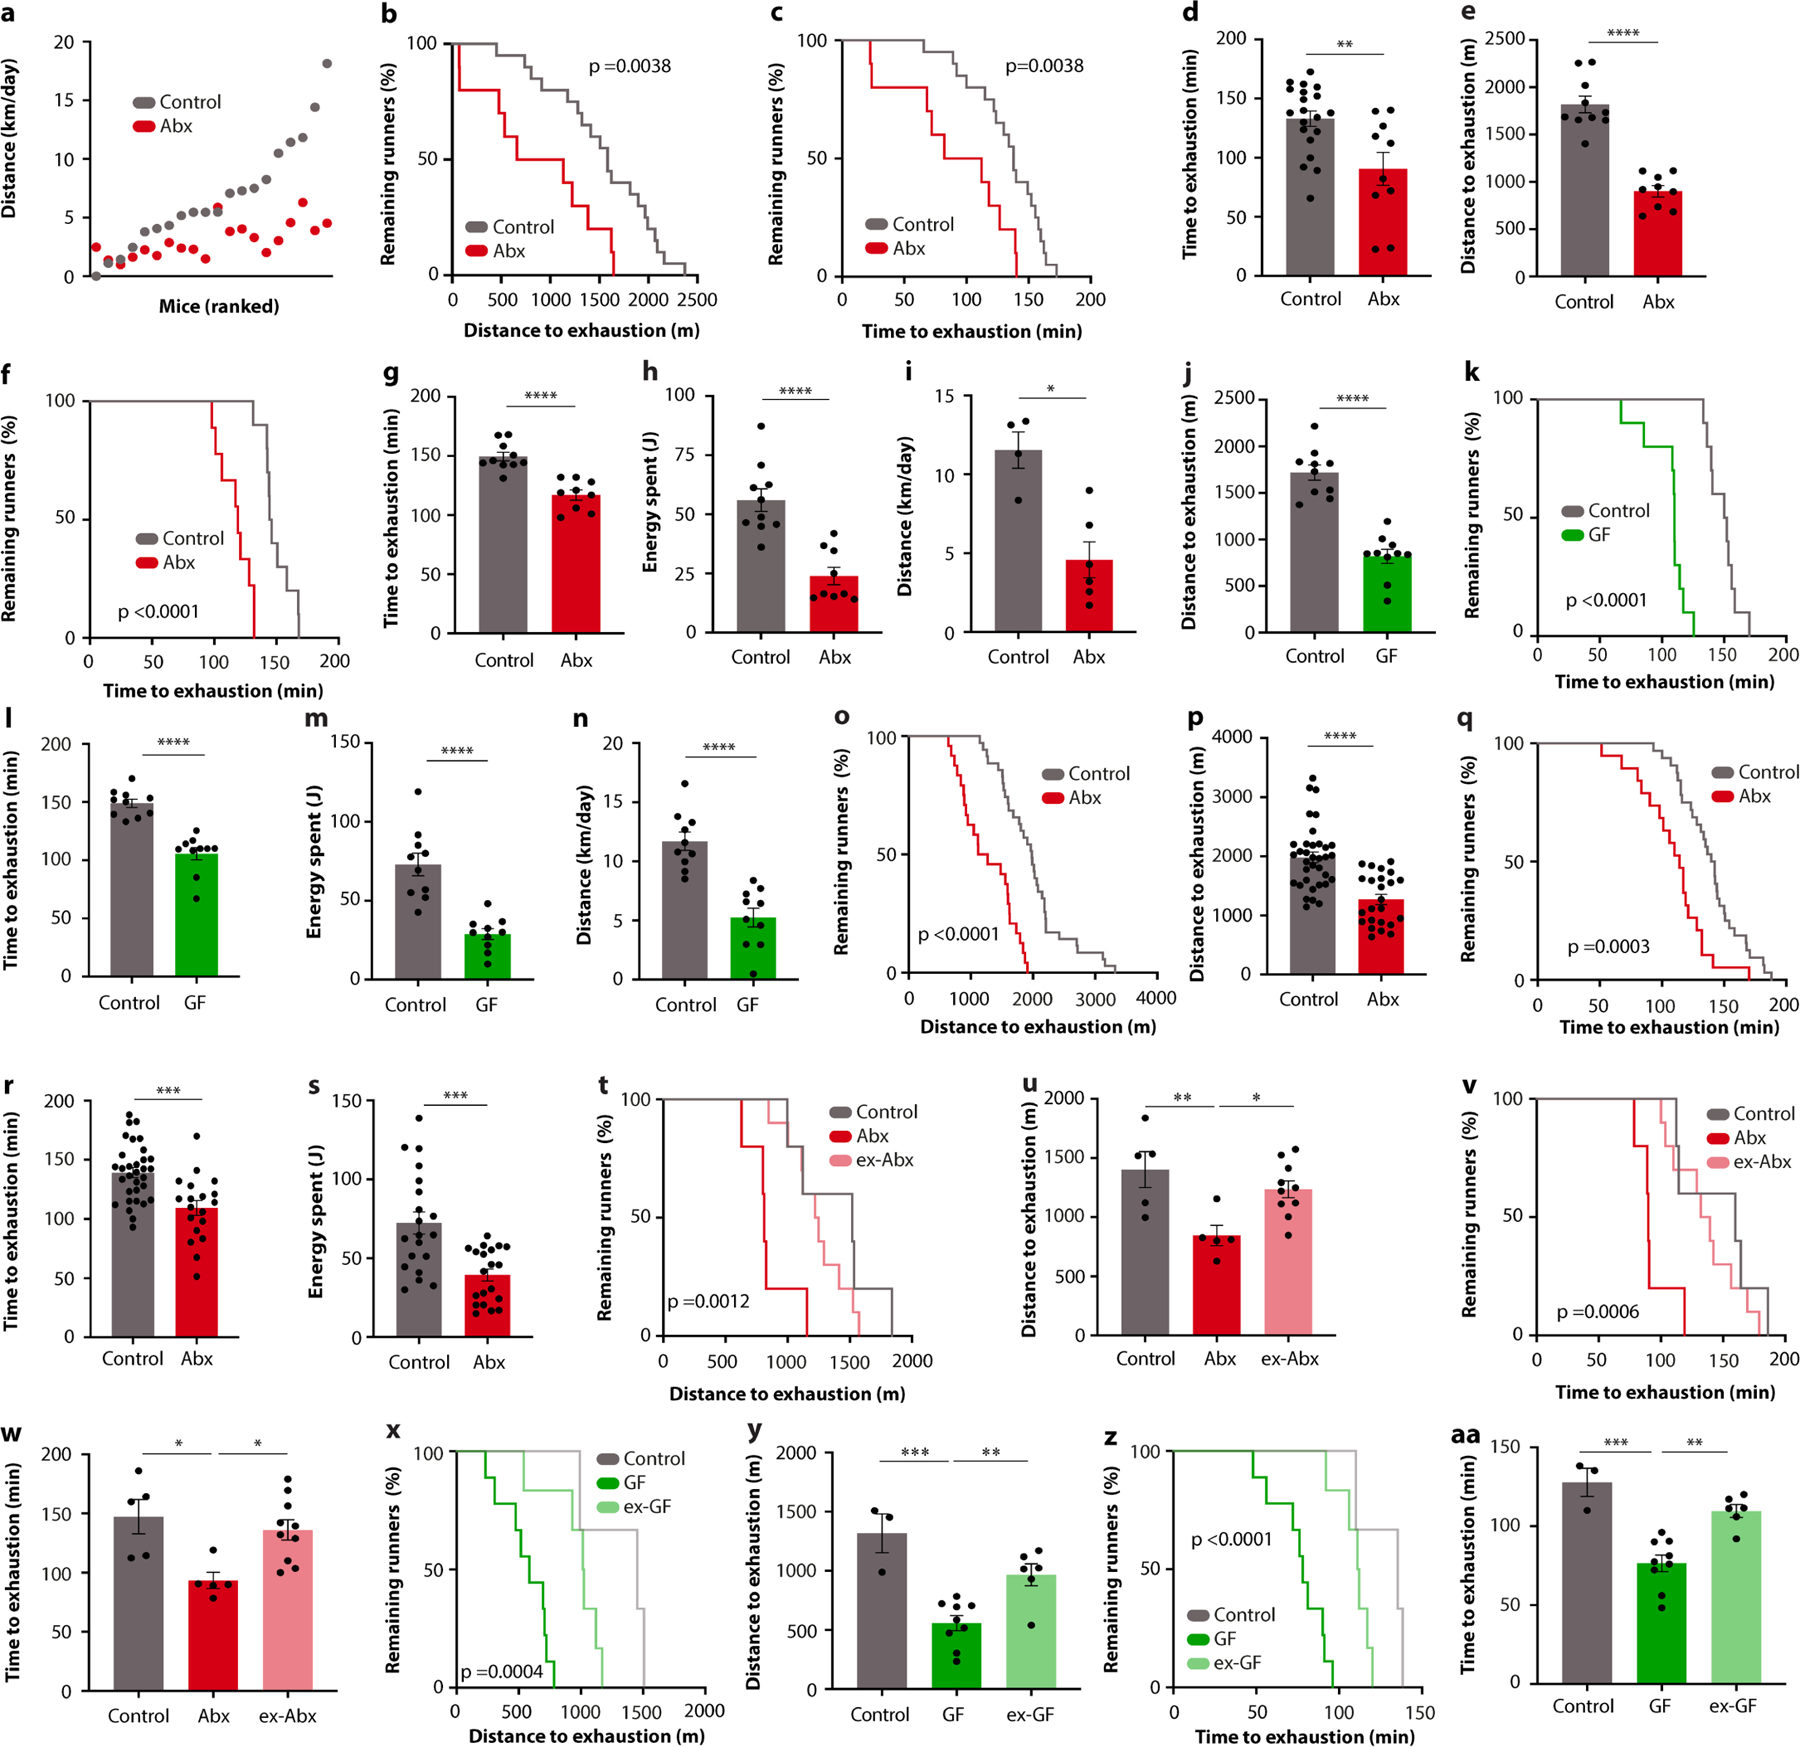
a, Ranked plot of treadmill distance of DO mice, with and without antibiotic (Abx) treatment. b-d, Kaplan-Meier plots for distance (b) and time (c) to exhaustion, and time quantification (d) for treadmill exercise of DO mice, with and without Abx treatment. e-h, Quantifications (e, g, h) and Kaplan-Meier plot (f) of treadmill distance (e), time (f, g) and energy (h) of antibiotics (Abx)-treated female mice. i, Wheel running quantification of Abx-treated mice. j-m, Quantifications ( j, l, m) and Kaplan-Meier plot (k) of treadmill distance ( j), time (k, l) and energy (m) of germ-free (GF) mice. n, Wheel running quantification of GF mice. o-s, Kaplan-Meier plots (o, q) and quantifications (p, r, s) of treadmill distance (o, p), time (q, r) and energy (s) of Abx-treated male mice. t-w, Kaplan-Meier plots (t, v) and quantifications (u, w) of distance (t, u) and time (v, w) on treadmill of Abx-treated mice or mice after Abx cessation (ex-Abx). x-aa, Kaplan-Meier plots (x, z) and quantifications (y, aa) of distance (x, y) and time (z, aa) on treadmill of GF mice and conventionalized (ex-GF) mice. Error bars indicate means ± SEM. * p < 0.05, ** p < 0.01, *** p < 0.001, **** p < 0.0001. Exact n and p-values are presented in Supplementary Table 2.
Extended Data Fig. 3 |. Taxonomic analysis of microbiome features associated with exercise performance.
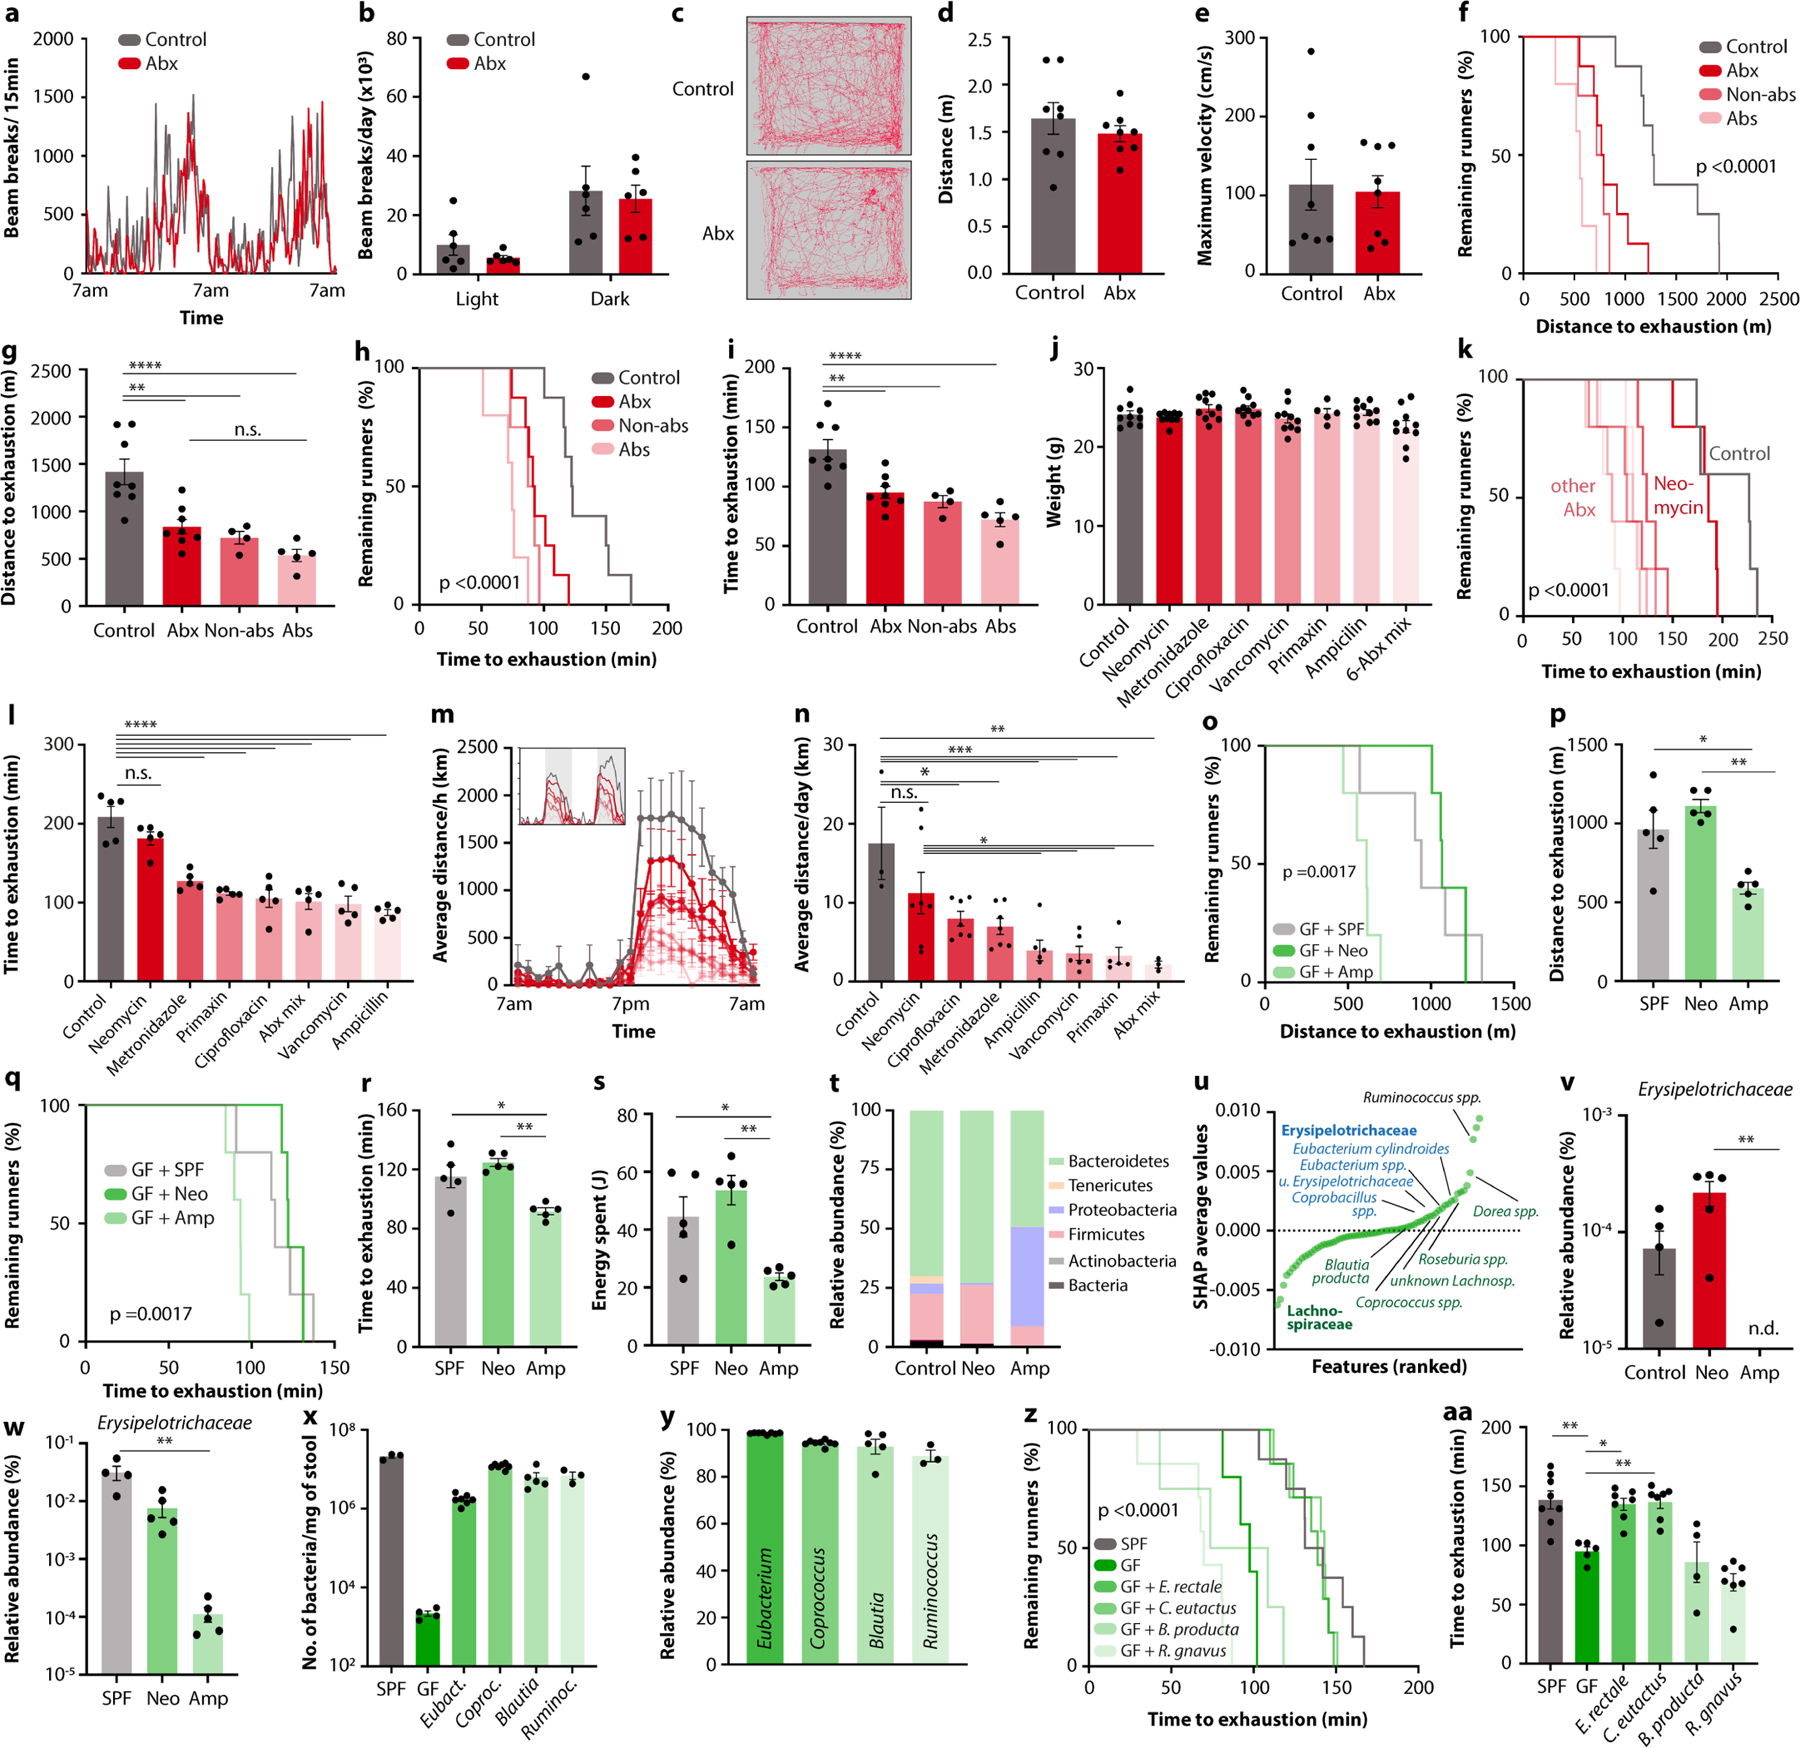
a, b, Recording (a) and quantification (b) of free horizontal movement measured in metabolic cages for two consecutive days in Abx-treated mice and controls. c-e, Open field locomotion (c), distance quantification (d) and velocity quantification (e) of Abx-treated mice and controls. f-i, Kaplan-Meier plots (f, h) and quantifications (g, i) of distance (f, g) and time (h, i) on treadmill of mice treated with either absorbable (Abs) or non-absorbable (Non-abs) antibiotics, or a broad-spectrum mixture (Abx). j-n, Body weight ( j), Kaplan-Meier plot (k) and quantification (l) of time on treadmill, averaged hourly distance (m) and quantification (n) of voluntary wheel activity of mice treated with the indicated antibiotics. Inset shows representative recording traces. o-s, Kaplan-Meier plots (o, q), and quantifications (p, r, s) of treadmill distance (o, p), time (q, r) and energy (s) of GF mice colonized with microbiome samples from conventional (SPF), neomycin-treated (Neo) or ampicillin-treated (Amp) mice. t, Phylum-level taxonomic microbiome composition of neomycin- and ampicillin-treated mice. u, SHAP-value ranking of all microbiota features contributing to prediction of exercise performance in DO mice. v, w, Relative abundance of Erysipelotrichaceae in neomycin- and ampicillin-treated mice (v) and GF mice receiving their microbiome samples (w). x-aa, Bacterial load (x), taxonomic composition (y), treadmill distance, Kaplan-Meier plot (z) and quantification (aa) of SPF mice, GF mice, and GF mice mono-colonized with the indicated bacterial species. Error bars indicate means ± SEM. * n.s. not significant, * p < 0.05, ** p < 0.01, *** p<0.001, **** p < 0.0001. Exact n and p-values are presented in Supplementary Table 2.
Extended Data Fig. 4 |. The impact of the microbiome on muscle physiology.
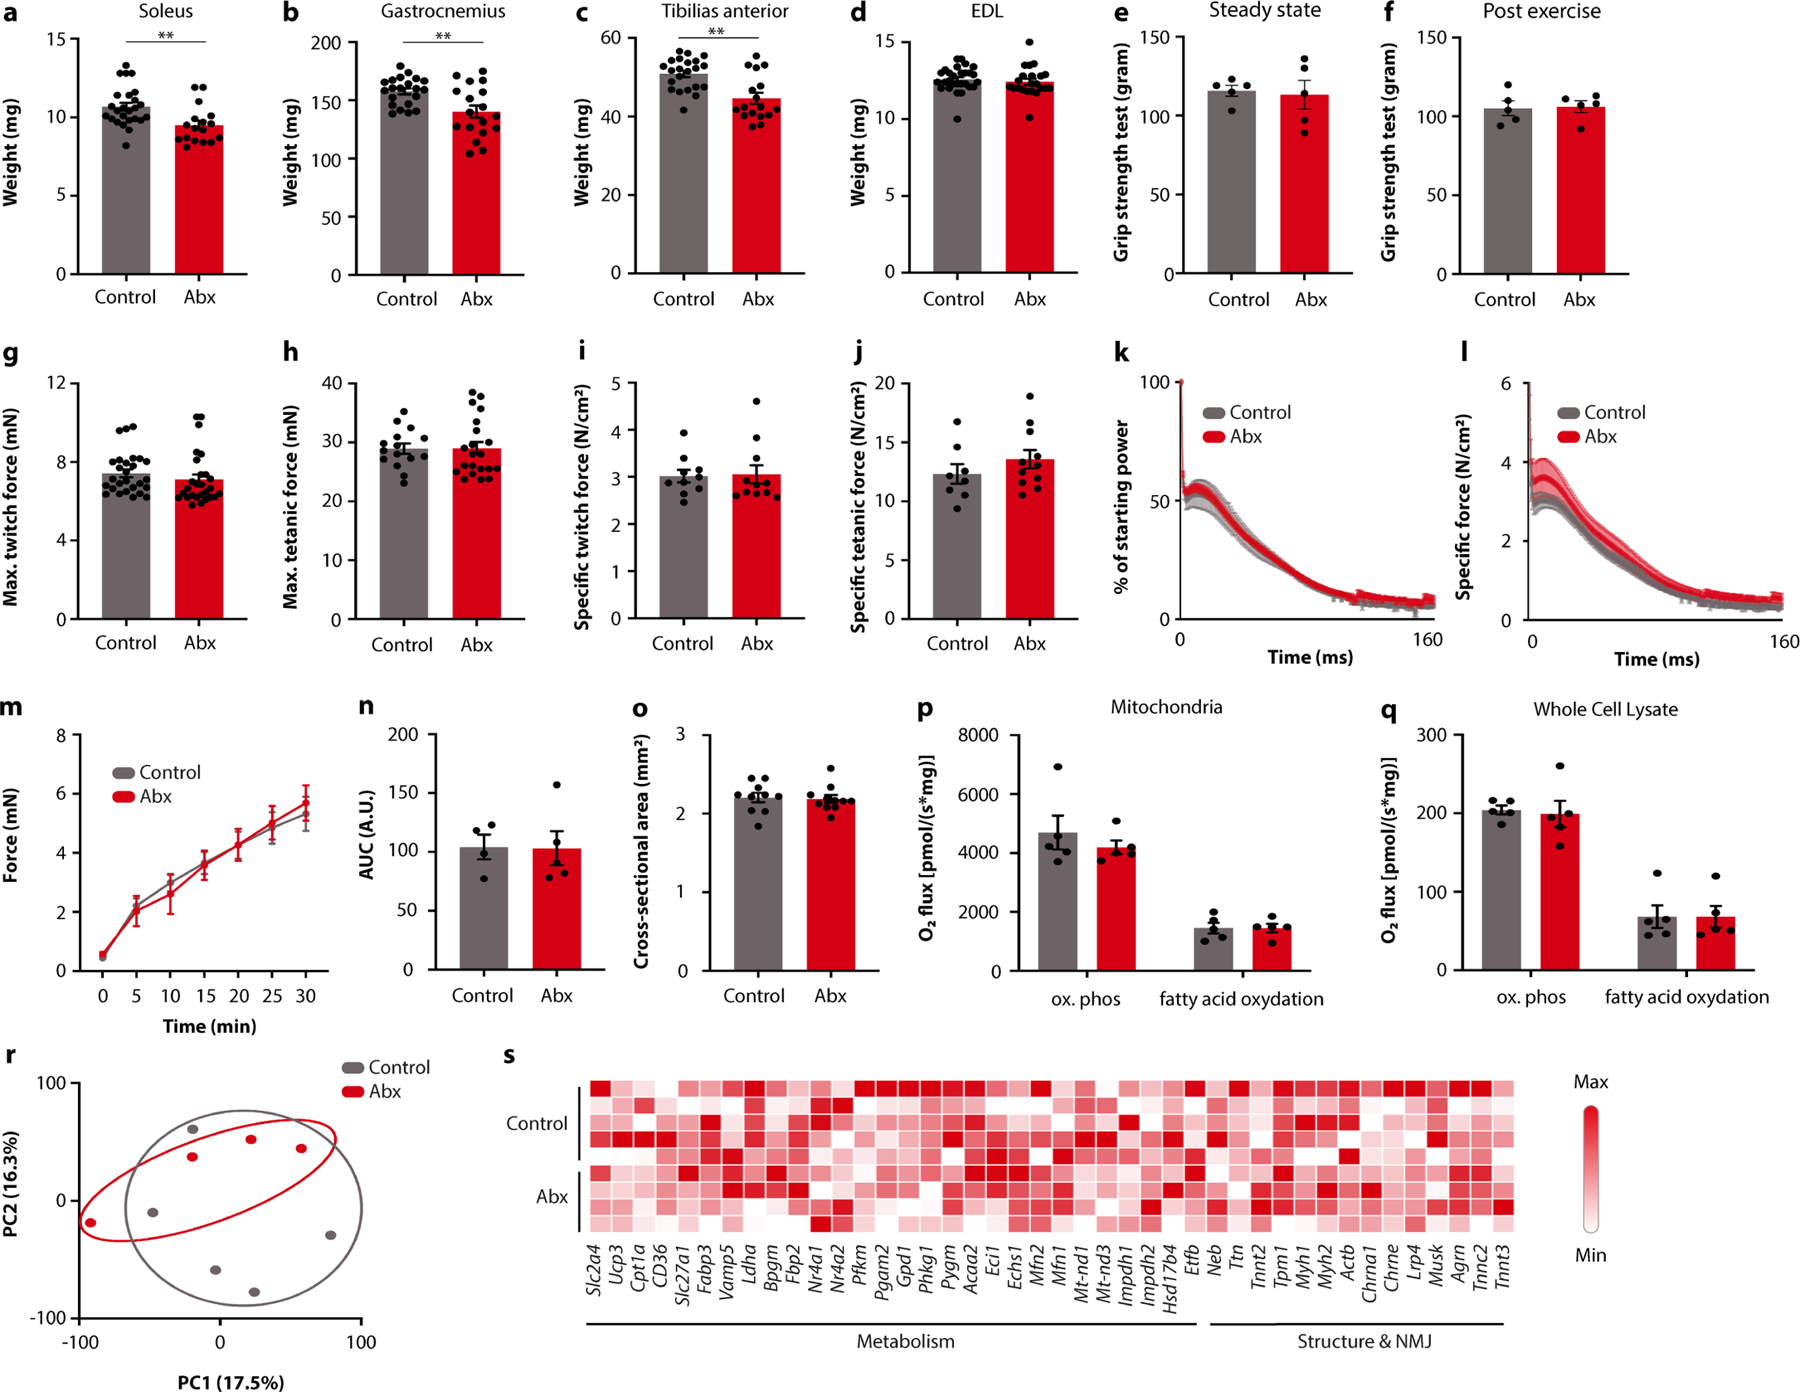
a-d, Weight of soleus (a), gastrocnemius (b), tibilias anterior (c), and extensor digitorum longus (EDL) muscles in Abx-treated mice and controls. e, f, Grip strength of Abx-treated mice and controls before (e) and after (f) exercise. g-j, Maximum twitch (g), tetanic force (h), specific twitch force (i), and specific tetanic force ( j) of EDL muscle from Abx-treated mice and controls. k-n, Decrease in power (k) and specific muscle force (l), force recovery over time (m) and force recovery quantification (n) of EDL muscle from Abx-treated mice and controls. o, EDL muscle cross-sectional area in Abx-treated mice and controls. p, q, Quantification of oxidative phosphorylation and fatty acid oxidation of isolated mitochondria (p) and whole cell lysates (q) from EDL muscle obtained from either Abx-treated mice or controls. r, s, PCA plot (r) and heatmap of selected genes (s) from EDL transcriptomes obtained from Abx-treated mice and controls. NMJ, neuro-muscular junction. Error bars indicate means ± SEM. ** p < 0.01. Exact n and p-values are presented in Supplementary Table 2.
Extended Data Fig. 5 |. Single-nucleus sequencing of the striatum.
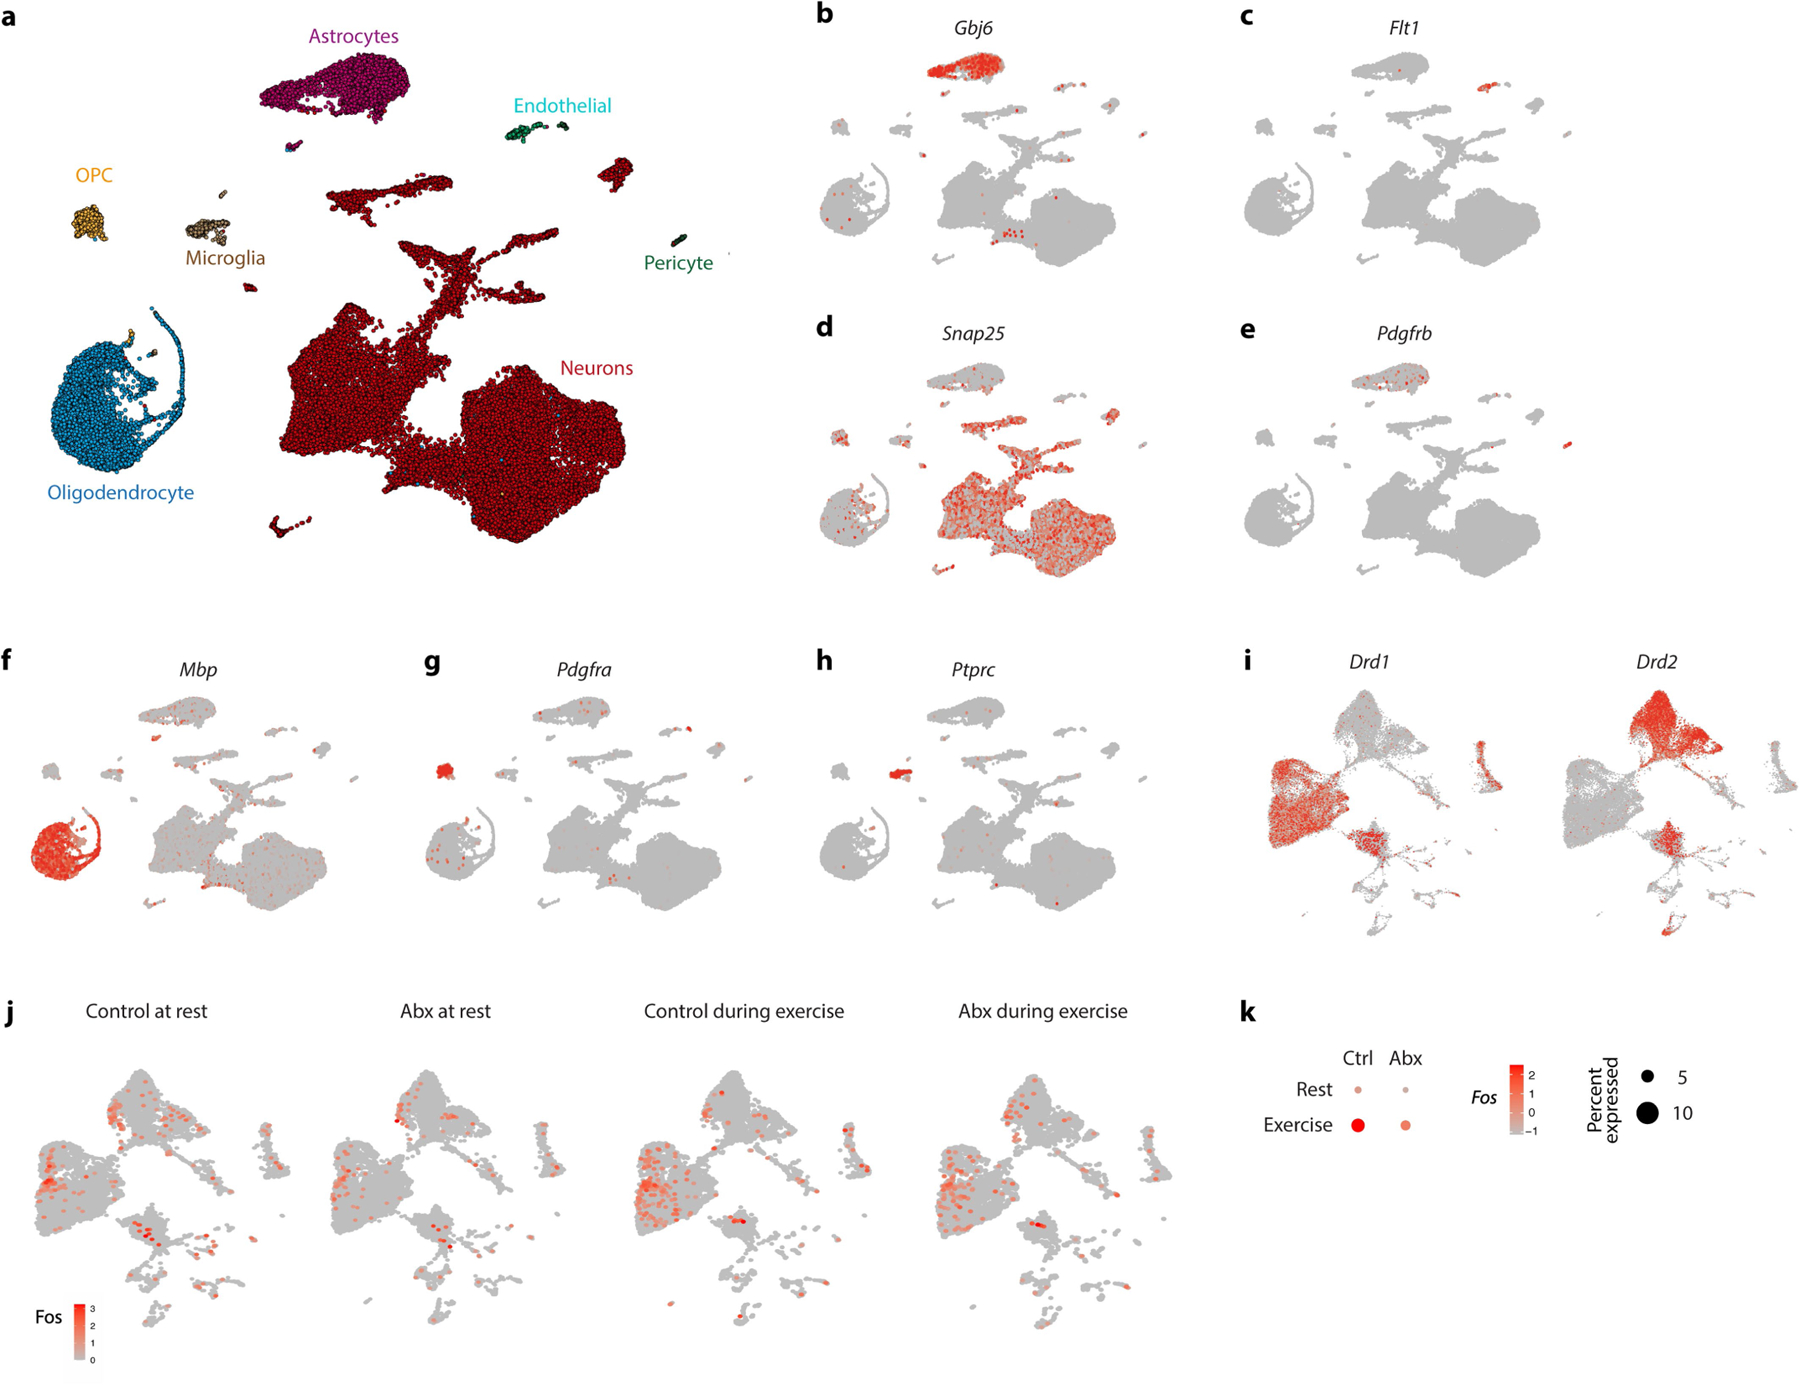
a, UMAP clustering of all cell types identified in the striatum. b-h, Feature plots for each cluster-identifying marker. i, UMAP of neuronal subcluster showing expression of Drd1 and Drd2. j, k, UMAP plots ( j) and quantification (k) of Fos expression in striatal neurons from control and Abx-treated mice before and during exercise.
Extended Data Fig. 6 |. The role of microbiome-mediated dopamine responses in exercise performance.
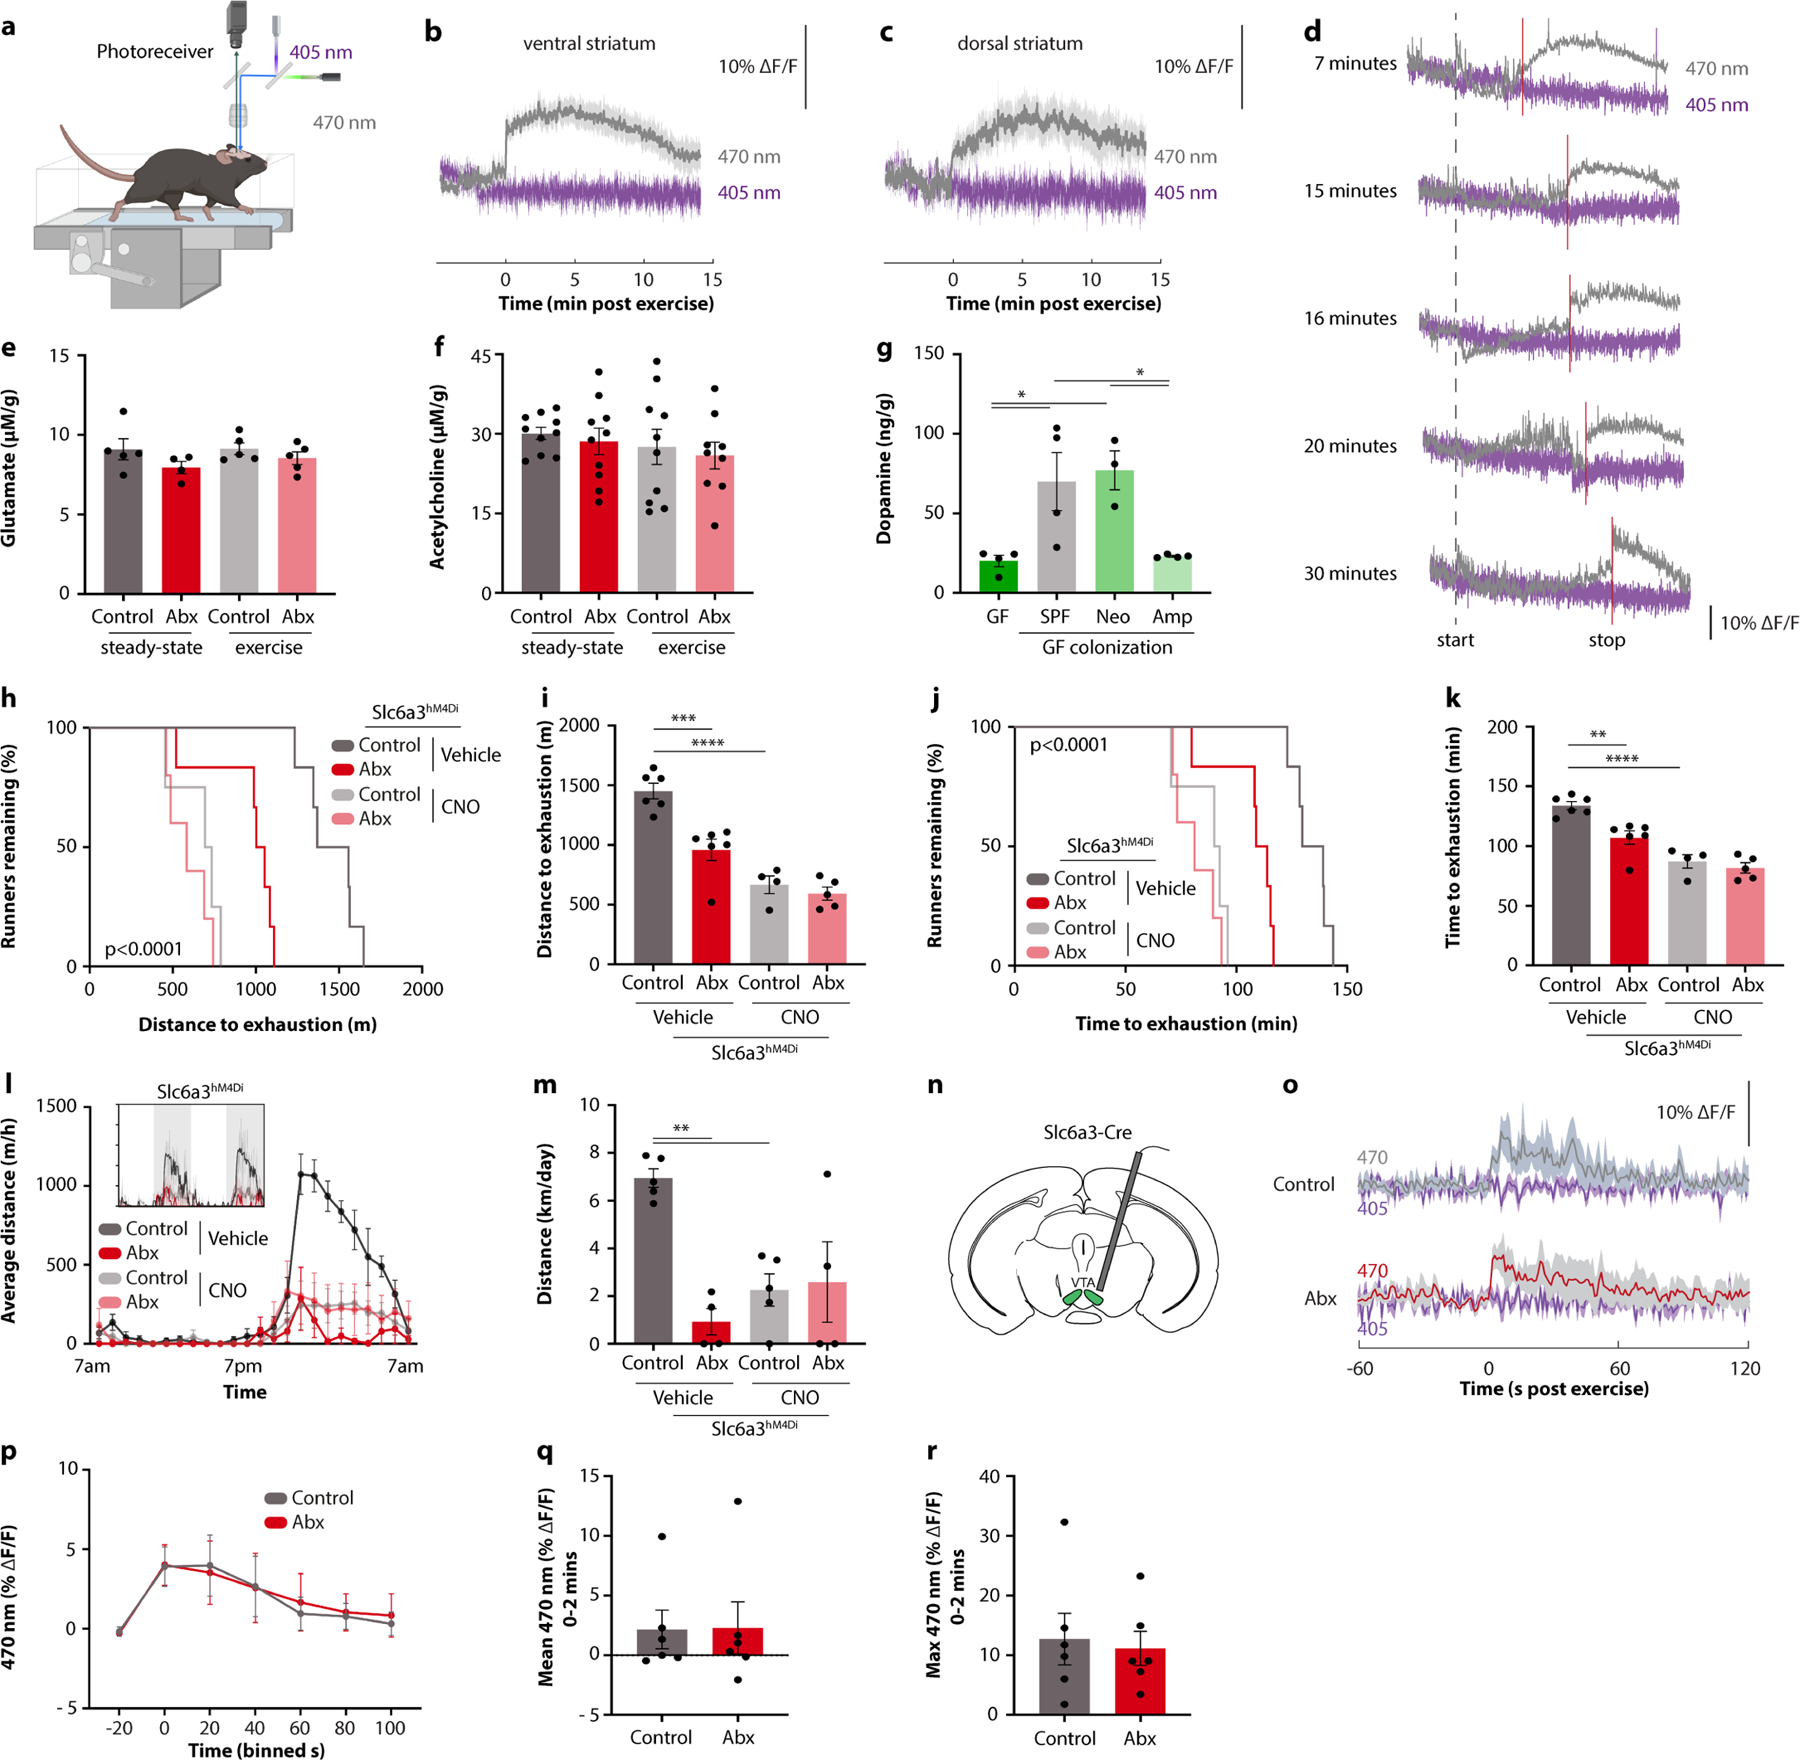
a, Schematic depicting in vivo fibre photometry of dopamine sensor fluorescence in the nucleus accumbens of mice during treadmill running. b-d, Fibre photometry recording of dopamine dynamics at the end of exercise in the ventral striatum (b), the dorsal striatum (c), and the ventral striatum after different durations of exercise (d). e, f, Glutamate (e) and acetylcholine (f) levels in the brain of Abx-treated mice and controls, at steady-state and after endurance exercise. g, Post-exercise dopamine levels in brain tissue of GF mice, and GF mice colonized with stool from SPF, neomycin- or ampicillin-treated mice. h-k, Kaplan-Meier plots (h, j) and quantifications (i, k) of distance (h, i) and time ( j, k) on treadmill of Abx-treated Slc6a3hM4Di mice, with or without CNO treatment. l, m, Averaged hourly distance (l) and quantification (m) of voluntary wheel activity of Abx-treated Slc6a3hM4Di mice, with or without CNO treatment. Inset shows representative recording traces. n-r, Schematic (n), recording traces (o), quantification (p), mean signals (q), and maximum signals (r) of fibre photometry recording from the VTA of Slc6a3-Cre mice injected with a GCamp6-expressing virus. Mice were recorded at the end of the exercise protocol. Error bars indicate means ± SEM. * p < 0.05, ** p < 0.01, *** p < 0.001, **** p<0.0001. Exact n and p-values are presented in Supplementary Table 2.
Extended Data Fig. 7 |. Mechanisms of microbiome-mediated control of striatal dopamine responses.
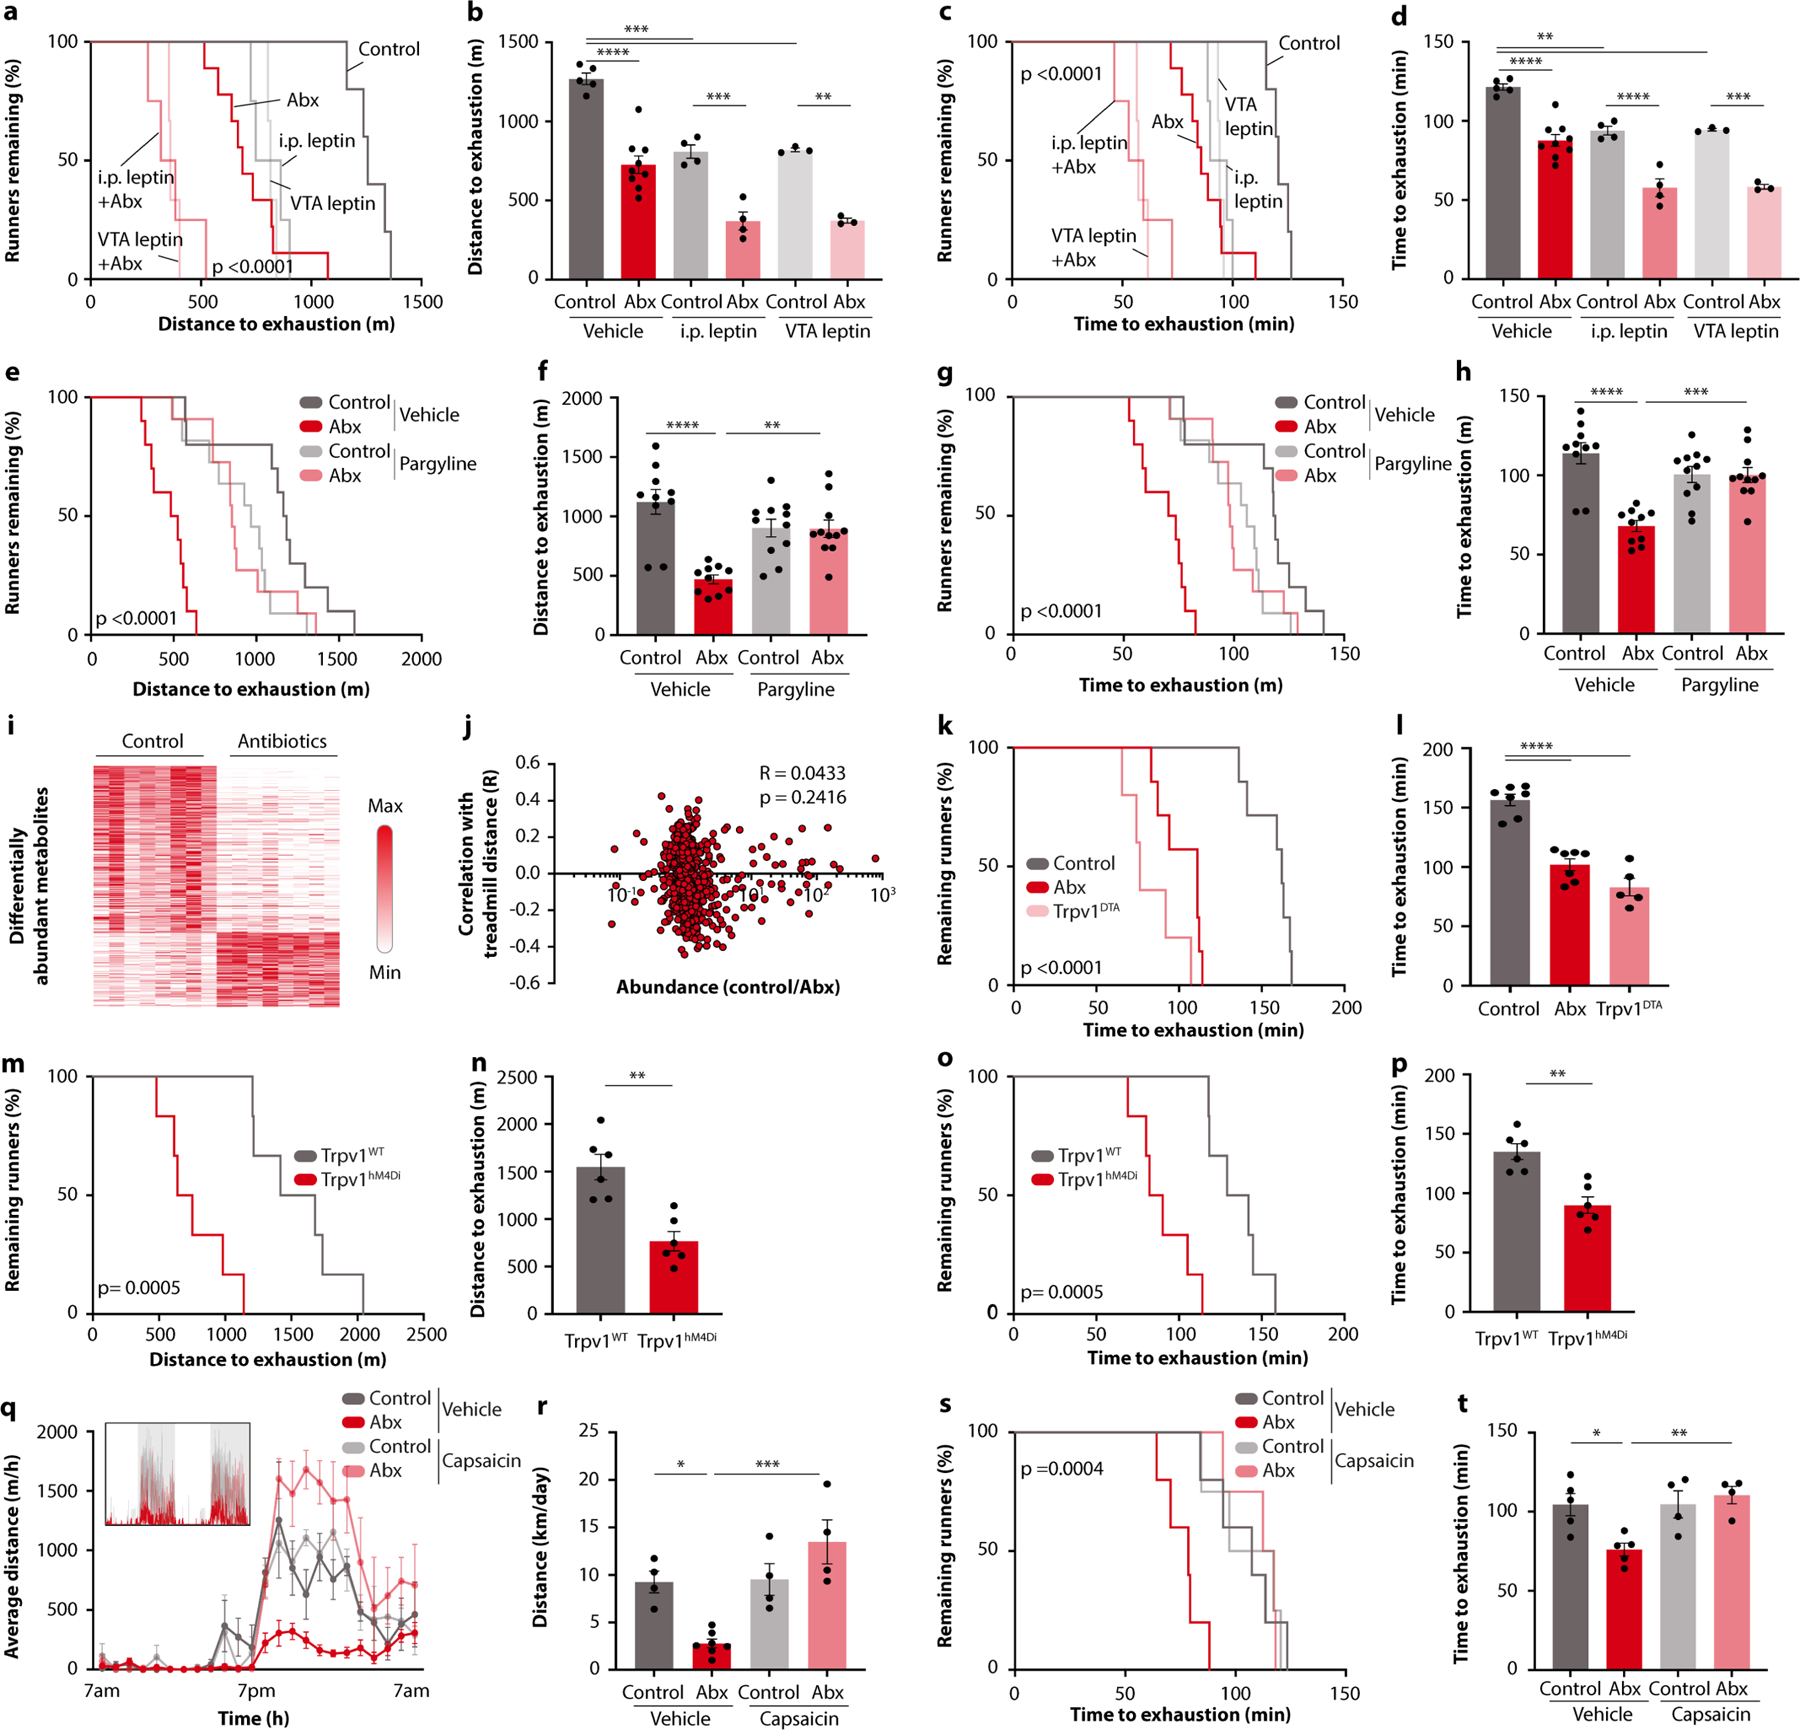
a-d, Kaplan-Meier plots (a, c) and quantifications (b, d) of distance (a, b) and time (c, d) on treadmill of Abx-treated mice, with or without leptin injection i.p. or into the VTA. e-h, Kaplan-Meier plots (e, g) and quantifications (f, h) of distance (e, f) and time (g, h) on treadmill of Abx-treated mice, with or without pargyline treatment. i, Heatmap of differentially abundant serum metabolites between Abx-treated mice and controls. j, Correlation of fold-change of serum metabolite abundance between Abx-treated mice and controls with the correlation of the same metabolites with treadmill distance in the DO cohort. k-p, Kaplan-Meier plots (k, m, o) and quantifications (l, n, p) of time (k, l, o, p) and distance (m, n) on treadmill of Trpv1DTA mice (k, l) and CNO-injected of Trpv1hM4Di mice (m-p). q, r, Averaged hourly distance (q) and quantification (r) of voluntary wheel activity of Abx-treated mice, with or without capsaicin treatment. Inset shows representative recording traces. s, t, Kaplan-Meier plot (s) and quantifications (t) time on treadmill of Abx-treated mice, with or without capsaicin treatment. Error bars indicate means ± SEM. ** p < 0.01, *** p < 0.001, **** p<0.0001. Exact n and p-values are presented in Supplementary Table 2.
Extended Data Fig. 8 |. The impact of exercise and the microbiome on sensory neuron activity.
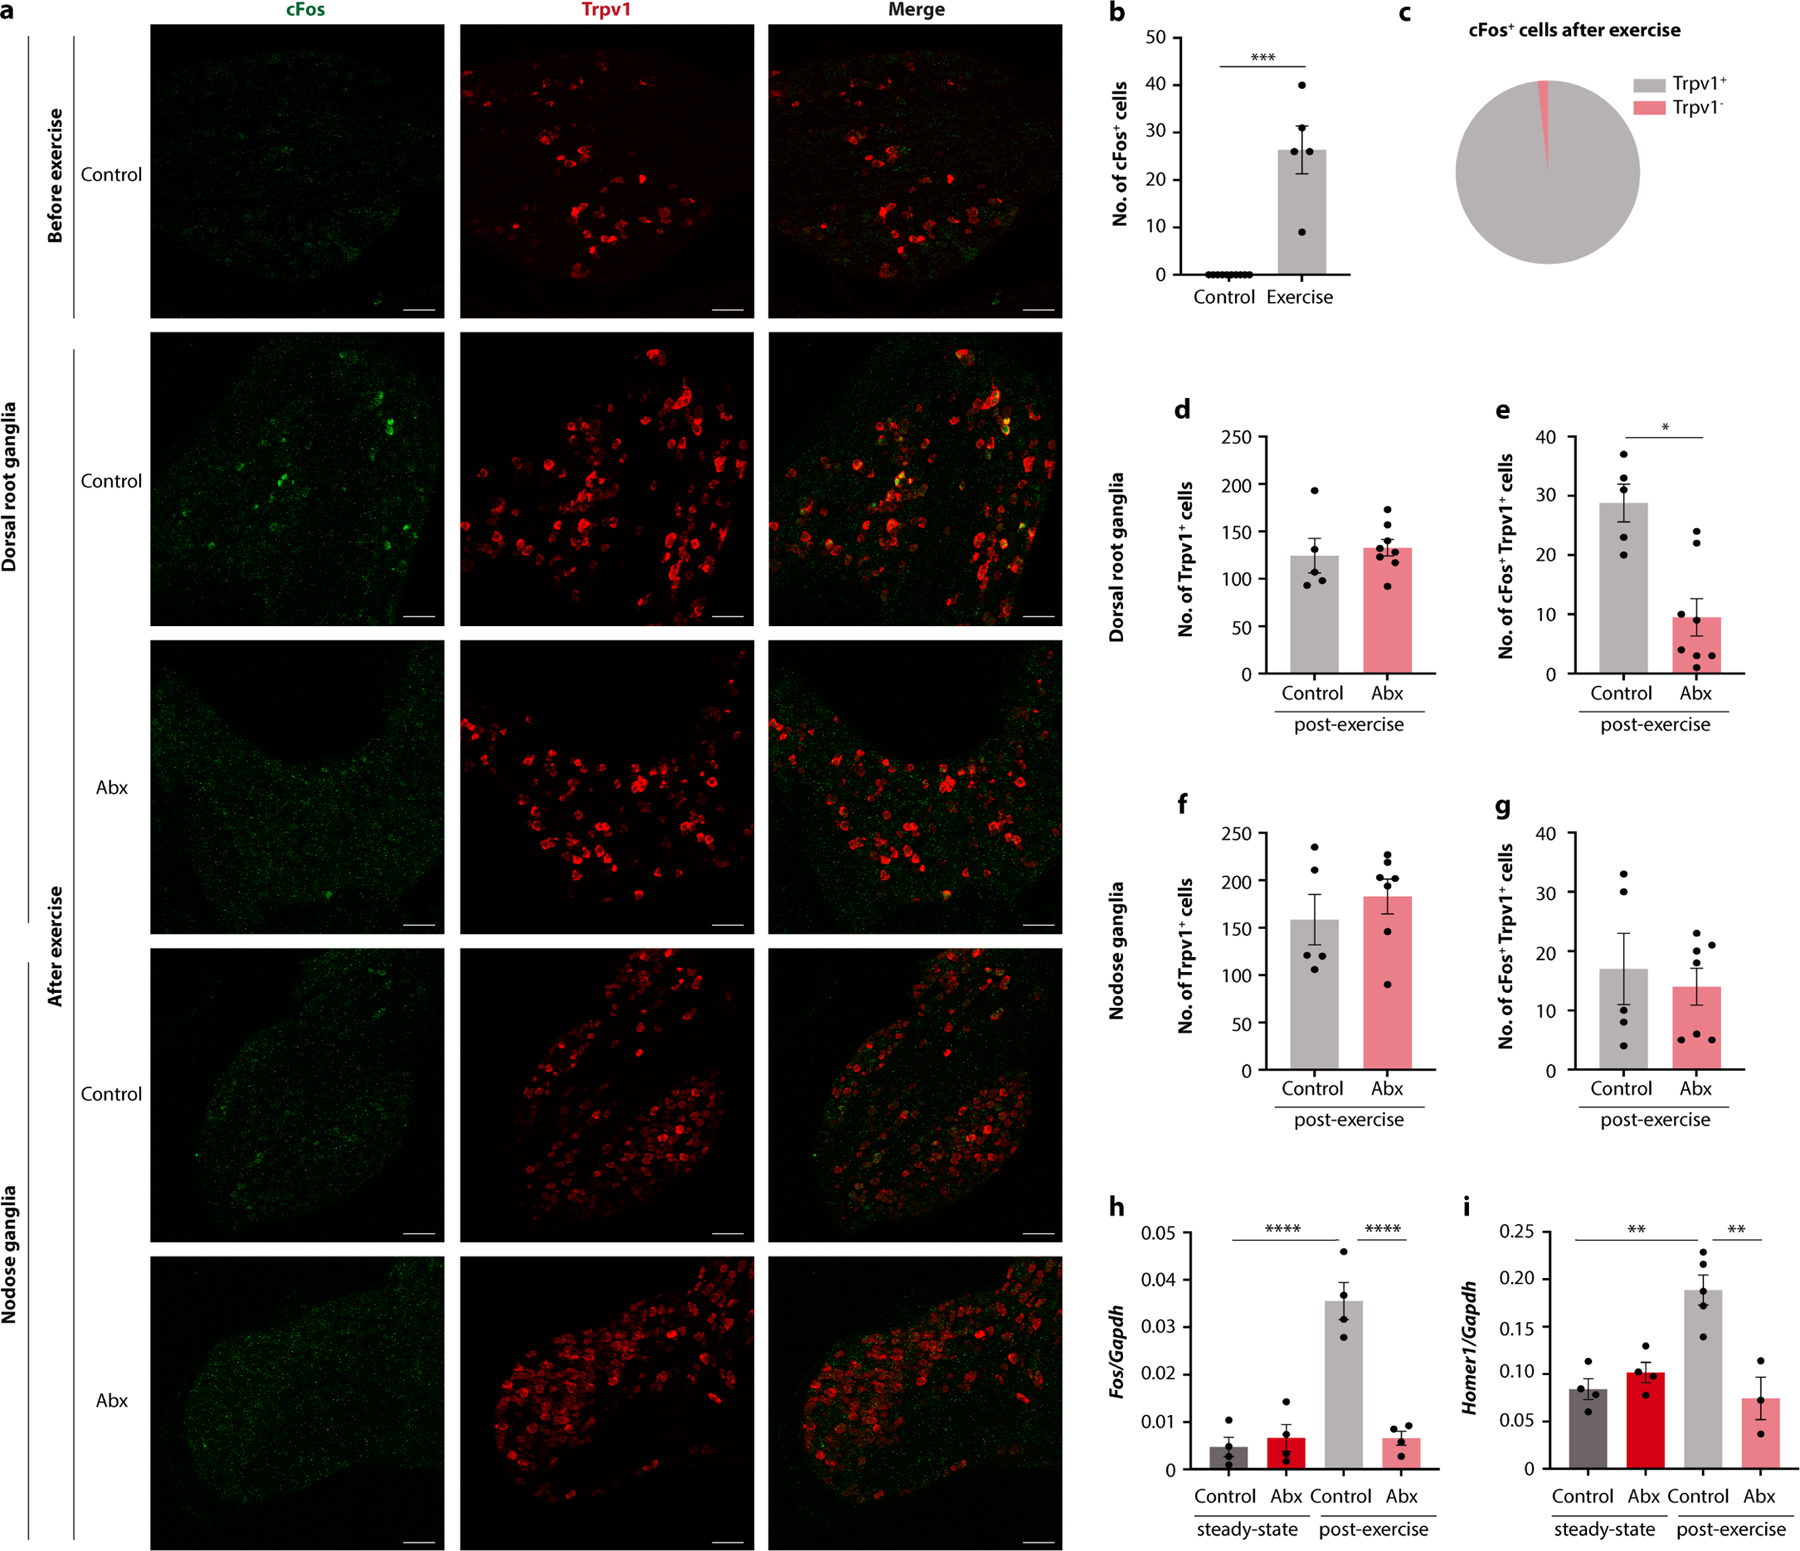
a, Representative RNAScope images of dorsal root and nodose ganglia before and after exercise, with and without Abx treatment. b, Number of cFos+ cells in dorsal root ganglia before and after exercise. c, Proportion of cFos+ cells in dorsal root ganglia from exercised mice that are TRPV1+ and TRPV1−. d-g, Number of TRPV1+ (d, f) and cFos+ TRPV1+ (e, g) cells in the dorsal root ganglia (d, e) and nodose ganglia (f, g) in exercised Abx-treated mice and controls. h, i, Expression of Fos (h) and Homer1 (i) in the dorsal root ganglia of sedentary and post-exercise mice, with or without Abx treatment. Error bars indicate means ± SEM. * p < 0.05, ** p < 0.01, *** p < 0.001, **** p<0.0001. Exact n and p-values are presented in Supplementary Table 2.
Extended Data Fig. 9 |. Contribution of spinal and vagal afferents to exercise performance.
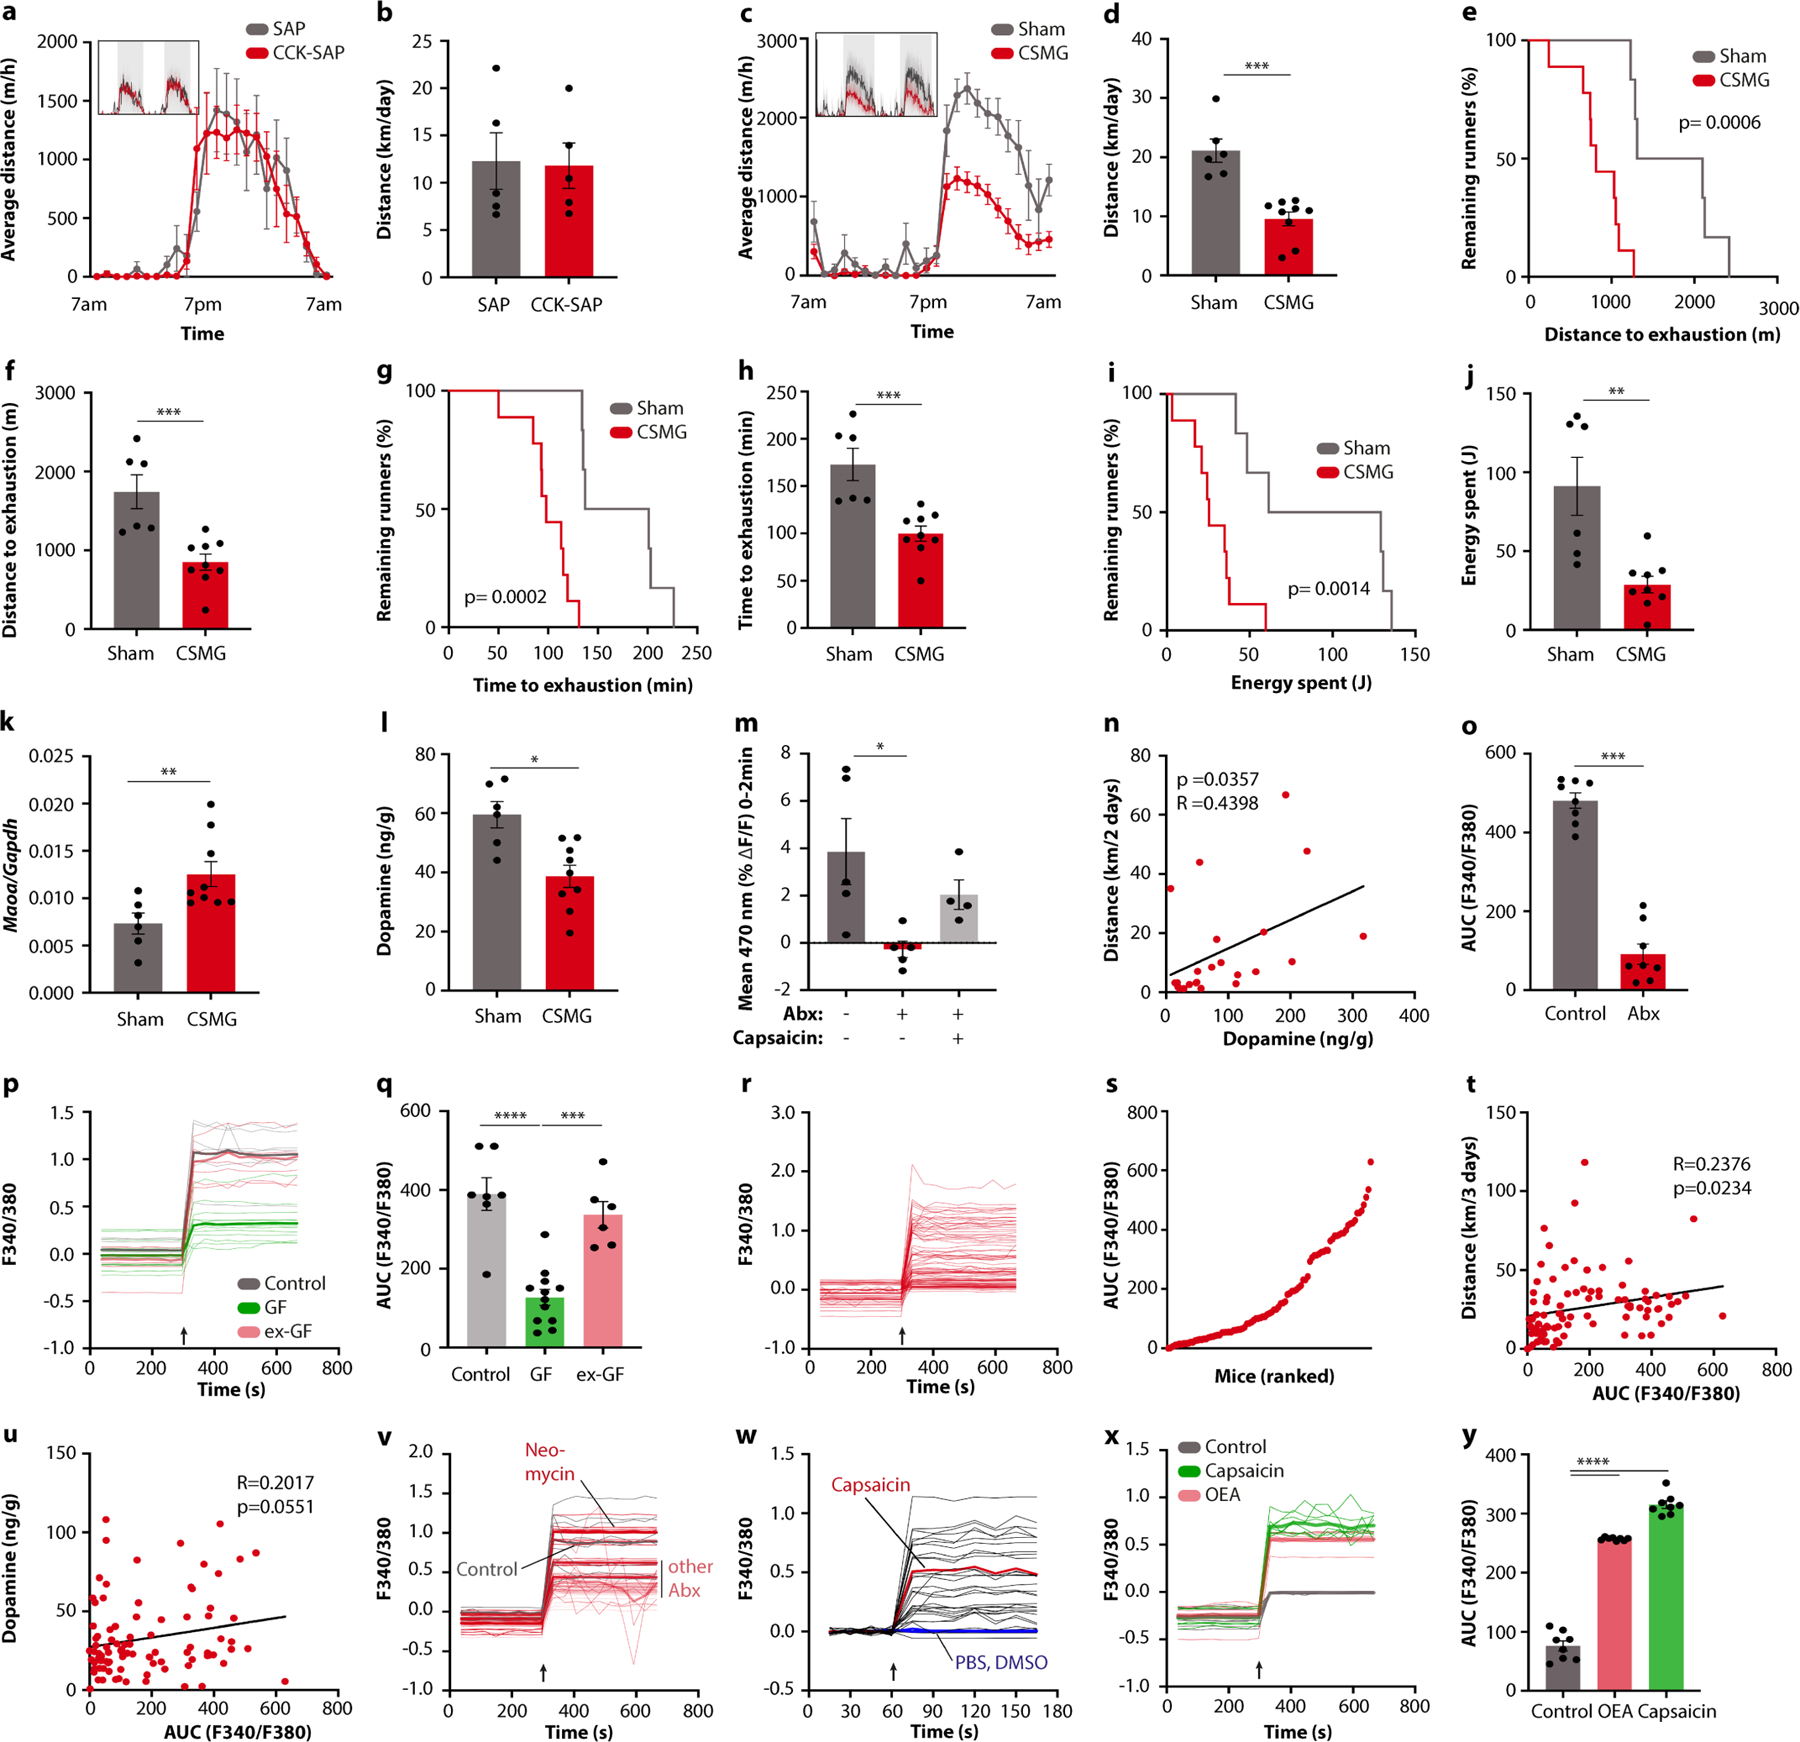
a-d, Averaged hourly distance (a, c) and quantifications (b, d) of voluntary wheel activity of mice receiving CCK-SAP injection into the nodose ganglia (a, b) and mice with surgical resection of the celiac/superior mesenteric ganglion (CSMG) (c, d). Insets show representative recording traces. e-j, Kaplan-Meier plots (e, g, j) and quantifications (f, h, i) of distance (e, f), time (g, h), and energy (I, j) spent on treadmills by mice with surgical resection of the CSMG. k, l, Expression of Maoa (k) and dopamine levels in the striatum (l) after exercise of mice with surgical resection of the CSMG. m, Mean dopamine indicator signal in post-exercise Abx-treated mice, with or without capsaicin treatment. n, Correlation of striatal dopamine levels with distance in running wheels of Trpv1DTA mice, Abx-treated mice, and controls, with or without capsaicin treatment. o, Quantification of calcium imaging of DRG neurons exposed to stool filtrates from Abx-treated mice and controls. p, q, Recording traces (p) and quantification (q) of calcium imaging of DRG neurons exposed to stool filtrates from GF mice and controls. Arrow indicates treatment time. r-u, Recording traces (r), quantification (s), correlation with wheel running (t), and correlation with post-exercise dopamine levels in the striatum (u) of calcium imaging of DRG neurons exposed to stool filtrates from DO mice. Arrow indicates treatment time. v, w, Recording traces of calcium imaging of DRG neurons exposed to stool filtrates from mice treated with different Abx (v) and to individual metabolites (w). Arrow indicates treatment time. x, y, Recording traces (x) and quantification (y) of calcium imaging of DRG neurons exposed to oleoylethanolamide (OEA) or capsaicin. Error bars indicate means ± SEM. * p < 0.05, ** p < 0.01, *** p<0.001, **** p<0.0001. Exact n and p-values are presented in Supplementary Table 2.
Extended Data Fig. 10 |. Dietary supplementation of fatty acid amides enhances exercise performance.
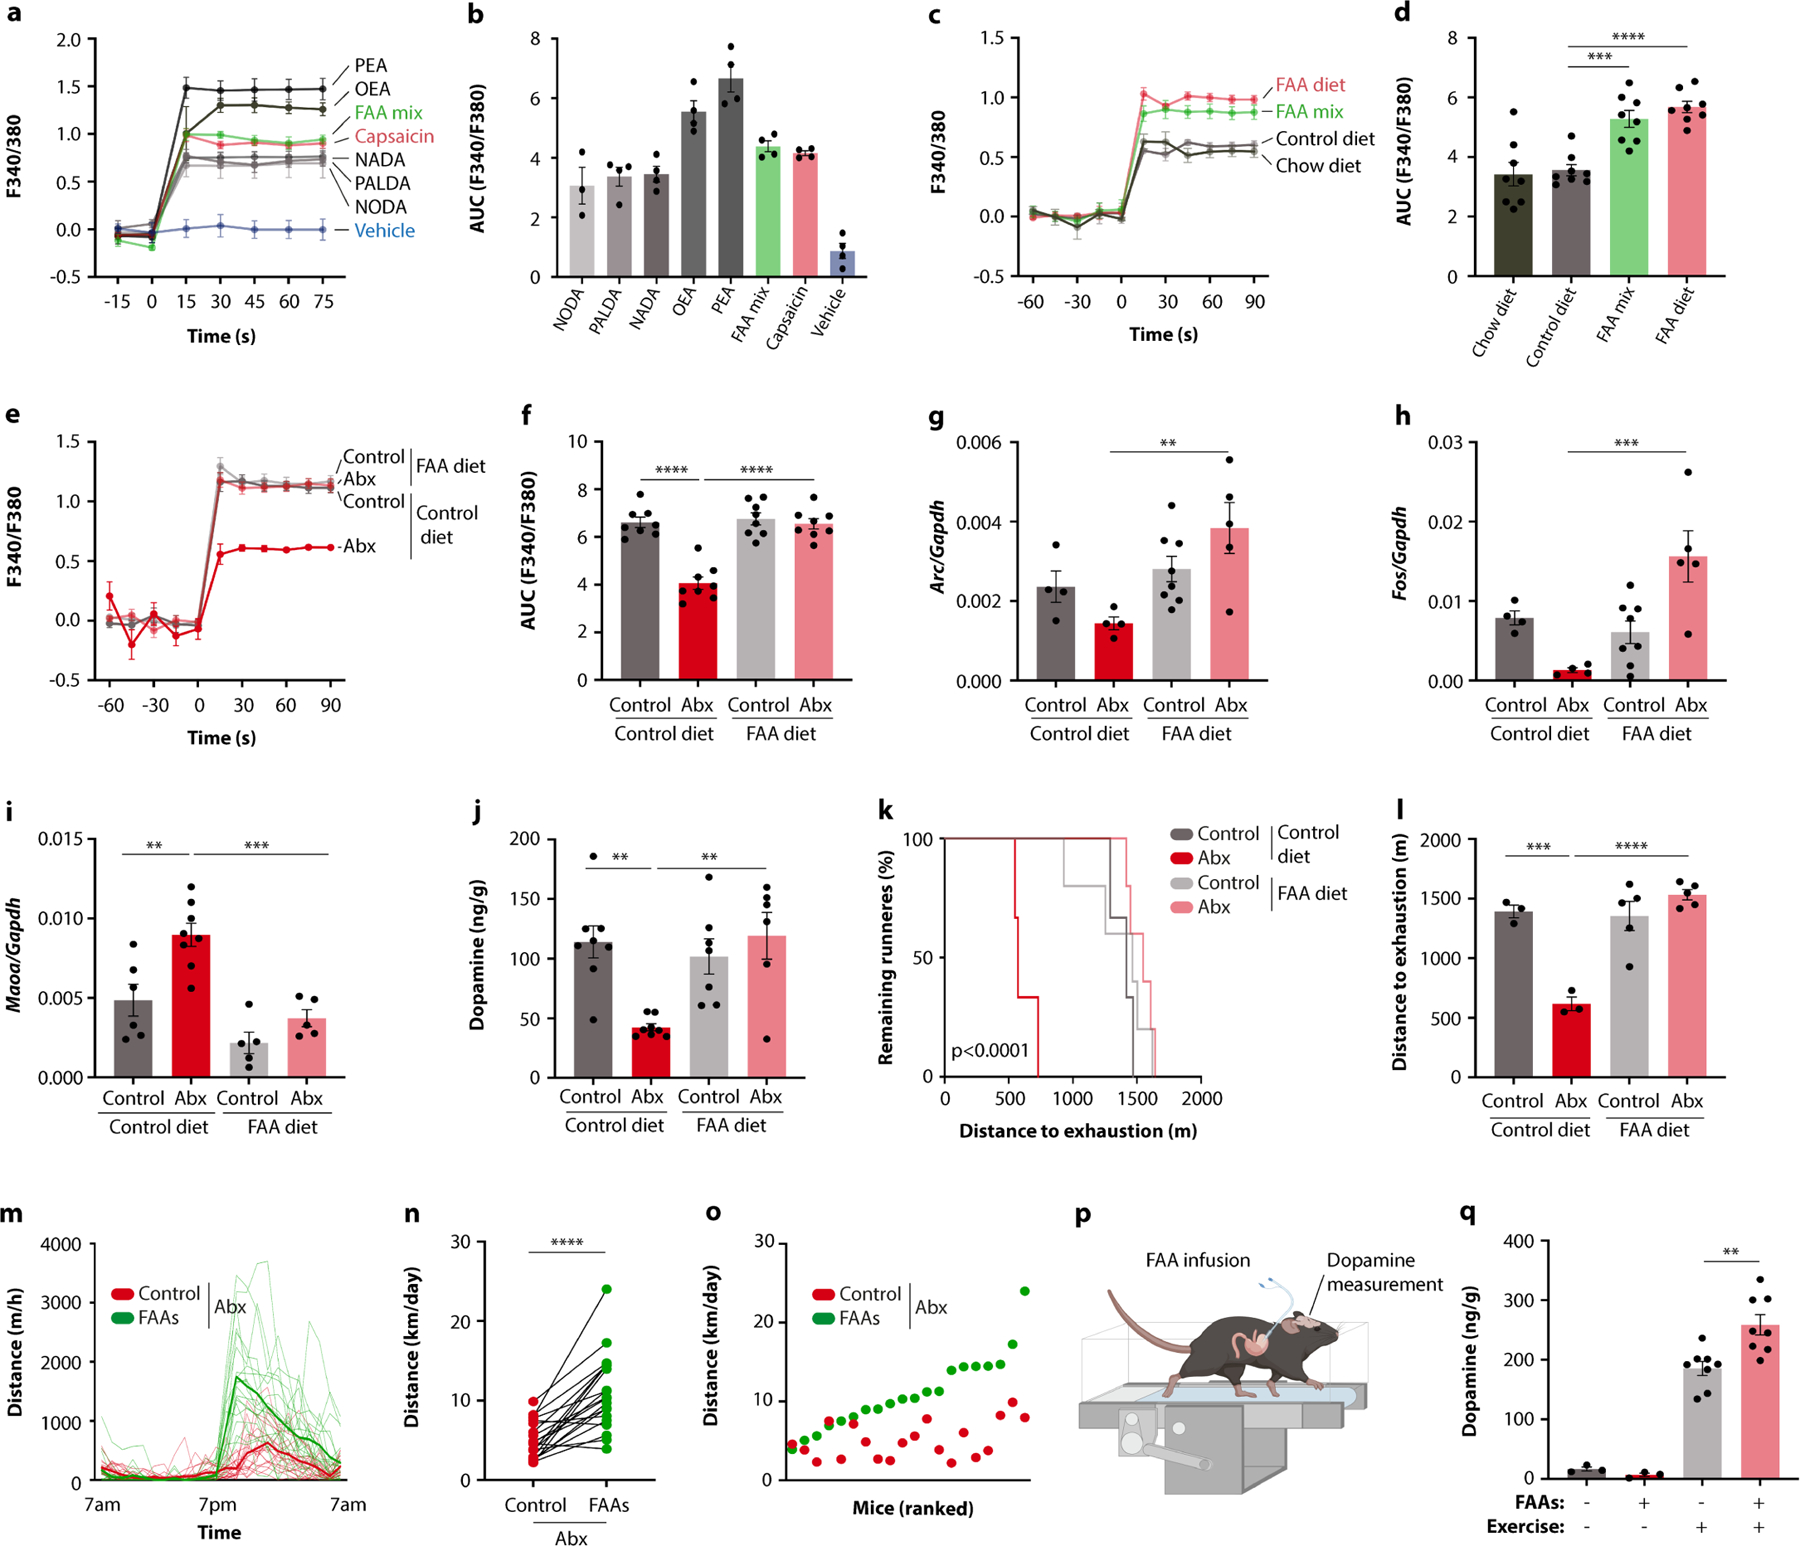
a-f, Averaged recording traces (a, c, e) and quantifications (b, d, f) of calcium imaging of DRG neurons exposed to individual metabolites (a, b), a fatty acid amide (FAA)-supplemented diet (c, d), or stool extracts from mice fed a FAA-supplemented diet (e, f). g-l, Post-exercise expression of Arc and Fos in DRGs (g, h), post-exercise expression of Maoa and dopamine levels in the striatum (I, j), and Kaplan-Meier plot and quantification of distance on treadmill (k, l) by Abx-treated mice and control, fed a FAA-supplemented or control diet. m-o, Wheel running of Abx-treated DO mice, fed a FAA-supplemented or control diet. p, q, Schematic (p) and striatal dopamine levels (q) of Abx-treated mice receiving gastric infusion of FAA, with or without treadmill exercise. Error bars indicate means ± SEM. ** p < 0.01, *** p < 0.001, **** p < 0.0001. Exact n and p-values are presented in Supplementary Table 2.
Extended Data Fig. 11 |. Microbiome engineering to enhance fatty acid amide production and exercise performance.
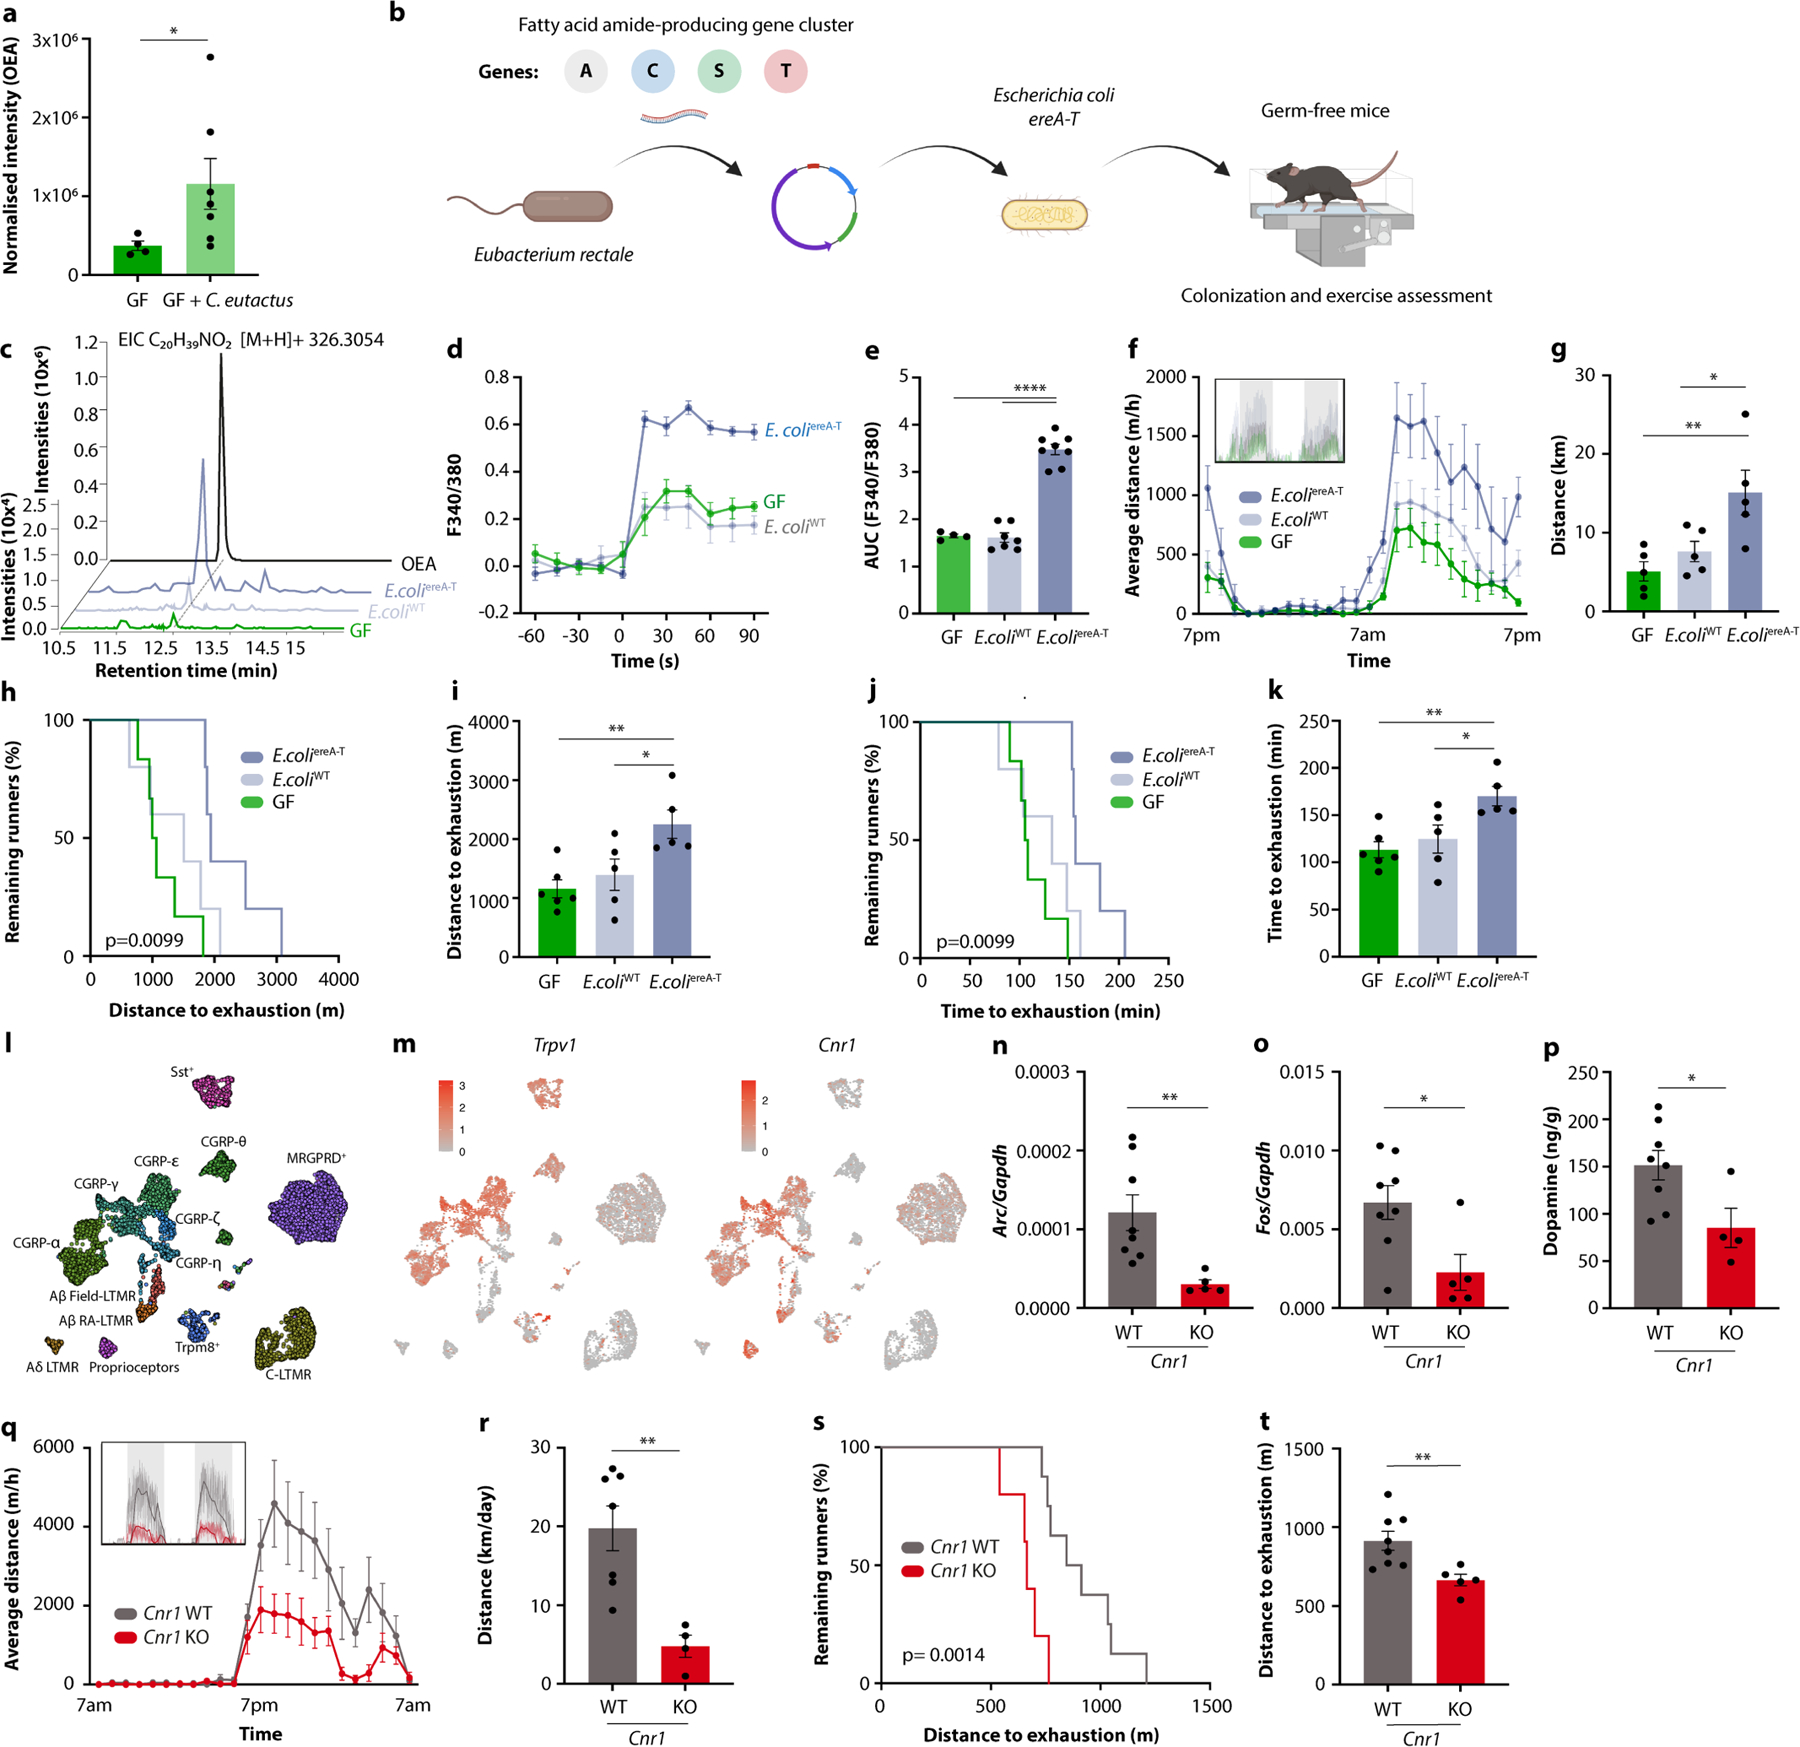
a, OEA levels in GF mice and GF mice mono-colonized with Coprococcus eutactus. b, Schematic of generation of Escherichia coli expressing the ereA-T gene cluster from Eubacterium rectale. c, OEA levels in GF mice and GF mice mono-colonized with either E. coliereA−T or the empty vector-containing strain E. coliWT. d, e, Averaged recording traces (d) and quantification (e) of calcium imaging of DRG neurons exposed to in stool extracts from GF mice and GF mice mono-colonized with either E. coliereA−T or E. coliWT. f, g, Averaged hourly distance (f) and quantification (g) of voluntary wheel activity of GF mice and GF mice mono-colonized with either E. coliereA−T or E. coliWT. Inset shows representative recording traces. h-k, Kaplan-Meier plots (h, j) and quantifications (i, k) of distance (h, i) and time ( j, k) on treadmills by GF mice and GF mice mono-colonized with either E. coliereA−T or E. coliWT. l, m, UMAP plot of all cell types identified in DRGs20 (l) and expression of Trpv1 and Cnr1 (m). n-p, Expression of Arc (n) and Fos (o) in the dorsal root ganglia, and dopamine levels in the striatum (p) of exercised Cnr1-deficient mice and controls. q, r, Averaged hourly distance (q) and quantification (r) of voluntary wheel activity of Cnr1-deficient mice and controls. Inset shows representative recording traces. s, t, Kaplan-Meier plot (s) and quantification (t) of distance on treadmills by Cnr1-deficient mice and controls. Error bars indicate means ± SEM. * p < 0.05, ** p < 0.01, **** p < 0.0001. Exact n and p-values are presented in Supplementary Table 2.
Extended Data Fig. 12 |. Stimulation of peripheral endocannabinoid receptors drives exercise performance.
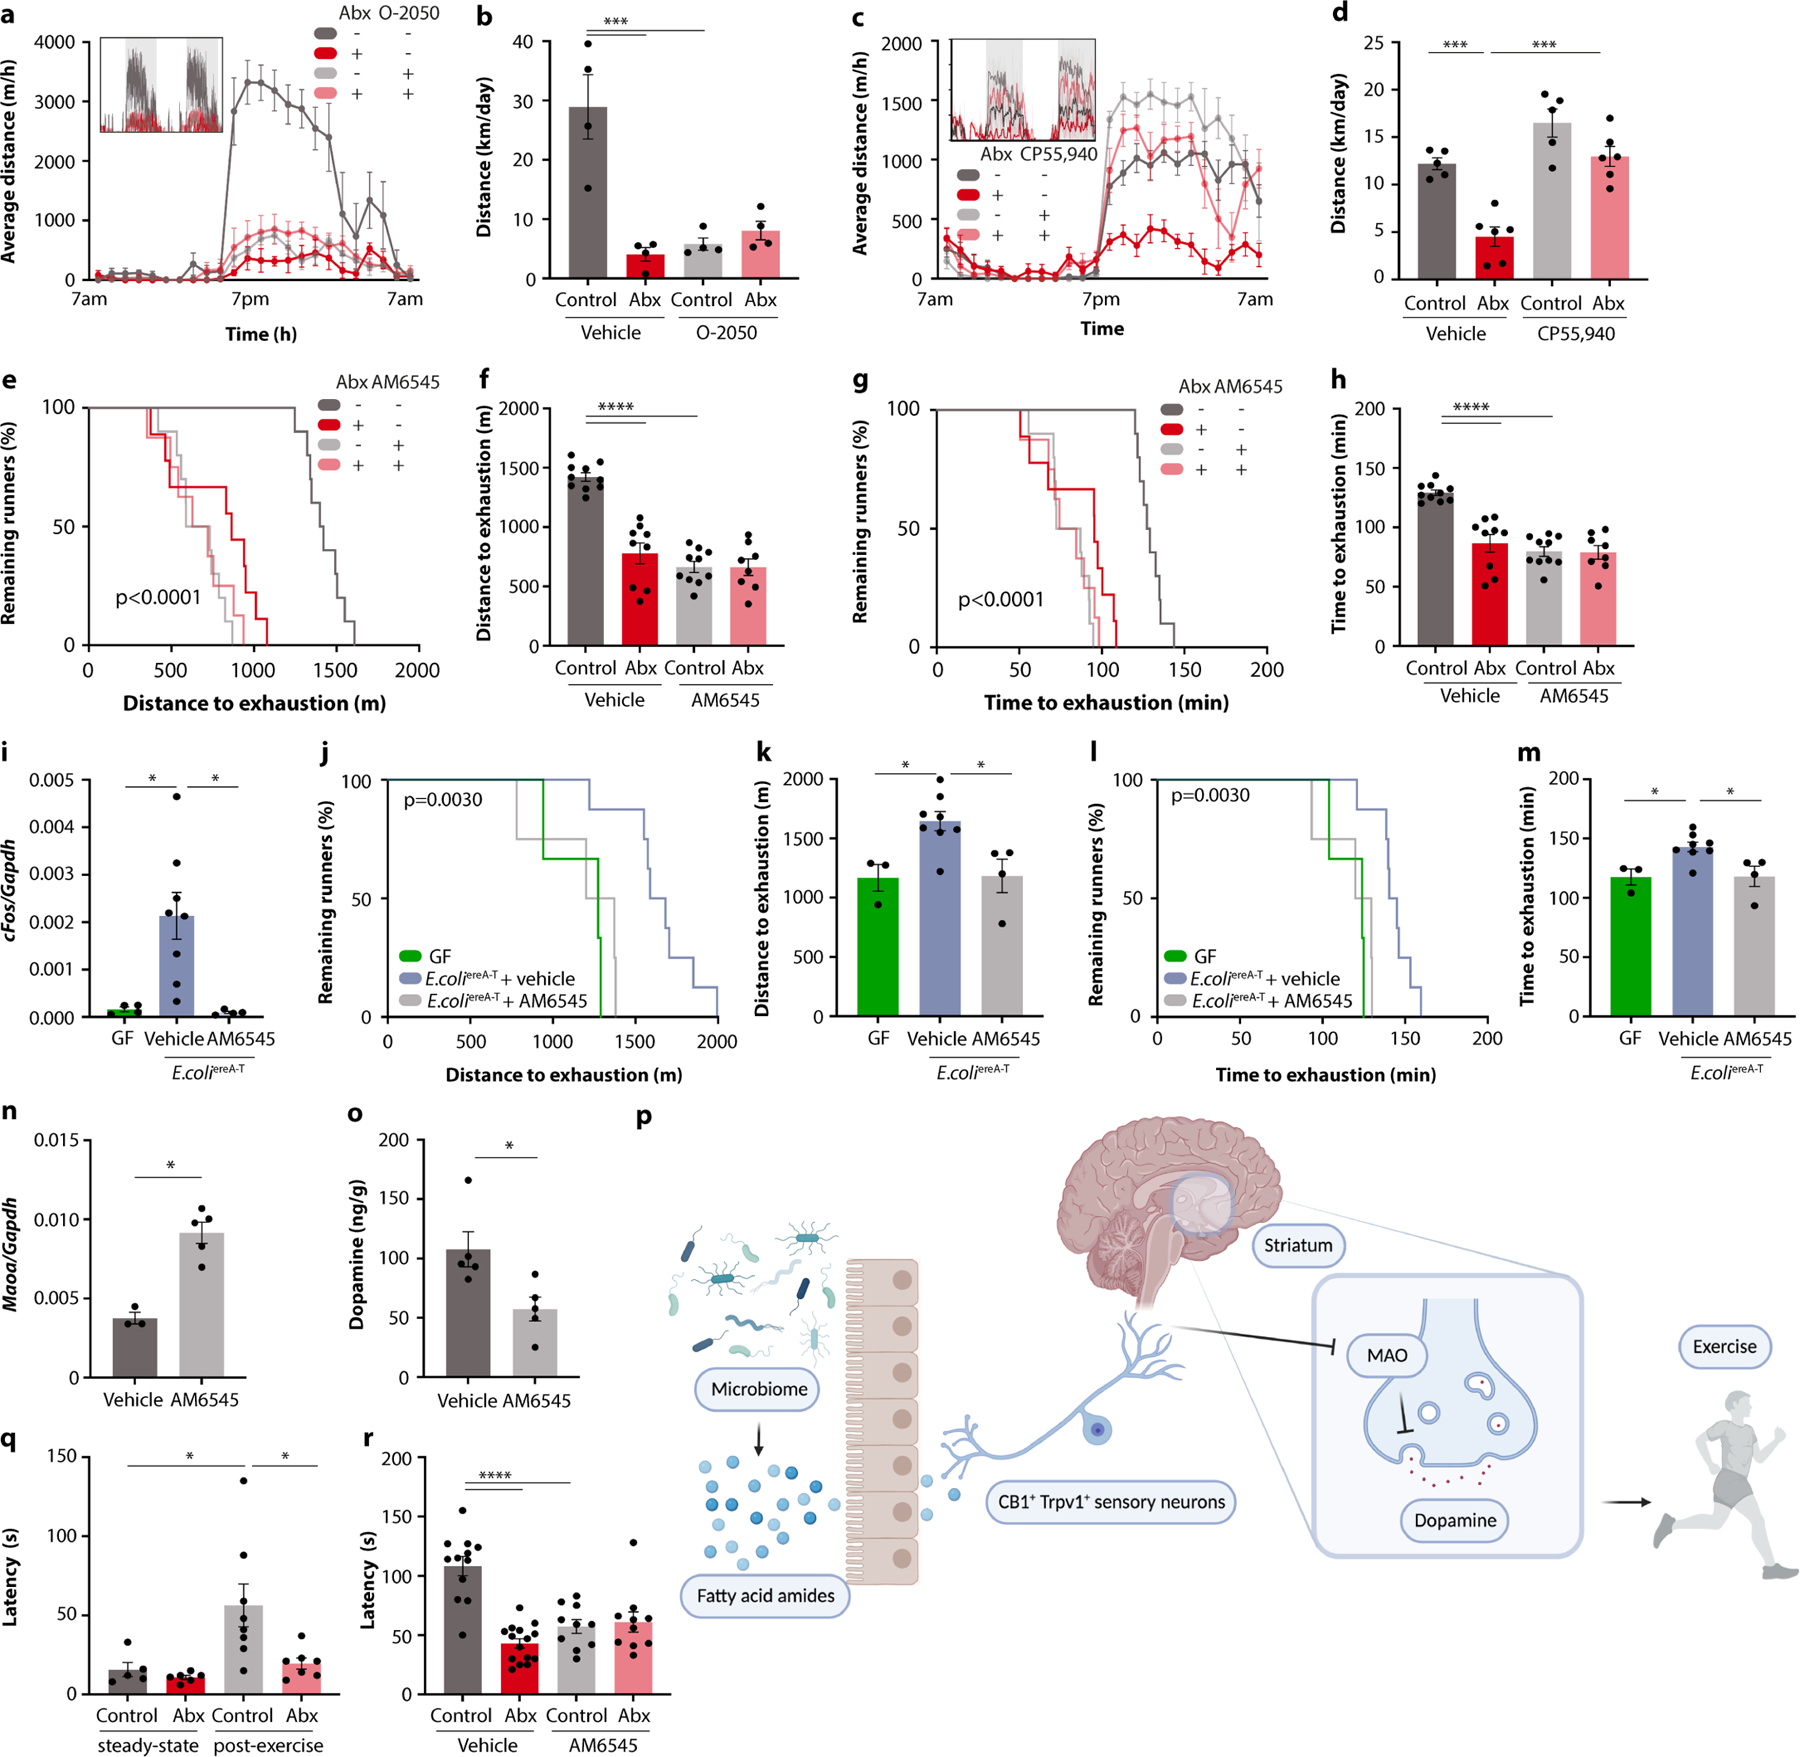
a-d, Averaged hourly distance (a, c) and quantifications (b, d) of voluntary wheel activity of Abx-treated mice and controls, with or without treatment with the CB1 inhibitor O-2050 (a, b) or the CB1 agonist CP55,940 (c, d). Insets show representative recording traces. e-h, Kaplan-Meier plots (e, g) and quantifications (f, h) of distance (e, f) and time (g, h) on treadmills by Abx-treated mice and controls, with or without treatment with the peripheral CB1 inhibitor AM6545. i-m, Fos expression in DRGs (i), Kaplan-Meier plots ( j, l) and quantifications (k, m) of distance ( j, k) and time (l, m) on treadmills by GF mice and GF mice mono-colonized with E. coliereA−T, with and without AM6545 treatment. n, o, Expression of Maoa (n) and dopamine levels in the striatum (o) of AM6545-treated mice after treadmill exercise. p, Schematic of pathway model linking the intestinal microbiome to exercise performance. q, r, Latency to paw withdrawal on a hot plate by Abx-treated mice and controls before and after exercise (q) and after exercise, with and without AM6545 treatment (r). Error bars indicate means ± SEM. * p < 0.05, *** p < 0.001, **** p < 0.0001. Exact n and p-values are presented in Supplementary Table 2.
Supplementary Material
Acknowledgements
We thank the members of the Thaiss and Betley labs for valuable discussions and input. We acknowledge D. Kobuley and M. Albright for germ-free animal caretaking, M. Tetlak for technical assistance and L. Micha for mouse husbandry. We thank N. Yucel and Z. Arany (University of Pennsylvania) for access to running wheel cages, G. Kunos (National Institute of Health) for CB1-deficient mice, M. Abt (University of Pennsylvania) for bacterial strains, the Rodent Metabolic Phenotyping Core (S10-OD025098) for metabolic cage measurements and S. Cherry and J. Henao-Mejia for critical support. P.L. was supported by the NIH (F31HL160065), N.G. by NSF GFRP (DGE-1845298) and J.K. by a Boehringer Ingelheim MD Fellowship. A.D.P. was supported by NIH grant no. S10-OD021750. J.N.B. is supported by NIH grant no. P01DK119130 and R01DK115578, and by a Klingenstein-Simons Fellowship. C.A.T. is a Pew Biomedical Scholar and a Kathryn W. Davis Aging Brain Scholar and is supported by the NIH Director’s New Innovator Award (grant no. DP2AG067492), NIH grant no. R01-DK-129691, the Edward Mallinckrodt, Jr Foundation, the Agilent Early Career Professor Award, the Global Probiotics Council, the Mouse Microbiome Metabolic Research Program of the National Mouse Metabolic Phenotyping Centers and grants by the IDSA Foundation, the Thyssen Foundation, the Human Frontier Science Program (HFSP), the Penn Center for Musculoskeletal Disorders (grant no. P30-AR-069619), the PennCHOP Microbiome Program, the Penn Institute for Immunology, the Penn Center for Molecular Studies in Digestive and Liver Diseases (grant no. P30-DK-050306), the Penn Skin Biology and Diseases Resource-based Center (grant no. P30-AR-069589), the Penn Diabetes Research Center (grant no. P30-DK-019525), the Penn Institute on Aging and the Dean’s Innovation Fund of the University of Pennsylvania Perelman School of Medicine.
Footnotes
Online content
Any methods, additional references, Nature Portfolio reporting summaries, source data, extended data, supplementary information, acknowledgements, peer review information; details of author contributions and competing interests; and statements of data and code availability are available at https://doi.org/10.1038/s41586-022-05525-z.
Competing interests The authors declare no competing interests.
Additional information
Supplementary information The online version contains supplementary material available at https://doi.org/10.1038/s41586-022-05525-z.
Peer review information Nature thanks Aleksandar Kostic and the other, anonymous, reviewer(s) for their contribution to the peer review of this work.
Data availability
Raw sequencing data for this study are publicly available under accession numbers PRJNA865937, PRJNA866511 and GSE210906. Source data are provided with this paper.
References
- 1.Neufer PD et al. Understanding the cellular and molecular mechanisms of physical activity-induced health benefits. Cell Metab. 22, 4–11 (2015). [DOI] [PubMed] [Google Scholar]
- 2.Hawley JA, Hargreaves M, Joyner MJ & Zierath JR Integrative biology of exercise. Cell 159, 738–749 (2014). [DOI] [PubMed] [Google Scholar]
- 3.Churchill GA, Gatti DM, Munger SC & Svenson KL The diversity outbred mouse population. Mamm. Genome 23, 713–718 (2012). [DOI] [PMC free article] [PubMed] [Google Scholar]
- 4.Kelly SA & Pomp D Genetic determinants of voluntary exercise. Trends Genet. 29, 348–357 (2013). [DOI] [PMC free article] [PubMed] [Google Scholar]
- 5.Scheiman J et al. Meta-omics analysis of elite athletes identifies a performance-enhancing microbe that functions via lactate metabolism. Nat. Med. 25, 1104–1109 (2019). [DOI] [PMC free article] [PubMed] [Google Scholar]
- 6.Okamoto T et al. Microbiome potentiates endurance exercise through intestinal acetate production. Am. J. Physiol. Endocrinol. Metab. 316, E956–E966 (2019). [DOI] [PubMed] [Google Scholar]
- 7.Hsu YJ et al. Effect of intestinal microbiota on exercise performance in mice. J. Strength. Cond. Res. 29, 552–558 (2015). [DOI] [PubMed] [Google Scholar]
- 8.Nay K et al. Gut bacteria are critical for optimal muscle function: a potential link with glucose homeostasis. Am. J. Physiol. Endocrinol. Metab. 317, E158–E171 (2019). [DOI] [PubMed] [Google Scholar]
- 9.Lundberg SM et al. From local explanations to global understanding with explainable AI for trees. Nat. Mach. Intell. 2, 56–67 (2020). [DOI] [PMC free article] [PubMed] [Google Scholar]
- 10.Lahiri S et al. The gut microbiota influences skeletal muscle mass and function in mice. Sci. Transl. Med. 11, eaan566 (2019). [DOI] [PMC free article] [PubMed] [Google Scholar]
- 11.Almagro BJ, Saenz-Lopez P, Fierro-Suero S & Conde C Perceived performance, intrinsic motivation and adherence in athletes. Int. J. Environ. Res. Public Health 17, 9441 (2020). [DOI] [PMC free article] [PubMed] [Google Scholar]
- 12.Friend DM et al. Basal ganglia dysfunction contributes to physical inactivity in obesity. Cell Metab. 25, 312–321 (2017). [DOI] [PMC free article] [PubMed] [Google Scholar]
- 13.Fernandes MF et al. Leptin suppresses the rewarding effects of running via STAT3 signaling in dopamine neurons. Cell Metab. 22, 741–749 (2015). [DOI] [PubMed] [Google Scholar]
- 14.Tong J et al. Brain monoamine oxidase B and A in human parkinsonian dopamine deficiency disorders. Brain 140, 2460–2474 (2017). [DOI] [PMC free article] [PubMed] [Google Scholar]
- 15.Cryan JF et al. The microbiota-gut-brain axis. Physiol. Rev. 99, 1877–2013 (2019). [DOI] [PubMed] [Google Scholar]
- 16.Cavanaugh DJ et al. Distinct subsets of unmyelinated primary sensory fibers mediate behavioral responses to noxious thermal and mechanical stimuli. Proc. Natl Acad. Sci. USA 106, 9075–9080 (2009). [DOI] [PMC free article] [PubMed] [Google Scholar]
- 17.Diepenbroek C et al. Validation and characterization of a novel method for selective vagal deafferentation of the gut. Am. J. Physiol. Gastrointest. Liver Physiol. 313, G342–G352 (2017). [DOI] [PMC free article] [PubMed] [Google Scholar]
- 18.Tellez LA et al. A gut lipid messenger links excess dietary fat to dopamine deficiency. Science 341, 800–802 (2013). [DOI] [PubMed] [Google Scholar]
- 19.Chang FY et al. Gut-inhabiting clostridia build human GPCR ligands by conjugating neurotransmitters with diet- and human-derived fatty acids. Nat. Microbiol. 6, 792–805 (2021). [DOI] [PubMed] [Google Scholar]
- 20.Sharma N et al. The emergence of transcriptional identity in somatosensory neurons. Nature 577, 392–398 (2020). [DOI] [PMC free article] [PubMed] [Google Scholar]
- 21.Muller C, Morales P & Reggio PH Cannabinoid ligands targeting TRP channels. Front. Mol. Neurosci. 11, 487 (2018). [DOI] [PMC free article] [PubMed] [Google Scholar]
- 22.Dubreucq S, Koehl M, Abrous DN, Marsicano G & Chaouloff F CB1 receptor deficiency decreases wheel-running activity: consequences on emotional behaviours and hippocampal neurogenesis. Exp. Neurol. 224, 106–113 (2010). [DOI] [PubMed] [Google Scholar]
- 23.Cluny NL et al. A novel peripherally restricted cannabinoid receptor antagonist, AM6545, reduces food intake and body weight, but does not cause malaise, in rodents. Br. J. Pharmacology 161, 629–642 (2010). [DOI] [PMC free article] [PubMed] [Google Scholar]
- 24.Bull FC et al. World Health Organization 2020 guidelines on physical activity and sedentary behaviour. Br. J. Sports Med. 54, 1451–1462 (2020). [DOI] [PMC free article] [PubMed] [Google Scholar]
- 25.Teixeira PJ, Carraca EV, Markland D, Silva MN & Ryan RM Exercise, physical activity, and self-determination theory: a systematic review. Int. J. Behav. Nutr. Phys. 9, 78 (2012). [DOI] [PMC free article] [PubMed] [Google Scholar]
- 26.Fuss J et al. A runner’s high depends on cannabinoid receptors in mice. Proc. Natl Acad. Sci. USA 112, 13105–13108 (2015). [DOI] [PMC free article] [PubMed] [Google Scholar]
- 27.Su Z, Alhadeff AL & Betley JN Nutritive, post-ingestive signals are the primary regulators of AgRP neuron activity. Cell Rep. 21, 2724–2736 (2017). [DOI] [PMC free article] [PubMed] [Google Scholar]
- 28.Goldstein N et al. Hypothalamic detection of macronutrients via multiple gut-brain pathways. Cell Metab. 33, 676–687 e675 (2021). [DOI] [PMC free article] [PubMed] [Google Scholar]
- 29.Lin YT & Chen JC Dorsal root ganglia isolation and primary culture to study neurotransmitter release. J. Vis. Exp. 10.3791/57569 (2018). [DOI] [PMC free article] [PubMed] [Google Scholar]
- 30.Loro E et al. Effect of interleukin-15 receptor alpha ablation on the metabolic responses to moderate exercise simulated by in vivo isometric muscle contractions. Front. Physiol. 10, 1439 (2019). [DOI] [PMC free article] [PubMed] [Google Scholar]
- 31.Habib N et al. Massively parallel single-nucleus RNA-seq with DroNc-seq. Nat. Methods 14, 955–958 (2017). [DOI] [PMC free article] [PubMed] [Google Scholar]
- 32.Hafemeister C & Satija R Normalization and variance stabilization of single-cell RNA-seq data using regularized negative binomial regression. Genome Biol. 20, 296 (2019). [DOI] [PMC free article] [PubMed] [Google Scholar]
- 33.Gokce O et al. Cellular taxonomy of the mouse striatum as revealed by single-cell RNA-seq. Cell Rep. 16, 1126–1137 (2016). [DOI] [PMC free article] [PubMed] [Google Scholar]
- 34.Wang L, Liu J, Harvey-White J, Zimmer A & Kunos G Endocannabinoid signaling via cannabinoid receptor 1 is involved in ethanol preference and its age-dependent decline in mice. Proc. Natl Acad. Sci. USA 100, 1393–1398 (2003). [DOI] [PMC free article] [PubMed] [Google Scholar]
Associated Data
This section collects any data citations, data availability statements, or supplementary materials included in this article.
Supplementary Materials
Data Availability Statement
Raw sequencing data for this study are publicly available under accession numbers PRJNA865937, PRJNA866511 and GSE210906. Source data are provided with this paper.


