

Abstract
The functional engagement between an enhancer and its target promoter ensures precise gene transcription1. Understanding the basis of promoter choice by enhancers has important implications for health and disease. Here we report that functional loss of a preferred promoter can release its partner enhancer to loop to and activate an alternative promoter (or alternative promoters) in the neighbourhood. We refer to this target-switching process as ‘enhancer release and retargeting’. Genetic deletion, motif perturbation or mutation, and dCas9-mediated CTCF tethering reveal that promoter choice by an enhancer can be determined by the binding of CTCF at promoters, in a cohesin-dependent manner—consistent with a model of ‘enhancer scanning’ inside the contact domain. Promoter-associated CTCF shows a lower affinity than that at chromatin domain boundaries and often lacks a preferred motif orientation or a partnering CTCF at the cognate enhancer, suggesting properties distinct from boundary CTCF. Analyses of cancer mutations, data from the GTEx project and risk loci from genome-wide association studies, together with a focused CRISPR interference screen, reveal that enhancer release and retargeting represents an overlooked mechanism that underlies the activation of disease-susceptibility genes, as exemplified by a risk locus for Parkinson’s disease (NUCKS1–RAB7L1) and three loci associated with cancer (CLPTM1L–TERT, ZCCHC7–PAX5 and PVT1–MYC).
High-resolution data of chromatin architecture1 indicate that enhancers and promoters form complex patterns of finer-scale loops (around 10–50 kb)2; however, functionally, most enhancers regulate one gene within a short distance3. What dictates the specificity and plasticity of enhancer(s) and promoter(s) engagement to license productive gene transcription remains unclear4.
Promoter loss activates partner enhancers
In MCF-7 cells—a well-established model of enhancer-dependent promoter activation5—treatment with 17-β-oestradiol causes the rapid activation of enhancer RNAs (eRNAs), which precedes the activation of target gene promoters6 (Extended Data Fig. 1a). To understand enhancer–promoter (E-P) choice, we selected four ligand-induced E-P pairs that exhibit looping by 4C-seq (Extended Data Fig. 1b) and chromatin interaction analysis with paired-end tag sequencing (ChIA-PET)7, and deleted each of these promoters encompassing transcription start sites (TSSs) (Supplementary Table 1, Supplementary Figs. 2, 4). In cells in which the TFF1 promoter (TFF1p) was deleted (TFF1p-KO cells), the expression of TFF1 mRNA was extremely reduced, but that of TFF1 eRNA increased markedly (around three- to fivefold); genes on other chromosomes (for example, FOXC1) exhibited no significant alterations (Fig. 1a). Results from more than 10 independent clones and using a second pair of guide RNAs (gRNAs) (Extended Data Fig. 1c, d) confirmed these findings. Similarly, deletion of the P2RY2, KCNK5 and PGR promoters led to a reduction in the expression of their cognate genes but a significant increase in cognate eRNA transcription (Extended Data Fig. 2a, d, g). The TFF1 enhancer (TFF1e)—but not control enhancers—showed an increase in the binding of RNA polymerase II (Pol II) and p300 in TFF1p-KO cells (Extended Data Fig. 1e). These results support the notion that ligand-induced enhancers are activated temporally before promoters and initiate promoter choice.
Fig. 1 |. Promoter deletion causes ERR.
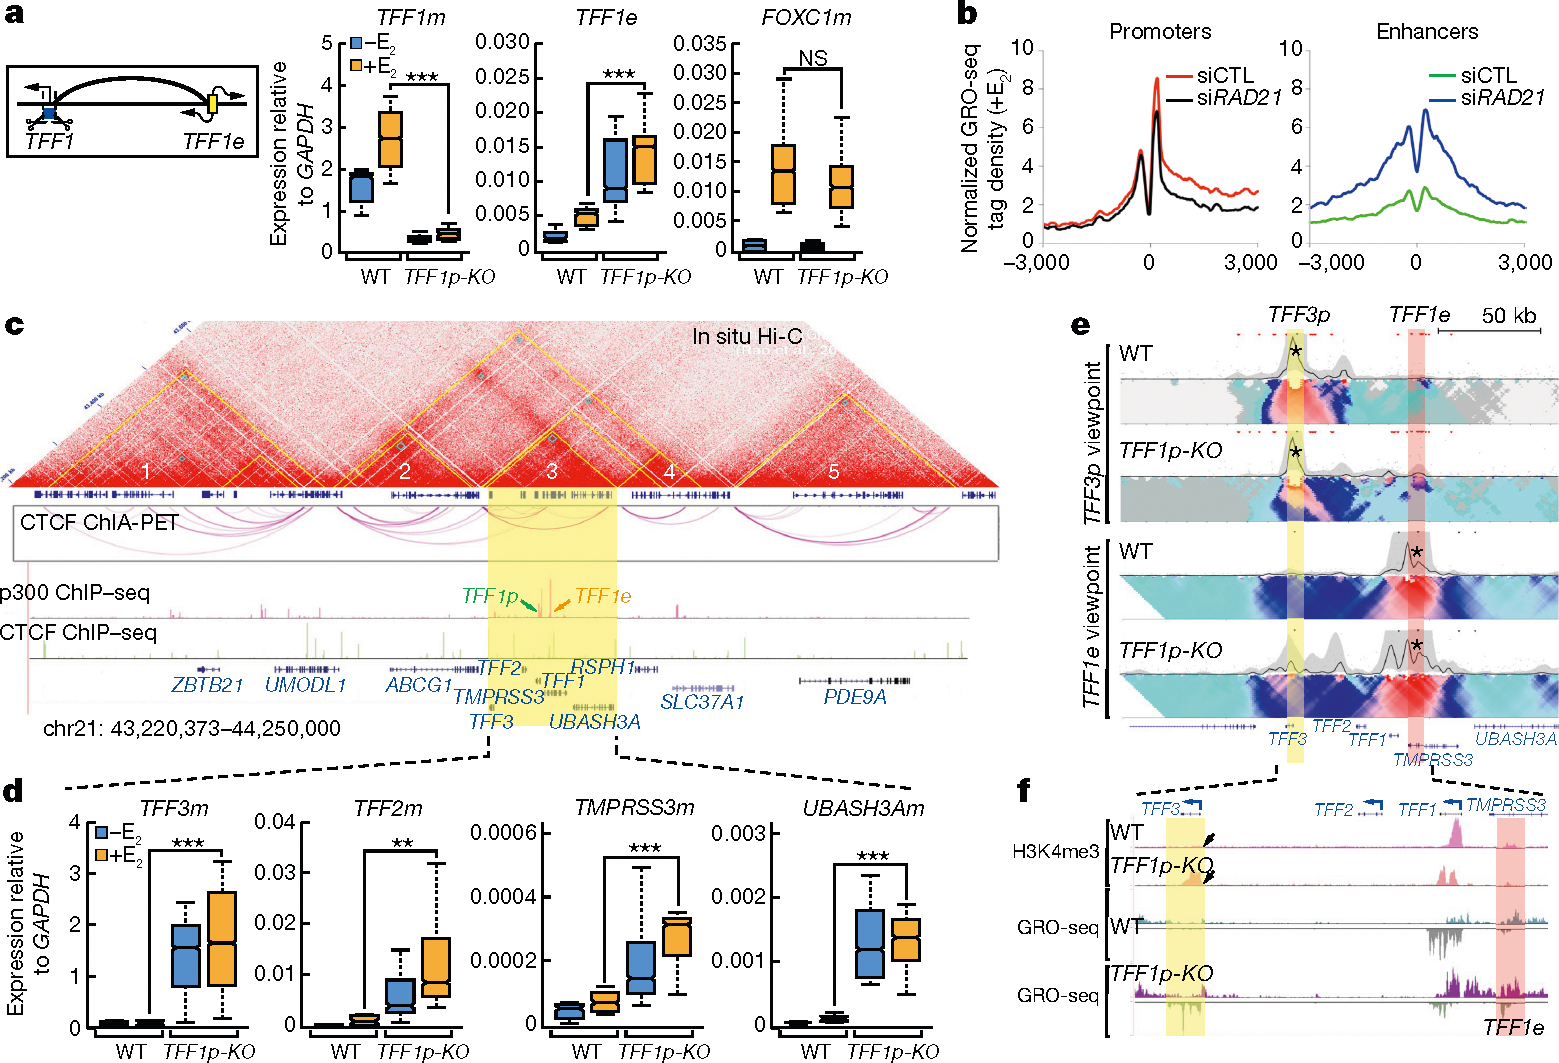
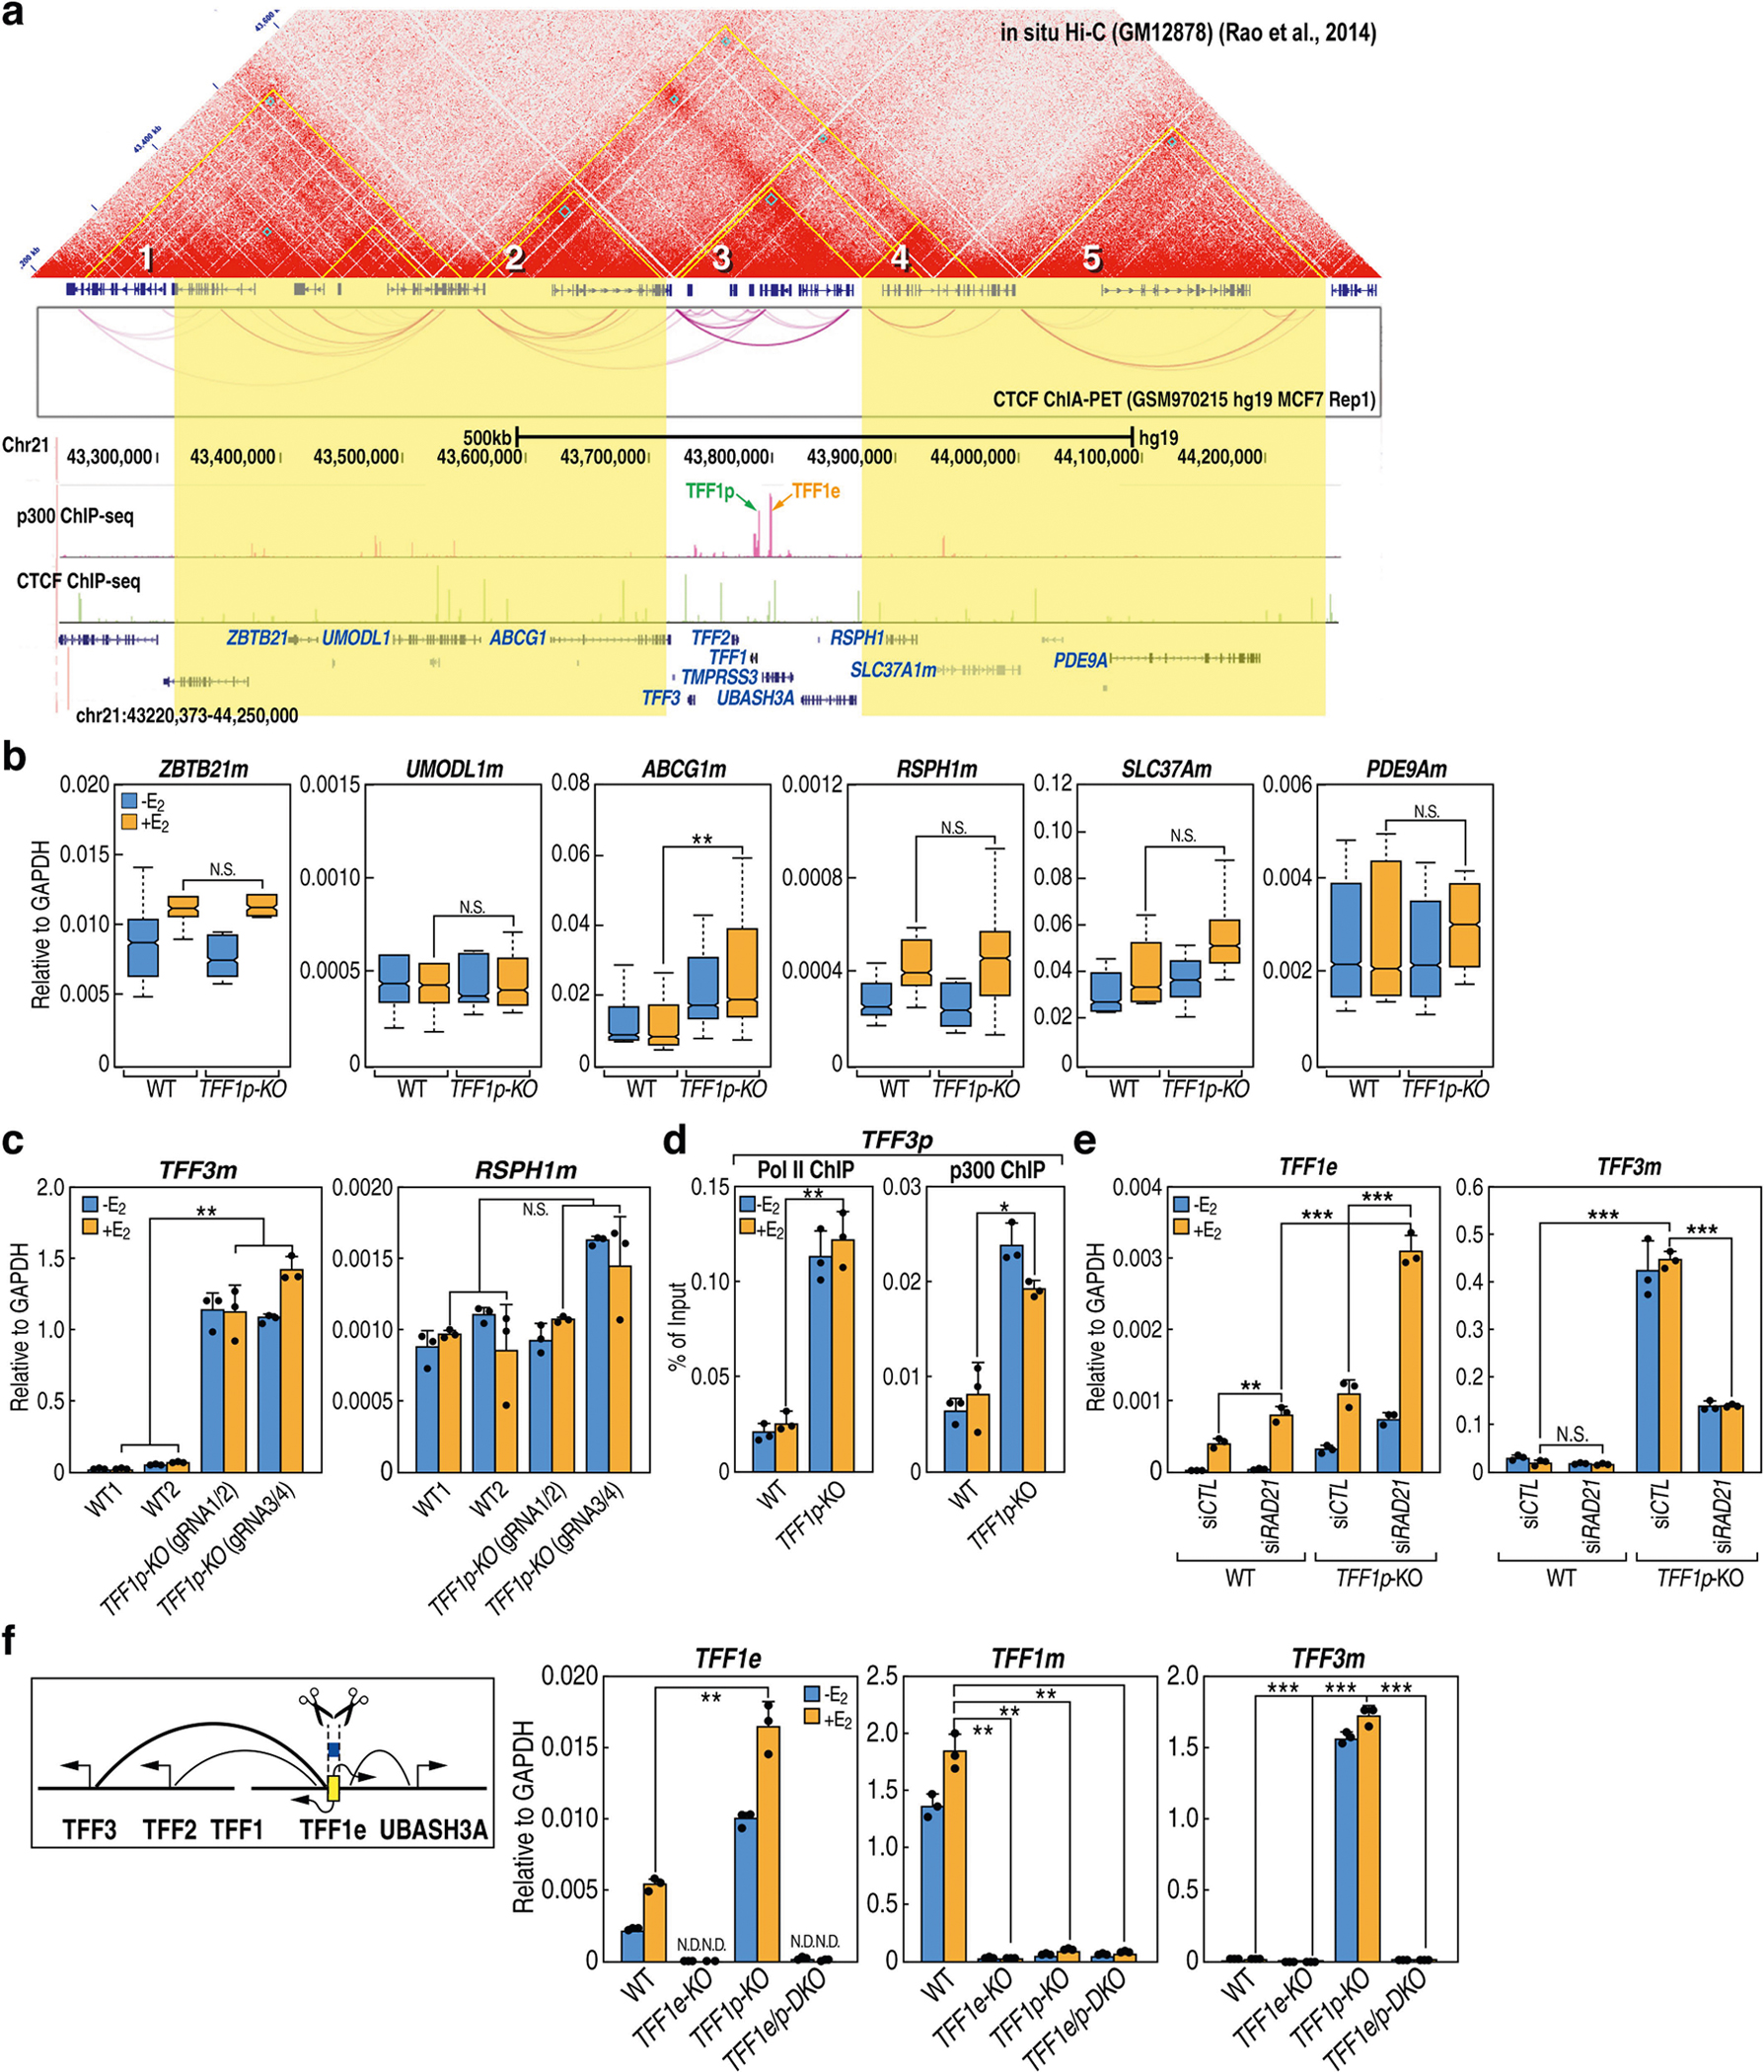
a, Box plots from qRT–PCR in wild-type (WT) (n = 6) and TFF1p-KO (n = 14) independent cell clones, showing the expression of TFF1 mRNA (TFF1m), TFF1 enhancer RNA (TFF1e) and FOXC1m relative to GAPDH. The left diagram shows the TFF1p deletion. b, Metagene plots showing GRO-seq signals from downregulated promoters or super-activated eRNAs after small interfering RNA (siRNA)-mediated knockdown of RAD21 (siRAD21). E2, 17-β-oestradiol. c, Hi-C map from GM12878 cells8 (top, by Juicebox); CTCF ChIA-PET in MCF-7 (from Gene Expression Omnibus (GEO) accession GSM970215) (middle); and indicated ChIP–seq tracks showing the chromosomal topology around the TFF1 locus (bottom). Yellow triangles in the Hi-C map denote contact domains, which are numbered for simplicity. The domain containing TFF1 is highlighted in yellow. d, Box plots from qRT–PCR in wild-type (n = 6) versus TFF1p-KO (n = 14) cell clones, showing the expression of all mRNAs (relative to GAPDH) in the domain hosting the TFF1 E-P pair. e, 4C-seq in wild-type versus TFF1p-KO cells, based on ‘viewpoints’ (asterisks) centred on TFF3p (yellow) or TFF1e (pink). f, Browser tracks showing GRO-seq and H3K4me3 ChIP–seq in the TFF1–TFF3 region in wild-type versus TFF1p-KO cells; arrowheads point to gained H3K4me3 on TFF3p. The box plot centre lines represent medians; box limits indicate the 25th and 75th percentiles; and whiskers extend 1.5 times the interquartile range (IQR) from the 25th and 75th percentiles. **P < 0.01, ***P < 0.001, NS, not significant, two-tailed Student’s t-test.
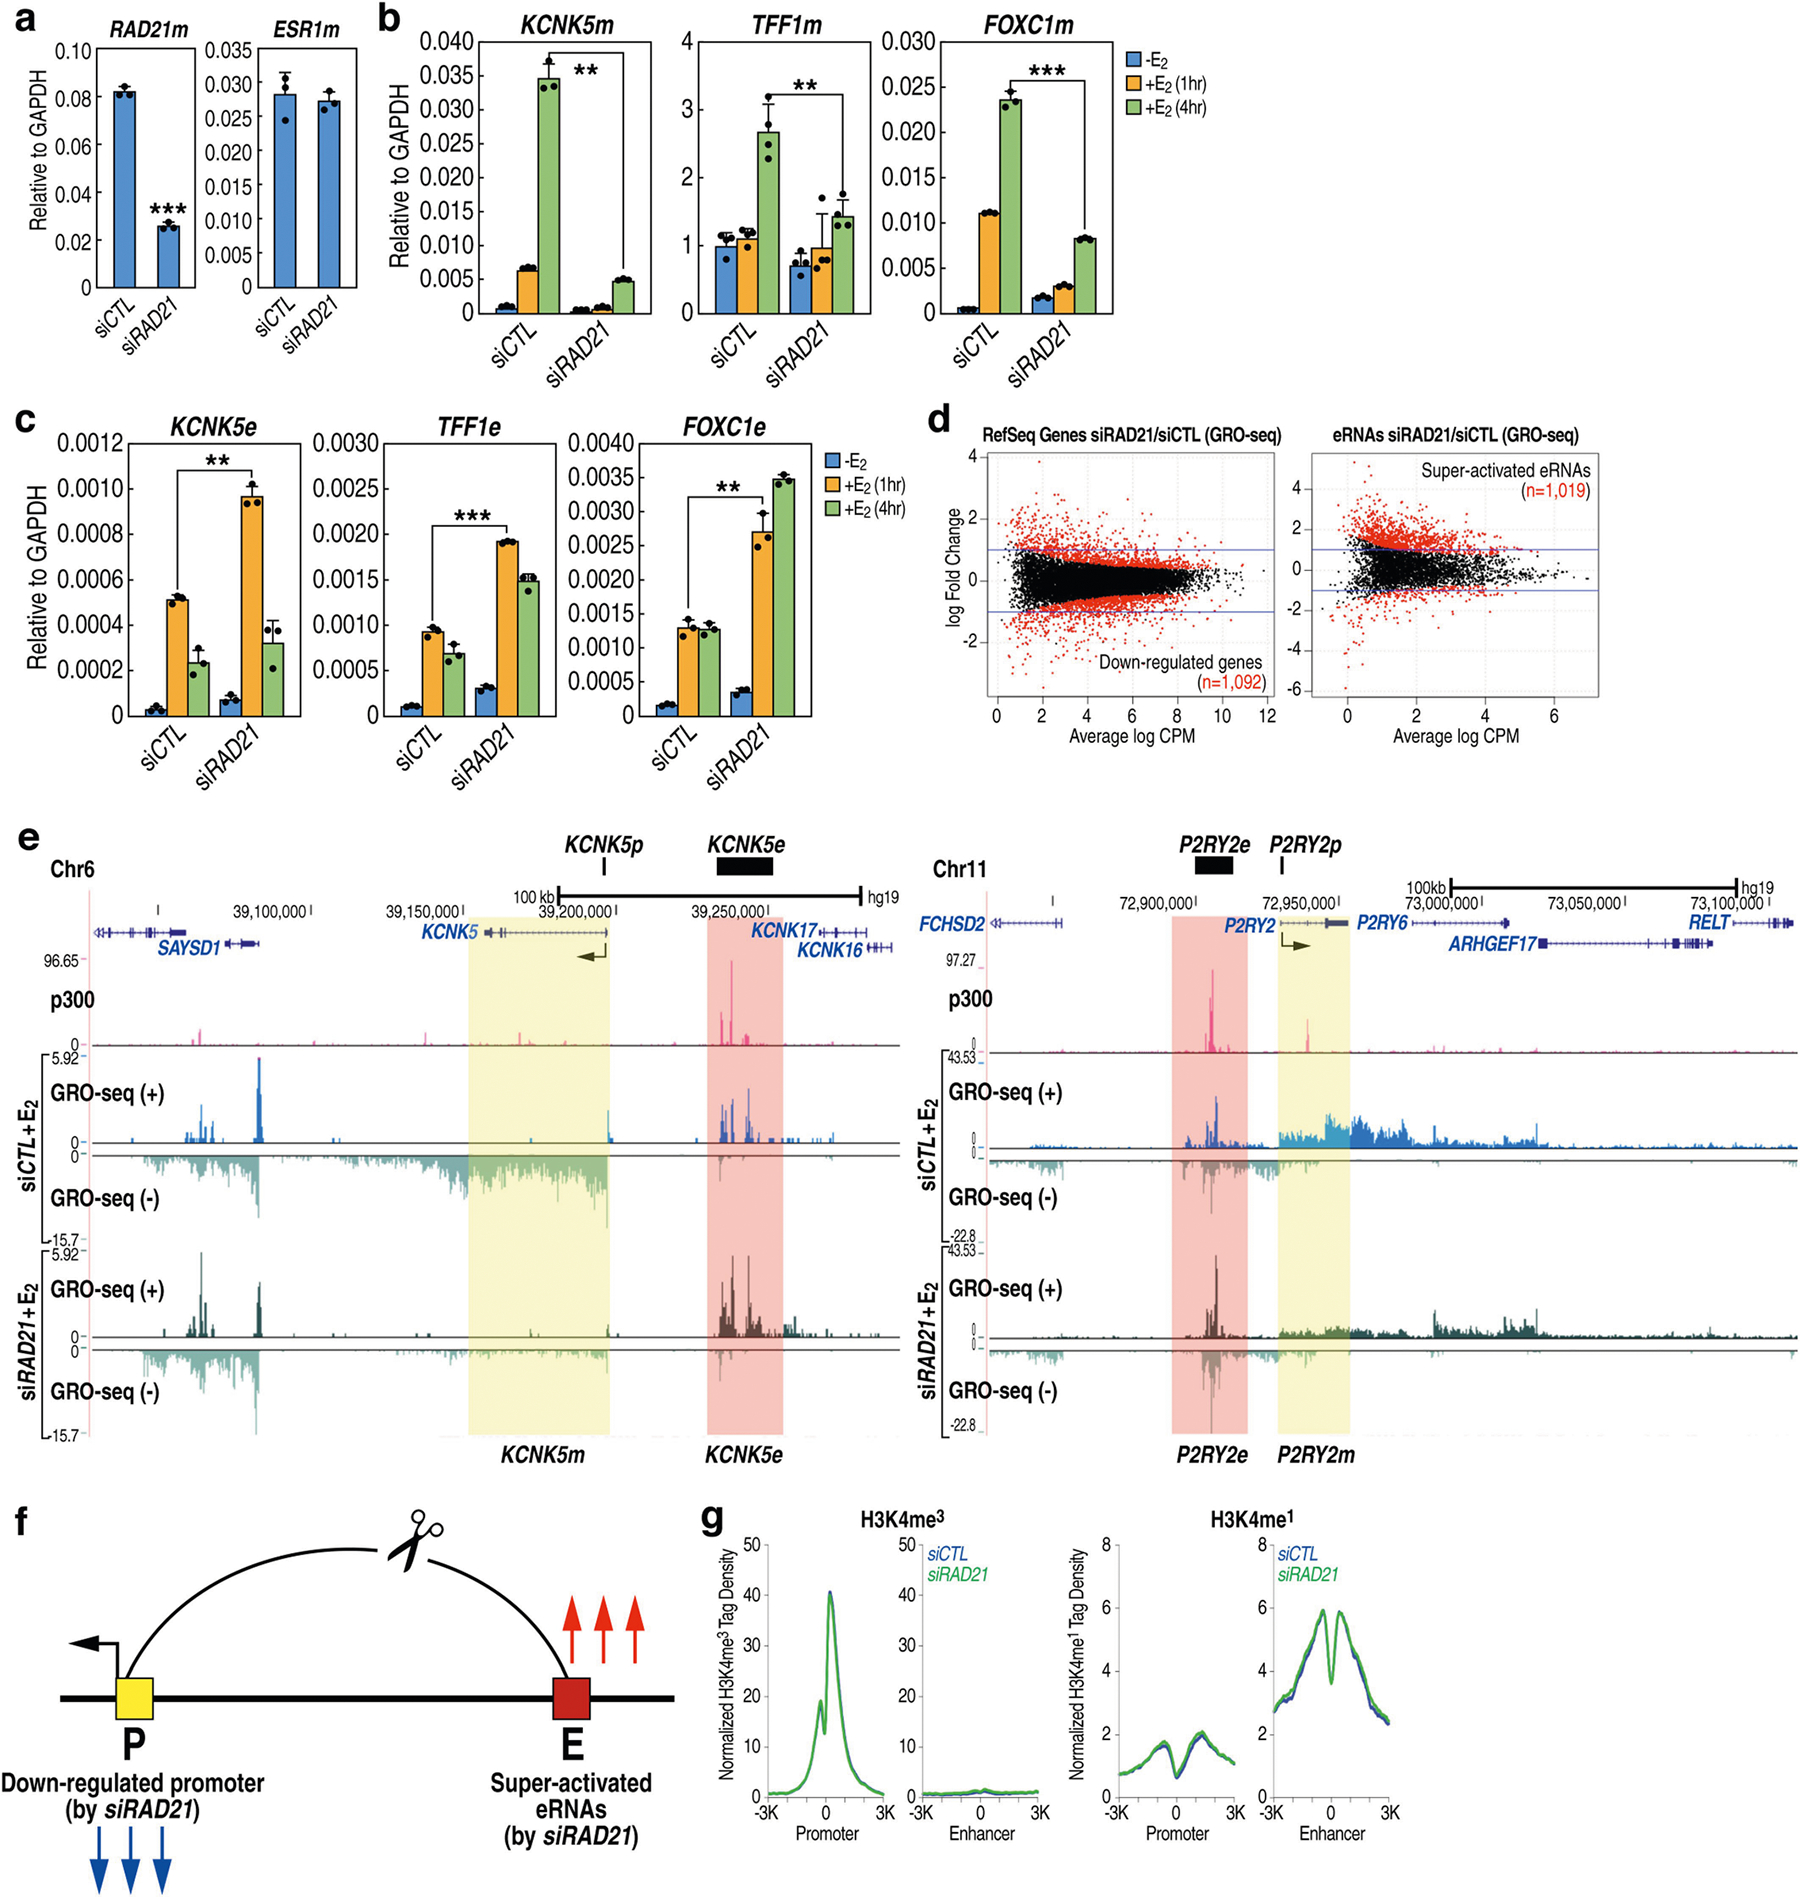
Results from cohesin knockdown experiments support this premise. Knockdown of RAD21 (which encodes a component of the cohesin complex) disrupted E-P loops in the loci we tested (Extended Data Figs. 1b, 3a), and concomitantly, GRO-seq and quantitative PCR with reverse transcription (qRT–PCR) showed that genes were no longer effectively induced by treatment with 17-β-oestradiol, whereas eRNAs were significantly upregulated (Fig. 1b, Extended Data Fig. 3b–f). No significant alteration of methylation of histone H3 at K4 (H3K4) was detected (Extended Data Fig. 3g).
Promoters determine E-P specificity
TFF1 and four other genes are located in an approximately 150-kb contact domain8 (Fig. 1c), adjacent to several other discernible domains. After deletion of TFF1p, the expression of TFF3 mRNA increased by more than 18-fold and the other three genes were also upregulated, albeit to a lesser extent (Fig. 1d). By contrast, genes in adjacent domains showed minimal changes in expression (Extended Data Fig. 4a–c). 4C-seq revealed an increased interaction between TFF1e and the TFF3 promoter (TFF3p) after knockout of TFF1p (Fig. 1e). Levels of the promoter histone mark H3K4me3 increased on TFF3p (Fig. 1f), accompanying an increase in the binding of Pol II and p300 (Extended Data Fig. 4d). The new TFF1e–TFF3p contact still required cohesin, because knockdown of RAD21 still led to an increase in the level of TFF1e eRNA, but a reduction in the level of TFF3 mRNA (Extended Data Fig. 4e).
Deletion of TFF1e in TFF1p-KO cells, generating a double knockout (TFF1e/p-DKO; Supplementary Table 1, Supplementary Fig. 3), abolished the abnormal activation of all promoter targets in the domain (Extended Data Fig. 4f). This indicated that TFF1e drove the activation of alternative promoters after knockout of TFF1p. By contrast, deletion of TFF1e alone, although reducing the levels of TFF1 mRNA, did not activate other genes (Extended Data Fig. 4f), indicating that the observed phenomenon—that is, super-activation of engaged enhancers and activation of alternative neighbouring promoters—was due to specific chromatin changes after promoter loss. Deletion of three other promoters tested had similar effects (Extended Data Fig. 2a, b, d, g, h). Together, these results suggest that the functional loss of cognate promoters ‘releases’ their enhancers to interact with and activate one or more gene promoters in the neighbourhood. We refer to this process as ‘enhancer release and retargeting’ (ERR).
Promoter CTCF determines E-P engagement
Our identification of the process of ERR provided an opportunity to understand the specificity and plasticity of functional E-P engagement and promoter choice4. We found that all promoters that we deleted contain a CTCF-binding site (Extended Data Fig. 2c, f, i). Promoters that were functionally engaged in E-P looping, as suggested by their downregulation after knockdown of RAD21, showed a higher level of CTCF binding than random promoters (Extended Data Fig. 5a–c). Because CTCF is crucial for the formation of topologically associated domains (TADs)9, we hypothesized that promoter CTCF might have a role in determining finer-scale E-P choice and engagement.
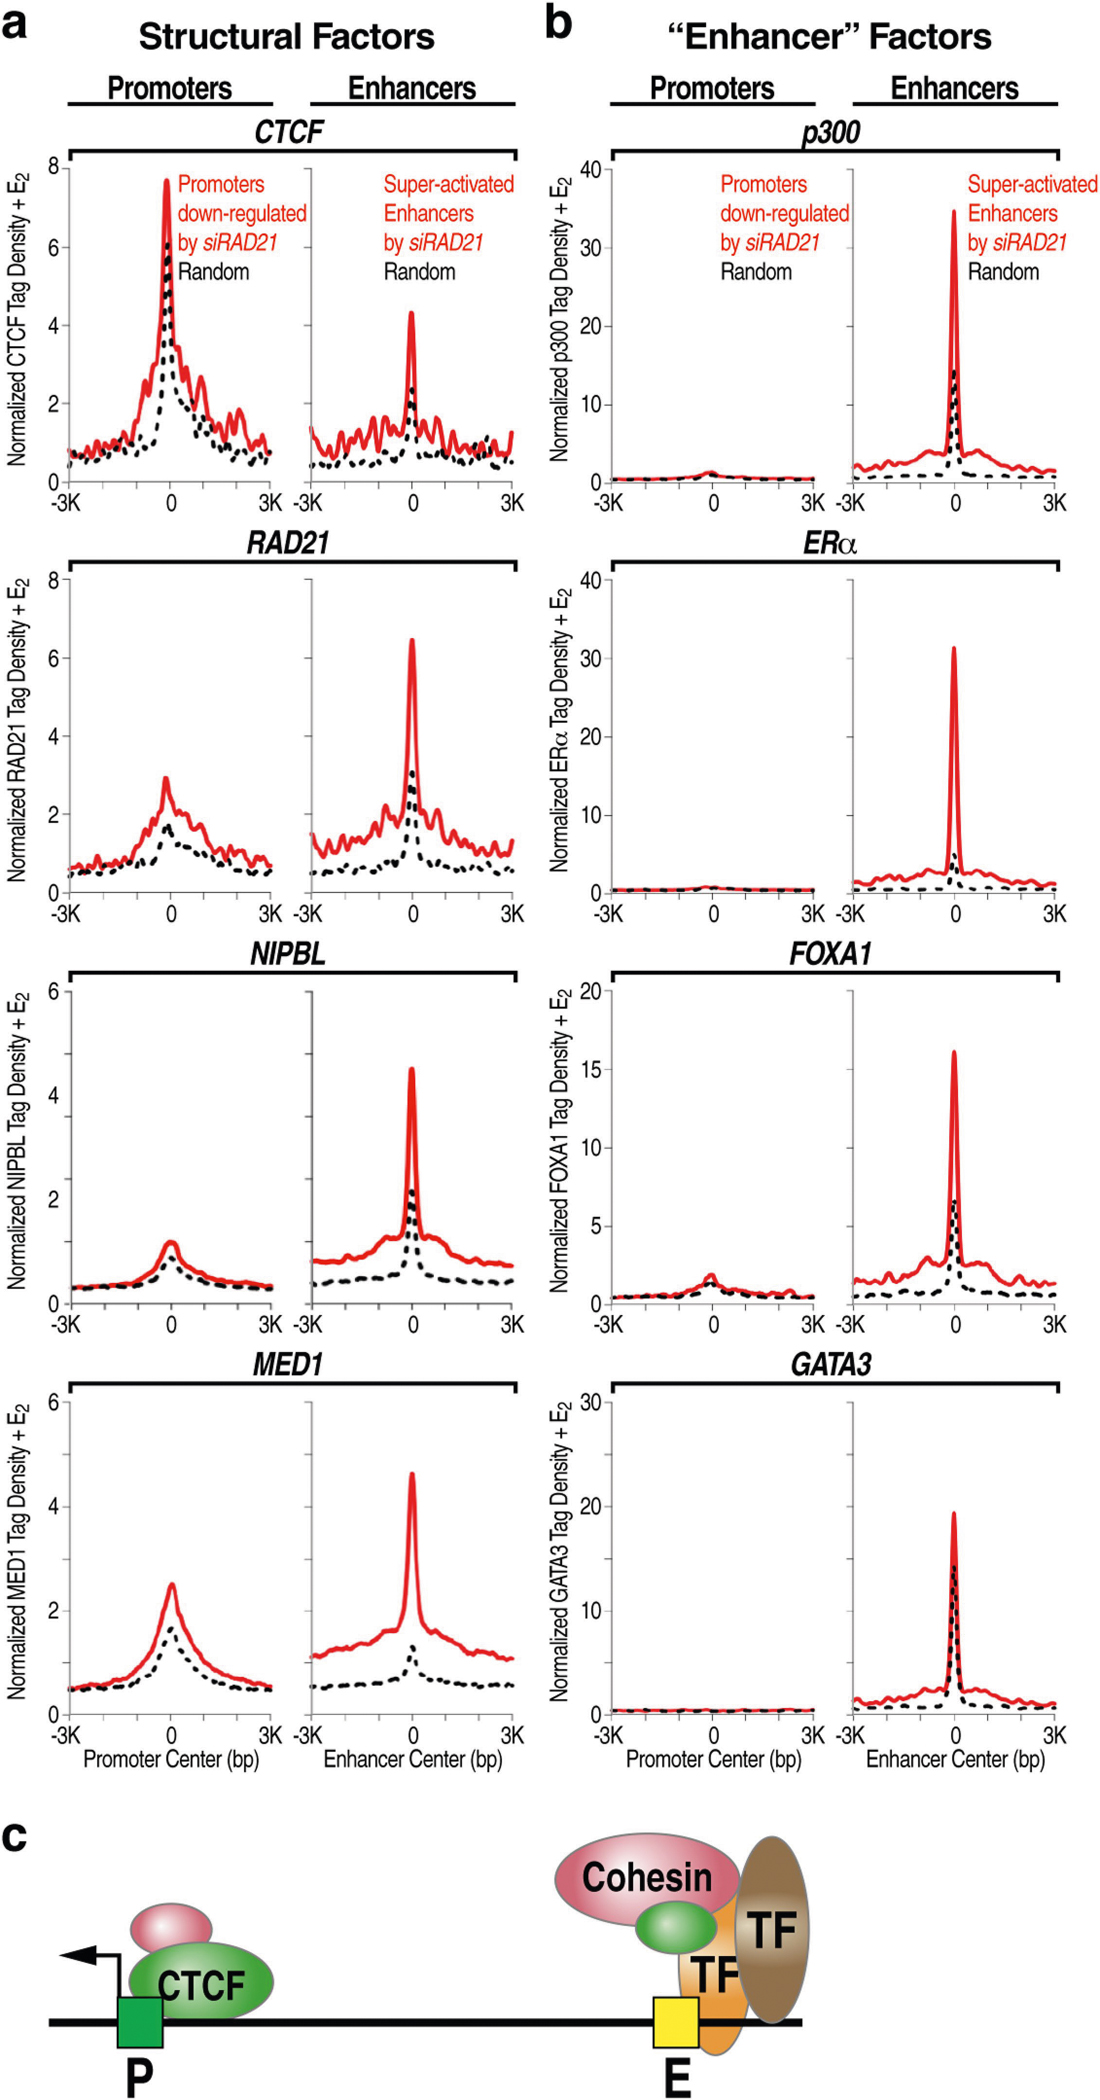
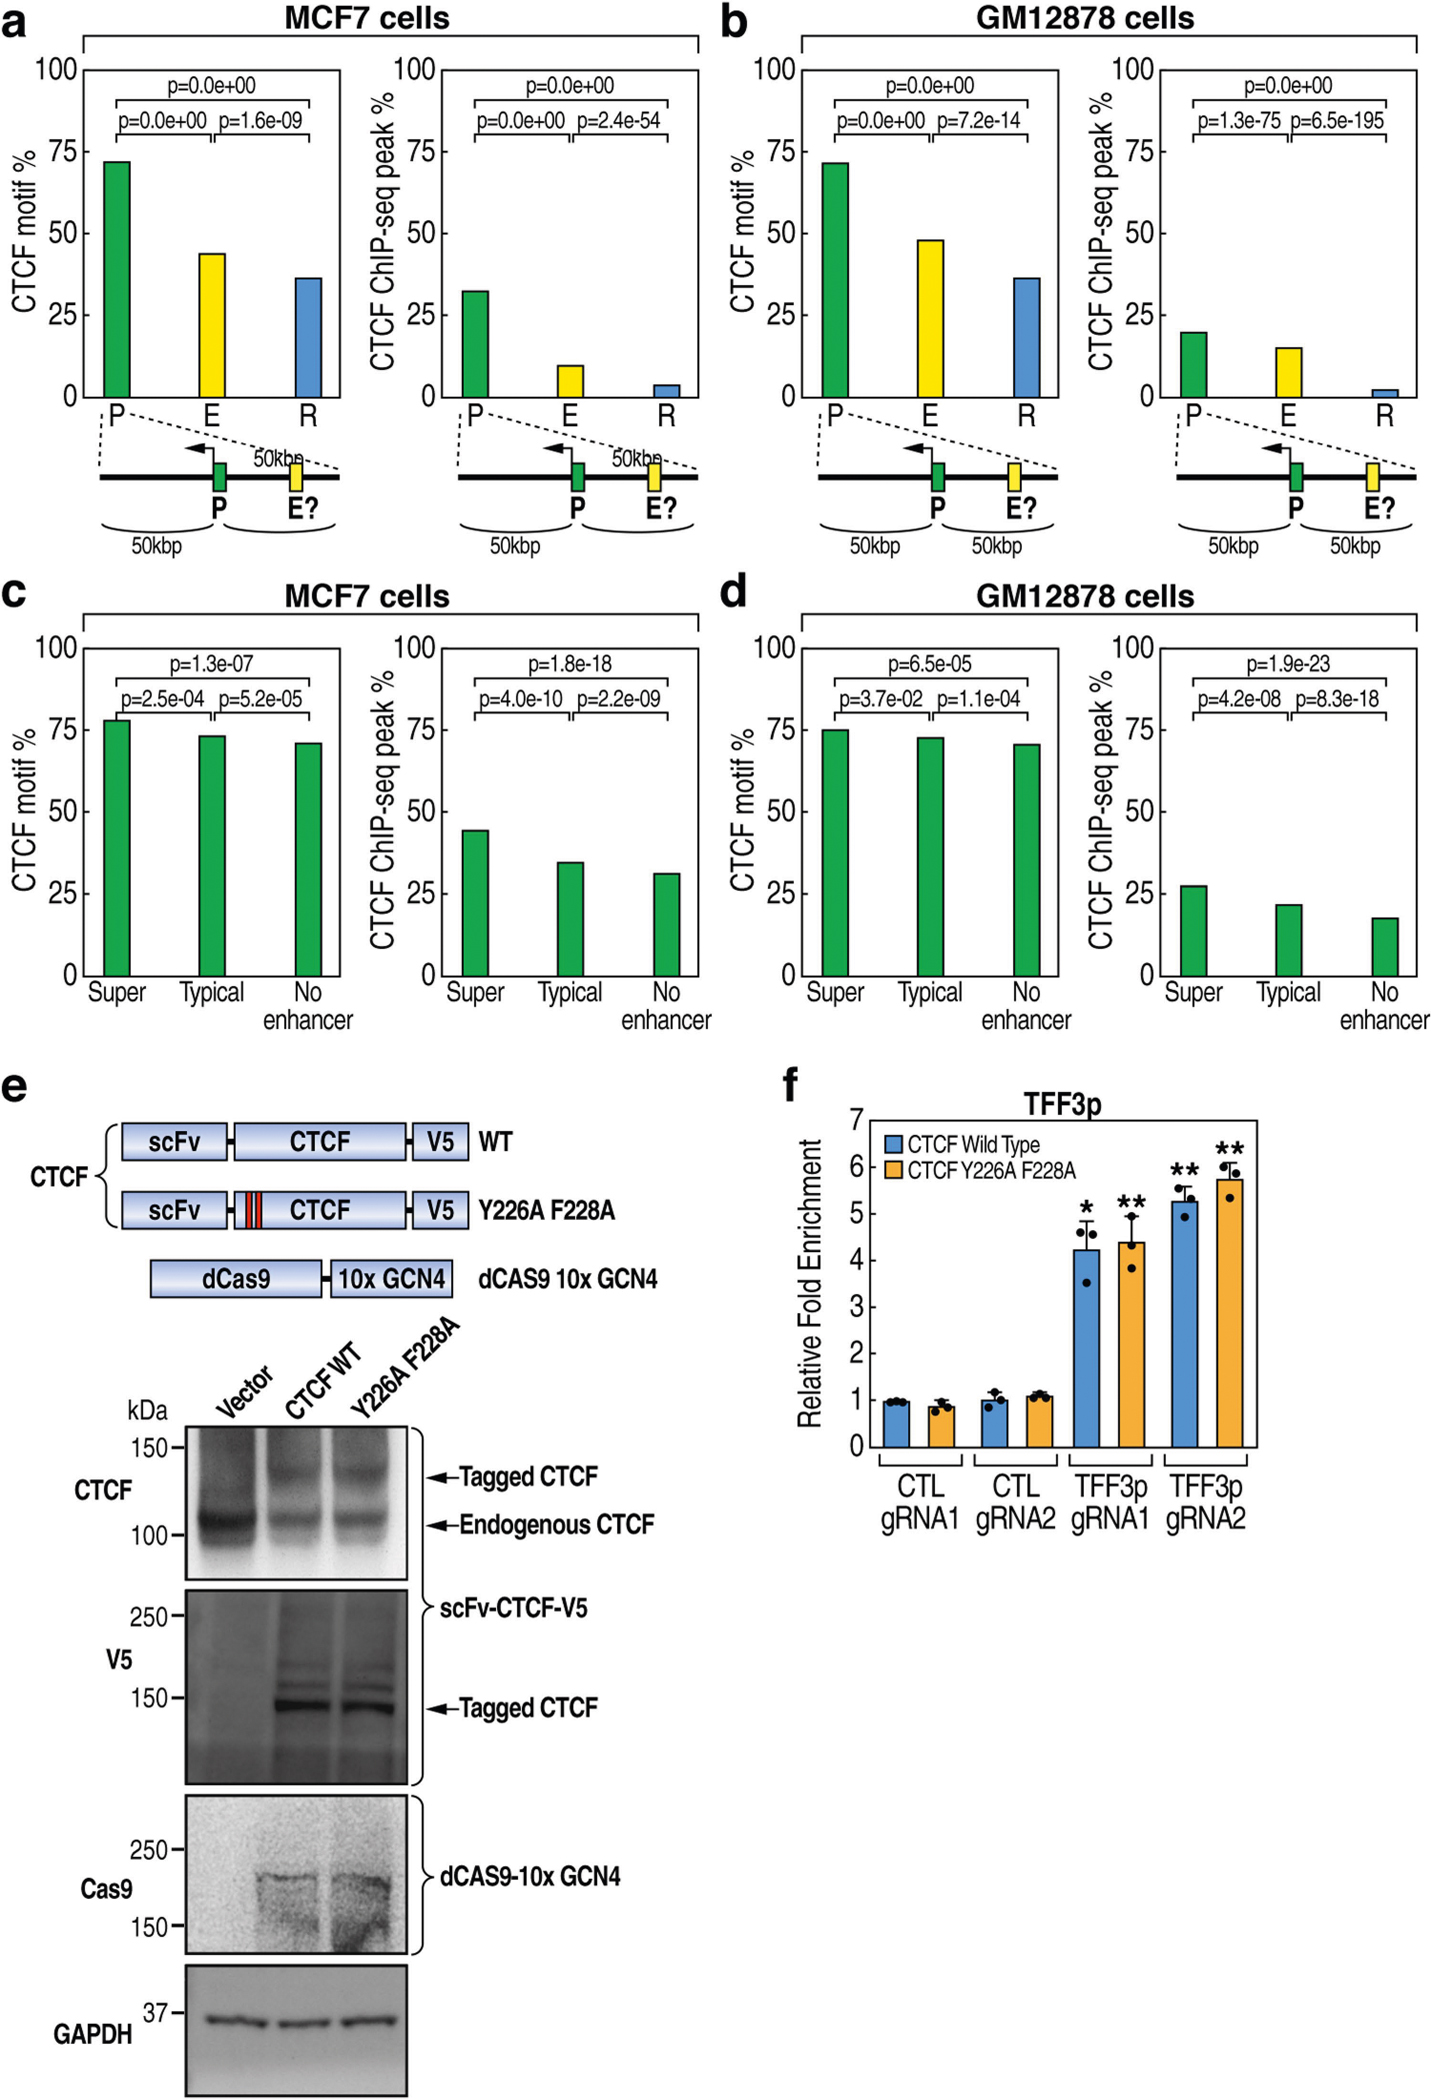
Overall, promoters exhibit a higher CTCF binding affinity than enhancers, although the CTCF binding affinity at promoters is considerably weaker than that at domain boundaries (Fig. 2a). Around 30% of promoters in MCF-7 cells and around 20% in GM12878 cells exhibited CTCF binding (Extended Data Fig. 6a, b). CTCF binding was more common for promoters near a putative enhancer or super-enhancer10 (Extended Data Fig. 6c, d). Detectable CTCF binding occurs in around 60% of promoters of highly transcribed genes in MCF-7 cells (Fig. 2b). We experimentally examined the role of promoter-bound CTCF in TFF1p, which contains a CTCF motif and chromatin immunoprecipitation followed by sequencing (ChIP–seq) peak (Supplementary Table 1, Supplementary Fig. 2). Deletion of this CTCF peak (TFF1p-ΔCTCF) fully reproduced the effects of deletion of the entire TFF1p (Fig. 2c, e). Similar changes were observed by disrupting the CTCF motif (Fig. 2d), but not by deleting oestrogen receptor recognition elements (EREs) (Fig. 2c, e).
Fig. 2 |. CTCF binding at promoters is important for their functional engagement with enhancers.
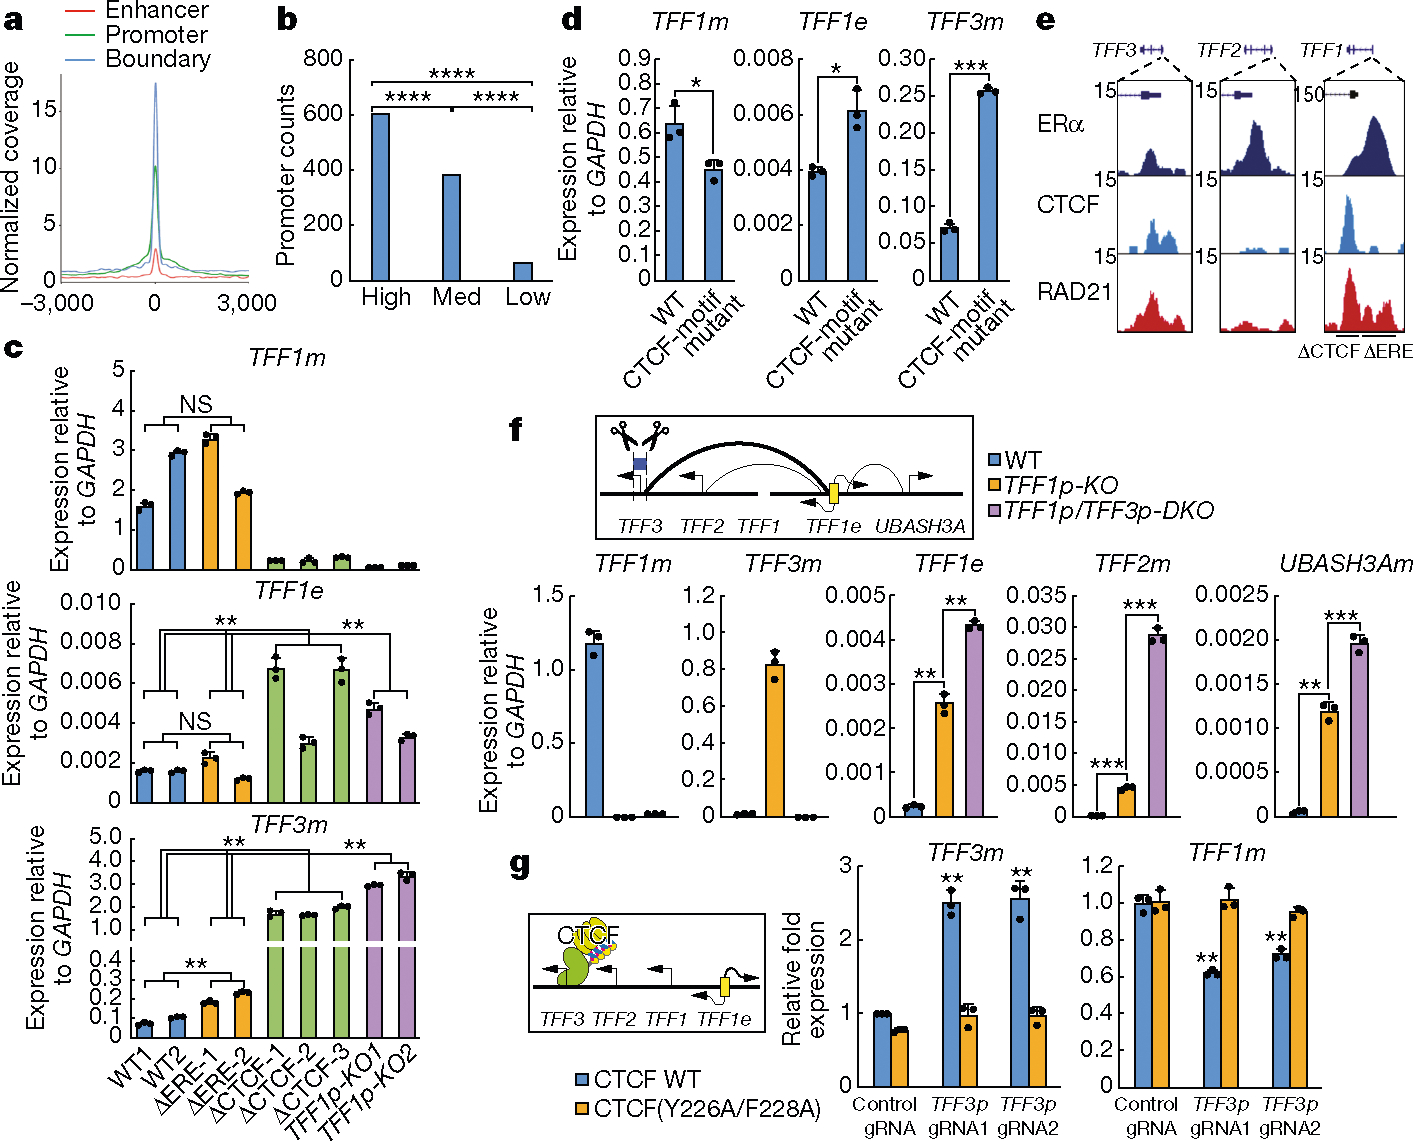
a, A normalized coverage plot showing differential CTCF binding at enhancers, promoters, and domain boundaries in MCF-7 cells. b, Bar graphs showing the numbers of promoters bearing CTCF ChIP–seq peaks for 1,000 promoters with high, medium or low levels of transcription (by GRO-seq) in MCF-7 cells. ****P < 0.0001, two-sided Fisher’s exact test. c, qRT–PCR showing expression levels of the indicated targets in wild-type cells, TFF1p-KO cells or cells with deletion of the CTCF peak (ΔCTCF) or the ERα-binding site (ΔERE). Each bar represents an independent cell clone (n = 3 biological replicates). d, qRT–PCR results showing altered TFF1e, TFF1m and TFF3m levels in cells in which the TFF1p CTCF motif was disrupted (n = 3 biological replicates). e, Browser screenshots showing hierarchical CTCF and cohesin (RAD21) binding at several gene promoters. CTCF peak (ΔCTCF) or ERα-binding site (ΔERE) deletions are indicated. f, Diagram (top) and qRT–PCR results (bottom) showing the expression levels of TFF1e and several mRNAs in WT, TFF1p-KO and TFF1p/TFF3p-DKO cells (n = 3 biological replicates). g, Diagram (left) and qRT–PCR results (right) showing the relative expression levels of TFF3m and TFF1m, illustrating the strategy and effects of CTCF tethering (n = 3 biological replicates). Cells expressing dCas9–10xGCN4 and scFV-CTCF (wild type or Y226A/F228A mutant) were used. Data in c, d, f, g show mean ± s.d.; *P < 0.05, **P < 0.01, ***P < 0.001, two-tailed Student’s t-test.
TFF3p also contains a CTCF site, with an affinity lower than that of TFF1p but higher than that of TFF2p (Fig. 2e) or UBASH3Ap. Notably, deletion of TFF3p in TFF1p-KO cells (TFF1p/TFF3p-DKO; Supplementary Fig. 3) further increased the mRNA expression of TFF2 and UBASH3A (Fig. 2f), suggesting that TFF1e is once again ‘released’ from its alternative target TFF3p to retarget other promoters in the domain. Tethering of CTCF to TFF3p (mediated by dCas9 and the SunTag system; see Methods) increased the expression of TFF3 and reduced that of TFF1, whereas tethering of a CTCF mutant (Y226A/F228A)11 defective for cohesin interaction had no effect (Fig. 2g, Extended Data Fig. 6e, f). On the basis of these data, all genes in the hosting domain appear to have the potential to be activated by TFF1e, suggesting that an enhancer scans the entire domain12, with the binding of CTCF on candidate promoters serving as a component that determines the ‘preferred’ engagement by the enhancer (Extended Data Fig. 7).
CTCF motifs are preferentially convergent at TAD and loop domain boundaries8,9, and for specific E-P loops13. ChIA-PET data showed that some RAD21-dependent promoters (n = 148) and super-activated enhancers after knockdown of RAD21 (n = 157) exhibit MCF-7-specific loops (Extended Data Fig. 8a), which we considered to be functionally engaged E-P pairs. Of these pairs, around two-thirds have a CTCF peak on promoters, but only around 10% exhibit CTCF binding on both enhancer and promoter; there is no obvious preference of motif orientation for CTCF or for FOXA1 (Extended Data Fig. 8b,c). Of the four E-P pairs studied above, all promoters exhibit CTCF binding, but only TFF1e contains a canonical CTCF motif and a peak. The CTCF motifs for TFF1 E-P pair are not convergent (Extended Data Fig. 8d, Supplementary Table 2). Deletion of the TFF1e CTCF peak caused no discernible change of TFF1 eRNA or mRNA (Extended Data Fig. 8e). These data indicate that, for functional E-P engagement, CTCF binding at promoters is required for at least a subset of promoters, whereas its presence at enhancers and convergent motif orientation are largely dispensable.
ERR-like events activate cancer genes
Cancer-associated single nucleotide polymorphisms (SNPs) are found in the TFF1 promoter14. We investigated whether ERR could function as an overlooked mechanism that underlies disease-associated genetic alterations of promoters (that is, variations, mutations and deletions) (Fig. 3a). Analysis of data from the International Cancer Genome Consortium (ICGC) showed that each cancer type contains a large number of mutations near gene TSSs (Extended Data Fig. 9a), consistent with previous studies15,16. We looked for genetic changes in other promoters that are located at a ±200 kb distance from annotated oncogene promoters (OPs, n = 315), which we dubbed oncogene-neighbouring promoters (ONPs, n = 1,693) (Methods, Fig. 3a, Supplementary Figs. 6, 7). Overall, we found a moderate but significant enrichment of mutations in, or deletions of, OPs and ONPs, compared with the genome-wide average of random promoters (Extended Data Fig. 9b). Focusing on ONPs (Fig. 3a), we identified mutational hotspots at the promoter level, revealing many significantly mutated ONPs (Supplementary Fig. 6).
Fig. 3 |. ERR is a potentially common paradigm underlying oncogene activation.

a, A model of ERR, proposing that noncoding mutations or variations of non-disease-causing promoters can deregulate the expression of disease-associated genes in the neighbourhood. b, qRT–PCR results showing altered levels of TFF1e, TFF1m and TFF3m after CRISPRi-mediated inhibition of TFF1p (iTFF1p) compared to a control (iCTL) (n = 3 biological replicates). The top diagram shows the CRISPRi strategy. c, Heat map denoting the log2-transformed fold change in expression of OPs and ONPs measured after CRISPRi against ONPs (qRT–PCR changes; see Methods). d, Top, Hi-C map showing TERT and CLPTM1L genes in a shared contact domain. Bottom, qRT–PCR results showing the expression of TERT and CLPTM1L in wild-type and CLPTM1Lp-KO 293T cells (n = 3 biological replicates). e, Cancer mutations in CLPTM1Lp (each dot represents a mutation ID, with green-coloured mutations predicted to disrupt CTCF motifs (loss), and blue not to disrupt (no loss)). The CTCF motif containing the three mutations is shown at the top. The y axis shows the number of donors for each mutation. Donor IDs, cancer types (abbreviations shown in the Methods) and genomic coordinates are indicated (green). f, 293T cells were knocked-in (KI) with these mutations (KI-CLPTM1Lp). qRT–PCR results show the RNA expression levels of CLPTM1L and TERT in wild-type versus KI-CLPTM1Lp cells (n = 3 biological replicates). g, ChIP–qPCR results showing CTCF binding at CLPTM1Lp in wild-type versus KI-CLPTM1Lp cells (n = 4 biological replicates). Data are mean ± s.d.; *P < 0.05; **P < 0.01, ***P < 0.001, two-tailed Student’s t-test.
To examine whether defects in ONPs might elicit the activation of cancer genes through ERR, we conducted a focused screening. We found that epigenetic inhibition of promoters by dCas9-KRAB/gRNA (CRISPR interference; CRISPRi) recapitulated the ERR effect that was caused by genetic deletion (Fig. 3b). We therefore selected 36 ONPs with cancer mutations or deletions and performed CRISPRi on their promoters to test the effects on nearby oncogenes (Extended Data Fig. 9c, Methods). Effective CRISPRi was achieved for 25 ONPs (Methods). Of these, eight induced a significant increase in the expression of neighbouring oncogenes whereas one led to a significant decrease (Fig. 3c, Supplementary Table 3). For example, inhibition of the ZCCHC7 and PVT1 promoters increased the expression of the neighbouring genes PAX5 and MYC, respectively (Extended Data Fig. 9d); the latter is consistent with a previous report17. Inhibition of the MTG2 promoter—a recently identified mutation hotspot16,18—led to significant upregulation of a neighbouring cancer gene, SS18L119 (Fig. 3c, Extended Data Fig. 9d). These results suggest that ERR potentially underlies a subset of noncoding cancer defects and can activate oncogenes.
Deletion or mutation of ONPs activates oncogenes
To better model cancer genetics, we performed deletion or mutation of select ONPs (Supplementary Fig. 5). Three ONP–OP pairs, PVT1–MYC, ZCCHC7–PAX5 and CLPTM1L–TERT, were chosen on the basis of reported mutations or deletions and our screening (Methods). Each ONP is located in a shared domain with the respective oncogene (Fig. 3d, Extended Data Fig. 9e, f). Oncoplots of promoter-homed mutations showed that each ONP contains mutations in around 0.5–1% of more than 6,000 tumours (Extended Data Fig. 9g, h, i). Each ONP loops with an adjacent eRNA-expressing enhancer (Extended Data Fig. 10a–c), supporting the possibility that ONP loss might elicit ERR events. Indeed, ONP deletion increased the expression of its respective oncogene by around two- to fivefold (Fig. 3d, Extended Data Fig. 9e, f), and this was accompanied by a gain of interaction between OPs and nearby enhancers (Extended Data Fig. 10d, e).
We found that cancer mutations that overlap CTCF motifs—but not FOXA1, GATA3 or ERα motifs—were common in gene promoters (Extended Data Fig. 10f). Recurrent single-nucleotide mutations in ONPs, as compared to mutations in OPs or random promoters, are more likely to disrupt CTCF motifs (Supplementary Fig. 7b). We identified three cancer mutations in the CLPTM1L promoter (CLPTM1Lp) overlapping a single CTCF motif, which are predicted to disrupt CTCF binding (Fig. 3e). We generated a knock-in cell line heterozygous for these mutations (Supplementary Fig. 5c), which exhibited an increase of TERT but decrease of CLPTM1L expression (Fig. 3f) and showed reduced CTCF binding at CLPTM1Lp (Fig. 3g). Consistent with this observation in cellular models, data from two individuals with CLPTM1Lp mutations showed that these individuals had a level of TERT mRNA that was three-to fivefold higher than average (Supplementary Fig. 7c). Together, these results show that specific deletions or single-nucleotide mutations of ONPs can deregulate adjacent oncogenes through ERR, offering mechanistic insights into noncoding mutations and deletions in cancer16.
ERR functions in some disease-risk loci
We analysed GTEx data to infer potential ERR events in human genetics (Methods, Supplementary Figs. 8–10). We examined GTEx-defined expression quantitative trait loci (eQTLs) in promoters that highly correlate with the expression of both the host gene per se (dubbed gene-CP for cognate promoter) and another gene in the chromosomal neighbourhood (dubbed gene-AP for alternative promoter), in a tissue-specific manner (Extended Data Fig. 11a). This revealed more than 19,000 gene-CP–gene-AP pairs that exhibited opposite trends of allelic expression correlation with eQTLs in gene-CPs (Supplementary Table 4a). We then selected gene-CPs that have one or more additional eQTLs in their 200-kb neighbourhood that happen to overlap annotated enhancers. These criteria identified 872 gene pairs that were potentially undergoing ERR (Supplementary Table 4b), of which 61.4% (535 out of 872) are observed in multiple tissues and 38.6% (337 out of 872) in one tissue (Extended Data Fig. 11b). Each tissue possesses tens to hundreds of potential ERR events (Fig. 4a, Extended Data Fig. 11c).
Fig. 4 |. ERR represents an overlooked molecular event that can explain disease susceptibility.
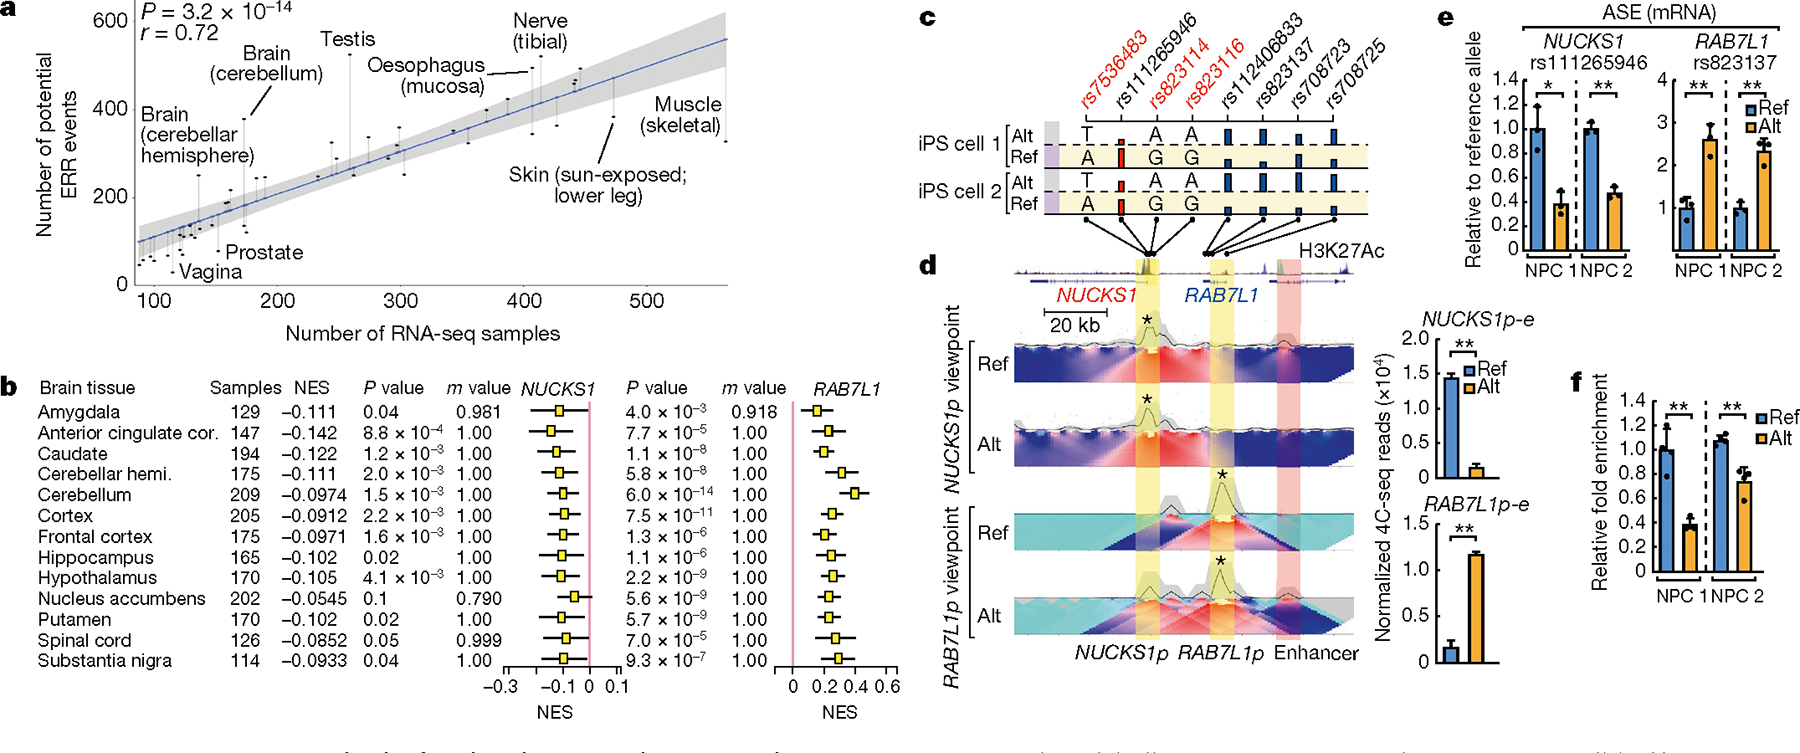
a, Scatter plot and linear regression showing the numbers of ERR-like events relative to the number of RNA sequencing (RNA-seq) samples in each tissue. The P value is estimated from the t-statistic of the fit. The error band represents the standard error of the regression model. b, Box plots showing GTEx normalized effect size (NES) of NUCKS1 or RAB7L1 genes in the alternative allele (Alt) relative to the reference allele (Ref), as segregated by the rs823114 SNP. For details of sample numbers, NES, P and m values, see Methods. Cor, cortex; hemi., hemisphere. c, SNPs and allele-specific RNA expression (ASE) in NUCKS1–RAB7L1 loci in two lines of iPS cells. Three SNPs at the NUCKS1 promoter that are associated with Parkinson’s disease risk are labelled in red. ASE was analysed using SNPs (black) and indicated by bar heights. Indicated at the bottom are the SNP locations relative to genes, gene coordinates and ENCODE H3K27ac ChIP–seq signals. d, Heat maps of allelic 4C-seq from iPS-cell-derived NPCs using NUCKS1 and RAB7L1 promoters (NUCKS1p and RAB7L1p) as viewpoints (asterisks). Promoters are highlighted in yellow and the enhancer in red. Quantified E-P contacts from two biological replicates of 4C-seq are shown on the right. e, qRT–PCR results showing the ASE of NUCKS1 and RAB7L1 mRNAs in two lines of NPCs (n = 3 biological replicates). f, Allelic CTCF binding at NUCKS1p, based on ChIP–qPCR using rs823114 SNP (n = 4 biological replicates). Data in d–f are mean ± s.d.; *P < 0.05, **P < 0.01, two-tailed Student’s t-test.
By selecting gene pairs that bear eQTLs in gene-CPs that overlap with risk alleles from genome-wide association studies, we identified 85 potential ERR-based disease-susceptibility events (Supplementary Table 4c). Among these, the PARK16 locus is a prominent risk locus associated with Parkinson’s disease20. RAB7L1 (also known as RAB29) is a key gene in this locus, with a critical role in Parkinson’s disease21. Notably, three SNPs that are significantly associated with Parkinson’s disease risk—rs823114, rs823116 and rs7536483—locate to the promoter of NUCKS1, a gene that neighbours RAB7L1 but which has no reported function in Parkinson’s disease (Fig. 4c). In multiple brain tissues, these SNPs are associated with a lower expression of the gene-CP (NUCKS1) but a higher expression of the neighbouring disease gene (RAB7L1) (Fig. 4b). We identified two clones of human induced pluripotent stem (iPS) cells that contain a heterozygous haplotype of these SNPs. Analysis of allelic expression revealed a lower expression of NUCKS1 and a higher expression of RAB7L1 by the alternative allele (Fig. 4c). We differentiated iPS cells to neural progenitor cells (NPCs), a more disease-relevant cell stage (Supplementary Fig. 11), and confirmed the allele-biased expression (Fig. 4e). Allelic 4C-seq in NPCs revealed an E-P interaction between the NUCKS1 promoter and a putative enhancer in the reference allele, which was lost in the alternative allele; by contrast, the RAB7L1 promoter loops with this enhancer only in the alternative allele (Fig. 4d). This putative enhancer overlaps H3K27ac signal from the ENCODE project datasets (Fig. 4c), and bears bona fide enhancer activity because its CRISPRi-mediated inhibition decreased the mRNA expression of NUCKS1 and RAB7L1 (Extended Data Fig. 11d). Allelic chromatin immunoprecipitation with quantitative PCR (ChIP–qPCR) showed that CTCF binds to a significantly higher level at the reference allele of the NUCKS1 promoter than at the alternative allele (Fig. 4f, 11 Data Fig. 11e, f). Together, these results indicate that ERR functions in disease-risk loci to control allelic E-P engagement and gene activation, and for at least a subset of loci, this occurs on the basis of altered CTCF binding.
Conclusions
Here, we have delved into the mechanisms that underlie the functional choice of a target gene promoter by a regulatory enhancer, and examined the relevance of these mechanisms to disease. Extensive promoter-disruption experiments revealed that a regulatory enhancer has the potential to contact many or all promoters in its hosting domain12, but exhibits a ‘preference’ in choosing one major target promoter to confer the strongest activation. Our data suggest that such promoter preference is determined by inherent features of the promoters and, for at least some loci, by the level of CTCF binding. These results are most compatible with an ‘enhancer scanning’ model22 as the basis of E-P engagement inside a chromatin domain (Extended Data Fig. 7). Together with the importance of cohesin23,24, we suggest that finer-scale E-P looping is licensed by low-affinity CTCF sites at promoters dynamically interacting with enhancer-bound cohesin to achieve the preferred E-P activation event. Because CTCF binding is observed at a substantial subset of promoters, it apparently represents a mechanism for determining a subset of promoter preference events.
We show that ERR is a clinically important paradigm that underlies genetic or epigenetic alterations near to or within promoters, by which the defects of a primary, non-disease-causing promoter license the activation of alternative, disease-causing gene promoters in a shared chromatin domain. Two notable features of ERR make it applicable to disease: (i) it can cause a striking activation of alternative genes (which as compared to normal conditions are often increased in expression by two- to fivefold and sometimes by around 20-fold); (ii) it potentially has a relatively high prevalence, as suggested by analyses of cancer genomics and GTEx data and by our initial CRISPRi screening. Large-scale promoter perturbation screenings will be required in the future to go beyond informatic inference and fully establish the frequency of ERR events underlying disease gene alterations.
Online content
Any methods, additional references, Nature Research reporting summaries, source data, extended data, supplementary information, acknowledgements, peer review information; details of author contributions and competing interests; and statements of data and code availability are available at https://doi.org/10.1038/s41586-021-03577-1.
Methods
Data reporting
No statistical methods were used to predetermine sample size. The experiments were not randomized and the investigators were not blinded to allocation during experiments and outcome assessment.
Cell culture and transfection
The protocol for cell culture followed previous work25. In brief, we originally purchased MCF-7 cells from ATCC, which were maintained in DMEM (Gibco 10566) supplemented with 10% FBS (Omega Scientific) in a 5% CO2 humidified incubator at 37 °C (MCF-7 without stripping). Cells were examined for mycoplasma contamination every 6–12 months. To induce the oestrogen gene transcriptional responses, MCF-7 cells at 60–80% confluency were first hormone-stripped for 3 days in phenol-free DMEM plus 5% charcoal–dextran-treated FBS (Omega Scientific), and they were then treated with 100 nM 17-β-oestradiol (Sigma) for the indicated times (usually 1 h). Control samples were treated with ethanol or ICI 182,780, a high-affinity ERα antagonist. Transfection of siRNAs into MCF-7 cells was performed using lipofectamine 2000 (Life Technologies) following the manufacturer’s instructions. For all experiments, two rounds of siRNA transfection (40 nM each time) were performed to achieve higher efficiency. The siRNAs used in this study include: Qiagen negative control siRNA (Qiagen 1027310) and/or Sigma Mission siRNA universal control #2 (SIC002), and siRAD21 (Sigma SASI_Hs02_00341219 and SASI_Hs01_00195799).
CRISPR–Cas9-mediated genome editing
For knockout of genomic regions, two gRNA sequences were designed for each locus with the http://crispr.mit.edu/ design tool. Point mutations at CLPTM1Lp were achieved using single-stranded oligo DNA nucleotides (ssODNs) as the homology repair template with single-guide RNA (sgRNA) and Cas9 expression. The sgRNA sequences were cloned into a Cas9 vector (pSpCas9(BB)-2A-Puro (PX459) V2.0, 62988) from Addgene (Cambridge), using the BbsI restriction enzyme. The sequences of all sgRNAs and ssODNs used in this study are listed in Supplementary Table 5. Transient transfection of sgRNA–Cas9 plasmids was performed with lipofectamine 2000 to MCF-7 or 293T cells. After a 24-h incubation, the transfected cells were incubated overnight with 2 μg/ml puromycin. Then cells were plated at clonal density and grown without puromycin until colonies appeared. Individual colonies were picked with a P100 pipette under the observation of a microscope inside a sterile tissue culture hood. Colonies were then moved to individual wells of a 96-well or 48-well plate. Colonies carrying a deletion allele were checked by PCR and confirmed by Sanger sequencing. The sequences of all genotyping primers are listed in Supplementary Table 5.
qPCR
RNA was isolated using TRIzol (Life Technologies), RNeasy Mini Column (Qiagen) or Zymo MiniPrep RNA prep kit (Zymo Research), which was always complemented with DNase treatment. The total RNA was reverse-transcribed using SuperScript III Reverse Transcriptase (Life Technologies) or qScript XLT cDNA SuperMix (QuantaBio) with random hexamer as per the manufacturer’s instructions. qPCR was performed in either StepOne Plus or QuantStudio 3 qPCR systems (Applied Biosystems, Thermo Fisher Scientific) using 2X qPCR master mix from Affymetrix (75690) or Applied Biosystems (4472908, SYBR Select). Normalization of expression was done using GAPDH or ACTB mRNA as internal controls. P values were obtained using a two-tailed Student’s t-test. A list of primers used for qPCR is provided in Supplementary Table 5. For all qRT–PCR and ChIP–qPCR, experiments were performed with at least biological duplicates. Each biological replicate has at least three technical repeats.
ChIP and ChIP–seq
ChIP was performed as previously described25. In brief, cells were cross-linked with 1% formaldehyde at room temperature for 10 min. Or for some cases, cells were double cross-linked with 1 mM DSG (ProteoChem) for 1 h first and then for 10 minutes by 1% formaldehyde. In both situations, the cross-linking was quenched by addition of 0.125M glycine for 10 min. ChIP chromatin was fragmented using (Diagenode) Bioruptor300 (20–40 cycles, 30 s on, 30 s off, 4 °C). Subsequently, the soluble chromatin was collected by 16,100g centrifugation, pre-cleared with 10–20 μl Dynabeads G (Life Technologies), and then incubated with 1–5 μg of antibodies at 4 °C overnight. The next morning, immunoprecipitated complexes were collected using 30 μl of Dynabeads protein G (Invitrogen) per reaction. The immune complexes were subjected to washes once with wash buffer I, twice with wash buffer II, once with Tris-EDTA (TE) + 0.1% Triton X-100, and once with TE, and then the beads were incubated at 55 °C for 2 h with proteinase K and de-cross-linked at 65 °C overnight. The final ChIP DNA was extracted and purified using QIAquick spin columns (Qiagen). For ChIP–seq, the extracted DNA was ligated to specific adaptors for Illumina’s HiSeq system using the KAPA Hyper Prep Kit (Kapa Biosystems).
High-throughput sequencing
For all ChIP–seq and GRO-seq, the extracted DNA libraries were sequenced with the Illumina HiSeq 2500 or HiSeq 4000 system according to the manufacturer’s instructions. The first 50 bp for each sequence tag returned by the Illumina Pipeline was aligned to the human genome (hg19) assembly using Bowtie2, and only reads with MAPQ ≥ 10 were selected by SAMtools for further analysis. The data were visualized by preparing custom tracks on the University of California, Santa Cruz (UCSC) genome browser using HOMER26 (http://homer.ucsd.edu/homer/). The total number of mappable reads was normalized to 107 for each experiment presented in this study. The read numbers used for generating bedgraph files are provided in Supplementary Table 6.
4C-seq and analyses
The 4C-seq experiments were conducted following a published protocol27 with modification. In brief, 10 million cells were cross-linked with 1% formaldehyde for 10 min and nuclei were extracted. Nuclei were resuspended in restriction enzyme buffer and incubated with 0.3% SDS for 1 h at 37 °C and further incubated with 2% Triton X-100 for 1 h; then 400 U of DpnII restriction enzyme was added and nuclei were incubated overnight. Restriction enzyme was heat-inactivated at 65 °C for 20 min. Ligation of DNA regions in close physical proximity was performed using 1,000 U of T4 DNA ligase (NEB) for overnight. After de-cross-linking, the second digestion and ligation were performed using restriction enzyme NlaIII and T4 DNA ligase. The 4C-seq libraries were amplified using PCR with the first primer designed on each viewpoint and the second primer designed beside the NlaIII site. Both primers contained Illumina sequencing adaptors and barcode (Supplementary Table 5). The 4C libraries were sequenced on the Illumina HiSeq 2500 using single-read 100-cycle runs.
Analysis of 4C-seq data was done using an existing 4C pipeline28. Valid reads of genomic regions were generated by clipping out the primer sequences in the raw reads. These clipped reads with unique 3′ ends were aligned to hg19 human genomic coordinates. All the samples were quality checked according to the following: ratio of the read number of cis-interactions versus the read number of total-interaction is larger than 40%. For data visualization, a 5 kb window size was chosen to compute the trend curve and the grey band on top of each 4C heat map displays the 20–80% for the windows. Median contact intensities were depicted as colour-coded multi-scaled heat maps, ranging from a 2-kb sliding window at the top of the heat map to a 50-kb sliding window at the bottom of the heat map. At NUCKS1 promoter and RAB7L1 promoter viewpoints, rs823116 and rs708725 were used for detection of allele-specific interaction, respectively.
Replicates of 4C-seq data were processed following a previous method for statistical analysis29. In brief, 4C-seq reads were first trimmed by keeping the sequences after restriction enzyme cutting site 1 and before restriction enzyme cutting site 2. Trimmed reads were mapped to the hg19 reference genome with Bowtie2. Mapped reads were counted for each restriction fragment end. For each fragment end, the read counts were further normalized by scaling the number of total reads mapped to the viewpoint chromosome. After excluding the reads mapped to the top 2 fragments, the normalization will make the total sum of normalized reads 1 million (normalization factor). For plots for which quantitation bar plots were included, normalized read counts of all valid fragment ends overlapping NUCKS1e, TFF1p, KCNK5p and P2RY2p were summed up and compared by Student’s t-test.
GRO-seq
GRO-seq experiments were performed as previously reported25. In brief, around 10–20 million MCF-7 cells were washed 3 times with cold PBS and then sequentially swelled in swelling buffer (10 mM Tris-Cl pH 7.5, 2 mM MgCl2, 3 mM CaCl2) for 5 min on ice, collected, and lysed in lysis buffer (swelling buffer plus 0.5% NP-40 and 10% glycerol). The resultant nuclei were washed one more time with 10 ml lysis buffer and finally resuspended in 100 μl of freezing buffer (50 mM Tris-Cl pH 8.3, 40% glycerol, 5 mM MgCl2, 0.1 mM EDTA). For the run-on assay, resuspended nuclei were mixed with an equal volume of reaction buffer (10 mM Tris-Cl pH 8.0, 5 mM MgCl2, 1 mM DTT, 300 mM KCl, 20 units of SUPERase-IN, 1% sarkosyl, 500 μM ATP, GTP and Br-UTP, 2 μM CTP) and incubated for 5 min at 30 °C. The resultant nuclear-run-on RNA (NRO-RNA) was then extracted with TRIzol LS reagent (Life Technologies) following the manufacturer’s instructions. NRO-RNA was fragmented to around 300–500 nt by alkaline base hydrolysis on ice and followed by treatment with DNase I and Antarctic phosphatase. The fragmented Br-UTP-labelled nascent RNA was then immune-precipitated with anti-BrdU agarose beads (Sc32323ac, Santa Cruz Biotechnology) in binding buffer (0.5× SSPE, 1 mM EDTA, 0.05% Tween) for 3 h at 4 °C with rotation. Subsequently, T4 PNK was used to repair the end of the immune-precipitated BrU-NRO-RNA, at 37 °C for 1 h. The RNA was extracted and precipitated using acidic phenol–chloroform.
cDNA synthesis was performed as per a published method30 with a few modifications. The RNA fragments were subjected to poly-A tailing reaction by poly-A polymerase (NEB) for 30 min at 37 °C. Subsequently, reverse transcription was performed using oNTI223 primer and superscript III RT kit (Life Technologies). The cDNA products were separated on a 10% polyacrylamide TBE-urea gel and only those migrating between around 100–500 bp were excised and recovered by gel extraction. After that, the first-strand cDNA was circularized by CircLigase (Epicentre) and re-linearized by APE1 (NEB). Re-linearized single-strand cDNA (sscDNA) was separated by a 10% polyacrylamide TBE gel as described above and the product of required size was excised (around 170–400 bp) for gel extraction. Finally, the sscDNA template was amplified by PCR (usually between 10–14 PCR cycles) using the Phusion High-Fidelity enzyme (NEB) according to the manufacturer’s instructions. The examples of oligonucleotide primers oNTI200 (with 4 barcode choices) and oNTI201 were used to generate DNA for deep sequencing (sequences are listed below from 5′ to 3′ direction).
oNTI223-TruSeq: /5Phos/GATCGTCGGACTGTAGAACTCT; CAGACGTGTGCTCTTCCGATCTTTTTTTTTTTTTTTTTTTTVN (“;” = abasic dSpacer furan; VN = degenerate nucleotides). oNTI200-TruseqID1: CAAGCAGAAGACGGCATACGAGATCGTGATGTGACTGGAGTTCAGACGTGTGCTCTTCCGATC; oNTI200-TruseqID2: CAAGCAGAAGACGGCATACG AGAT ACATCG GTGACTGGAGTT CAGACGTGTGCTCTTCCGATC; oNTI200-TruseqID3: CAAGCAGAAGACGGCATACGAGAT GCCTAA GTGACTGGAGTT CAGACGTGTGCTCTTCCGATC; oNTI200-TruseqID4: CAAGCAGAAGACGGCATACGAGAT TGGTCA GTGACTGGAGTT CAGACGTGTGCTCTTCCGATC; oNTI201: AATGATACGGCGACCACCGACAGGTTCAGAGTTCTACAGTCCGACG. Illumina small RNA-seq primer (for first read): CGACAGGTTCAGAGTTCTACAGTCCGACGATC; index reading primer (for index read): GATCGGAAGAGCACACGTCTGAACTCCAGTCAC.
GRO-seq analysis
Data were aligned to human genome hg19 by Bowtie2. For gene transcription, the GRO-seq reads from the entire gene bodies of RefSeq genes were included for analysis. For eRNA calculation, we first selected all p300-bound peaks excluding those in gene promoters and transcription termination sites (TTSs) (±2kb of TSSs, and +3kb of TTS) as putative enhancers and counted the GRO-seq reads in the ±2kb region surrounding the p300 peak summits (called by MACS2). For intergenic enhancers, we counted the sense and anti-sense strands of GRO-seq signals separately, whereas for the intragenic enhancers, only the strand opposite to the coding gene was considered. For counting differential gene or eRNA expression, raw read counts from GRO-seq were generated using HOMER (analyzeRepeats.pl -raw), and subjected to analysis by EdgeR to find differentially expressed (DE) genes or eRNAs (false discovery rate (FDR) < 0.05, fold change ≥ 1.5 or ≤ 0.667). The enhancers with upregulated eRNAs were selected and the tag counts of epigenomic marks (for example, H3K4me3 or H3K4me1) on these enhancers were generated by HOMER26 and then plotted as profile plots using the Bioconductor package in R.
CRISPRi and tethering
To achieve efficient silencing at each target locus, we used two sgRNAs in one plasmid system. gRNAs were designed for each targeted locus using the Alt-R Custom Cas9 crRNA Design Tool (https://eu.idtdna.com/) and cloned into an in-house lentiviral vector pLKO.1-U6–2sgRNA-ccdB-E F1a-Puromycin (which can express two gRNAs) in one vector. Lentiviral gRNAs or Lenti-dCas9-KRAB-blast plasmids (89567, Addgene) were co-transfected with packaging plasmids (psPAX2 and pMD2.G) into HEK-293-T cells using lipofectamine 2000. Culture medium containing lentivirus for gRNA and dCas9–KRAB was collected and added to the desired cells with 8 μg/ml polybrene. Next day, the medium was changed with medium containing appropriate antibiotics. After 48 h of drug selection, cells were collected for further experiments. The list of oncogenes was selected mostly on the basis of the COSMIC Cancer Gene Census (CGC)19 Tier 1 genes, preferentially those with annotation to bear cancer amplification. We selected these that contain cancer mutations in ONPs based on our own analysis (Extended Data Fig. 9c, Supplementary Fig. 6). Some ONP–OP pairs—for example, ZCCHC7–PAX531, CLPTM1L–TERT15, PVT1–MYC17, MYL12A–TGIF1 or MYL12B–TGIF1, ID1–PIM1, HM13–PIM132 and MTG2–SS18L116,18—were also included on the basis of literature reports of their potential importance in cancer. In addition, ERR predicts that the functional loss of ONPs will upregulate OPs, which requires ONPs to be transcribed. Therefore, in our selection of 36 pairs, we require both ONP–OP genes to display detectable GRO-seq signals in MCF-7 cells, particularly for the ONP genes. For the focused CRISPRi screening, all the gene-expression changes and P values of ONPs and OPs are shown in Supplementary Table 3. We only considered that CRISPRi for ONP genes worked if a fold reduction of ≤0.667 and a P value <0.05 were observed; subsequently, we counted the numbers of up- or downregulated OP genes by expression fold change of ≥1.5 or ≤0.667 as well as P < 0.05. P values here denote two-tailed Student’s t-tests. For Fig. 3c, we plotted the log2-transformed fold change of 25 ONP–OP gene pairs with a red–blue gradient.
For CTCF tethering, we used the SunTag system33. We generated dCas9–10xGCN4 and scFv-CTCF constructs and expressed them together with specific gRNAs targeting the TFF3p (Extended Data Fig. 6e, f). MCF7 cells were transduced with lentivirus expressing dCas9–10xGCN4-T2A-blasticidin and scFV-CTCF_wildtype-T2A-hygromycin or scFV-CTCF_Y226A_F228A-T2A-hygromycin. The cells were selected with hygromycin-B (200 μg/ml) and blasticidin (10 μg/ml) for 7 days. dCas9–10xGCN4 and scFV-CTCF (wild-type or Y226A_F228A) stably expressing cell lines were then transduced with lentivirus expressing target sgRNAs, and the sgRNA-positive cells were further selected with puromycin (2 μg/ml) for 2 days in the presence of hygromycin-B and blasticidin.
Generation and culture of NPCs
We identified two clones of human iPS cells that contain a heterozygous haplotype of Parkinson’s disease-risk SNPs, rs82311434, rs82311635 and rs753648336, in the promoter of NUCKS1. We generated monolayers of NPCs from identified human iPS cell cultures (iPSCORE_19_1_iPSC_C4_P13 and iPSCORE_2_11_iPSC_C2_P12 human iPS cell lines) using the serum-free medium kit for highly efficient SMAD inhibition-mediated neural induction and following the manufacturer’s recommendations (STEMdiffTM SMADi Neural Induction Kit, 08581, from STEMCELL Technologies; which contains STEMdiffTM Neural Induction Medium and STEMdiffTM SMADi Neural Induction Supplement). SMAD inhibitors were intended to inhibit the differentiation to a non-CNS-type of cells, according to STEMCELL Technologies. In brief, we thawed a vial of frozen human iPS cells in a well of a 6 well-plate (passage 1) pre-coated with MatrigelR (Corning, 354277). The human iPS cell medium was mTeSR1TM from STEMCELL Technologies supplemented with 20 mM penicillin–streptomycin (Gibco, 15140122). We used 1:1,000 Y-27632 ROCK Inhibitor (Abcam-ab 120129) for 24 h to increase the survival of single human iPS cells (not used for daily medium changes). We passaged human iPS cells at a 1:3 dilution twice after 4 days of culturing every time (passages 2 and 3). For NSC induction, we plated 2 million human iPS cells in a well of a 6-well plate (from passage 3), detaching cells using Versene and disrupting at the single-cell level. Cell counts were performed using Trypan blue staining and the Countess II Automated Cell Counter instrument from Life Technologies. We started NSC induction with the STEMdiff SMADi Neural Induction Kit. Six days later, we passaged cells at a 1:6 dilution using Accutase (Innovative Cell Technologies, AT104) (passage 5). Six days later, NSCs were passaged again (passage 6) at a 1:6 dilution in 10-cm plates. NSC medium was changed daily in all cases. Five days later, NSCs were collected for further experiments. In total, the period of NSC induction was 17 days. We confirmed the NSC identity by RNA-seq (Supplementary Fig. 11). As expected, we did not observe expression of pluripotency markers NANOG and POU5F1 (OCT4), but markers of (neural) stem cell identity, NES (nestin), MKI67 (Ki67), LIN28B and SOX2 were found. We observed robust expression of neuronal-lineage markers TUBB3 (TUJ1), ENO2 (NSE) and MAP2, but no or relatively low expression of specialized genes of neuronal identity (such as MAPT, SYP or TH) or glial differentiation (such as GFAP and S100B). Together, these results corroborate that our cells have NPC identity.
iPS cell and whole-genome sequencing data from two individuals
The two individuals (iPSCORE_2_11 and iPSCORE_19_1) were recruited as part of the iPSCORE project37. The recruitment of these individuals was approved by the Institutional Review Boards of the University of California, San Diego and The Salk Institute (project no. 110776ZF). As previously described37, we generated whole-genome sequences from DNA isolated from blood on the HiSeqX (Illumina; 150-bp paired end). Whole-genome sequencing data are available at the National Institutes of Health (NIH) dbGaP database (phs001325).
iPS cell generation
Cultures of primary dermal fibroblast cells were infected with the Cytotune Sendai virus (Life Technologies) per the manufacturer’s protocol. The Sendai-infected cells were maintained with 10% FBS–DMEM (Invitrogen) for days 4–7 until the cells recovered and repopulated the well. Emerging iPS cell colonies were manually picked after day 21 and maintained on Matrigel (BD Corning) with mTeSR1 medium (STEMCELL Technologies) as previously described38. Multiple independently established iPS cell lines (that is, referred to as clones) were derived from each individual. Sendai virus clearance typically occurred at or before passage (P) 9, and was not detected in the iPS cell lines at the P12 stage of cryopreservation. RNA was collected at P12 for iPSCORE_2_11 (iPSC ID = iPSCORE_2_11_iPSC_C2_P12) and at P13 for iPSCORE_19_1 (iPSC ID = iPSCORE_19_1_iPSC_C4_P13). Both iPS cell samples were pluripotent39. iPS cell lines are publicly available through the NHLBI-contracted biorepository at the WiCell Research Institute.
iPS cell RNA library preparation and sequencing
iPS cell RNA-seq data were generated as previously described37. In brief, total RNA was extracted from the iPS cell lines using AllPrep RNasy Blood & Tissue Kit (Qiagen) and the quality was assessed based on RNA integrity number (RIN) using an Agilent Bioanalyzer. Libraries were prepared using the Illumina TruSeq stranded mRNA kits and sequenced using an Illumina HiSeq2500 (around 11 samples per lane). Samples were sequenced to an average of around 22 million read pairs. RNA-seq data are available through dbGaP (phs000924).
Allele-specific expression
iPS cell allele-specific expression (ASE) was calculated as previously described37 (shown in Fig. 4c). RNA-seq reads were aligned to the hg19 genome using STAR40 and sorted using Sambamba41. Biobambam2 bammarkduplicates was used to mark duplicate reads. Uniquely mapped reads that were not marked as duplicates were tested for mapping bias using WASP42. GATK ASEReadCounter was used to calculate the coverage of heterozygous variants on Gencode V.19 exons43. All heterozygous variants with coverage ≥8, reference allele frequency between 2% and 98%, located in uniquely mappable regions according to the wgEncodeCrgMapabilityAlign100-mer track and >10 bp away from other variants, were tested for ASE using MBASED44. NPC ASE and allele-specific CTCF binding were measured by the rhAmp SNP Genotyping System (IDT) according to the manufacturer’s instructions, and were based on qPCR. rs111265946 and rs823137 were used for detection of NUCKS1 and RAB7L1 ASE, respectively. In brief, the total RNA was reverse-transcribed using SuperScript III Reverse Transcriptase (Life Technologies). qPCR was performed with rhAmp Genotyping Master Mix and rhAmp Reporter Mix (IDT). FAM and VIC were assigned to the reference allele and alternative allele, respectively. Expression was normalized to qPCR of genomic DNA. rs823114 was used for detection of allele-specific CTCF binding at the NUCKS1 promoter (Fig. 4f). ChIP was performed as described above and ChIP–qPCR was performed with rhAmp Genotyping Master Mix and rhAmp Reporter Mix (IDT). FAM and VIC were assigned as the reference allele and alternative allele, respectively. The relative quantities of ChIP samples were normalized by individual input DNA samples.
Other bioinformatic analyses
Many published datasets are used for our analyses (Supplementary Table 6). A description of the raw data generated in this paper is also included as Supplementary Table 6.
For Fig. 2a, CTCF ChIP–seq peaks were divided into three groups by their locations. Enhancer CTCF were those peaks overlapped with p300-bound enhancers in MCF-7, and promoter CTCF were those overlapped with promoters (RefSeq gene TSSs ±1 kb); domain boundaries were defined by all the CTCF peaks in the ±3 kb regions near the TAD boundaries. For each group, HOMER26 was used to calculate the normalized binding profile. For Fig. 2b, after sorting the transcriptional signals of genes identified by GRO-seq, the highest, middle and lowest 1,000 transcribed genes were chosen to find whether there are any CTCF peaks in the promoter (±1 kb of TSSs). The peak file of CTCF ChIP–seq was downloaded from ENCODE (ENCFF586KIH). A two-sided Fisher’s exact test was performed to compare the enrichment of peaks in the promoters for the three groups. For Fig. 4a, we fitted a linear model to estimate the relationship between tissue sample size and the number of ERRs found in that tissue type. Default R functions were used for computing the linear model and the P value for the fit (lm), as well as for the calculation of the Pearson’s correlation coefficient (r). The shaded region around the regression line represents the standard error of the fit. The P value for the linear model in R (abbreviated as Pr(>|t|)) is estimated from the t-statistic of the fit. For Fig. 4b showing the normalized effect size (NES) of GTEx eQTL SNPs, the definitions of NES, P value and m value can be found in the GTEx portal (https://www.gtexportal.org/ ), V8. We quote the definition here. For m value, it denotes the posterior probability that an eQTL effect exists in each tissue tested in the cross-tissue meta-analysis; the m value ranges between 0 and 1. For P value, it was generated by a t-test that compares the observed NES from single-tissue eQTL analysis to a null NES of 0. The NES was used to denote the slope of the linear regression of normalized expression data versus the three genotype categories using single-tissue eQTL analysis, representing eQTL effect size. The normalized expression values are based on quantile normalization within each tissue, followed by inverse quantile normalization for each gene across samples.
For Extended Data Fig. 6a–d, super-enhancers and typical enhancers were called by HOMER26 using p300 ChIP–seq datasets in each cell type (ENCFF000QPA for MCF-7, ENCFF258NYC and ENCFF728IVZ for GM12878). For each promoter, the nearest enhancer was identified by BEDtools. For statistics, a two-sided Fisher’s exact test was performed in R. For Extended Data Fig. 8a, the enhancers with upregulated eRNAs, as well as promoters from genes downregulated after siRAD21 treatment (as shown in Extended Data Fig. 3) were used to check whether these promoters and enhancers form reciprocal loops in MCF-7 ChIA-PET datasets (GSE39495). Each anchor of the ChIA-PET tag was extended by 5 kb on each side. If an enhancer or a promoter overlaps with the two anchors of a ChIA-PET tag, this pair of enhancer and promoter would be considered a ‘looped pair’. A two-sided Fisher’s exact test was performed to compare the enrichment of the loops formed by these E-P pairs in MCF-7 cells versus K562 cells. For Extended Data Fig. 8b, c, motif sites for ESR1 (MA0112.3) and FOXA1 (MA0148.3) were identified by FIMO. FOXA1 ChIP–seq peaks were obtained from ENCODE (ENCFF596OJV). The enhancer or promoter with both CTCF peaks and motifs were then considered as CTCF-associated enhancer or promoter; the same was done for ESR1 and FOXA1.
For Extended Data Figs. 9a–c, g–i, 10f, whole-genome cancer mutation datasets were obtained from the ICGC (release 28). In total, there were 58,402,698 mutations from 2,731 patients as generated from whole-genome sequencing. Only those cancer types with more than 100 donors and more than 1,000 total somatic mutations were used for plotting Extended Data Fig. 9a. For Extended Data Fig. 10f, motifs of CTCF (JASPAR ID MA0139.1), FOXA1 (MA0148.3), GATA3 (MA0037.2) and ESR1 (MA0112.3) were identified in the whole genome using FIMO45 to find the motif positions. Random genomic sequences with the exact same length as the CTCF motif were generated using BEDTools46, and defined as ‘random control motifs’. If the distance from a cancer mutation to its closest CTCF motif centre was smaller than 20 bp, the mutation would then be counted as a mutation associated with CTCF motif (that is, CTCF mutations). The mutations in ‘random control motif’ or the FOXA1, ESR1 and GATA3 motifs were defined in the same way. The count of CTCF-motif-disrupting mutations (for example, Fig. 3e) requires that no FIMO CTCF motif can be identified from the mutation-containing sequence anymore. Cancer-type abbreviations can be found in the ICGC portal (http://icgc.org/), and include (for example, in Fig.3e, Extended Data Fig. 9a, c): CLLE-ES, chronic lymphocytic leukaemia (Spain); MALY-DE, malignant lymphoma (Germany); PBCA-DE, paediatric brain cancer (Germany); PBCA-US, paediatric brain cancer (USA); PEME-CA, paediatric medulloblastoma (Canada); BRCA-EU, ER+ and HER2− breast cancer (European Union or UK); ESAD-UK, oesophageal adenocarcinoma (UK); LICA-CN, liver cancer (China); LIRI-JP, liver cancer (RIKEN, Japan); PACA-AU, pancreatic cancer (Australia); PACA-CA, pancreatic cancer (Canada); EOPC-DE, early-onset prostate cancer (Germany); PARD-CA, prostate cancer (Canada); PRAD-UK, prostate cancer (UK); MELA-AU, melanoma (Australia); SKCA-BR, skin adenocarcinoma (Brazil).
GTEx data processing
For a detailed description of the method used for GTEx data analysis, see Supplementary Figs. 8–10 and associated notes. The GTEx data used for the analyses described in this manuscript were obtained from the dbGap accession phs000424.v7.p2.c1 on 12 January 2017. In brief, the search for ERR events in the general human population was conducted using data from the Genotype-Tissue Expression (GTEx) project47 V7 release. We searched for cis-eQTLs in promoter regions, 2 kb upstream and 1 kb downstream of TSSs. We refer to these genes that host cis-eQTLs in their promoters as ‘gene-CP’ (that is, cognate promoter), and these eQTLs are referred to as P-eQTLs (Extended Data Fig. 11a). We then select the subset of gene-CP promoters for which the P-eQTLs that they contain also act as eQTLs for a distal gene in their chromosomal neighbourhood (±200 kb) in the same tissue type (this distal gene is referred to as ‘gene-AP’ for alternative promoter). Although we identified unique gene-CP–gene-AP pairs, we counted the events based on gene names rather than the numbers of P-eQTLs. For example, if ‘Gene A’ and ‘Gene B’ are regarded as a unique gene-CP–gene-AP pair, then Gene A/Gene B is counted only once. Next, we identified GTEx cis-eQTLs that overlapped with an exhaustive set of experimentally identified enhancer regions annotated by several consortia (the ENCODE10, FANTOM531, and Roadmap Epigenomics32 projects). The associations with traits and diseases were identified using genome-wide association studies (GWASs) in the NHGRI-EBI GWAS Catalog48 and GWASdb v249.
Statistics
In most of the paper, particularly for qRT–PCR results, two-tailed Student’s t-tests were used to calculate statistical significance unless otherwise specified. The distribution of sample measurements was considered to follow a normal distribution and variance was assessed as equal. For qRT–PCR or ChIP–qPCR, at least three biological replicates were conducted. For each biological repeat, three technical repeats were performed. Most of the results shown represent mean ± s.d., with asterisks indicating P values; *P < 0.05, **P < 0.01, ***P < 0.001 (two tailed Student’s t-tests).
Extended Data
Extended Data Fig. 1 |. Disrupted enhancer–promoter looping alters eRNA and mRNA transcription.
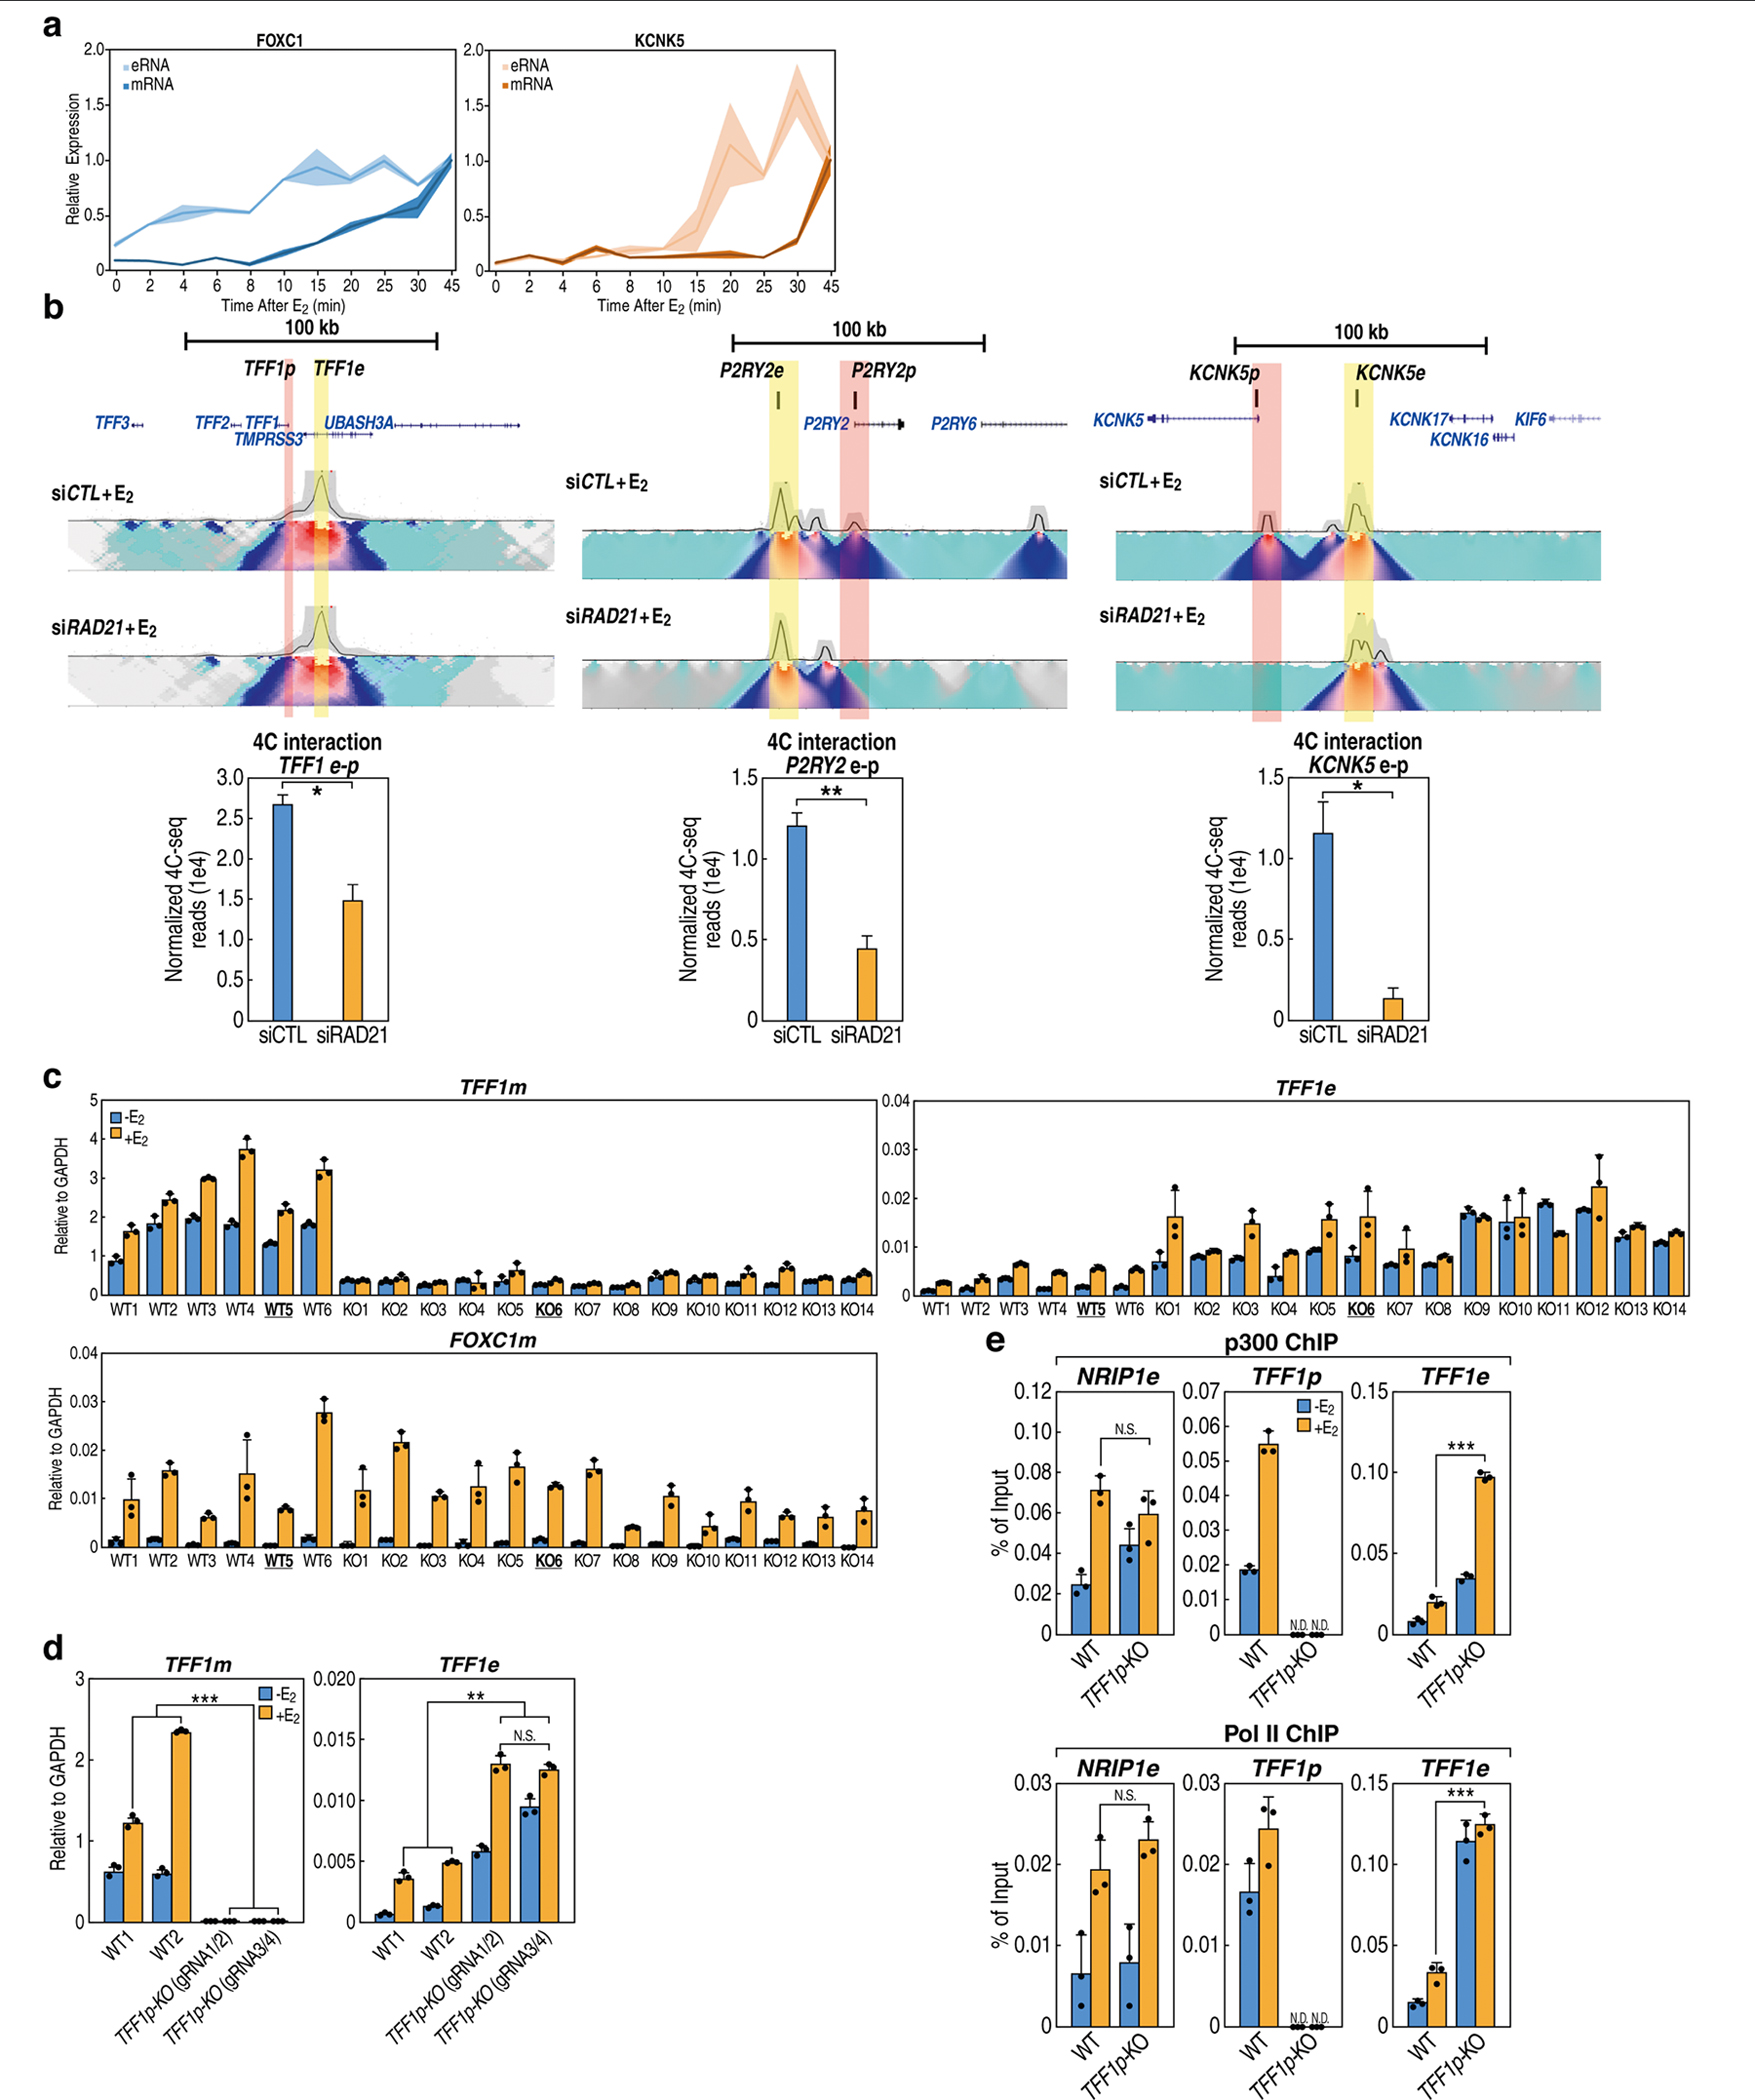
a, qRT–PCR results showing the temporal expression kinetics of eRNAs and mRNAs at two loci after treatment with 17-β-oestradiol (E2). mRNAs measured by intronic primers (n = 3; biological replicates). Shaded error band represents mean ± s.d. b, 4C-seq heat maps using TFF1e, P2RY2e or KCNK5e as the viewpoints showing the effects of RAD21 siRNA depletion on the E-P looping events; yellow and pink highlights depict enhancers and promoters, respectively. The quantified chromosome contact frequency between enhancer and promoter from two replicates of 4C-seq is shown in the bar graph (bottom). c, Expression of TFF1 mRNA (TFF1m) and TFF1 enhancer RNA (TFF1e) in wild-type (n = 6) and TFF1p-KO MCF-7 isogenic cell clones (n = 14) was checked by qRT–PCR. The FOXC1 gene that locates on another chromosome was examined as a control. The WT5 and KO6 lines were used for many subsequent experiments (for example, 4C-seq, GRO-seq and ChIP). Each bar represents data from an independent cell clone and was made from n = 3 data points of technical replicates. The data presented here represent three biological replicates. d, qRT–PCR results showing the expression of TFF1 eRNA and mRNA in wild-type MCF-7 cells versus TFF1p-KO cells with two different gRNA pairs (TFF1p-KO_gRNA1/2 and TFF1p-KO_gRNA3/4) (n = 3 data points of technical replicates; representative of three independent experiments). e, ChIP–qPCR data indicating the binding of RNA Pol II and p300 at the TFF1 enhancer or promoter in wild-type compared to TFF1p-KO cells (n = 3 data points of technical replicates; representative of two biological replicates); their binding at an enhancer region near the NRIP1 gene (that is, NRIP1e) is shown as a control. Data are mean ± s.d.; *P < 0.05; **P < 0.01, ***P < 0.001, two-tailed Student’s t-test.
Extended Data Fig. 2 |. Promoter deletion affects gene and eRNA transcription in its chromosomal neighbourhood at the P2RY2, KCNK5 and PGR loci.

a, b, qRT–PCR showing the mRNA and eRNA expression of P2RY2 (a) and the expression of neighbouring genes (FCHSD2 and P2RY6) (b) in wild-type (n = 2) versus P2RY2 promoter KO (P2RY2p-KO) (n = 2) independent isogenic clones of MCF-7 cells. Each bar represents an independent cell clone (n = 3 data points of technical replicates; representative of two independent experiments). c, Top, Hi-C contact matrix and ChIP–seq tracks of CTCF and p300 showing the topology of the chromosomal neighbourhood of P2RY2 locus. Bottom, UCSC browser screenshots showing the binding of CTCF, cohesin subunit (that is, RAD21) and ERα at P2RY2 and surrounding gene promoters. d, e, qRT–PCR showing the mRNA and eRNA expression of KCNK5 (d) and the expression of neighbouring genes (KCNK17 and SAYSD1) (e) in wild-type (n = 2) versus KCNK5 promoter KO (KCNK5p-KO) (n = 2) independent isogenic cell clones of MCF-7 cells. Each bar represents an independent cell clone (n = 3 data points of technical replicates; representative of two independent experiments). f, Top, Hi-C contact matrix and ChIP–seq tracks of CTCF and p300 showing the topology of the chromosomal neighbourhood of the KCNK5 locus. Bottom, UCSC browser screenshots showing the binding of CTCF, cohesin subunit (that is, RAD21) and ERα at KCNK5 and surrounding gene promoters. g, h, qRT–PCR showing the mRNA and eRNA expression of PGR (g) and the expression of neighbouring genes (ARHGAP42 and TRPC6) (n = 3) (h), in wild-type (n = 2) versus PGR promoter KO (PGRp-KO) (n = 2) independent isogenic cell clones of MCF-7 cells. Each bar represents an independent cell clone (n = 3 data points of technical replicates; representative of two independent experiments). i, Top, Hi-C contact matrix and ChIP–seq tracks of CTCF and p300 showing the topology of the chromosomal neighbourhood of the PGR locus. Bottom, UCSC browser screenshots showing CTCF, cohesin and ERα binding at PGR and surrounding gene promoters. Data are mean ± s.d.; *P < 0.05; **P < 0.01, ***P < 0.001, two-tailed Student’s t-test.
Extended Data Fig. 3 |. Cohesin knockdown affects gene and eRNA transcription through coordinating looping, without changing histone methylation.
a, qRT–PCR results showing efficient knockdown of RAD21 by siRNA, which does not affect the mRNA level of ESR1 (encoding ERα) (n = 3 data points of technical replicates; representative of two independent experiments). b, c, qRT–PCR results showing that siRAD21 decreases the 17-β-oestradiol-induced activation of coding genes (b), but upregulates the eRNAs next to these genes (c) (n = 3 data points of technical replicates; representative of two independent experiments). d, MA plots showing the differential expression of RefSeq genes (left) or eRNAs (right) in cells with depletion of RAD21 versus cells transfected with control siRNA (that is, siCTL). Red dots represent significantly changed genes or eRNAs (fold change > 1.5; FDR < 0.05). The purple bars indicate twofold change. e, UCSC genome browser screen shoots of GRO-seq results in siRAD21- versus siCTL-transfected MCF-7 cells at KCNK5 (left) and P2RY2 (right) loci; p300 ChIP–seq serves to indicate active enhancers. Yellow highlights denote gene regions; pink highlights denote enhancer regions. f, Diagram showing an oppositely regulated transcription of many eRNAs and mRNAs caused by disruption of E-P looping (that is, siRAD21). g, The tag density plots showed no significant difference of histone marks for promoters (H3K4me3 ChIP–seq) or enhancers (H3K4me1 ChIP–seq). qPCR data represent mean ± s.d.; **P < 0.01, ***P < 0.001, two-tailed Student’s t-test.
Extended Data Fig. 4 |. Deletion of the TFF1 promoter alters the transcription of the cognate TFF1 enhancer and neighbouring genes.
a, Hi-C contact matrix in GM12878 cells (by Juicebox), CTCF-mediated chromatin loops (by ChIA-PET) and ChIP–seq tracks of CTCF and p300 in MCF-7 cells showing the topology (multiple contact domains) of the chromosomal neighbourhood of the TFF1 locus. Yellow triangles in the Hi-C map denote contact domains; domains are numbered for simplicity. The contact domains containing genes analysed in b are highlighted in yellow. b, Box plots of gene expression outside of the hosting contact domain of TFF1 generated by qRT–PCR in wild-type (n = 6) and TFF1p-KO (n = 14) isogenic clones of MCF-7 cells. The box plot centre lines represent medians; box limits indicate the 25th and 75th percentiles as determined by R software; and whiskers extend 1.5 × IQR from the 25th and 75th percentiles. c, qRT–PCR results showing the expression of TFF3 and RSPH1 mRNA in wild-type MCF-7 cells as compared to TFF1p-KO cells with two different gRNA pairs (TFF1p-KO_gRNA1/2 and TFF1p-KO_gRNA3/4) (n = 3 data points of technical replicates; representative of three independent experiments). d, ChIP–qPCR data indicating the binding of RNA Pol II and p300 at TFF3p in wild-type cells as compared to TFF1p-KO cells (n = 3 data points of technical replicates; representative of two independent experiments). e, qRT–PCR results showing the expression of TFF1e and TFF3m after knockdown of RAD21 by siRNA in wild-type MCF-7 cells versus TFF1p-KO cells (n = 3 data points of technical replicates; representative of two independent experiments). f, qRT–PCR results showing the expression TFF1e, TFF1m and TFF3m in wild-type MCF-7 cells versus cells with deletion of the TFF1 enhancer (TFF1e-KO), TFF1 promoter (TFF1p-KO) or both (TFF1e/p-DKO) (n = 3 data points of technical replicates; representative of three independent experiments). The diagram shows the TFF1e deletion in TFF1p-KO cells. Data are mean ± s.d.; *P < 0.05; **P < 0.01, ***P < 0.001, two-tailed Student’s t-test.
Extended Data Fig. 5 |. Epigenomic features of the enhancers and promoters that are putative looping pairs, as revealed by their opposite regulation after siRAD21 treatment.
a, ChIP–seq profile plots were generated using published data in MCF-7 cells (Supplementary Table 6), showing the differential enrichment of chromatin-looping-related structural factors, including CTCF, cohesin subunit (that is, RAD21), cohesin loading factor (that is, NIPBL) and Mediator subunit (that is, MED1) on the promoters that are downregulated by siRAD21 treatment, as well as on enhancers for which eRNAs are increased by siRAD21. Also refer to Extended Data Fig. 3. b, ChIP–seq profile plots showing the differential enrichment of factors that are relevant to enhancer function in MCF-7 cells, including those of p300, ERα, FOXA1 and GATA3. c, Diagram showing the non-stoichiometric distribution of chromatin structural factors and other transcription-related factors on functional E-P pairs. These E-P pairs denote RAD21-regulated enhancers (super-activated by siRAD21) and RAD21-dependent promoters (downregulated by siRAD21).
Extended Data Fig. 6 |. Promoters exhibit a higher frequency and affinity of CTCF binding than enhancers.
a, Percentages of promoters (P), enhancers (E) or random genomic regions (R) that contain a CTCF motif (left) or undergo CTCF binding (right) in MCF-7 cells (based on ENCODE data). The cartoons at the bottom indicate that promoters were further analysed for their features in c, on the basis of their distance to an adjacent enhancer. b, Similar to a but using GM12878 data. c, Percentage of MCF-7 promoters that contain a CTCF motif (left) or undergo CTCF binding (right) for three categories of promoters: promoters that have a super-enhancer, a typical enhancer or no enhancer in their 50-kb genomic proximity (cartoon at bottom of a). d, Similar to c but using GM12878 data. All P values in a–e were generated by two-sided Fisher’s exact test. e, Top, diagram showing the design of constructs. The binding between GCN4 and ScFV will bring CTCF to the sites at which dCas9/gRNA binds. Bottom, western blots showing the expression of scFv-CTCF-V5 (wild type or Y226A/F228A mutant) and dCas9–10xGCN4 after lentiviral transduction (uncropped images in Supplementary Fig. 1; representative of two independent experiments). f, ChIP–qPCR using a V5 antibody indicating comparable binding of V5-tagged wild-type CTCF or CTCF(Y226A/F228A) on TFF3p (n = 3 data points of technical replicates; representative of two independent experiments). Control gRNAs did not bring the V5-tagged CTCF to TFF3p. ChIP was performed with MCF-7 cells expressing dCas9–10xGCN4 and scFV-CTCF (wild type or Y226A/F228A mutant) as indicated. qPCR data in f represent mean ± s.d.; *P < 0.05; **P < 0.01, two-tailed Student’s t-test. The P values were based on comparisons between the same-coloured bar (either wild-type or mutant CTCF) in TFF3p-gRNA1/gRNA2 versus CTL-gRNA1/gRNA2 conditions.
Extended Data Fig. 7 |. Enhancer scanning and alternative models to interpret ERR and enhancer–promoter functional engagement.
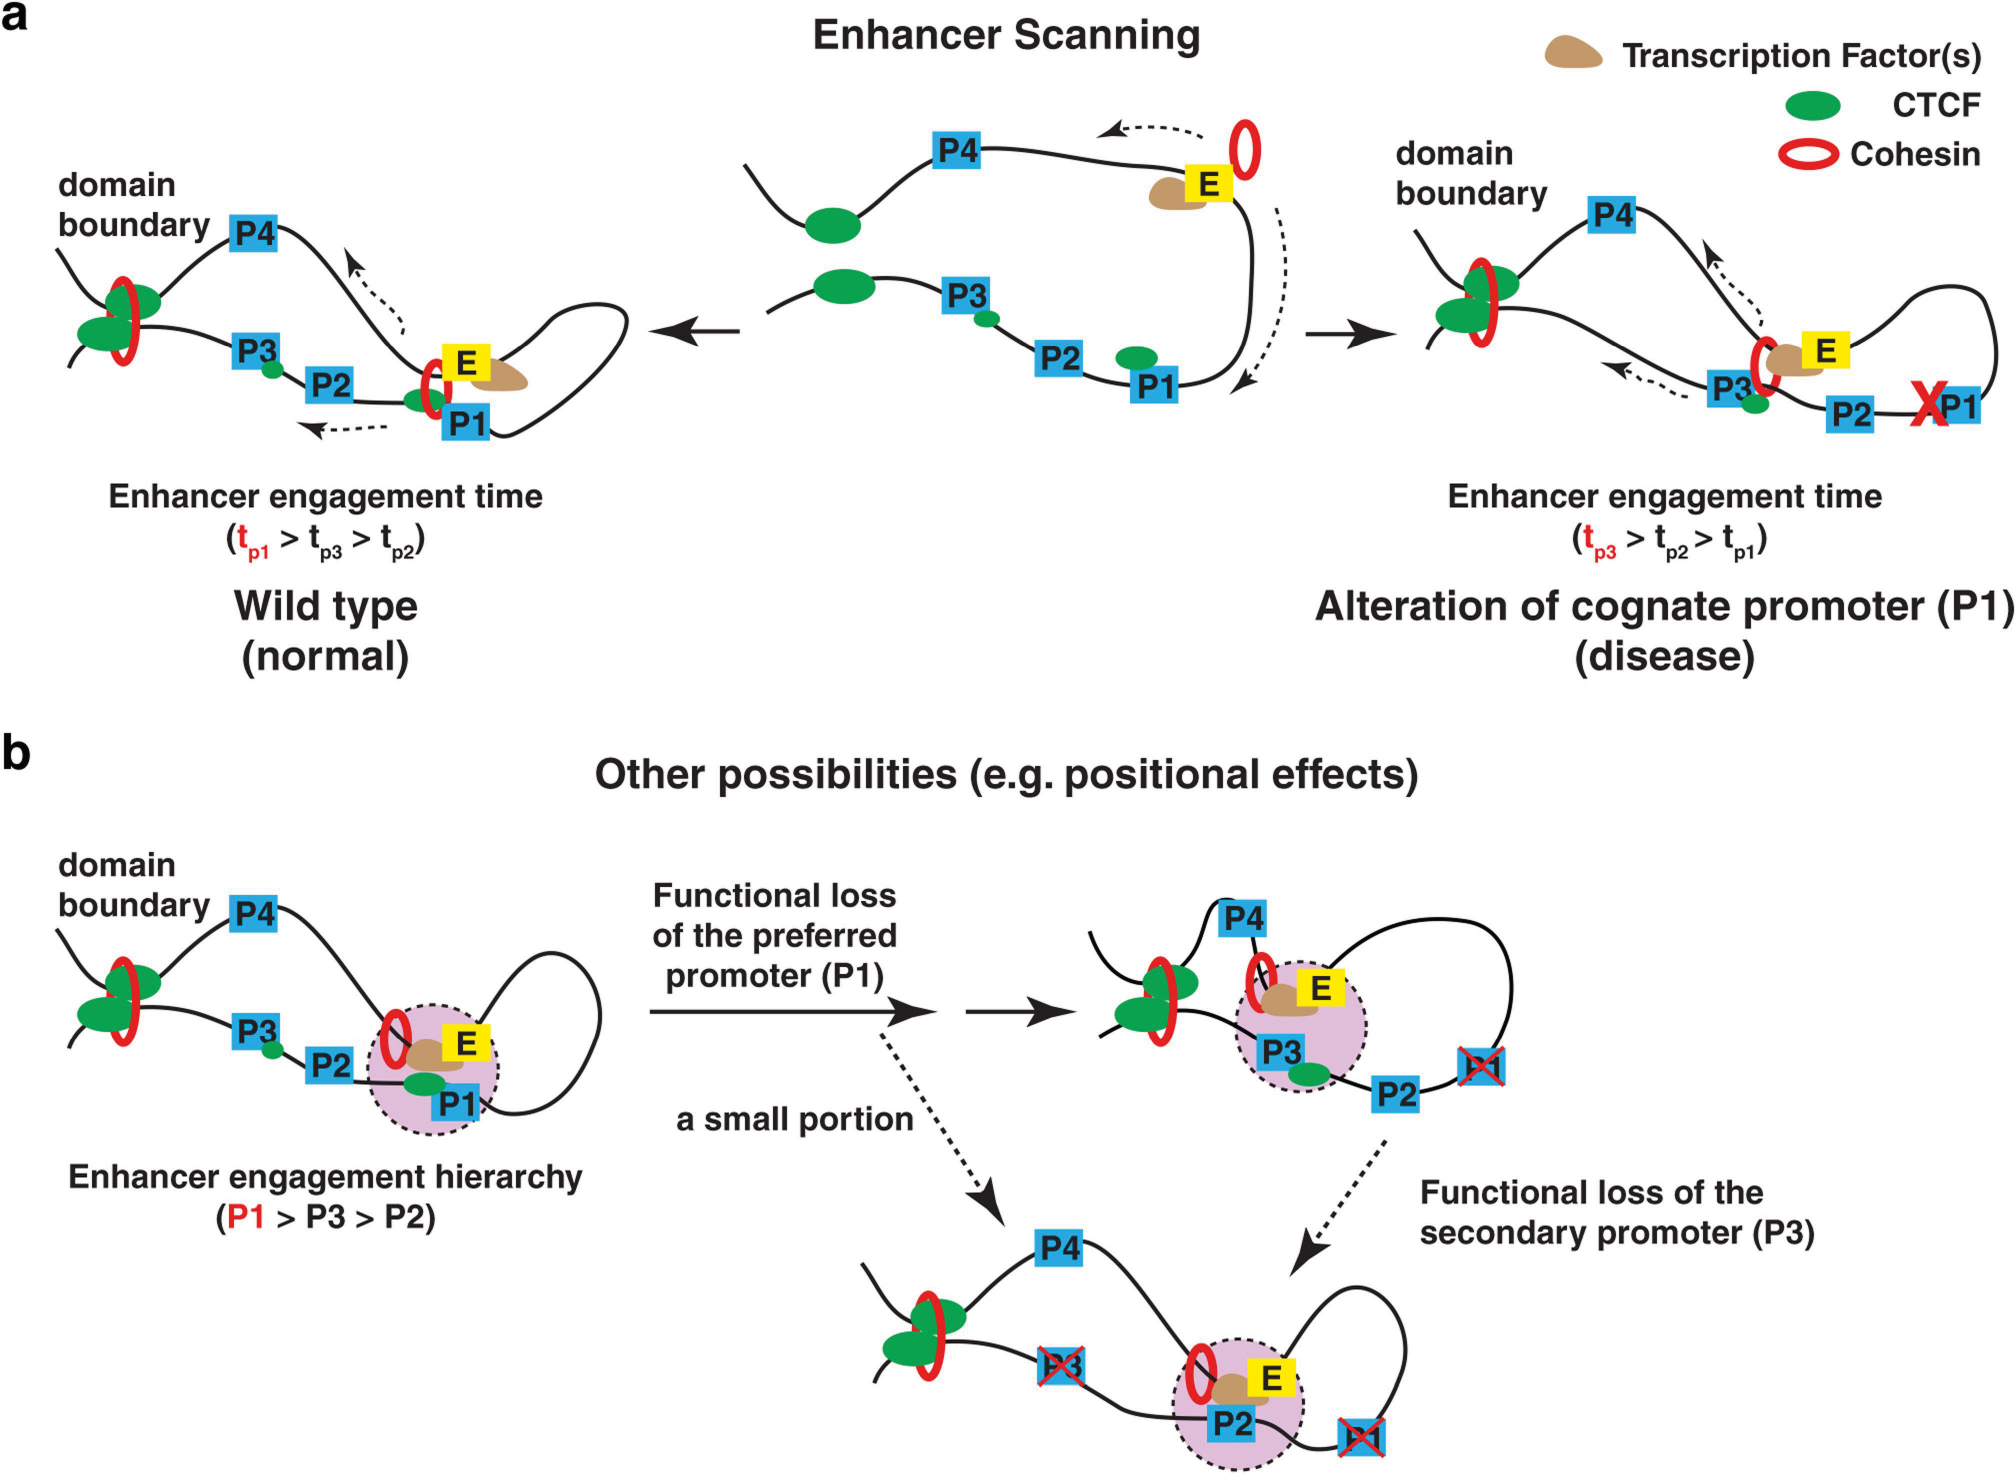
a, Model describing the process through which an activated enhancer scans its chromosomal neighbourhood inside a contact domain to functionally engage with its cognate promoter target. This enhancer scanning process involves promoter-bound CTCF (green ovals) and is compatible with cohesin-mediated extrusion (dashed lines) in wild-type cells, but it continues to operate in the absence of the cognate promoter (that is, P1) owing to deletion or disease mutation. A hypothetical ‘enhancer engagement’ time is depicted that reflects the relative amount of time in which the active enhancer engages with the neighbouring promoters, correlating with their expression levels. b, There are alternative, non-exclusive models that could be largely consistent with our results. For example, one of the other possibilities is a ‘positional effect’ model. In this model, an active enhancer may engage with its preferred promoter, and the two are retained in a transcription-associated E-P loop, quite probably in a nuclear environment such as an interchromatin granule50, transcription factory or other perhaps phase-separated structure (pink coloured area). Upon functional loss (deletion, mutation or CTCF loss) of the original promoter, this ‘positional’ effect will follow the enhancer but it will engage with the secondary choices (P3 in the model; for example, TFF3 as compared to TFF1, or PAX5 as compared to ZCCHC7, or TERT as compared to CLPTM1L). But at a lower frequency or in a small percentage of single cells among a population, the enhancer does engage with other target promoters (such as P2, dotted black line). When the secondary choice is also lost, the entire enhancer will now select the third choice—for example, P2 in the model—to activate the promoter as its newest hierarchical choice. Overall, a few specific results from our study are in better support of the enhancer scanning model. First, it is consistent with the observation that for all single-cell colonies investigated (that is, 14 independent cell clones of TFF1p-KO in Extended Data Fig. 1), they consistently exhibited the highest expression of TFF3 as the new hierarchical promoter choice, precluding models suggesting stochastic promoter choice. A positional effect model may predict that the enhancer and the target promoter are engaged so that the inhibition of one will reduce the other. This is true in that deletion of TFF1e inhibited TFF1p (Extended Data Fig. 4f). However, CRISPRi of TFF1p resulted in higher activity of TFF1e and higher expression of TFF3 (Fig. 3b). This data better support an enhancer scanning model—a dynamic enhancer–promoter interaction process inside the contact domain, in which TFF1p inhibition makes the ‘TFF1e-in-action’ preferentially interact with the next target in the hierarchy. Second, TFF1e exhibited quite broad chromatin interaction throughout the contact domain (for example, Fig. 1e, by 4C-seq), which is in accord with its ‘scanning’ behaviour. Furthermore, high-resolution Micro-C2,51 data showed that many ‘stripe loops’ formed in between enhancer and promoter at a finer scale (<50 kb or sometimes <10 kb), consistent with the suggestion that at least a subset of enhancers and promoters are actively scanning or extruding. The positional effect model is fundamentally compatible with the enhancer scanning model. The enhancer scanning model reflects a dynamic process in which the enhancer initiates target searching and it finds a major target as well as many additional minor targets. Were we to snapshot this dynamic process, then at every time point that an enhancer engages with one of its potential targets (for example, TFF3p or TFF1p), the target promoter would be repositioned closer to the enhancer. Our data suggest that the scanning process of the enhancer requires the cohesin complex, as its depletion by RNA interference reproduced many of the phenomena that are seen in promoter-knockout cells (for example, Fig. 1b, Extended Data Figs. 3, 4e). This is consistent with a proposed loop-extrusion model, rather analogous to the mechanism by which cohesin facilitates the formation of the larger TAD structures23,24,52, requiring opposing CTCF motif orientation and high-affinity CTCF binding. However, it cannot be excluded that other chromatin remodellers, or Pol II itself, are the critical driver of enhancer scanning and E-P engagement. In support of this, inhibition of Pol II elongation partially reduced the promoter-centred stripe loops in mouse embryonic stem cells in a Micro-C study2. Finally, it is noteworthy that the scanning concept that enhancers (either the DNA–protein complex as an entirety or specific transcription apparatus such as Pol II) travel along chromatin to reach target genes has been extensively discussed as one of the classic models to interpret enhancer activity22,53.
Extended Data Fig. 8 |. CTCF binding on promoters, but not on enhancers. dictates enhancer–promoter choice.
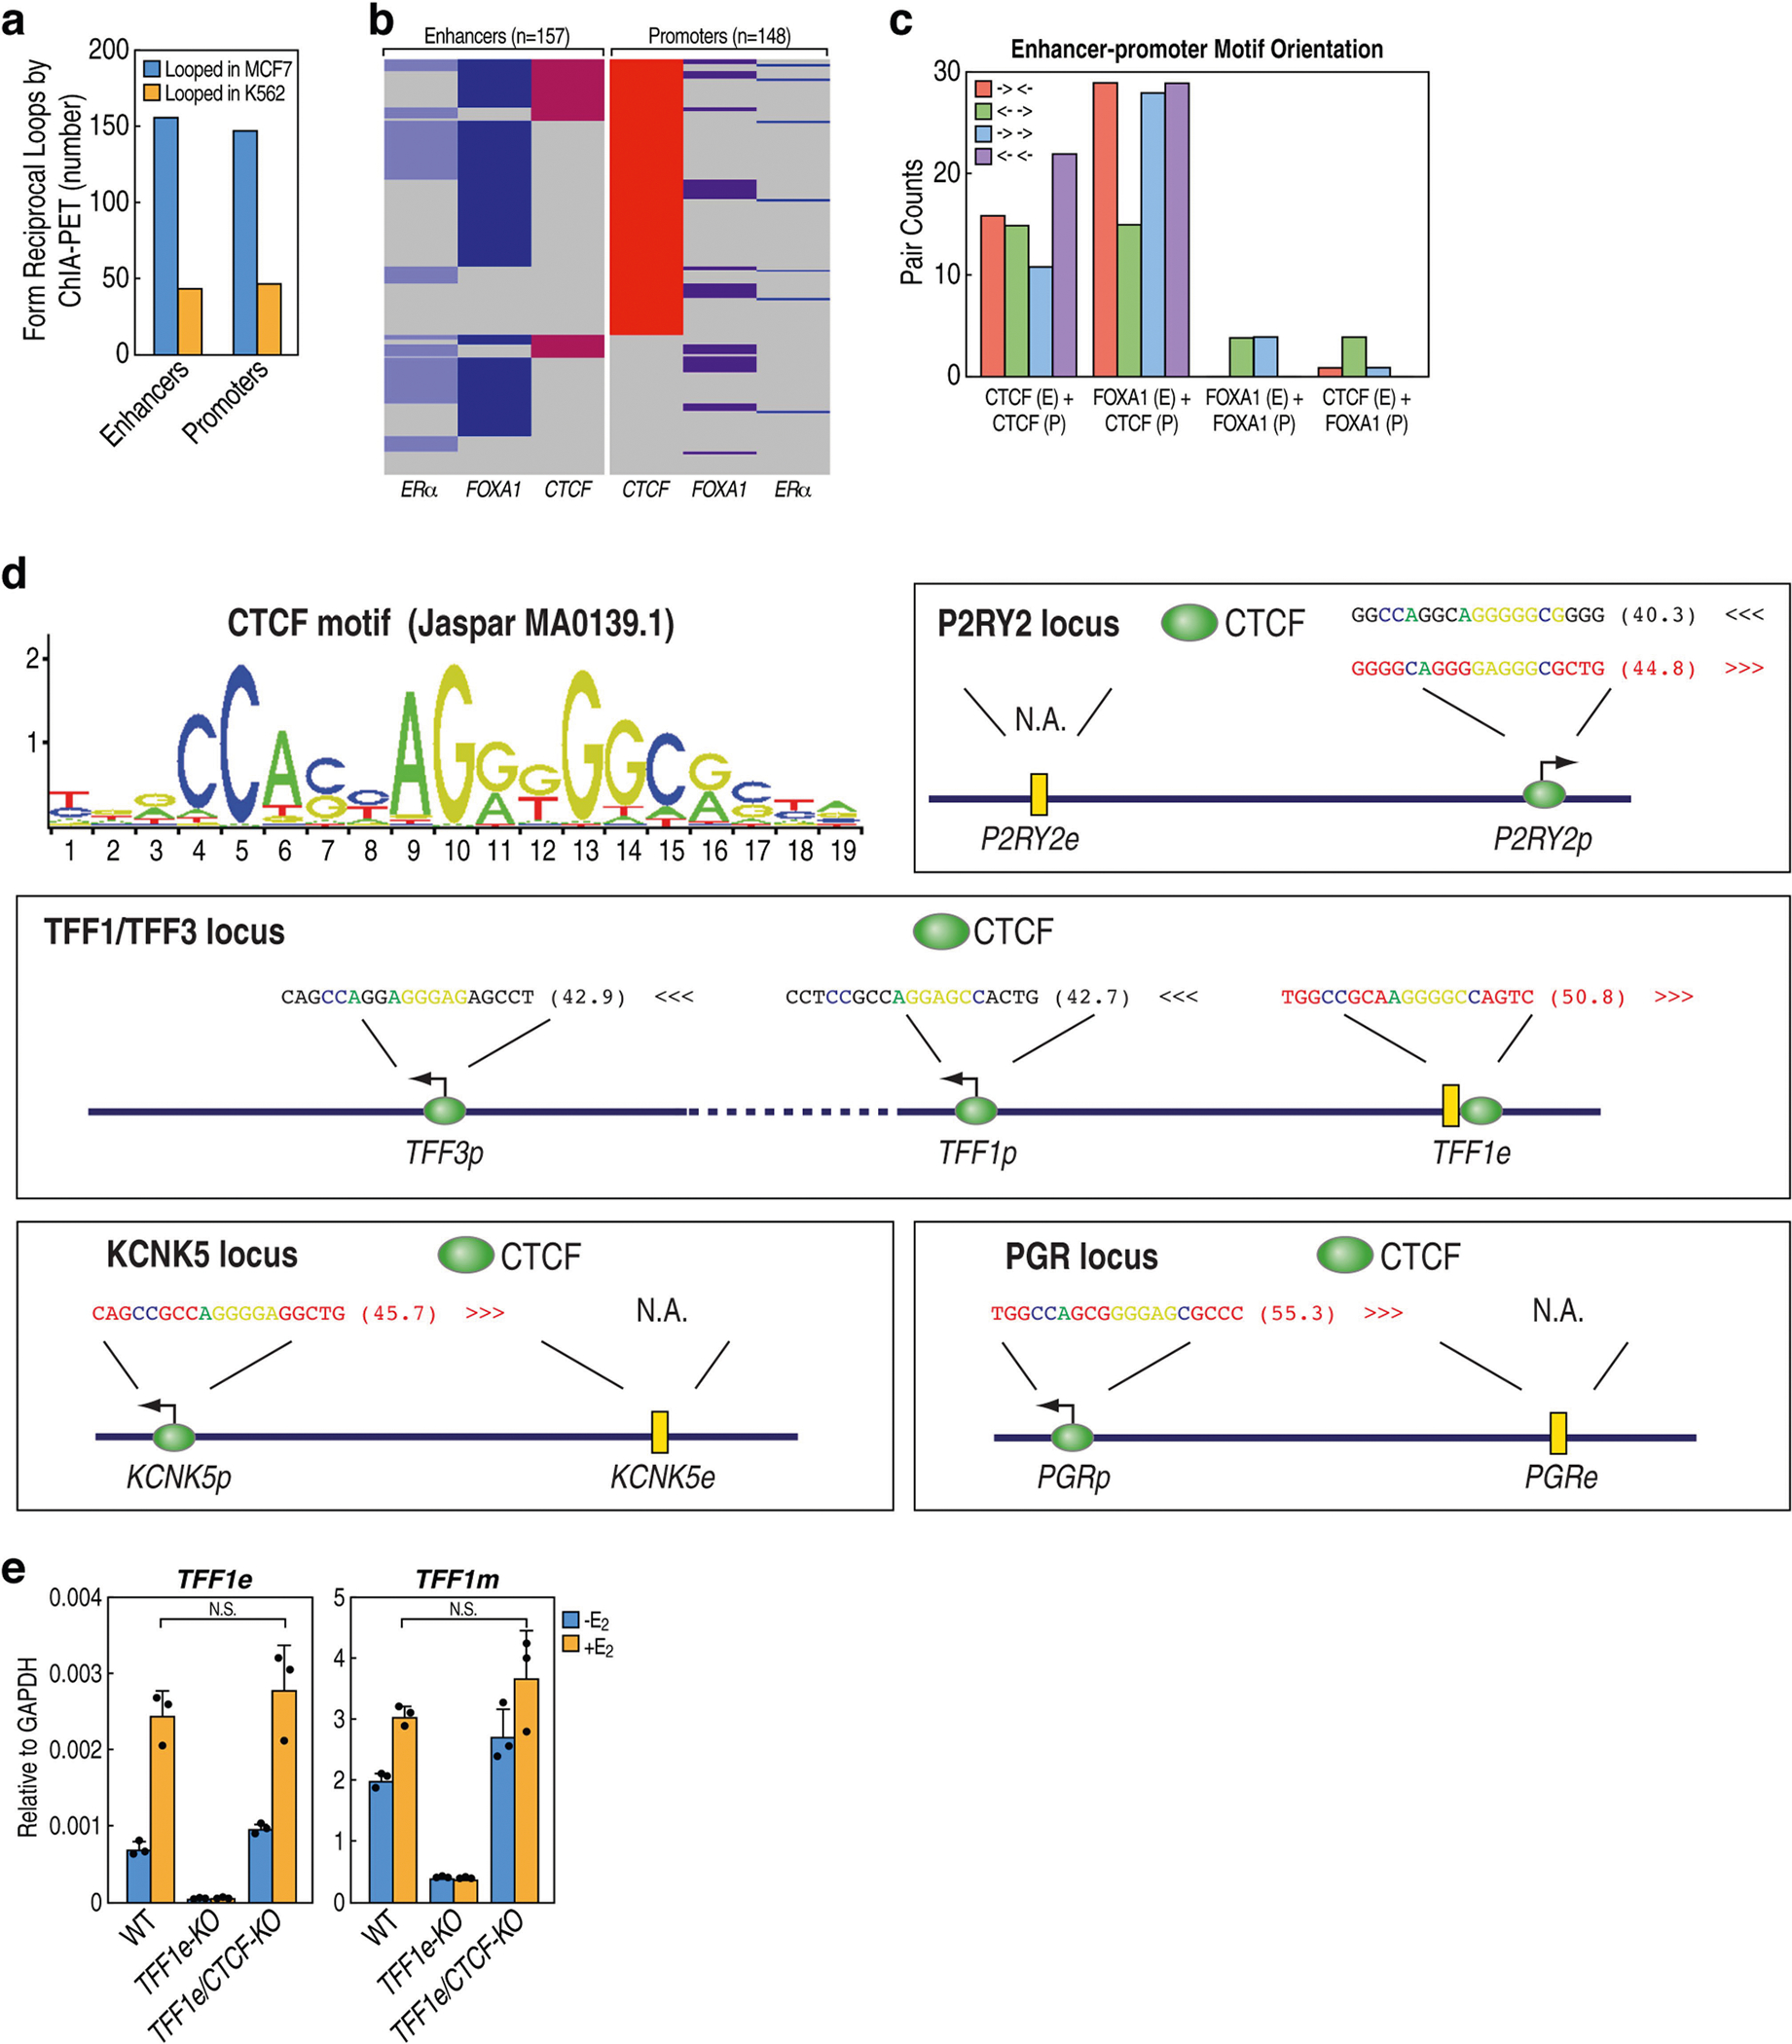
a, Bar graph showing the numbers of RAD21-regulated enhancers and promoters (same set used in Fig. 1b, Extended Data Fig. 5) that engage in chromatin loops in MCF-7 cells as discovered by analysing MCF-7 ChIA-PET data from ENCODE, as compared to their low incidence of looping in K562 ChIA-PET data. b, Coloured map showing that, among the functionally looped E-P pairs discovered in a, only certain percentages are bound by ERα, FOXA1 or CTCF by ChIP–seq. c, The numbers of looped E-P pairs that display various motif directionality of CTCF and FOXA1. The four categories below the plot describe the existence of CTCF or FOXA1 motifs on enhancers (E) or promoters (P); the colours indicate the combinations of motif directionality. For example, ‘CTCF (E) + CTCF (P)’ denotes the coincidence of CTCF motifs on both promoters and enhancers. There was no obvious orientation preference of binding motifs for CTCF. FOXA1 binds to functionally looped enhancers more frequently than CTCF (Extended Data Figs. 5b, 8b), but it also exhibits no preferred motif orientation. d, Diagrams showing the position and directionality of CTCF-binding peaks and motifs in the four E-P pairs that we have extensively studied in this work. The colour motif sequence indicates directionality (black for left-pointing motifs, red for right-pointing motifs); the letters in each motif sequence are coloured to match the core CTCF motif nucleotides shown in the canonical CTCF motif by Jaspar (upper left logo); the motif scores after each motif sequence were calculated by the FIMO motif toolset. e, qRT–PCR results showing the expression of TFF1 eRNA and mRNA in wild-type MCF-7 cells versus cells with deletion of the TFF1 enhancer (TFF1e-KO), and MCF-7 cells with deletion of a CTCF peak inside the TFF1 enhancer (TFF1e/CTCF-KO; Supplementary Table 1, Supplementary Fig. 3) (n = 3 data points of technical replicates; representative of two independent experiments). Data are mean ± s.d.; *P < 0.05; **P < 0.01, ***P < 0.001, two-tailed Student’s t-test.
Extended Data Fig. 9 |. Cancer mutations in gene promoter regions, and their link to oncogene activation through ERR.
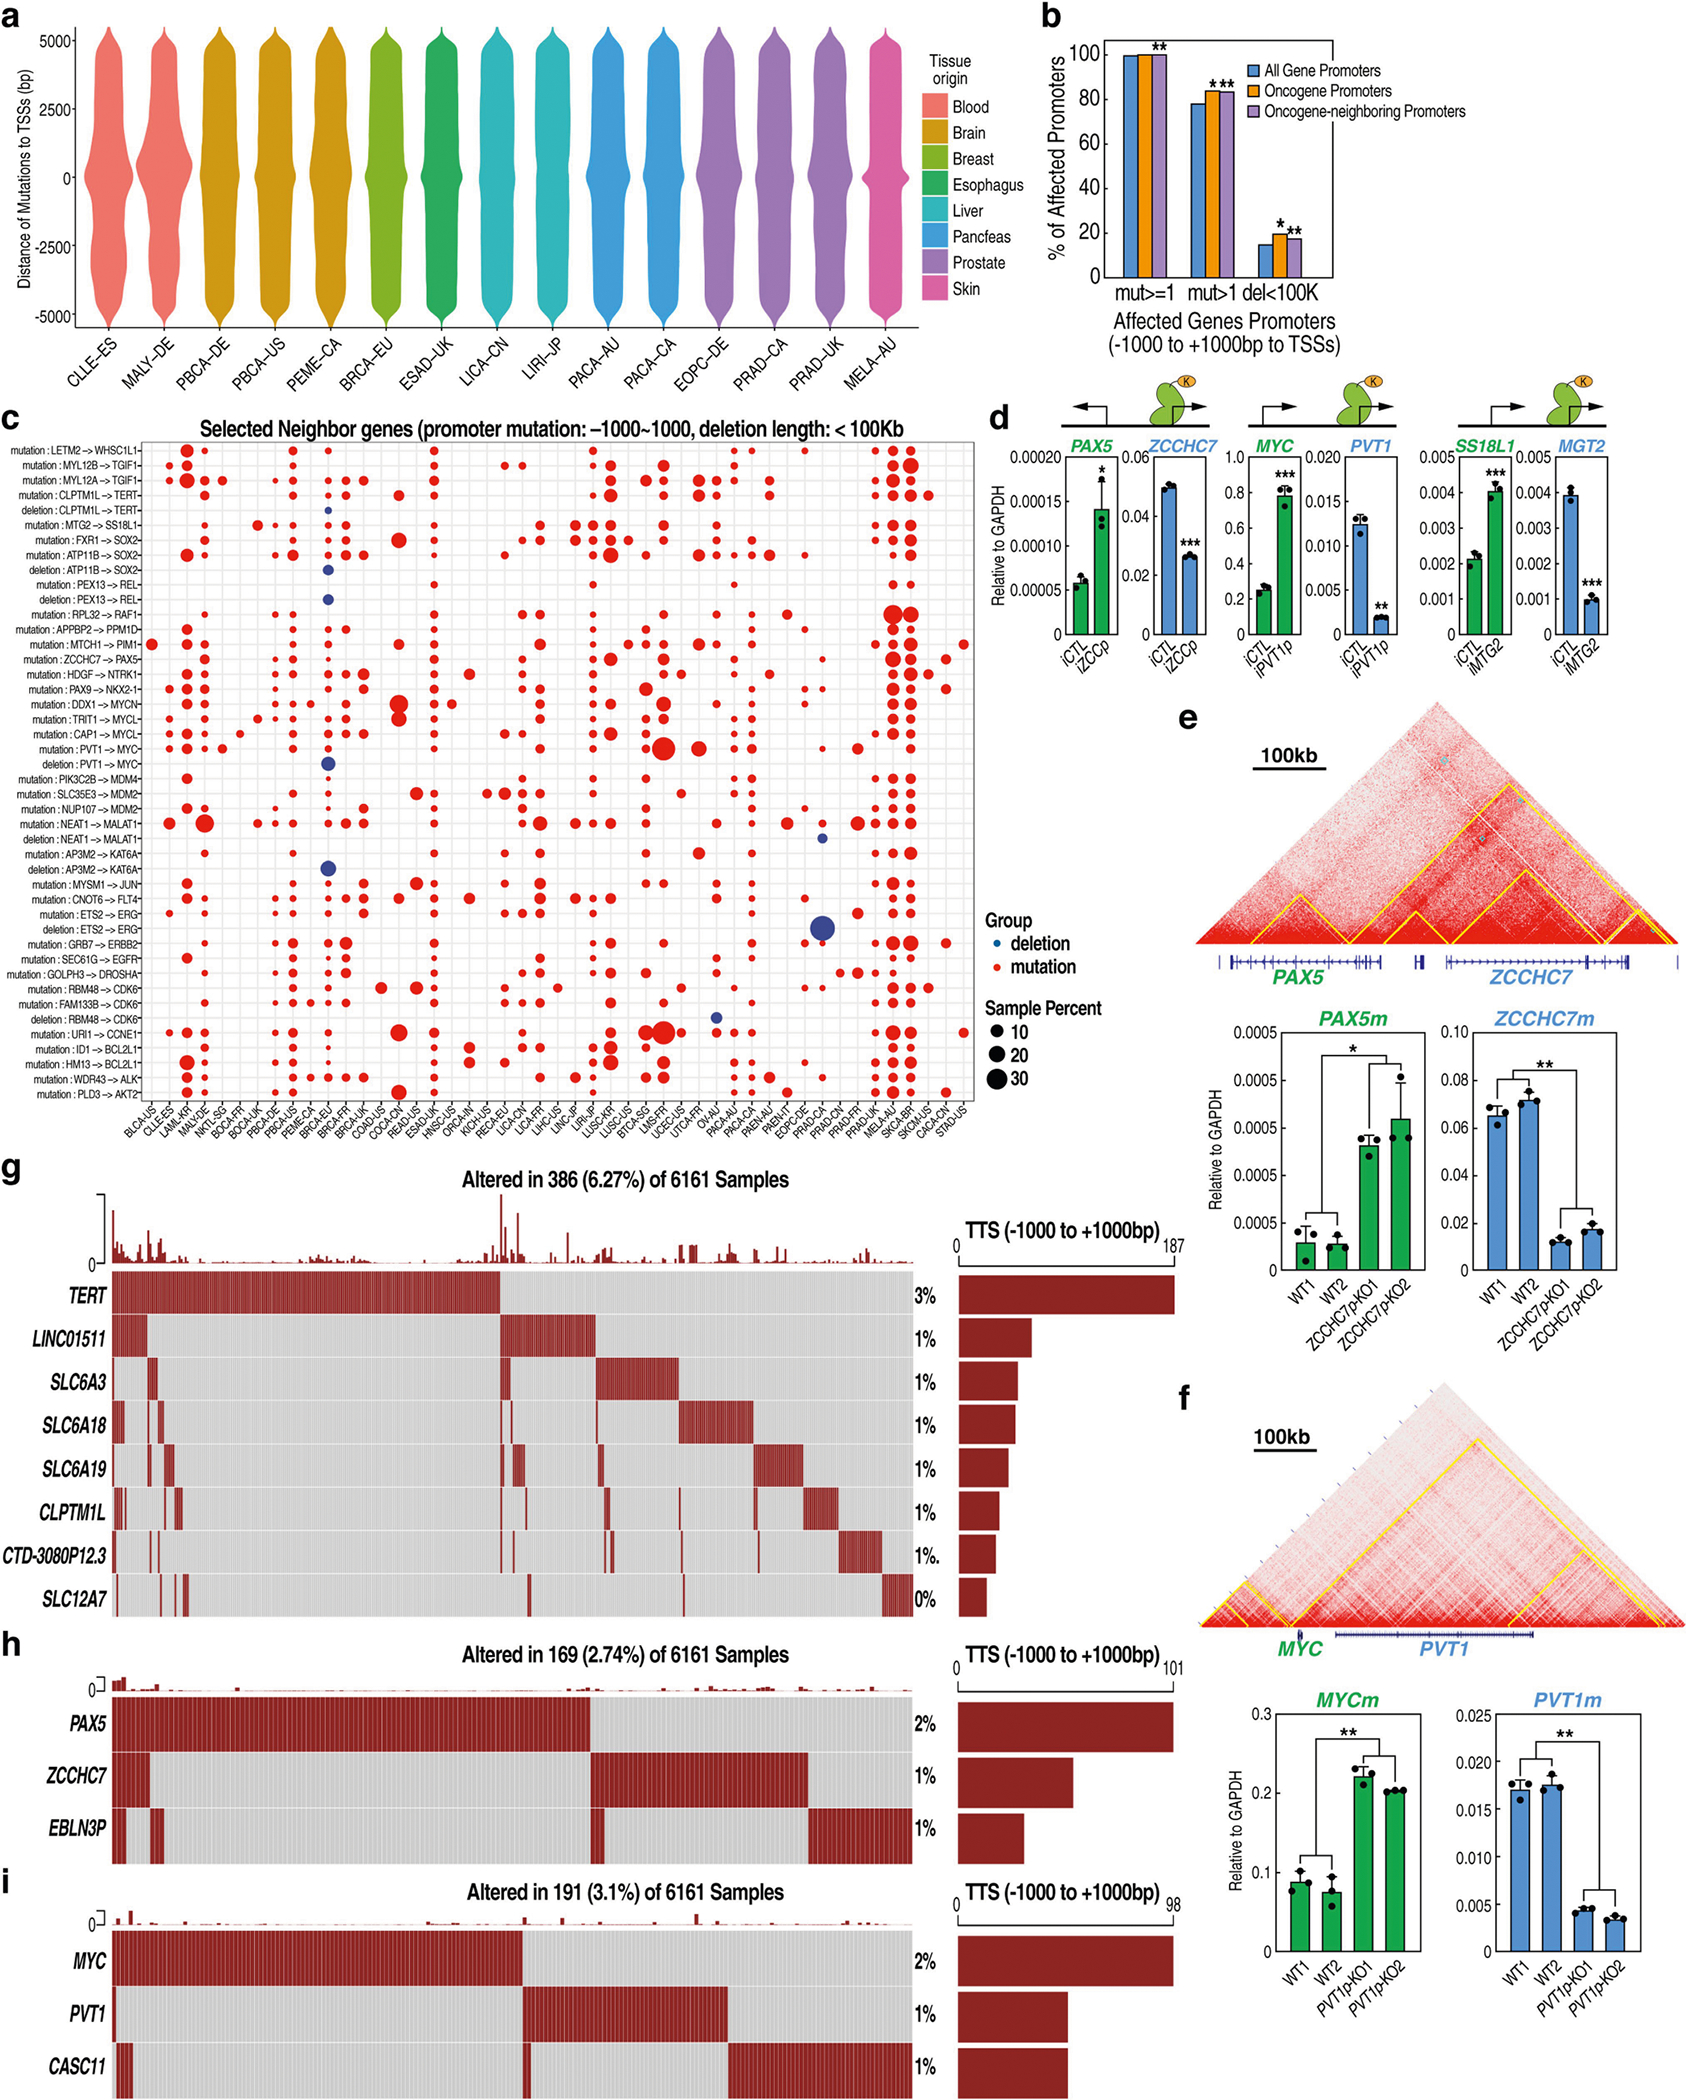
a, Plots showing the distribution of ICGC cancer whole-genome sequencing (WGS) mutations in the ±5 kb regions near gene TSSs. The two numbers in each plot indicate the mutations in the ±5kb of TSSs, as well as the total numbers of mutations in that cancer type, respectively. Cancer type abbreviations can be found in the ICGC web portal (http://icgc.org/), and in the Methods. b, The percentage of genes containing ICGC annotated promoter mutations or deletions among all RefSeq genes (all gene promoters; total 27,502), oncogene promoters (OPs, from cosmic database; total 315) and neighbouring gene promoters within ±200 kb of cosmic oncogenes (oncogene neighbouring promoters (ONPs); total 1,693). Hypergeometric tests were performed to compare the statistical significance of the enrichment of bearing a mutation or deletion for OPs or ONPs as compared to all RefSeq gene promoters (upon different frequency or size of mutations as indicated in the x axis). For each test, for example, comparing OPs to all RefGene promoters, p[X > k] was calculated, which denotes a one-sided probability that a higher percentage of oncogene promoters bears mutations or deletions than the percentage of RefSeq promoters. The random variable X follows a hypergeometric distribution with parameters N (number of total RefSeq genes), K (number of total RefSeq genes bearing promoter mutations or deletions), n (number of total oncogenes or oncogene neighbours), k (number of total oncogenes or oncogene neighbours that bear promoter mutations or deletions). The five significant P values shown in the plot (from left to right) are 9.2 × 10⁻⁴, 3.3 × 10⁻³, 5.2 × 10⁻⁵, 5.3 × 10⁻³ and 5.6 × 10⁻⁴, respectively. mut> = 1: any mutations being identified in ICGC; mut > 1: recurrent promoter mutations identified in more than 1 donors in ICGC release 28; del < 100 kb: genetic deletions with length smaller than 100 kb. c, Occurrence of somatic mutations and deletions at a selected list of ONPs that were included in our CRISPRi screening (see Fig. 3c). In this plot, the cancer cohorts (x axis) were ranked by the names of original cancer sites, and the y axis shows the ONP–OP gene pairs. Gene names before ‘−>‘ are those of ONPs, whereas those after ‘−>‘ are oncogenes. For example, ‘mutation: CLPTM1L −> TERT’ (the fourth row) indicates that TERT is an oncogene listed in COSMIC, and the gene promoter of CLPTM1L was identified as an ONP, which contains somatic mutations in several cancer types. The dot size was scaled by the percentage of affected donors in each of that cancer type or cohort (SamplePerc), and dots of red colour show those samples with mutations, whereas blue dots show those samples with deletion (<100 kb) covering an ONP. The cancer type abbreviations can be found in the ICGC web portal (http://icgc.org/) and in the Methods. d, qRT–PCR results showing the expression of gene pairs, PAX5–ZCCHC7, MYC–PVT1 and SS18L1–MTG2. Each pair consisted of an oncogene (PAX5, MYC and SS18L1) and its adjacent ONP genes (ZCCHC7, PVT1 and MTG2). The ONP promoters were inhibited with specific sgRNAs in MCF-7 cells together with dCas9-KRAB (see the diagrams at the top) (n = 3 data points of technical replicates; representative of two independent experiments). e, f, Similar to Fig. 3d, these are results for two other ONP–OP loci after ONP deletion. The Hi-C contact matrix at the top shows the relative location of PAX5–ZCCHC7 and MYC–PVT1 gene pairs in a shared contact domain. qRT–PCR results below show the expression of ONP and OP gene mRNAs (two independent clones each) (n = 3 biological replicates). g–i, Oncoplots showing the landscapes of ICGC mutations located in three pairs of OPs as well as their ONPs at the TERT–CLPTM1L locus (g), the PAX5–ZCCHC7 locus (h) and the MYC–PVT1 locus (i). The percentages of mutations between 0.5–1% are denoted as 1%, and these between 0–0.5% are denoted as 0%. Each column in the oncoplot represents a cancer sample. The bar graphs with numbers (for example, 187, 101, 98) in the right side indicate the numbers of donor samples that contain mutations for that specific gene promoter. The labels on top of each panel indicate the total numbers of donors that contain mutations in any of the promoters in that specific locus, for example, 386 (6.27%) is the sum number of donors that contain mutations for any of the promoters shown in g. It is noteworthy that it remains a challenge to directly compare oncogene expression changes in tumour samples that carry rare noncoding mutations, because the rarity of matched RNA-seq and genotype (WGS) precludes a robust statistical analysis. qPCR data in d–f represent mean ± s.d.; *P < 0.05; **P < 0.01, ***P < 0.001, two-tailed Student’s t-test.
Extended Data Fig. 10 |. Chromosomal interaction in three pairs of oncogene and oncogene-neighbourhood genes exhibiting an ERR-like phenotype.
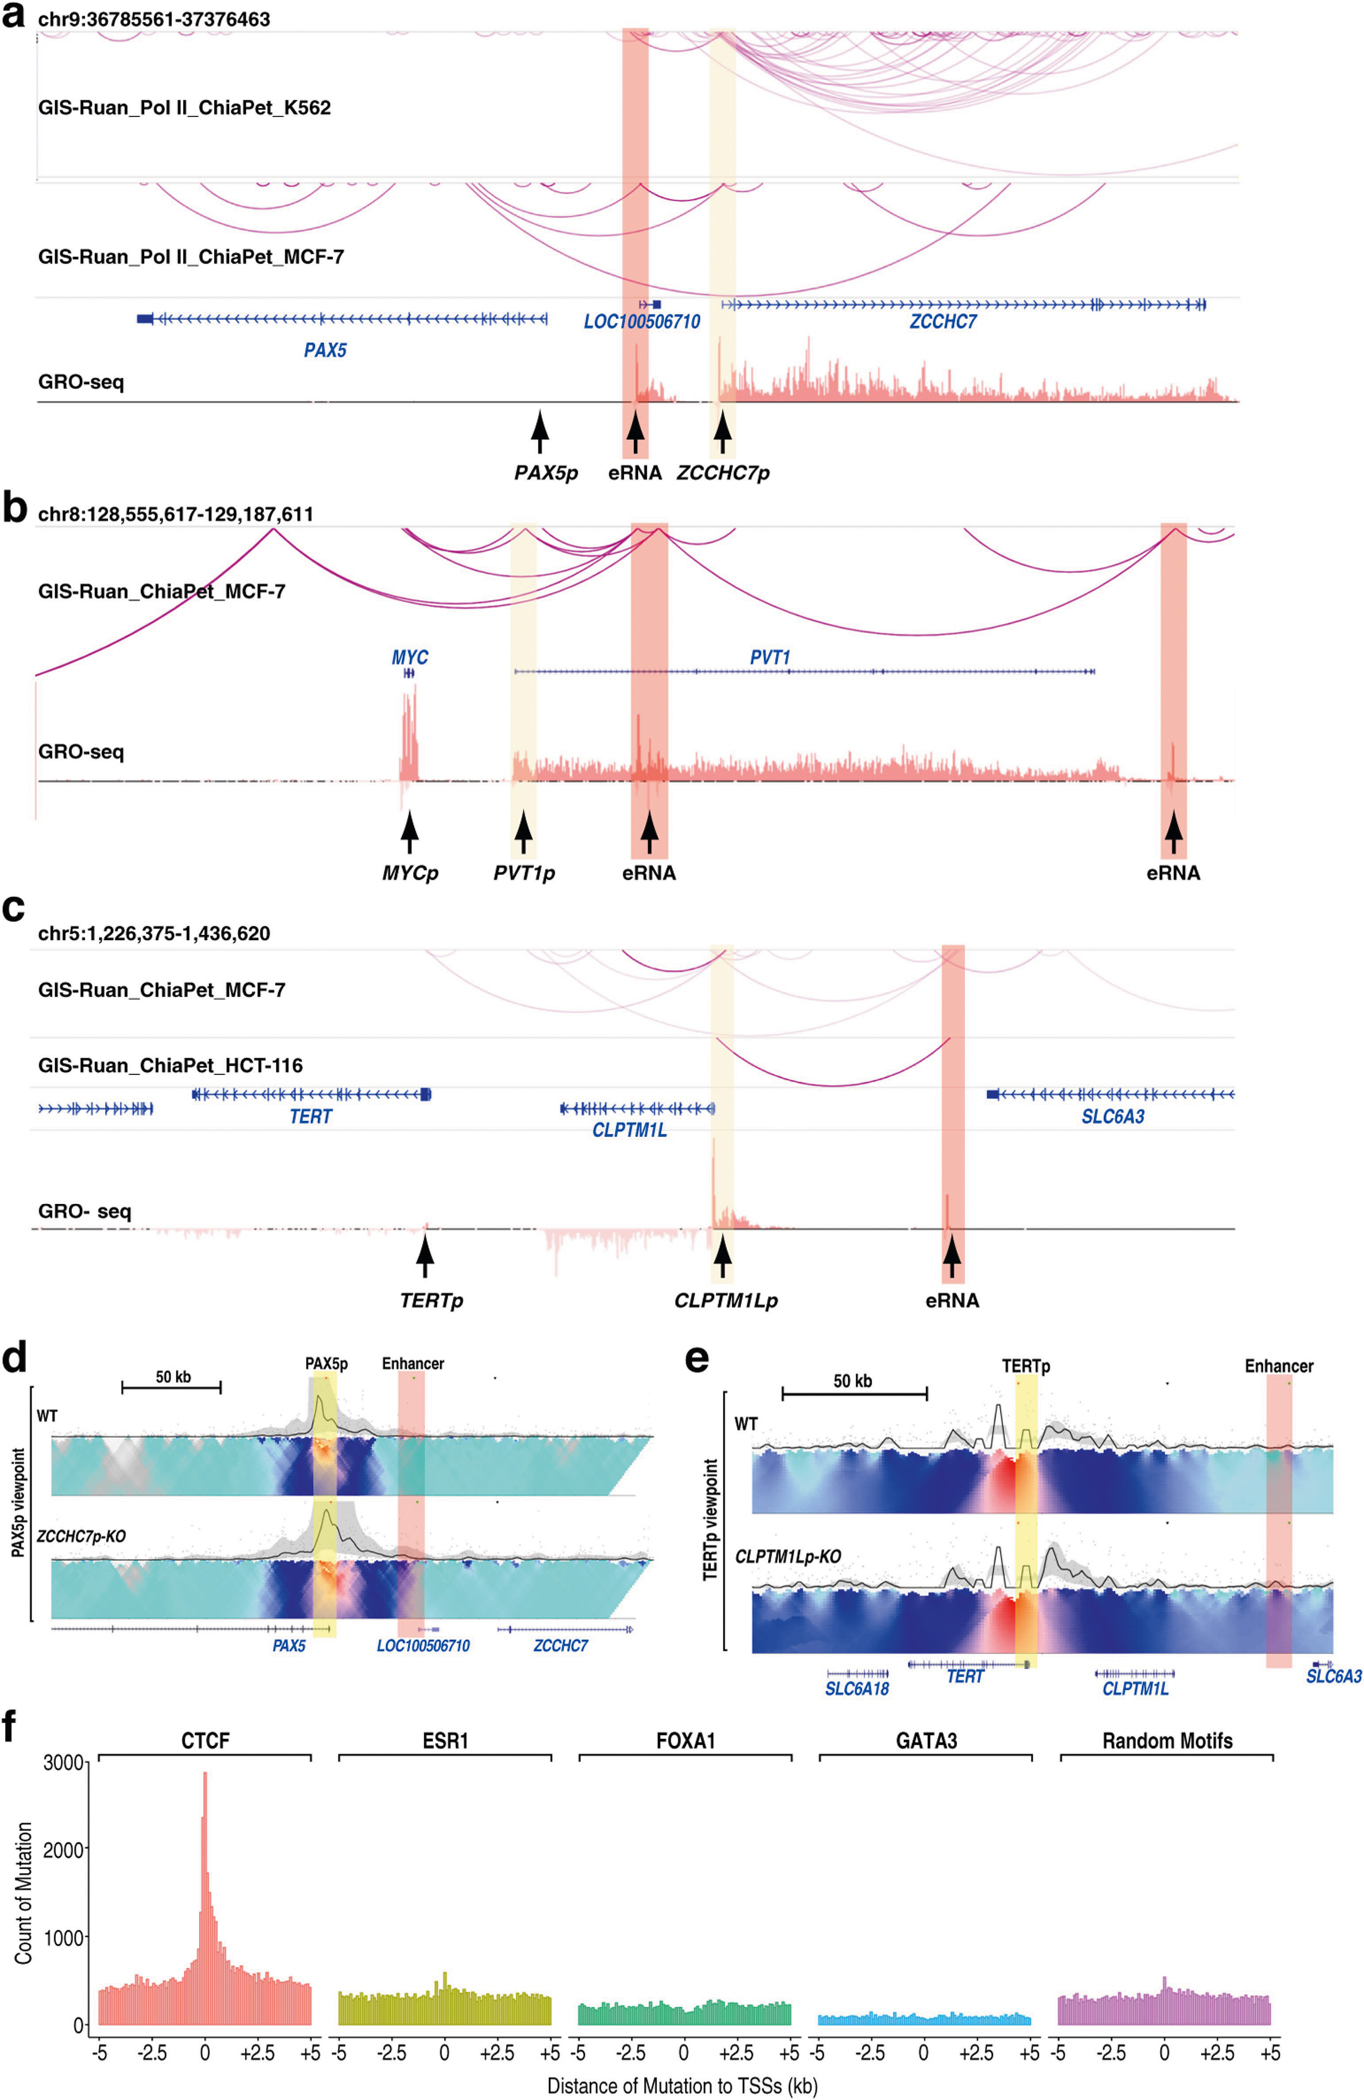
a–c, UCSC and WashU genome browser screenshots of ChIA-PET and GRO-seq results at the PAX5–ZCCHC7 locus (a), MYC–PVT1 locus (b) and TERT–CLPTM1L locus (c). The putative enhancers and promoters are highlighted in pink and in yellow, respectively. These cells show strong interactions between the eRNA (enhancer) and the original promoters (that is, ZCCHC7p in a, PVT1p in b and CLPTM1Lp in c). d, 4C-seq contact matrix and heat map plots showing the chromatin contacts with the PAX5 promoter as viewpoint, and its change in 293T cells with ZCCHC7 promoter knockout. The viewpoint PAX5 promoter is highlighted in yellow, and the neighbouring enhancer in pink. e, 4C-seq contact matrix and heat map plots showing the chromatin contacts with the TERT promoter as viewpoint, and its change in 293T cells with CLPTM1L promoter knockout. The viewpoint TERT promoter is highlighted in yellow, and the neighbouring enhancer in pink. f, The numbers of ICGC cancer mutations that reside in the motifs of CTCF, ERα, FOXA1 and GATA3, and random genomic regions near gene TSSs.
Extended Data Fig. 11 |. GTEx data analysis identifies potential ERR gene pairs acting in human populations.
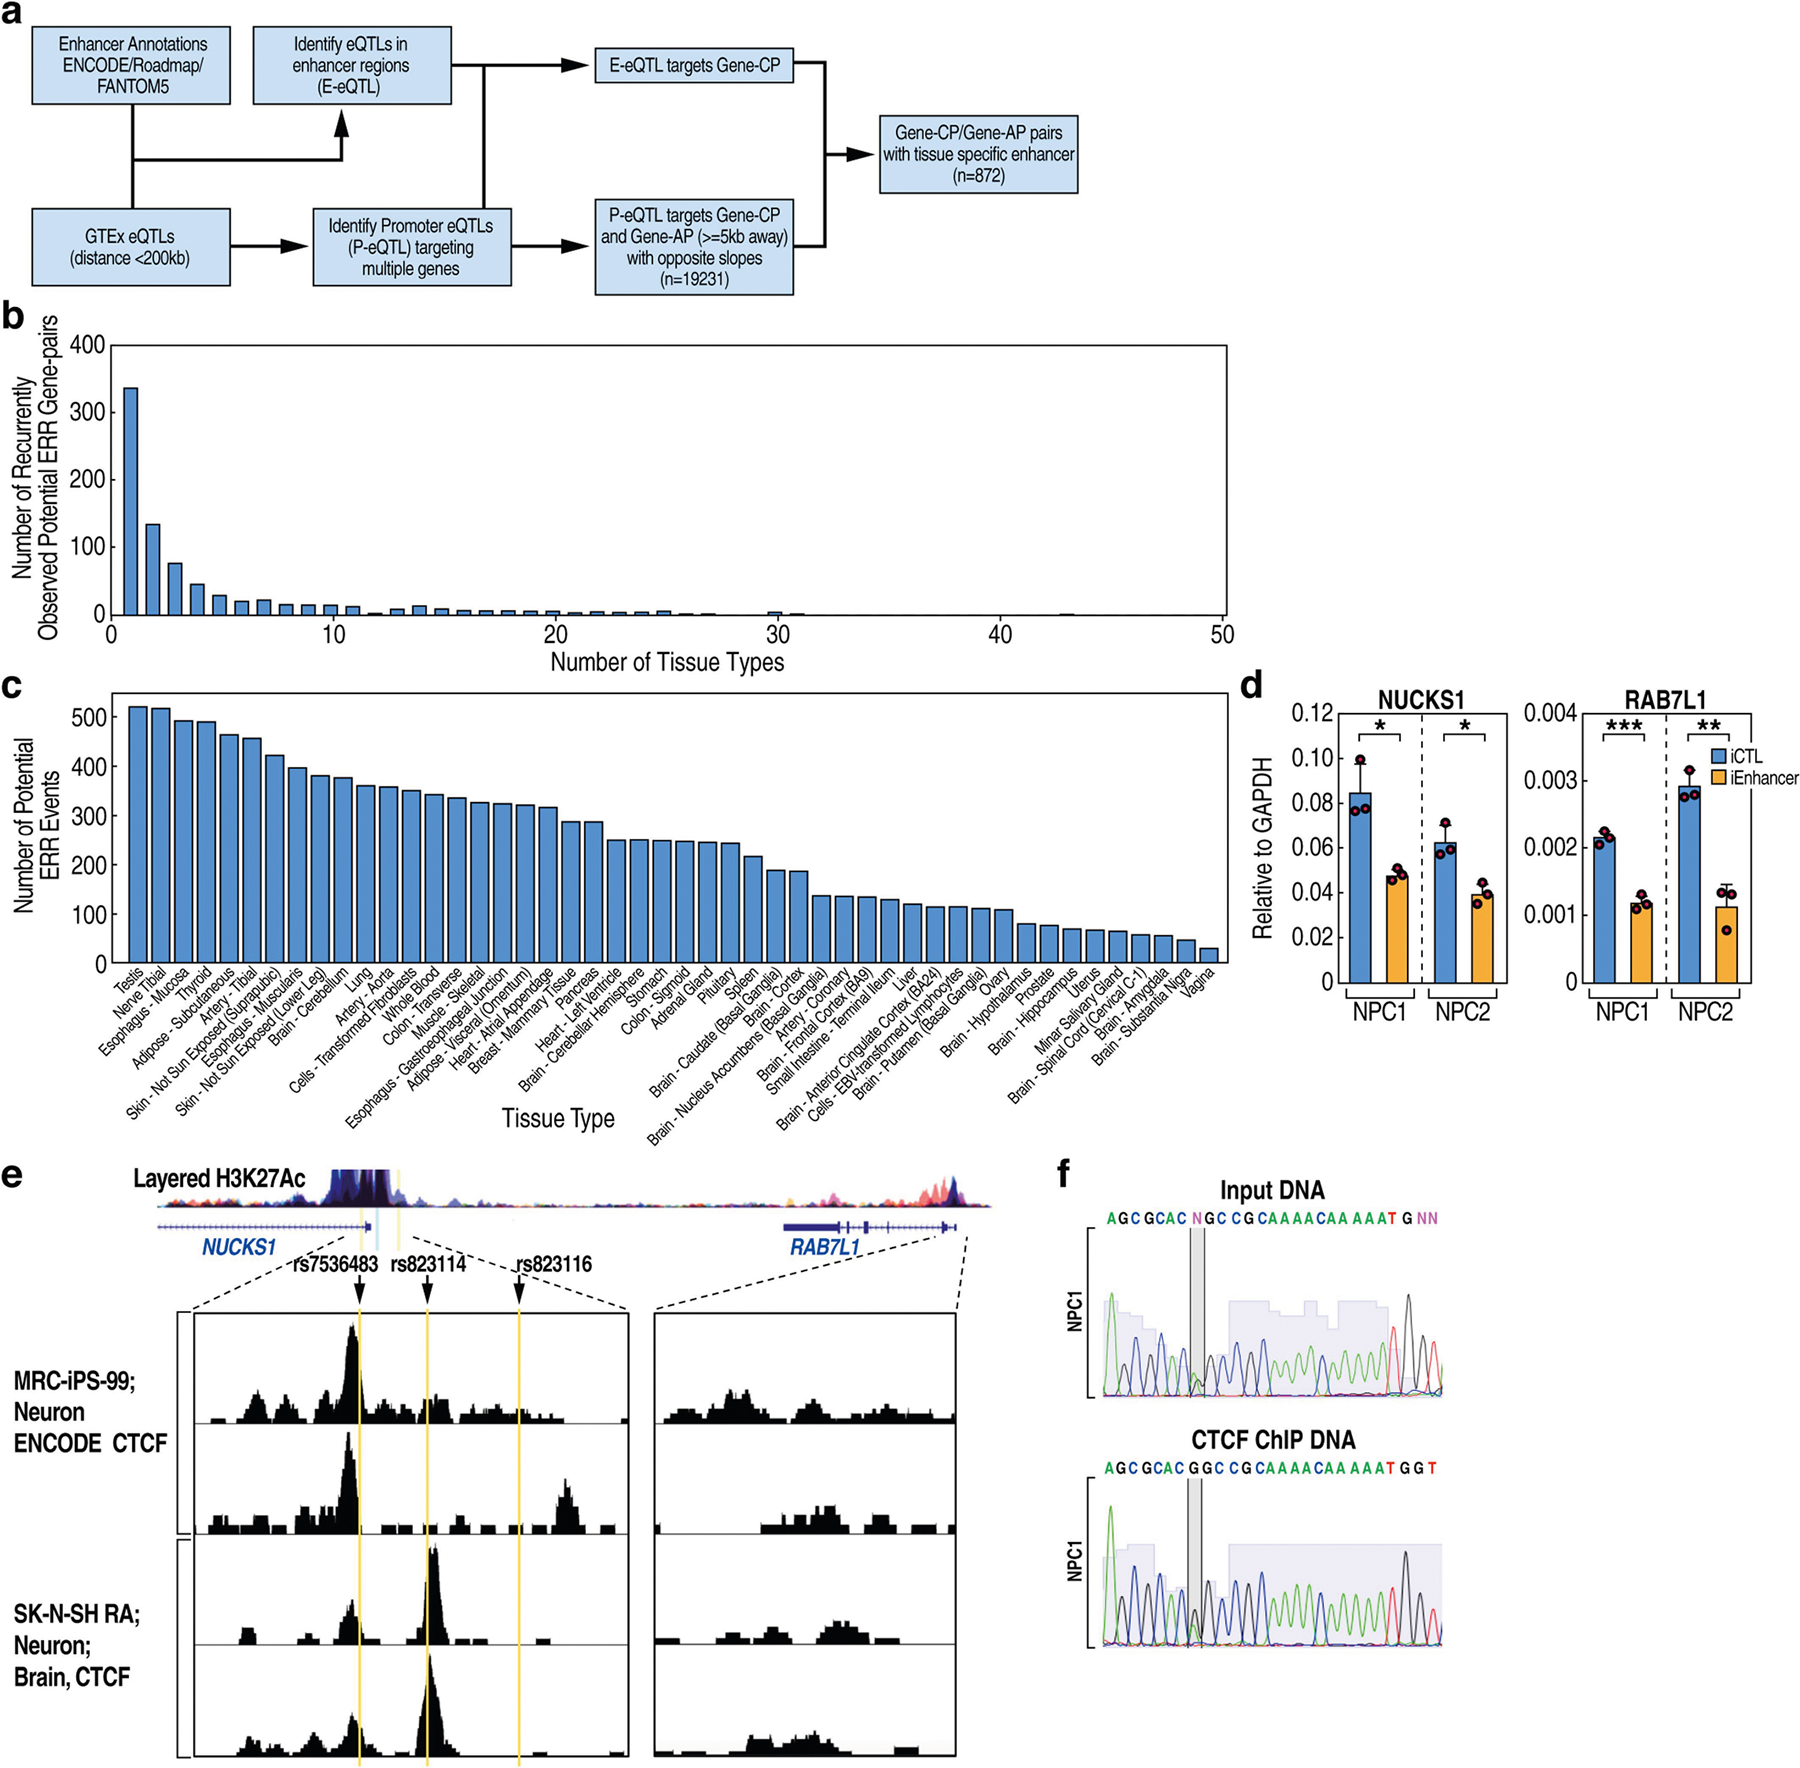
a, Schematic overview of GTEx data-processing workflow to identify potential ERR events. Also see Supplementary Figs. 8–10 and associated notes. b, Histogram showing the number of potential ERR gene pairs that appear in one tissue or more than one. c, Histogram showing the number of potential ERR events distributed in each tissue. d, qRT–PCR results of CRISPRi showing the expression of NUCKS1 and RAB7L1 mRNAs with sgRNA-control (iCTL) or sgRNA specific for the putative enhancer (iEnhancer) in two clones of NPCs expressing dCas9-KRAB (see enhancer location in Fig. 4c, d) (n = 3 data points of technical replicates; representative of two independent experiments). e, Published CTCF ChIP–seq screen shots in human-iPS-cell-derived neurons or neuronal cell lines (SK-N-SH) in the NUCKS1 and RAB7L1 promoters. The ChIP–seq data tracks were generated by the Cistrome data browser (http://cistrome.org/). The location of the three SNPs is shown. f, Sanger sequencing results of the NUCKS1 promoter DNA, showing the allele bias of CTCF binding (comparison between the input DNA and ChIP DNA). Data are mean ± s.d.; *P < 0.05; **P < 0.01, ***P < 0.001, two-tailed Student’s t-test.
Supplementary Material
Acknowledgements
This work is supported by the Howard Hughes Medical Institute and NIH grants (DK018477, DK039949, HL150521 and NS093066) to M.G.R.; by NIH grants (K22CA204468, R21GM132778, R01GM136922 and ‘4D nucleome’ U01HL156059), a University of Texas Rising STARs Award, the Welch Foundation (AU-2000–20190330), the Gulf Coast Consortium John S. Dunn Foundation and a Cancer Prevention and Research Institute of Texas (CPRIT) Award (RR160083) to W.L.; by NIH grants (HG008118, HL107442, DK105541, DK112155 and NSF-CMMI division award 1728497) to K.A.F.; and by NIH NHGRI grants (R01HG008153 and R01HG008153-S1) to Z.D.Z. W.L. is a CPRIT Scholar in Cancer Research. M.G.R. is an investigator with the Howard Hughes Medical Institute. We thank J. Hightower for assistance with figure preparation, and we acknowledge the Texas Advanced Computing Center (TACC) at The University of Texas at Austin (http://www.tacc.utexas.edu) for providing high-performance computing resources for part of this work.
Footnotes
Competing interests The authors declare no competing interests.
Supplementary information The online version contains supplementary material available at https://doi.org/10.1038/s41586-021-03577-1.
Peer review information Nature thanks Peter Scacheri and the other, anonymous, reviewer(s) for their contribution to the peer review of this work.
Reprints and permissions information is available at http://www.nature.com/reprints.
Reporting summary
Further information on research design is available in the Nature Research Reporting Summary linked to this paper.
Data availability
The datasets generated by the current study are available in the GEO (GSE115604) and the Sequence Read Archive (PRJNA412021). For analyses of cancer mutations and GTEx data, codes are deposited in GitHub (https://github.com/wblilab-uth/ERR-project and https://github.com/zdz-lab/ERR). Other analyses of ChIP–seq peaks, 4C-seq or gene expression in the current study used standard bioinformatics tools and codes, which are available upon request. Source data are provided with this paper.
References
- 1.Schoenfelder S & Fraser P Long-range enhancer–promoter contacts in gene expression control. Nat. Rev. Genet. 20, 437–455 (2019). [DOI] [PubMed] [Google Scholar]
- 2.Hsieh TS et al. Resolving the 3D landscape of transcription-linked mammalian chromatin folding. Mol. Cell 78, 539–553 (2020). [DOI] [PMC free article] [PubMed] [Google Scholar]
- 3.Gasperini M et al. A genome-wide framework for mapping gene regulation via cellular genetic screens. Cell 176, 377–390 (2019). [DOI] [PMC free article] [PubMed] [Google Scholar]
- 4.van Arensbergen J, van Steensel B & Bussemaker HJ In search of the determinants of enhancer-promoter interaction specificity. Trends Cell Biol. 24, 695–702 (2014). [DOI] [PMC free article] [PubMed] [Google Scholar]
- 5.Li W et al. Functional roles of enhancer RNAs for oestrogen-dependent transcriptional activation. Nature 498, 516–520 (2013). [DOI] [PMC free article] [PubMed] [Google Scholar]
- 6.Arner E et al. Transcribed enhancers lead waves of coordinated transcription in transitioning mammalian cells. Science 347, 1010–1014 (2015). [DOI] [PMC free article] [PubMed] [Google Scholar]
- 7.The ENCODE Project Consortium. An integrated encyclopedia of DNA elements in the human genome. Nature 489, 57–74 (2012). [DOI] [PMC free article] [PubMed] [Google Scholar]
- 8.Rao SS et al. A 3D map of the human genome at kilobase resolution reveals principles of chromatin looping. Cell 159, 1665–1680 (2014). [DOI] [PMC free article] [PubMed] [Google Scholar]
- 9.Nora EP et al. Targeted degradation of CTCF decouples local insulation of chromosome domains from genomic compartmentalization. Cell 169, 930–944 (2017). [DOI] [PMC free article] [PubMed] [Google Scholar]
- 10.Hnisz D et al. Super-enhancers in the control of cell identity and disease. Cell 155, 934–947 (2013). [DOI] [PMC free article] [PubMed] [Google Scholar]
- 11.Li Y et al. The structural basis for cohesin-CTCF-anchored loops. Nature 578, 472–476 (2020). [DOI] [PMC free article] [PubMed] [Google Scholar]
- 12.Lucas JS, Zhang Y, Dudko OK & Murre C 3D trajectories adopted by coding and regulatory DNA elements: first-passage times for genomic interactions. Cell 158, 339–352 (2014). [DOI] [PMC free article] [PubMed] [Google Scholar]
- 13.Guo Y et al. CRISPR inversion of CTCF sites alters genome topology and enhancer/promoter function. Cell 162, 900–910 (2015). [DOI] [PMC free article] [PubMed] [Google Scholar]
- 14.Jin EH et al. Association between promoter polymorphisms of TFF1, TFF2, and TFF3 and the risk of gastric and diffuse gastric cancers in a Korean population. J. Korean Med. Sci. 30, 1035–1041 (2015). [DOI] [PMC free article] [PubMed] [Google Scholar]
- 15.Weinhold N, Jacobsen A, Schultz N, Sander C & Lee W Genome-wide analysis of noncoding regulatory mutations in cancer. Nat. Genet. 46, 1160–1165 (2014). [DOI] [PMC free article] [PubMed] [Google Scholar]
- 16.Rheinbay E et al. Analyses of non-coding somatic drivers in 2,658 cancer whole genomes. Nature 578, 102–111 (2020). [DOI] [PMC free article] [PubMed] [Google Scholar]
- 17.Cho SW et al. Promoter of lncRNA gene PVT1 is a tumor-suppressor DNA boundary element. Cell 173, 1398–1412 (2018). [DOI] [PMC free article] [PubMed] [Google Scholar]
- 18.Zhang W et al. A global transcriptional network connecting noncoding mutations to changes in tumor gene expression. Nat. Genet. 50, 613–620 (2018). [DOI] [PMC free article] [PubMed] [Google Scholar]
- 19.Tate JG et al. COSMIC: the Catalogue Of Somatic Mutations In Cancer. Nucleic Acids Res. 47, D941–D947 (2019). [DOI] [PMC free article] [PubMed] [Google Scholar]
- 20.Satake W et al. Genome-wide association study identifies common variants at four loci as genetic risk factors for Parkinson’s disease. Nat. Genet. 41, 1303–1307 (2009). [DOI] [PubMed] [Google Scholar]
- 21.Liu Z et al. LRRK2 phosphorylates membrane-bound Rabs and is activated by GTP-bound Rab7L1 to promote recruitment to the trans-Golgi network. Hum. Mol. Genet. 27, 385–395 (2018). [DOI] [PMC free article] [PubMed] [Google Scholar]
- 22.Blackwood EM & Kadonaga JT Going the distance: a current view of enhancer action. Science 281, 60–63 (1998). [DOI] [PubMed] [Google Scholar]
- 23.Rao SSP et al. Cohesin loss eliminates all loop domains. Cell 171, 305–320 (2017). [DOI] [PMC free article] [PubMed] [Google Scholar]
- 24.Schwarzer W et al. Two independent modes of chromatin organization revealed by cohesin removal. Nature 551, 51–56 (2017). [DOI] [PMC free article] [PubMed] [Google Scholar]
- 25.Li W et al. Condensin I and II complexes license full estrogen receptor α-dependent enhancer activation. Mol. Cell 59, 188–202 (2015). [DOI] [PMC free article] [PubMed] [Google Scholar]
- 26.Heinz S et al. Simple combinations of lineage-determining transcription factors prime cis-regulatory elements required for macrophage and B cell identities. Mol. Cell 38, 576–589 (2010). [DOI] [PMC free article] [PubMed] [Google Scholar]
- 27.Stadhouders R et al. Multiplexed chromosome conformation capture sequencing for rapid genome-scale high-resolution detection of long-range chromatin interactions. Nat. Protocols 8, 509–524 (2013). [DOI] [PubMed] [Google Scholar]
- 28.van de Werken HJ et al. Robust 4C-seq data analysis to screen for regulatory DNA interactions. Nat. Methods 9, 969–972 (2012). [DOI] [PubMed] [Google Scholar]
- 29.Krijger PHL, Geeven G, Bianchi V, Hilvering CRE & de Laat W 4C-seq from beginning to end: a detailed protocol for sample preparation and data analysis. Methods 170, 17–32 (2020). [DOI] [PubMed] [Google Scholar]
- 30.Ingolia NT, Ghaemmaghami S, Newman JR & Weissman JS Genome-wide analysis in vivo of translation with nucleotide resolution using ribosome profiling. Science 324, 218–223 (2009). [DOI] [PMC free article] [PubMed] [Google Scholar]
- 31.Hayward NK et al. Whole-genome landscapes of major melanoma subtypes. Nature 545, 175–180 (2017). [DOI] [PubMed] [Google Scholar]
- 32.Schuijers J et al. Transcriptional dysregulation of MYC reveals common enhancer-docking mechanism. Cell Rep. 23, 349–360 (2018). [DOI] [PMC free article] [PubMed] [Google Scholar]
- 33.Tanenbaum ME, Gilbert LA, Qi LS, Weissman JS & Vale RD A protein-tagging system for signal amplification in gene expression and fluorescence imaging. Cell 159, 635–646 (2014). [DOI] [PMC free article] [PubMed] [Google Scholar]
- 34.MacLeod DA et al. RAB7L1 interacts with LRRK2 to modify intraneuronal protein sorting and Parkinson’s disease risk. Neuron 77, 425–439 (2013). [DOI] [PMC free article] [PubMed] [Google Scholar]
- 35.Latourelle JC et al. Large-scale identification of clinical and genetic predictors of motor progression in patients with newly diagnosed Parkinson’s disease: a longitudinal cohort study and validation. Lancet Neurol. 16, 908–916 (2017). [DOI] [PMC free article] [PubMed] [Google Scholar]
- 36.Pierce SE, Tyson T, Booms A, Prahl J & Coetzee GA Parkinson’s disease genetic risk in a midbrain neuronal cell line. Neurobiol. Dis. 114, 53–64 (2018). [DOI] [PubMed] [Google Scholar]
- 37.DeBoever C et al. Large-scale profiling reveals the influence of genetic variation on gene expression in human induced pluripotent stem cells. Cell Stem Cell 20, 533–546 (2017). [DOI] [PMC free article] [PubMed] [Google Scholar]
- 38.Panopoulos AD et al. The metabolome of induced pluripotent stem cells reveals metabolic changes occurring in somatic cell reprogramming. Cell Res. 22, 168–177 (2012). [DOI] [PMC free article] [PubMed] [Google Scholar]
- 39.Panopoulos AD et al. iPSCORE: a resource of 222 iPSC lines enabling functional characterization of genetic variation across a variety of cell types. Stem Cell Rep. 8, 1086–1100 (2017). [DOI] [PMC free article] [PubMed] [Google Scholar]
- 40.Dobin A et al. STAR: ultrafast universal RNA-seq aligner. Bioinformatics 29, 15–21 (2013). [DOI] [PMC free article] [PubMed] [Google Scholar]
- 41.Tarasov A, Vilella AJ, Cuppen E, Nijman IJ & Prins P Sambamba: fast processing of NGS alignment formats. Bioinformatics 31, 2032–2034 (2015). [DOI] [PMC free article] [PubMed] [Google Scholar]
- 42.van de Geijn B, McVicker G, Gilad Y & Pritchard JK WASP: allele-specific software for robust molecular quantitative trait locus discovery. Nat. Methods 12, 1061–1063 (2015). [DOI] [PMC free article] [PubMed] [Google Scholar]
- 43.Van der Auwera GA et al. From FastQ data to high confidence variant calls: the Genome Analysis Toolkit best practices pipeline. Curr. Protoc. Bioinformatics 43, 11.10.1–11.10.33 (2013). [DOI] [PMC free article] [PubMed] [Google Scholar]
- 44.Mayba O et al. MBASED: allele-specific expression detection in cancer tissues and cell lines. Genome Biol. 15, 405 (2014). [DOI] [PMC free article] [PubMed] [Google Scholar]
- 45.Grant CE, Bailey TL & Noble WS FIMO: scanning for occurrences of a given motif. Bioinformatics 27, 1017–1018 (2011). [DOI] [PMC free article] [PubMed] [Google Scholar]
- 46.Quinlan AR & Hall IM BEDTools: a flexible suite of utilities for comparing genomic features. Bioinformatics 26, 841–842 (2010). [DOI] [PMC free article] [PubMed] [Google Scholar]
- 47.Battle A, Brown CD, Engelhardt BE & Montgomery SB Genetic effects on gene expression across human tissues. Nature 550, 204–213 (2017). [DOI] [PMC free article] [PubMed] [Google Scholar]
- 48.MacArthur J et al. The new NHGRI-EBI Catalog of published genome-wide association studies (GWAS Catalog). Nucleic Acids Res. 45, D896–D901 (2017). [DOI] [PMC free article] [PubMed] [Google Scholar]
- 49.Li MJ et al. GWASdb v2: an update database for human genetic variants identified by genome-wide association studies. Nucleic Acids Res. 44, D869–D876 (2016). [DOI] [PMC free article] [PubMed] [Google Scholar]
- 50.Nair SJ et al. Phase separation of ligand-activated enhancers licenses cooperative chromosomal enhancer assembly. Nat. Struct. Mol. Biol. 26, 193–203 (2019). [DOI] [PMC free article] [PubMed] [Google Scholar]
- 51.Krietenstein N et al. Ultrastructural details of mammalian chromosome architecture. Mol. Cell 78, 554–565 (2020). [DOI] [PMC free article] [PubMed] [Google Scholar]
- 52.Fudenberg G et al. Formation of chromosomal domains by loop extrusion. Cell Rep. 15, 2038–2049 (2016). [DOI] [PMC free article] [PubMed] [Google Scholar]
- 53.Hatzis P & Talianidis I Dynamics of enhancer–promoter communication during differentiation-induced gene activation. Mol. Cell 10, 1467–1477 (2002). [DOI] [PubMed] [Google Scholar]
Associated Data
This section collects any data citations, data availability statements, or supplementary materials included in this article.
Supplementary Materials
Data Availability Statement
The datasets generated by the current study are available in the GEO (GSE115604) and the Sequence Read Archive (PRJNA412021). For analyses of cancer mutations and GTEx data, codes are deposited in GitHub (https://github.com/wblilab-uth/ERR-project and https://github.com/zdz-lab/ERR). Other analyses of ChIP–seq peaks, 4C-seq or gene expression in the current study used standard bioinformatics tools and codes, which are available upon request. Source data are provided with this paper.