

Abstract
Background:
Pathologic complete response after neoadjuvant therapy is an important prognostic indicator for locally advanced rectal cancer and may give insights into which patients might be treated non-operatively in the future. Existing models for predicting pathologic complete response in the pre-treatment setting are limited by small datasets and low accuracy.
Objective:
We sought to use machine learning to develop a more generalizable predictive model for pathologic complete response for locally advanced rectal cancer.
Design:
Patients with locally advanced rectal cancer who underwent neoadjuvant therapy followed by surgical resection were identified in the National Cancer Database from years 2010–2019 and were split into training, validation, and test sets. Machine learning techniques included random forest, gradient boosting, and artificial neural network. A logistic regression model was also created. Model performance was assessed using area under the receiver operating characteristic curve.
Settings:
This study used a national, multi-center dataset.
Patients:
Patients with locally advanced rectal cancer who underwent neoadjuvant therapy and proctectomy.
Main Outcome Measures:
Pathologic complete response defined as T0/xN0/x.
Results:
The dataset included 53,684 patients. 22.9% of patients experienced pathologic complete response. Gradient boosting showed the best performance with area under the receiver operating characteristic curve of 0.777 (95% CI 0.773 – 0.781), compared with 0.684 (95% CI 0.68 – 0.688) for logistic regression. The strongest predictors of pathologic complete response were no lymphovascular invasion, no perineural invasion, lower CEA, smaller size of tumor, and microsatellite stability. A concise model including the top 5 variables showed preserved performance.
Limitations:
The models were not externally validated.
Conclusions:
Machine learning techniques can be used to accurately predict pathologic complete response for locally advanced rectal cancer in the pre-treatment setting. After fine-tuning on a dataset including patients treated non-operatively, these models could help clinicians identify the appropriate candidates for a watch and wait strategy.
Keywords: rectal cancer, pathological complete response, artificial intelligence, machine learning
Introduction
Pathologic complete response (pCR) after neoadjuvant therapy is an important prognostic indicator for locally advanced rectal cancer, with long-term implications for local recurrence and overall survival.1–3 In addition, with the emergence of watch and wait management for patients with complete clinical response (cCR), factors associated with pCR in historical cohorts may give insight into which patients are best treated non-operatively in the future.4–7 While cCR does not perfectly correlate with pCR, cCR is currently established using post-treatment exam, endoscopy, and imaging.8–10 Predicting pCR in the pre-treatment setting would be useful in terms of providing an accurate prognosis and supporting patient counseling.11 Existing models for this outcome are based on relatively small datasets or have low accuracy.12–14
Machine learning is an emerging predictive analytic approach that has the potential to outperform traditional modeling techniques in predicting clinical outcomes. Compared with linear models like logistic regression, machine learning has increased modeling capacity and can incorporate non-linear relationships between multiple variables.15–18 Machine learning has been successfully applied to prediction of pCR from post-treatment clinical and radiologic features, but it has not yet been applied to pre-treatment factors in a large, multi-institution database.12,19–23
We sought to use the National Cancer Database (NCDB) to develop and validate machine learning-based models to predict pCR for rectal cancer after neoadjuvant therapy. We hypothesized that models based on pre-treatment factors alone could accurately predict pCR, with the ultimate goal of creating a prognostic tool that could be used at the time of diagnosis.
Methods
Data
We used data from the NCDB, a tumor registry that is jointly managed by the American Cancer Society and the American College of Surgeons, which includes about 70% of new cancer diagnoses in the US from over 1500 institutions accredited by the Commission-on-Cancer.24 Use of this database was determined to be exempt from review by the University of North Carolina Institutional Review Board (#22–2464). The database was initially queried for all available years (2004 – 2019). However, similar to previous studies, exploratory analysis showed an unreasonably high rate of pathologic complete response due to TXNX designation in earlier years.25 Due to this finding, we limited the analysis to years 2010 – 2019.
We used previously described methods by Hasan et al. and Al-Sukhni et al. to include only patients with locally advanced (Stage II and III) rectal cancer who underwent neoadjuvant chemoradiation followed by total mesorectal excision.25,26 A flowsheet detailing this process is available in Figure 1. We used previously described methods by Al-Sukhni et al. to define the primary outcome, pCR, as “absence of tumor in the final pathologic specimen (ypT0/x, N0/x).”25 Of note, we did not exclude patients based on treatment characteristics, including incomplete treatment, in order to more accurately model real-world outcomes, which often include imperfect therapy.
Figure 1.

Flowsheet describing inclusion/exclusion criteria
Our initial analyses included all variables that would be potentially available at the time of pre-treatment decision-making. These included demographic factors (age, race/ethnicity, sex), socioeconomic factors (income, education level), oncologic factors (tumor stage, CEA, lymphovascular invasion, perineural invasion), and facility factors (region, volume) with 39 variables included in total. A full list of included variables is available in Table 1. We included lymphovascular invasion and perineural invasion, which are available from the pretreatment biopsy, but may also be collected from the surgical pathology. Unfortunately, it is not possible in the NCDB to determine the source of these variables. Given these concerns, we developed models including and excluding these variables.
Table 1.
| Variable | Missing | Incomplete Response | Complete Response | P-Value | |
|---|---|---|---|---|---|
| n | 41382 | 12302 | |||
| Facility Type, n (%) | Academic/Research Program | 2687 | 13888 (35.4) | 4164 (35.5) | 0.674 |
| Community Cancer Program | 2319 (5.9) | 726 (6.2) | |||
| Comprehensive Community Cancer Program | 14723 (37.5) | 4391 (37.4) | |||
| Integrated Network Cancer Program | 8328 (21.2) | 2458 (20.9) | |||
| Facility Location, n (%) | Midwest | 2687 | 14397 (36.7) | 4042 (34.4) | <0.001 |
| Northeast | 7370 (18.8) | 2244 (19.1) | |||
| South | 10988 (28.0) | 3228 (27.5) | |||
| West | 6503 (16.6) | 2225 (19.0) | |||
| Age at Diagnosis, mean (SD) | 0 | 59.5 (12.1) | 59.9 (11.9) | 0.005 | |
| Sex, n (%) | Female | 0 | 15517 (37.5) | 4784 (38.9) | 0.005 |
| Male | 25865 (62.5) | 7518 (61.1) | |||
| Race, n (%) | Asian | 338 | 1544 (3.8) | 465 (3.8) | 0.001 |
| Black | 3399 (8.3) | 870 (7.1) | |||
| Other | 887 (2.2) | 282 (2.3) | |||
| White | 35284 (85.8) | 10615 (86.8) | |||
| Spanish Hispanic Origin, n (%) | Hispanic | 1138 | 2911 (7.2) | 862 (7.2) | 0.906 |
| Non-Hispanic | 37582 (92.8) | 11191 (92.8) | |||
| Primary Payor, n (%) | Medicaid | 603 | 3758 (9.2) | 930 (7.7) | <0.001 |
| Medicare/Public | 14548 (35.5) | 4410 (36.3) | |||
| Not Insured | 1778 (4.3) | 415 (3.4) | |||
| Private Insurance or Managed Care | 20849 (50.9) | 6393 (52.6) | |||
| Urban/Rural, n (%) | Rural | 1772 | 2261 (5.7) | 585 (4.9) | 0.004 |
| Suburban | 5274 (13.2) | 1533 (12.9) | |||
| Urban | 32464 (81.2) | 9795 (82.2) | |||
| Great Circle Distance, mean (SD) | 6890 | 32.9 (101.9) | 32.9 (113.2) | 0.972 | |
| Percent No High School Degree, n (%) | 10.9 – 17.5% | 6912 | 9591 (26.6) | 2749 (25.5) | 0.004 |
| 6.3 – 10.8% | 10144 (28.2) | 3079 (28.6) | |||
| < 6.3% | 8642 (24.0) | 2742 (25.4) | |||
| >=17.6% | 7617 (21.2) | 2208 (20.5) | |||
| Median Income, n (%) | $40,227 – $50,353 | 6933 | 8317 (23.1) | 2431 (22.6) | <0.001 |
| $50,354 – $63,332 | 8639 (24.0) | 2531 (23.5) | |||
| < $40,227 | 6608 (18.4) | 1831 (17.0) | |||
| >=$63,333 | 12413 (34.5) | 3981 (37.0) | |||
| Medicaid Expansion Status State Group, n (%) | Early Expansion (before 1/2014) | 0 | 18601 (44.9) | 5828 (47.4) | <0.001 |
| Late Expansion States (after 1/2014) | 5792 (14.0) | 1700 (13.8) | |||
| Non-Expansion State | 14865 (35.9) | 4211 (34.2) | |||
| Suppressed for Ages 0–39 | 2124 (5.1) | 563 (4.6) | |||
| Charlson-Deyo Score, n (%) | Score of 0 | 0 | 32349 (78.2) | 9766 (79.4) | 0.013 |
| Score of 1 | 6671 (16.1) | 1857 (15.1) | |||
| Score of 2 or more | 2362 (5.7) | 679 (5.5) | |||
| Grade, n (%) | Grade I | 10050 | 2954 (8.6) | 873 (9.4) | <0.001 |
| Grade II | 27371 (79.7) | 7489 (80.6) | |||
| Grade III-IV | 4012 (11.7) | 935 (10.1) | |||
| Size of Tumor, mean (SD) | 27028 | 44.3 (29.3) | 45.3 (31.6) | 0.036 | |
| Lymphovascular Invasion, n (%) | 13965 | 6214 (18.8) | 308 (4.6) | <0.001 | |
| CEA Category, n (%) | Borderline | 14319 | 162 (0.5) | 49 (0.6) | <0.001 |
| Elevated | 14539 (47.6) | 3005 (34.2) | |||
| Normal | 15867 (51.9) | 5743 (65.3) | |||
| CEA value, mean (SD) | 15045 | 66.5 (198.0) | 47.8 (148.2) | <0.001 | |
| Microsatellite Instability, n (%) | MS unstable | 35803 | 1004 (6.6) | 157 (5.7) | 0.064 |
| MS stable | 14112 (93.4) | 2608 (94.3) | |||
| Perineural Invasion, n (%) | 8275 | 5626 (15.3) | 179 (2.1) | <0.001 | |
| KRAS, n (%) | Mutated | 49713 | 1347 (39.1) | 174 (32.9) | 0.007 |
| Not mutated | 2095 (60.9) | 355 (67.1) | |||
| Stage, n (%) | 2 | 0 | 19760 (47.8) | 6300 (51.2) | <0.001 |
| 3 | 21363 (51.6) | 5955 (48.4) | |||
| T Stage, n (%) | 0 | 0 | 506 (1.2) | 112 (0.9) | <0.001 |
| 1 | 282 (0.7) | 144 (1.2) | |||
| 2 | 2118 (5.1) | 886 (7.2) | |||
| 3 | 33677 (81.4) | 10275 (83.5) | |||
| 4 | 4799 (11.6) | 885 (7.2) | |||
| N Stage, n (%) | 0 | 0 | 15639 (37.8) | 5289 (43.0) | <0.001 |
| 1 | 19247 (46.5) | 5523 (44.9) | |||
| 2 | 6496 (15.7) | 1490 (12.1) | |||
| Facility Volume, Quartile, n (%) | 1 | 96 | 26790 (64.9) | 7749 (63.1) | 0.002 |
| 2 | 8743 (21.2) | 2753 (22.4) | |||
| 3 | 4154 (10.1) | 1252 (10.2) | |||
| 4 | 1622 (3.9) | 525 (4.3) | |||
| Mucinous Histology, n (%) | 0 | 2036 (4.9) | 234 (1.9) | <0.001 | |
| Villous Histology, n (%) | 0 | 1820 (4.4) | 575 (4.7) | 0.202 | |
| Signet Ring Histology, n (%) | 0 | 251 (0.6) | 65 (0.5) | 0.353 |
Modeling
Data was split into training, validation, and test sets. The training set was used for model development, the validation set was used to adjust model settings (hyperparameters) and ensure generalizability, and the test set was used calculate evaluation metrics. Data from 2016–2019 was reserved as the test set because the most recent data is likely most similar to current patients, in terms of timing of chemoradiation and increased use of total neoadjuvant therapy. In addition, the most recent years have fewer missing data. Data from 2010–2015 was split in an 80/20 ratio with 5-fold cross-validation for model training and validation. Variable pre-processing was performed in concordance with previous work, with special attention paid to the effect of missing values on model performance. Missing categorical variables were imputed with a unique “missing class”, while continuous variables were imputed as the median.27,28 For microsatellite instability (MSI), MSI high and MSI low were combined into an MS unstable group.
We compared the predictive ability of machine-learning based methods including random forest (RF), gradient boosting (XGB), and deep neural networks (NN) with traditional logistic regression (LR). RF and XGB are both decision-tree based methods, which use the average output of multiple trees, known as an ensemble, to generate more accurate predictions.15 NN, also known as deep learning, processes data through layers of non-linear functions, which are adjusted through iterations of training.29 All of the machine learning approaches applied are differentiated from LR in their ability to identify patterns in large datasets based on combinatory, non-linear associations. Model hyperparameters were tuned using Bayesian optimization.30
Model performance was assessed primarily using area under the receiver operating characteristic curve (AUROC), which is a metric that ranges from 0.5 (random classification) to 1 (perfect classification) and summarizes a model’s ability to distinguish positive from negative cases. Area under the precision-recall curve (AUPRC) was also used, which ranges from the rate of the positive class (i.e. rate of pCR) to 1 and describes a model’s ability to identify all positive cases, without false positives. Finally, we also calculated sensitivity, specificity, positive predictive value, and negative predictive value for the highest performing model across a range of thresholds. Shapley additive explanations were used to identify which variables had the strongest influence on model decision-making.31 Shapley additive explanations can improve model explainability and ensure model predictions are based on logical variables.
After the highest performing model was identified, we then sought to develop a more concise, user-friendly model using fewer variables but preserving most of the performance of the full model. We used recursive feature elimination, which tests models including different numbers and combinations of variables, to determine an optimal set of variables.32
All analyses were performed in Python (v3.8) with descriptive statistics from tableone (using the Chi-squared and T-tests),33 LR, RF, and XGB implemented using Scikit-learn,32,34 and NN implemented using Tensorflow/Keras.35 Code to reproduce this work is available at https://github.com/gomezlab/colorectal_predictors/tree/main/ncdb_apr.
Results
After inclusion and exclusion criteria were applied, 53,684 patients were included for analysis. Of these, 12,302 (22.9%) experienced pCR. The average age was 59.6 and 37.8% of patients were female. About half of cases were Stage II vs Stage III each (48.5% vs 51.5% respectively). Most cases had a T stage of III (81.9%) and an N stage of 0 or 1 (39.0% and 46.1% respectively). In terms of pathology characteristics, 16.4% of patients had lymphovascular invasion, 12.8% had perineural invasion, and 6.5% had microsatellite instability. For chemotherapy, 49.5% of patients underwent a single-agent regimen while 42.1% underwent a multi-agent regimen, with the remainder unknown. On univariate analysis, lymphovascular invasion, elevated CEA, perineural invasion, and mucinous histology showed a strong association with persistent disease following neoadjuvant chemoradiotherapy (Table 1).
Of the modeling techniques applied, XGB showed the highest performance with an AUROC of 0.777 (95% CI 0.773 – 0.781). LR performed significantly worse, with an AUROC of 0.684 (95% CI 0.68 – 0.688). RF and NN performed similarly to XGB, with scores of 0.768 (95% CI 0.764 – 0.771) and 0.775 (95% CI 0.772 – 0.779) respectively. Receiver operating characteristic curves for all models are shown in Figure 2. In terms of AUPRC, RF showed the highest performance with a score of 0.473 (95% CI 0.468 – 0.478). Again, LR performed significantly worse, with a score of 0.374 (95% CI 0.369 – 0.378). XGB and NN showed similar performance to RF, with scores of 0.471 (95% CI 0.466 – 0.475) and 0.470 (95% CI 0.465 – 0.474) respectively. Precision-recall curves for all models are shown in Figure 3.
Figure 2.

Receiver operating characteristic curves for models predicting pathologic complete response
Figure 3.
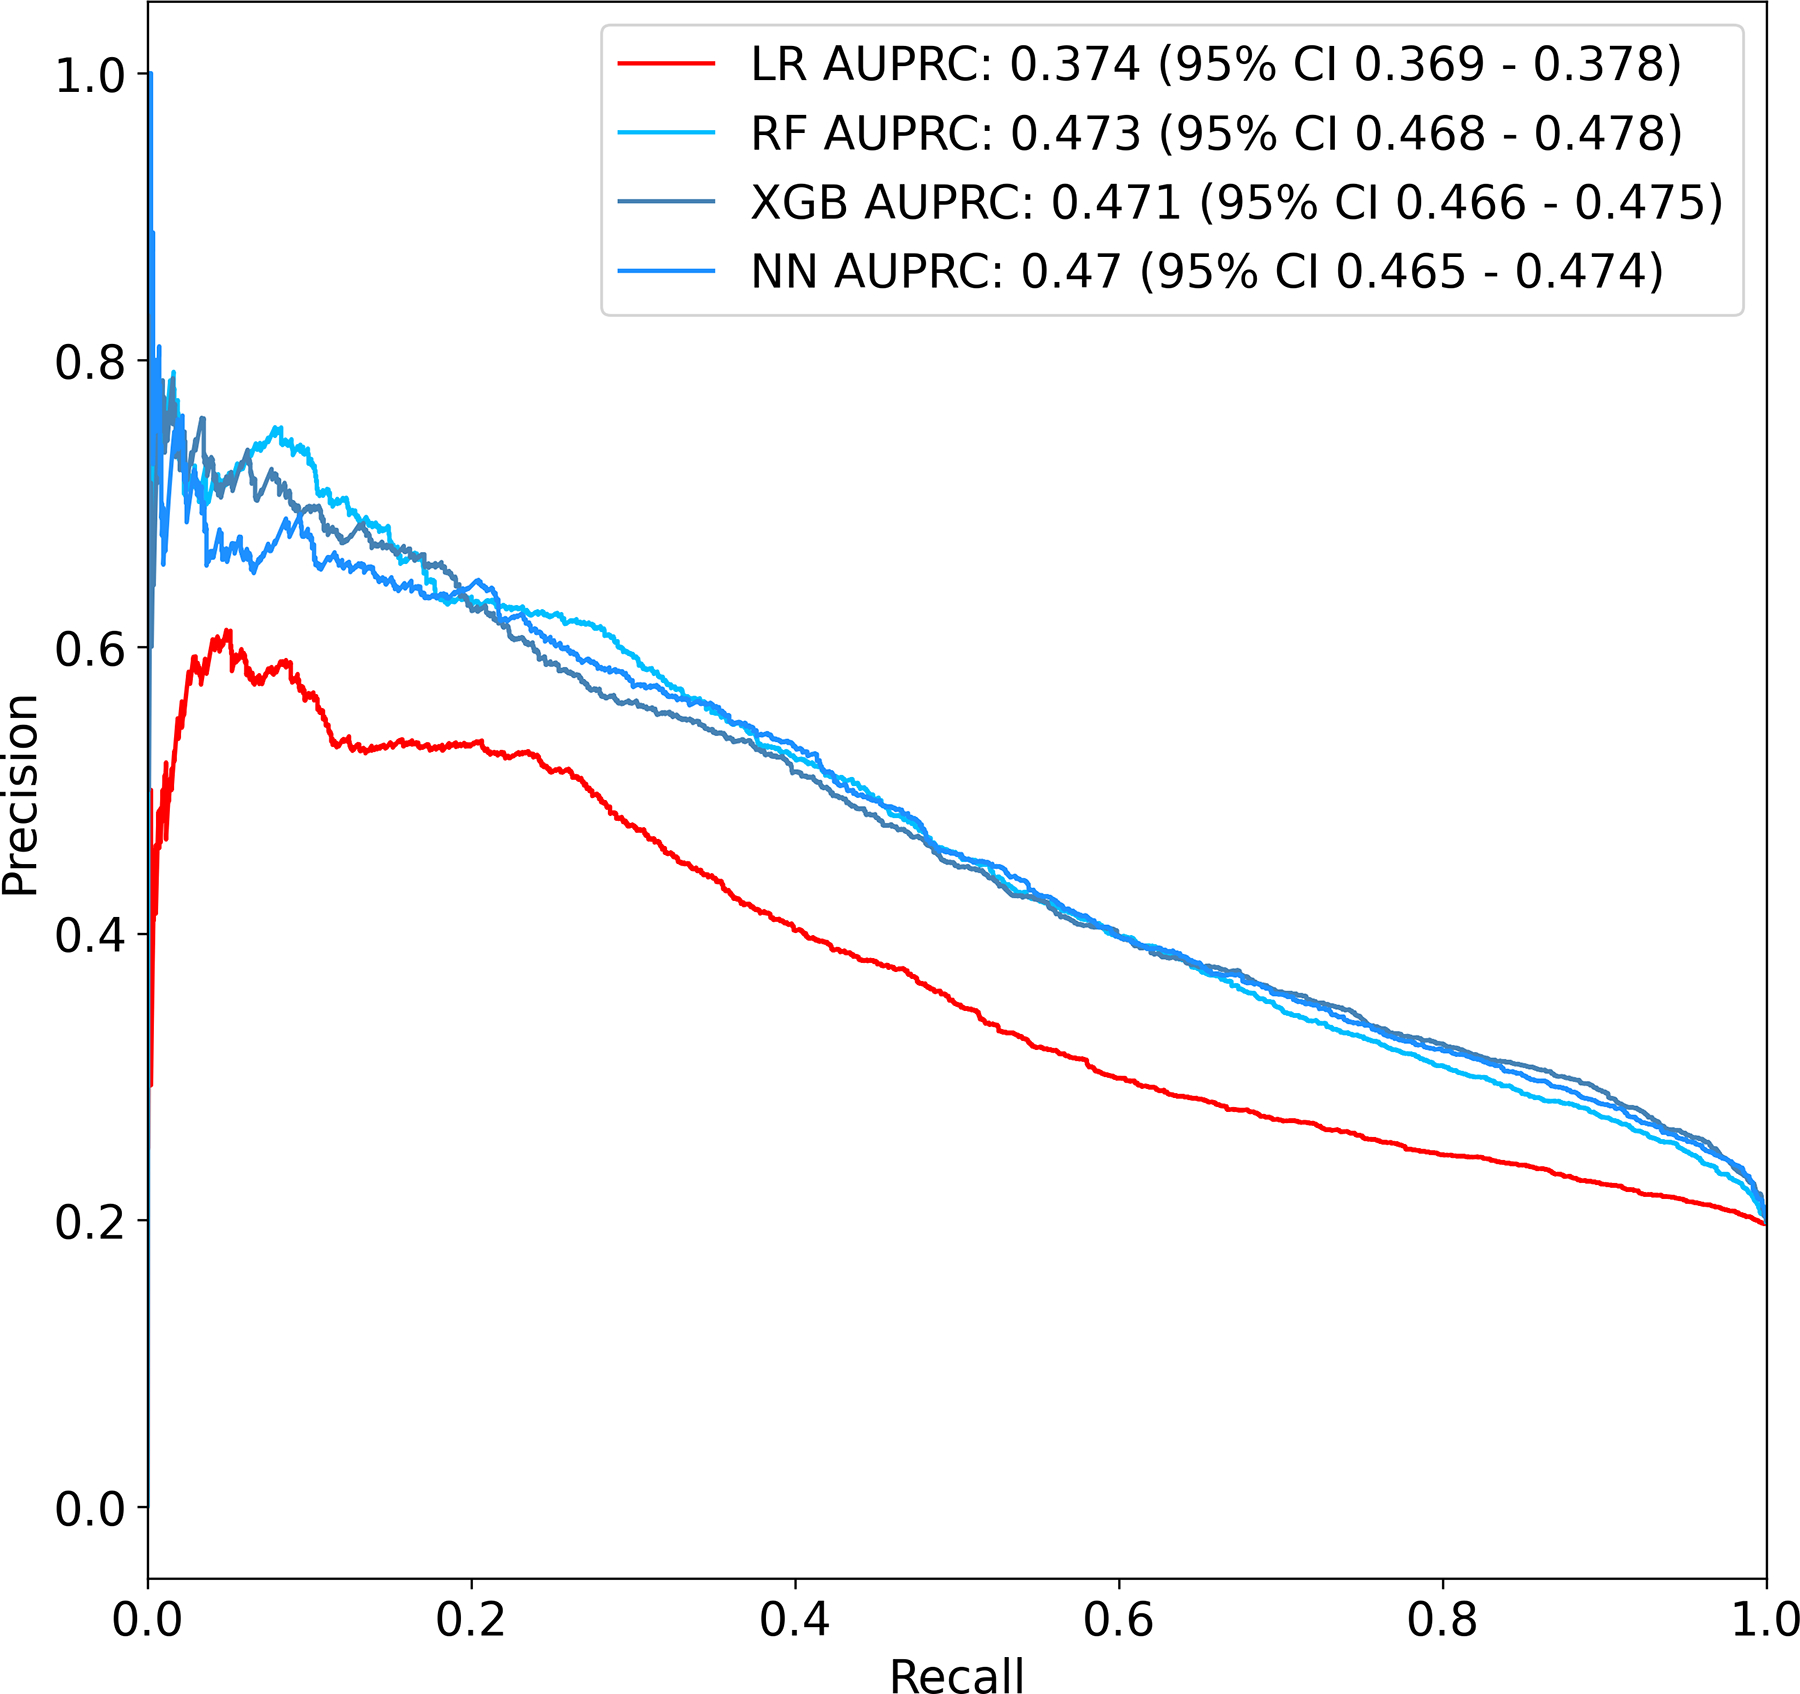
Precision-recall curves for models predicting pathologic complete response
At a specificity of 50%, XGB showed a sensitivity of 87.5%, a positive predictive value of 30.0%, and a negative predictive value of 94.2%. At a specificity of 90%, XGB showed a sensitivity of 42.2%, a positive predictive value of 49.9%, and a negative predictive value of 86.3%. Results for all thresholds are shown in Table 2.
Table 2.
| Gradient Boosting | Logistic Regression | |||||
|---|---|---|---|---|---|---|
| Specificity | Sensitivity | Positive Predictive Value | Negative Predictive Value | Sensitivity | Positive Predictive Value | Negative Predictive Value |
| 90 | 41 | 49.3 | 86.1 | 33.7 | 44.3 | 84.6 |
| 70 | 66.7 | 35 | 89.4 | 57 | 31.6 | 86.8 |
| 50 | 84.3 | 29.1 | 92.8 | 72.5 | 26.2 | 88 |
| 30 | 96.4 | 25.2 | 97.1 | 87.1 | 23.3 | 90.3 |
| 10 | 99.7 | 21.3 | 99.3 | 96.8 | 20.8 | 92.3 |
Using Shapley additive explanation values, the variables which had the highest influence on model predictions in the XGB model were lymphovascular invasion, CEA value, perineural invasion, size of tumor, microsatellite instability, tumor grade, and T stage. The top ten variables are listed in Figure 4.
Figure 4.

Relative importance of top variables for prediction of pathologic complete response
Using recursive feature elimination, the top variables were identified and included lymphovascular invasion, CEA value, perineural invasion, size of tumor, and microsatellite instability. Machine learning-based models developed using these variables only showed preserved model performance compared with the full model, while LR performed poorly. The highest performing model was XGB, with an AUROC of 0.775 (95% CI 0.771 – 0.779) and AUPRC of 0.460 (95% CI 0.456 – 0.465). RF and NN performed similarly (Figure 5).
Figure 5.

Receiver operating characteristic and precision-recall curves for 5-variable models predicting pathologic complete response; A: Receiver operating characteristic curves, B: Precision-recall curves
Models excluding lymphovascular and perineural invasion showed much lower predictive ability, although machine learning-based models continued to show significantly higher performance compared to LR. The highest performing model was XGB with an AUROC of 0.660 (95% CI 0.656 – 0.665) and AUPRC of 0.315 (95% CI 0.311 – 0.320), compared with 0.614 (95% CI 0.609 – 0.618) and 0.261 (95% CI 0.257 – 0.265), respectively, for LR (Supplementary Figure 1). In these models, top variables included microsatellite instability, CEA value, tumor size, and tumor grade.
Discussion
This study developed and internally validated machine learning-based models which predict pCR after neoadjuvant therapy for locally advanced rectal cancer based on pre-treatment factors alone. Machine learning approaches showed significantly better performance (AUROC 0.78 vs 0.69) compared with traditional logistic regression. Lymphovascular invasion, perineural invasion, and microsatellite instability were identified as having the strongest influence on model predictions. A more concise model dependent on the top 5 variables showed preserved model performance.
Clinical factors associated with pCR are well-studied. Retrospective reviews show broad agreement with our models in identifying microsatellite stability, lower CEA, lower T and N stage, lower grade, non-mucinous histology, and private insurance as being associated with pCR.25,26,36,37 Additional factors, such as distance from anal verge, hemoglobin, and white blood cell count, have also shown predictive utility and would likely improve the current model performance if they were available in the NCDB database.36 Another important point of discussion is the role of total neoadjuvant therapy (TNT) in rate of pCR. In recent years, neoadjuvant therapy has shifted towards TNT because of evidence from randomized trials demonstrating an increase in pCR rate, but multiple previous studies of the NCDB show no significant difference.38–40 This may be because the benefits of TNT are difficult to reproduce outside of high-volume centers.38 For these reasons, we did not perform a subgroup analysis of TNT, but as more reliably effective or novel regimens are adopted, our models will need to be re-calibrated.41
Multiple previous studies have also sought to develop predictive models for pCR. However, many of these studies are limited by their use of single-institution datasets, with unclear generalizability. Two studies, using logistic regression, using 391 and 1089 patients achieved AUROCs of 0.706 and 0.754 respectively, in predicting pCR.13,14 A 2020 study applied machine learning techniques to a single institution dataset including 287 patients and achieved an AUROC of 0.81 with an NN model.12 Despite showing slightly lower accuracy, our models are more generalizable given the much larger (>50,000 patients), nationwide training dataset. These studies demonstrate the promise of machine learning techniques in creating more accurate predictive models for pCR in rectal cancer.
A promising adjacent field of research has been the prediction of pCR based on additional data types including radiologic and pathologic images. These include pre- and post-treatment MRI and PET/CT images (AUROC 0.72 to 0.99)20,22,42 and pathologic slides (AUROC 0.79),21 where computer vision is used to interpret the raw images. In addition, novel biomarkers such as gene mutations, gene expression, and microbial diversity are being explored as adjuncts to current evaluation.43–45 Machine learning, especially deep learning, is well-suited to incorporating these diverse data sources, which require expert interpretation or involve thousands of variables. The most accurate models will likely incorporate all available clinical, endoscopic, radiologic, and genetic information in a comprehensive evaluation.46
Our study has multiple limitations. First, we did not include patients treated non-operatively after a complete clinical response, as the NCDB does not currently include post-treatment restaging or disease-free survival as an outcome. However, we expect strong overlap between patients with pCR and those treated non-operatively with long-term disease-free survival. Second, the recording of pathologic staging in the NCDB can be inconsistent. As discussed previously, inclusion of Tx/Nx in pCR led to an unreasonably high rate of pCR in early years of this study, implying that the variable was used as “unknown” rather than “tumor not found.” We attempted to address this with variable imputation as described in the methods section, but this process may introduce biases in itself. Third, we also focused on pre-treatment variables, but lymphovascular and perineural invasion are possibly collected from the final pathology. This could result in an overestimate of the predictive ability of these variables. However, they are independent risk factors for response to neo-adjuvant therapy and have been included in previous predictive models for pCR.12,13 Recent work also suggests it is possible to predict lymphovascular and perineural invasion from MRI and, in the future, it may be feasible to capture this information without pathologic data.47 Because model performance decreases significantly when excluding these variables, prospective analyses based on pre-treatment data collection are needed to validate their predictive ability. More broadly, use of the NCDB does carry major limitations regarding reliability and granularity compared with single-institution datasets. However, it does capture the heterogenous, real-world treatments and outcomes that the majority of patients with rectal cancer in the US experience.
Conclusions
This study developed and internally validated machine learning-based models which can accurately predict pCR for locally advanced rectal cancer based on pre-treatment factors. Given they were developed using a large, heterogeneous dataset, they should be broadly generalizable. However, a key step before clinical use will be external validation in a separate dataset, including patients treated non-operatively. One useful implementation of these models would be to create an online risk calculator which surgeons can use to support pre-treatment counseling and provide a more accurate estimate regarding response to therapy. Further, integrating machine learning systems directly into the electronic medical record could allow for automatic incorporation of radiologic and pathologic findings into our models and create decision-support tools which assist clinicians in providing more accurate prognosis and, in the future, identifying the best candidates for non-operative management.
Supplementary Material
Supplementary Figure 1. Receiver operating characteristic curves, precision-recall curves, and relative importance of top variables for prediction of pathologic complete response, excluding lymphovascular and perineural invasion
Grant support:
This work was supported by funding from the National Institutes of Health (Program in Translational Medicine T32-CA244125 to UNC/KAC).
Footnotes
Conflicts of interest: None declared for each author.
Presentation: This work will be a poster presentation at the 2023 ASCRS Annual Scientific Meeting in Seattle, WA (6/4/2023).
The data used in the study are derived from a de-identified NCDB file. The American College of Surgeons and the Commission on Cancer have not verified and are not responsible for the analytic or statistical methodology employed, or the conclusions drawn from these data by the investigator.
If the manuscript is provisionally accepted, a video abstract will be required prior to final acceptance.
References
- 1.Zorcolo L, Rosman AS, Restivo A, et al. Complete pathologic response after combined modality treatment for rectal cancer and long-term survival: a meta-analysis. Ann Surg Oncol. 2012;19(9):2822–2832. doi: 10.1245/S10434-011-2209-Y [DOI] [PubMed] [Google Scholar]
- 2.Rödel C, Martus P, Papadoupolos T, et al. Prognostic significance of tumor regression after preoperative chemoradiotherapy for rectal cancer. J Clin Oncol. 2005;23(34):8688–8696. doi: 10.1200/JCO.2005.02.1329 [DOI] [PubMed] [Google Scholar]
- 3.Fokas E, Liersch T, Fietkau R, et al. Tumor regression grading after preoperative chemoradiotherapy for locally advanced rectal carcinoma revisited: Updated results of the CAO/ARO/AIO-94 trial. J Clin Oncol. 2014;32(15):1554–1562. doi: 10.1200/JCO.2013.54.3769 [DOI] [PubMed] [Google Scholar]
- 4.Habr-Gama A, Perez RO, Nadalin W, et al. Operative versus nonoperative treatment for stage 0 distal rectal cancer following chemoradiation therapy: Long-term results. Ann Surg. 2004;240(4):711–718. doi: 10.1097/01.sla.0000141194.27992.32 [DOI] [PMC free article] [PubMed] [Google Scholar]
- 5.van der Valk MJM, Hilling DE, Bastiaannet E, et al. Long-term outcomes of clinical complete responders after neoadjuvant treatment for rectal cancer in the International Watch & Wait Database (IWWD): an international multicentre registry study. Lancet. 2018;391(10139):2537–2545. doi: 10.1016/S0140-6736(18)31078-X [DOI] [PubMed] [Google Scholar]
- 6.Garcia-Aguilar J, Patil S, Gollub MJ, et al. Organ Preservation in Patients with Rectal Adenocarcinoma Treated with Total Neoadjuvant Therapy. J Clin Oncol. 2022;18(23):JCO2200032. doi: 10.1200/JCO.22.00032 [DOI] [PMC free article] [PubMed] [Google Scholar]
- 7.Benson AB, Venook AP, Al-Hawary MM, et al. Rectal Cancer, Version 2.2022. JNCCN J Natl Compr Cancer Netw. 2022;20(10):1139–1167. doi: 10.6004/jnccn.2022.0051 [DOI] [PubMed] [Google Scholar]
- 8.Maas M, Lambregts DMJ, Nelemans PJ, et al. Assessment of Clinical Complete Response After Chemoradiation for Rectal Cancer with Digital Rectal Examination, Endoscopy, and MRI: Selection for Organ-Saving Treatment. Ann Surg Oncol. 2015;22(12):3873–3880. doi: 10.1245/S10434-015-4687-9/FIGURES/5 [DOI] [PMC free article] [PubMed] [Google Scholar]
- 9.Guillem JG, Ruby JA, Leibold T, et al. Neither FDG-PET Nor CT can distinguish between a pathological complete response and an incomplete response after neoadjuvant chemoradiation in locally advanced rectal cancer: a prospective study. Ann Surg. 2013;258(2):289–295. doi: 10.1097/SLA.0B013E318277B625 [DOI] [PMC free article] [PubMed] [Google Scholar]
- 10.Guillem JG, Chessin DB, Shia J, et al. Clinical examination following preoperative chemoradiation for rectal cancer is not a reliable surrogate end point. J Clin Oncol. 2005;23(15):3475–3479. doi: 10.1200/JCO.2005.06.114 [DOI] [PubMed] [Google Scholar]
- 11.Yoo BC, Yeo SG. Clinical utility of pretreatment prediction of chemoradiotherapy response in rectal cancer: A review. EPMA J. 2017;8(1):61–67. doi: 10.1007/s13167-017-0082-x [DOI] [PMC free article] [PubMed] [Google Scholar]
- 12.Huang CM, Huang MY, Huang CW, et al. Machine learning for predicting pathological complete response in patients with locally advanced rectal cancer after neoadjuvant chemoradiotherapy. Sci Rep. 2020;10(1):1–10. doi: 10.1038/s41598-020-69345-9 [DOI] [PMC free article] [PubMed] [Google Scholar]
- 13.Shin JK, Huh JW, Lee WY, et al. Clinical prediction model of pathological response following neoadjuvant chemoradiotherapy for rectal cancer. Sci Rep. 2022;12(1):1–10. doi: 10.1038/s41598-022-10974-7 [DOI] [PMC free article] [PubMed] [Google Scholar]
- 14.Huh JW, Kim HR, Kim YJ. Clinical prediction of pathological complete response after preoperative chemoradiotherapy for rectal cancer. Dis Colon Rectum. 2013;56(6):698–703. doi: 10.1097/DCR.0b013e3182837e5b [DOI] [PubMed] [Google Scholar]
- 15.Géron A Hands-on Machine Learning with Scikit-Learn, Keras, and TensorFlow: Concepts, Tools, and Techniques to Build Intelligent Systems. O’Reilly Media; 2019. [Google Scholar]
- 16.Ren Y, Loftus TJ, Datta S, et al. Performance of a Machine Learning Algorithm Using Electronic Health Record Data to Predict Postoperative Complications and Report on a Mobile Platform. JAMA Netw Open. 2022;5(5). Accessed May 19, 2022. https://jamanetwork.com/journals/jamanetworkopen/fullarticle/2792367 [DOI] [PMC free article] [PubMed] [Google Scholar]
- 17.Bertsimas D, Dunn J, Velmahos GC, et al. Surgical Risk Is Not Linear: Derivation and Validation of a Novel, User-friendly, and Machine-learning-based Predictive OpTimal Trees in Emergency Surgery Risk (POTTER) Calculator. Ann Surg. 2018;268(4):574–583. doi: 10.1097/SLA.0000000000002956 [DOI] [PubMed] [Google Scholar]
- 18.Liu Y, Ko CY, Hall BL, Cohen ME. ACS NSQIP Risk Calculator Accuracy Using a Machine Learning Algorithm Compared to Regression. J Am Coll Surg. 2023;E-publishe. doi: 10.1097/XCS.0000000000000556 [DOI] [PubMed] [Google Scholar]
- 19.Zhang XY, Wang L, Zhu HCHT, et al. Predicting rectal cancer response to neoadjuvant chemoradiotherapy using deep learning of diffusion kurtosis MRI. Radiology. 2020;296(1):56–64. doi: 10.1148/radiol.2020190936 [DOI] [PubMed] [Google Scholar]
- 20.Jang BS, Lim YJ, Song C, et al. Image-based deep learning model for predicting pathological response in rectal cancer using post-chemoradiotherapy magnetic resonance imaging. Radiother Oncol. 2021;161:183–190. doi: 10.1016/J.RADONC.2021.06.019 [DOI] [PubMed] [Google Scholar]
- 21.Delli Pizzi A, Chiarelli AM, Chiacchiaretta P, et al. MRI-based clinical-radiomics model predicts tumor response before treatment in locally advanced rectal cancer. Sci Rep. 2021;11(1):1–11. doi: 10.1038/s41598-021-84816-3 [DOI] [PMC free article] [PubMed] [Google Scholar]
- 22.Shaish H, Aukerman A, Vanguri R, et al. Radiomics of MRI for pretreatment prediction of pathologic complete response, tumor regression grade, and neoadjuvant rectal score in patients with locally advanced rectal cancer undergoing neoadjuvant chemoradiation: an international multicenter study. Eur Radiol. 2020;30(11):6263–6273. doi: 10.1007/S00330-020-06968-6/FIGURES/5 [DOI] [PubMed] [Google Scholar]
- 23.Feng L, Liu Z, Li C, et al. Development and validation of a radiopathomics model to predict pathological complete response to neoadjuvant chemoradiotherapy in locally advanced rectal cancer: a multicentre observational study. Lancet Digit Heal. 2022;4(1):e8–e17. doi: 10.1016/S2589-7500(21)00215-6 [DOI] [PubMed] [Google Scholar]
- 24.American College of Surgeons. About the National Cancer Database. National Cancer Database. Published 2017. Accessed February 15, 2023. https://www.facs.org/quality-programs/cancer/ncdb/about [Google Scholar]
- 25.Al-Sukhni E, Attwood K, Mattson DM, Gabriel E, Nurkin SJ. Predictors of Pathologic Complete Response Following Neoadjuvant Chemoradiotherapy for Rectal Cancer. Ann Surg Oncol. 2016;23(4):1177–1186. doi: 10.1245/S10434-015-5017-Y/TABLES/3 [DOI] [PMC free article] [PubMed] [Google Scholar]
- 26.Hasan S, Renz P, Wegner RE, et al. Microsatellite Instability (MSI) as an Independent Predictor of Pathologic Complete Response (PCR) in Locally Advanced Rectal Cancer: A National Cancer Database (NCDB) Analysis. Ann Surg. 2020;271(4):716. doi: 10.1097/SLA.0000000000003051 [DOI] [PMC free article] [PubMed] [Google Scholar]
- 27.Merath K, Hyer JM, Mehta R, et al. Use of Machine Learning for Prediction of Patient Risk of Postoperative Complications After Liver, Pancreatic, and Colorectal Surgery. J Gastrointest Surg 2019 248. 2019;24(8):1843–1851. doi: 10.1007/S11605-019-04338-2 [DOI] [PubMed] [Google Scholar]
- 28.Nudel J, Bishara AM, de Geus SWL, et al. Development and validation of machine learning models to predict gastrointestinal leak and venous thromboembolism after weight loss surgery: an analysis of the MBSAQIP database. Surg Endosc. Published online 2020. doi: 10.1007/s00464-020-07378-x [DOI] [PMC free article] [PubMed] [Google Scholar]
- 29.Lecun Y, Bengio Y, Hinton G. Deep learning. Nature. 2015;521(7553):436–444. doi: 10.1038/nature14539 [DOI] [PubMed] [Google Scholar]
- 30.scikit-optimize/scikit-optimize: Sequential model-based optimization with a `scipy.optimizè interface. Accessed December 5, 2022. https://github.com/scikit-optimize/scikit-optimize [Google Scholar]
- 31.Lundberg SM, Allen PG, Lee SI. A Unified Approach to Interpreting Model Predictions. Accessed October 21, 2021. https://github.com/slundberg/shap [Google Scholar]
- 32.Pedregosa F, Varoquaux G, Gramfort A, et al. Scikit-learn: Machine Learning in Python. J Mach Learn Res. 2011;12:2825–2830. [Google Scholar]
- 33.Pollard TJ, Johnson AEW, Raffa JD, Mark RG. tableone: An open source Python package for producing summary statistics for research papers. JAMIA Open. 2018;1(1):26. doi: 10.1093/JAMIAOPEN/OOY012 [DOI] [PMC free article] [PubMed] [Google Scholar]
- 34.Chen T, Guestrin C. {XGBoost}: A Scalable Tree Boosting System. In: Proceedings of the 22nd ACM SIGKDD International Conference on Knowledge Discovery and Data Mining. KDD ‘16. ACM; 2016:785–794. doi: 10.1145/2939672.2939785 [DOI] [Google Scholar]
- 35.Chollet F, others. Keras. Published online 2015. https://github.com/fchollet/keras [Google Scholar]
- 36.Ryan JE, Warrier SK, Lynch AC, Ramsay RG, Phillips WA, Heriot AG. Predicting pathological complete response to neoadjuvant chemoradiotherapy in locally advanced rectal cancer: a systematic review. Color Dis. 2016;18(3):234–246. doi: 10.1111/CODI.13207 [DOI] [PubMed] [Google Scholar]
- 37.Lorimer PD, Motz BM, Kirks RC, et al. Pathologic Complete Response Rates After Neoadjuvant Treatment in Rectal Cancer: An Analysis of the National Cancer Database. Ann Surg Oncol. 2017;24(8):2095–2103. doi: 10.1245/s10434-017-5873-8 [DOI] [PubMed] [Google Scholar]
- 38.Goffredo P, Khan A, Mott SL, et al. Total Neoadjuvant Therapy Versus Standard Neoadjuvant Chemoradiation in Patients with Locally Advanced Rectal Cancer: A Comparison of Short-and Long-Term Oncologic Outcomes. Ann Surg. 2022;276(6):E819–E824. doi: 10.1097/SLA.0000000000005141 [DOI] [PubMed] [Google Scholar]
- 39.Babar L, Bakalov V, Abel S, et al. Retrospective review of total neoadjuvant therapy. World J Gastrointest Oncol. 2019;11(10):857. doi: 10.4251/WJGO.V11.I10.857 [DOI] [PMC free article] [PubMed] [Google Scholar]
- 40.Zhu S, Brodin NP, English K, et al. Comparing outcomes following total neoadjuvant therapy and following neoadjuvant chemoradiation therapy in patients with locally advanced rectal cancer. EClinicalMedicine. 2019;16:23–29. doi: 10.1016/J.ECLINM.2019.09.009 [DOI] [PMC free article] [PubMed] [Google Scholar]
- 41.Cercek A, Lumish M, Sinopoli J, et al. PD-1 Blockade in Mismatch Repair–Deficient, Locally Advanced Rectal Cancer. N Engl J Med. 2022;386(25):2363–2376. doi: 10.1056/NEJMOA2201445/SUPPL_FILE/NEJMOA2201445_DATA-SHARING.PDF [DOI] [PMC free article] [PubMed] [Google Scholar]
- 42.Shen WC, Chen SW, Wu KC, et al. Predicting pathological complete response in rectal cancer after chemoradiotherapy with a random forest using 18F-fluorodeoxyglucose positron emission tomography and computed tomography radiomics. Ann Transl Med. 2020;8(5):207–207. doi: 10.21037/ATM.2020.01.107 [DOI] [PMC free article] [PubMed] [Google Scholar]
- 43.Chatila WK, Kim JK, Walch H, et al. Genomic and transcriptomic determinants of response to neoadjuvant therapy in rectal cancer. Nat Med. 2022;28(8):1646–1655. doi: 10.1038/s41591-022-01930-z [DOI] [PMC free article] [PubMed] [Google Scholar]
- 44.Emons G, Auslander N, Jo P, et al. Gene-expression profiles of pretreatment biopsies predict complete response of rectal cancer patients to preoperative chemoradiotherapy. Br J Cancer. Published online May 21, 2022. doi: 10.1038/S41416-022-01842-2 [DOI] [PMC free article] [PubMed] [Google Scholar]
- 45.Jang BS, Chang JH, Chie EK, et al. Gut Microbiome Composition Is Associated with a Pathologic Response After Preoperative Chemoradiation in Patients with Rectal Cancer. Int J Radiat Oncol Biol Phys. 2020;107(4):736–746. doi: 10.1016/j.ijrobp.2020.04.015 [DOI] [PubMed] [Google Scholar]
- 46.Wagner M, Brandenburg JM, Bodenstedt S, et al. Surgomics: personalized prediction of morbidity, mortality and long-term outcome in surgery using machine learning on multimodal data. Surg Endosc. 2022;36(11):8568–8591. doi: 10.1007/s00464-022-09611-1 [DOI] [PMC free article] [PubMed] [Google Scholar]
- 47.Tong P, Sun D, Chen G, Ni J, Li Y. Biparametric magnetic resonance imaging-based radiomics features for prediction of lymphovascular invasion in rectal cancer. BMC Cancer. 2023;23(1). doi: 10.1186/S12885-023-10534-W [DOI] [PMC free article] [PubMed] [Google Scholar]
Associated Data
This section collects any data citations, data availability statements, or supplementary materials included in this article.
Supplementary Materials
Supplementary Figure 1. Receiver operating characteristic curves, precision-recall curves, and relative importance of top variables for prediction of pathologic complete response, excluding lymphovascular and perineural invasion