

Abstract
Objectives
Previous studies have demonstrated that obesity may impact the efficacy of anti‐PD1 therapy, but the underlying mechanism remains unclear. In this study, our objective was to determine the prognostic value of obesity in patients with oral tongue squamous cell carcinoma (OTSCC) treated with pembrolizumab and establish a subtype based on fatty acid metabolism‐related genes (FAMRGs) for immunotherapy.
Materials and Methods
We enrolled a total of 56 patients with OTSCC who underwent neoadjuvant anti‐PD1 therapy. Univariate and multivariate Cox regression analyses, Kaplan–Meier survival analysis, and immunohistochemistry staining were performed. Additionally, we acquired the gene expression profiles of pan‐cancer samples and conducted GSEA and KEGG pathway analysis. Moreover, data from TCGA, MSigDB, UALCAN, GEPIA and TIMER were utilized to construct the FAMRGs subtype.
Results
Our findings indicate that high Body Mass Index (BMI) was significantly associated with improved PFS (HR = 0.015; 95% CI, 0.001 to 0.477; p = 0.015), potentially attributed to increased infiltration of PD1 + T cells. A total of 91 differentially expressed FAMRGs were identified between the response and non‐response groups in pan‐cancer patients treated with immunotherapy. Of these, 6 hub FAMRGs (ACSL5, PLA2G2D, PROCA1, IL4I1, UBE2L6 and PSME1) were found to affect PD‐1 expression and T cell infiltration in HNSCC, which may impact the efficacy of anti‐PD1 therapy.
Conclusion
This study demonstrates that obesity serves as a robust prognostic predictor for patients with OTSCC undergoing neoadjuvant anti‐PD1 therapy. Furthermore, the expression of 6 hub FAMRGs (ACSL5, PLA2G2D, PROCA1, IL4I1, UBE2L6 and PSME1) plays a pivotal role in the context of anti‐PD1 therapy and deserves further investigation.
Keywords: fatty acid metabolism, immunotherapy, obesity, oral tongue squamous cell carcinoma, prognosis
1. INTRODUCTION
The most common head and neck malignancies are thought to originate in the mucosal epithelium of the oral cavity, pharynx, and larynx. 1 According to the statistical study, tongue cancer in the United States in 2024 contains 19,360 newly diagnosed cases and 3320 deaths. 2 One of the most prevalent tongue malignancies is oral tongue squamous cell carcinoma (OTSCC), and in recent years, its frequency has increased. 3 , 4
Presently, OTSCC is treated with surgery and chemotherapy, radiotherapy, immunotherapy and combination treatment. 4 , 5 Recently, there have been significant advancements in the development of drugs that target the interaction between the receptor known as programmed death‐1 (PD‐1) and its ligands, namely programmed death‐ligand 1/2 (PD‐L1/L2). These drugs have demonstrated clinical effectiveness across a wide range of tumor types. 6 , 7 , 8 To date, the utilization of anti‐PD1 therapy has exhibited promising outcomes in the treatment of HNSCC patients experiencing tumor progression. 9 In recent years, inhibitors of PD‐1, are approved for use in patients with progressive HNSCC, these drugs have a response rate of about 20% and an overall survival benefit compared with chemotherapy. 10 , 11 , 12 Afterward, several clinical randomized studies proved that pembrolizumab prolong the overall survival of patients with progressive HNSCC. 12 , 13 Additionally, anti‐PD1 therapy was used in the neoadjuvant therapy setting in untreated patients with advanced tumors with promising results. 6 , 14 , 15 Moreover, neoadjuvant anti‐PD1 therapy holds potential in achieving tumor reduction while preserving organ function and facial appearance, thereby maximizing patients benefits, which enable more advanced patients with opportunities for surgical treatment. In spite of the advancements made in research and treatment over the past 10 years, The low response rate among patients with HNSCC poses a significant limitation to the effectiveness of immune checkpoint inhibitors (ICIs) treatment. Additionally, both clinics and biomedical science face considerable challenges in dealing with OTSCC. 16 , 17 Hence, it is crucial to promptly discover potential biomarkers capable of precisely predicting prognosis and forecasting the effectiveness of immunotherapy.
In the past few years, incidence of obesity has increased significantly, and population data link obesity to the increased incidence of several common cancers. 18 , 19 Thus, obesity emerge as a pressing global concern. Previous study suggested that obesity associated with many of diseases has been linked to dysfunction of the immune system. 20 Moreover, T lymphocytes play a crucial role in the immune system, regulating key elements of an immune response. 21 In addition, checkpoint blockade therapies aimed at T cell responses are proving to be effective in the treatment of cancer patients in the clinic. 22 As it is known to all, obesity can lead to chronic inflammation, which promote an exhausted T cell phenotype. 23 Similarly, the obese state with chronic inflammation and subsequent generation of exhausted T cells may enhance tumor progression while concurrently promoting an environment conducive to ICIs. 24 Preclinical studies demonstrated that obesity enhanced tumor growth, which was associated with dysfunctional CD8 T cells. 25 , 26 However, in several tumor models treatment of obese mice with anti‐PD1 slowed down tumor growth or led to complete tumor resistance. 27 , 28 The first major study to report this finding with ICB was that obesity was found to be associated with a significant reduction in disease progression and death risk in patients with metastatic melanoma who received immune checkpoint blockade (ICB) treatment. 29 A recent study also showed that obese Asian patients with advanced non‐small cell lung cancer who received immune checkpoint inhibitors had better overall survival independent of muscle or fat mass. 30 Therefore, obesity has a significant impact and checkpoint blockade therapy has the potential to cure cancer, to enhancing the utilization of these therapies in the growing number of obese patients, it is imperative to acquire a more comprehensive understanding regarding the impact of obesity on T cells.
Obesity could also alter tumor lipid metabolism. 31 As a crucial intermediate product in lipid metabolism, fatty acid metabolism (FAM) plays an indispensable role in numerous biological activities and holds great potential as an immunotherapy target. 32 , 33 And previous studies have identified a potential correlation between fatty acid metabolism and the effectiveness of immunotherapy as well as prognosis in patients with malignancies in. 34 For example, fatty acid metabolism‐related genes (FAMRGs) are potentially useful for predicting prognosis and immunotherapy response in bladder cancer. 35 The latest research demonstrates that the reprogramming of fatty acid metabolism has a significant impact on the phenotype of immune cells infiltrating the microenvironment of melanoma. Furthermore, the identification of biomarkers for molecular subtypes in FAM can independently predict prognosis and immunotherapy response in melanoma patients. 36 , 37 However, the prognostic and therapeutic effect of abnormal lipid metabolism throughout the body and FAM‐related biomarkers in OTSCC remains unexplored.
Our study found that obese patients have more PD1+ T cell infiltration, so they could benefit more from immunotherapy. We also identified that 6 FAMRGs were positively associated with the efficacy of immunotherapy, which may be used as molecular indicators to predict the efficacy of ICI. Our analysis process was shown in Figure 1.
FIGURE 1.

The workflow of the current work.
2. MATERIALS AND METHODS
2.1. Clinical data collection
With the approval of the Institutional Review Board of Sun Yat‐sen University Cancer Center (approved number: B2022‐221‐Y01, approved data: 2023‐6‐15), this study was granted a waiver of informed consent. The data of 56 OTSCC patients receiving anti‐PD1 therapy from October 2013 to April 2022 were retrospectively reviewed in Sun Yat‐sen University Cancer Center.
The stringent eligibility criteria were as follows: the resected specimen demonstrated the presence of histologically confirmed squamous cell carcinoma; the primary lesion had to be situated in the tongue; pathologic stages cII, cIII, cIVA, cIVB (NCCN Guidelines 1.2022 edition); sufficient organ functionality; absence of clinically significant abnormal findings on electrocardiography. Patients less than 5 months follow‐up were excluded. The initial measurements of BMI, OS and PFS were obtained for the 56 patients. PFS was determined as the duration between the initiation of anti‐PD1 therapy and either the occurrence of disease progression on radiological imaging or death due to disease. OS was determined as the period from the initiation of anti‐PD1 therapy until death resulting from the disease or until it censored at the last follow‐up.
2.2. Gene set enrichment analysis (GSEA) and Kyoto Encyclopedia of Genes and Genomes (KEGG) analyses
We obtained RNA sequence and corresponding clinical data of patients received PD‐1 inhibitors treatment from the The Cancer Genome Atlas database (TCGA, https://portal.gdc.cancer.gov/) and NCBI‐GEO DataSets (https://www.ncbi.nlm.nih.gov), including 49 response samples and 42 non‐response samples in melanoma, 8 response samples and 19 non‐response samples in non‐small cell lung cancer (NSLCL), 4 response samples and 7 non‐response samples in renal cell carcinoma (RCC), and 21 response samples and 57 non‐response samples in stomach (STAD) samples.
GSEA was conducted to explore the distinct pathways associated with the differential gene expression in cancer patients. The GSEA analysis was conducted with cohort PRJEB23709, GSE135222, GSE67501, PRJEB25780 in melanoma, NSCLC, RCC and STAD, respectively. The selection of HALLMARK gene sets and KEGG gene sets was based on statistical significance, as indicated by the normalized enrichment score (NES), false discovery rate (FDR), and p‐value. Statistical significance was considered when FDR ≤0.25.
The analysis was conducted using limma package, wherein differentially expressed genes (DEGs) were identified by applying a significance threshold of p‐value <0.05 and |log2 FC > 1 to distinguish between response and non‐response samples. Subsequently, the biological functions associated with these DEGs in pan‐cancer were systematically investigated using DAVID (https://david.ncifcrf.gov), a tool available for KEGG pathway analyses. p‐value was considered statistically significant.
2.3. GEPIA
The GEPIA database (http://gepia.cancer‐pku.cn/) a wealth of RNA sequencing expression data collected from 9736 tumors and 8587 normal samples sourced from the TCGA and GTEx databases. In recent study, we set out to examine the association between the expression of FAMRGs and PD‐1 levels by utilizing the GEPIA database to calculate Spearman's correlation coefficients.
2.4. Analysis of fatty acid metabolism‐associated genes in TIMER
The TIMER database (https://cistrome.shinyapps.io/timer/), 38 , 39 a comprehensive tool for analyzing tumor‐infiltrating immune cells, was employed to examine the correlation between the expression levels of FAMRGs and both tumor purity and tumor‐infiltrating immune cells in HNSCC.
2.5. Data processing of FAMRGs
We obtained the GMT file containing the gene set associated with the metabolic process of fatty acids from the Molecular Signatures Database (MsigDB) (https://www.gsea‐msigdb.org/gsea/msigdb/genesets.jsp) database in format of a GMT file, and 468 fatty acid metabolism‐related genes (FAMRGs) was found (Table S1). 40 Then, differentially expressed genes (DEGs) of 4 cancer database between anti‐PD1 therapy responder specimen and non‐responder specimen were identified via limma analysis online tool (http://sangerbox.com/home.html) with |log2 FC|>1 and p‐value <0.05. Finally, we used Venn software online (http://bioinformatics.psb.ugent.be/webtools/Venn/) to identify the fatty acid metabolism‐related genes (FAMRGs) in the DEGs of 4 cancer datasets.
2.6. Immunohistochemistry staining
The tissue specimens were preserved in a 10% solution of formalin and then embedded in paraffin wax. Subsequently, sections measuring 5 μm were obtained from the tissue blocks. These sections underwent deparaffinization using xylene, and dehydration though a sequence of alcohol concentrations (75%, 85%, 95%, 100%). To retrieve antigens, EDTA was employed, followed by blocking with goat serum at a concentration of 5%. The tissue sections were subsequently subjected to incubation with primary antibodies targeting CD4 (ZA‐0519, ZSGB‐BIO, China), CD8 (ZA‐0508, ZSGB‐BIO, China), CD20 (ZM‐0039, ZSGB‐BIO, China), PD‐1 (ZM‐0381, ZSGB‐BIO, China). Then, the tissue sections were subjected to a 2‐h incubation at room temperature with secondary antibodies (PV‐6000, ZSGB‐BIO, China). Following the incubation, the tissue sections with DAB. After the applications of a staining process, the sections underwent digital scanning using a scanner from Leica Biosystems made in Germany. Subsequently, analysis was conducted utilizing a workstation named Qupath, employing nuclear and membranal algorithms trained by pathologists. The protein expression was assessed based on the density of positive immune cells per square millimeter using Qupath image analysis.
2.7. Statistical analysis
The statistical analysis was conducted using SPSS software, version 22. Mean values and 95% confidence intervals (CI) were used to describe continuous data. The Kaplan– Meier method was employed to analyze survival data for each group, with comparison done through the log‐rank and Wilcoxon tests. To compare between the two groups, t tests and p‐value were utilized. Cox multivariate hazard analysis was utilized to assess the impact of pre‐specified prognostic factors. A significance level of p‐value <0.05 was considered. The key raw data have been uploaded to the Research Data Deposit public platform (www.researchdata.org.cn) with approval number RDDA2024932200.
3. RESULTS
3.1. Clinical features of patients with OTSCC
Between October 9, 2013, and April 26, 2022, the study cohort comprised 56 patients who were collected at Sun Yat‐sen University Cancer Center. Table 1. summarizes patients' clinical characteristics. The study included 41 (73.2%) men and 15 (26.8) women; median age was 50 years (23–79). Most patients were neither smoker (62.5%) nor alcoholics (73.2%). And a lesser percentage of patients have got hypertension (23.2%) and diabetes (5.4%) at the time of diagnosis. Otherwise, tumor was mostly at late clinical T3–T4 tumor stage (76.8%) with clinical lymph nodes (LN) involvement (n = 30, 53.6%).
TABLE 1.
Baseline characteristics (n = 56).
| Characteristics | No. (%) |
|---|---|
| Age, years, median (range) | 50 (23–79) |
| ≤60 | 38 (67.9) |
| >60 | 18 (32.1) |
| Sex | |
| Male | 41 (73.2) |
| Female | 15 (26.8) |
| BMI | |
| ≥24 | 19 (33.9) |
| <24 | 37 (66.1) |
| Smoking history | |
| Yes | 21 (37.5) |
| No | 35 (62.5) |
| Alcohol history | |
| Yes | 15 (26.8) |
| No | 41 (73.2) |
| Hypertension | |
| Yes | 13 (23.2) |
| No | 43 (76.8) |
| Diabetes | |
| Yes | 3 (5.4) |
| No | 53 (94.6) |
| Pathological type | |
| Low to medium differentiated | 44 (78.6) |
| Highly differentiated | 12 (21.4) |
| Tumor location | |
| Left | 33 (58.9) |
| Right | 22 (39.3) |
| Root | 1 (1.8) |
| cTNM Stage | |
| II–III | 21 (37.5) |
| IV | 35 (62.5) |
| cT | |
| 1–2 | 13 (23.2) |
| 3–4 | 43 (76.8) |
| cN | |
| Yes | 30 (53.6) |
| No | 26 (46.4) |
| Family history | |
| Yes | 3 (5.4) |
| No | 53 (94.6) |
| PNI | |
| <50.13 | 15 (26.8) |
| ≥50.13 | 41 (73.2) |
| Hypercholesterolemia | |
| Yes | 26 (46.4) |
| No | 30 (53.6) |
| Hypertriglyceridemia | |
| Yes | 18 (32.1) |
| dNo | 38 (67.9) |
| Dyslipidemia | |
| Yes | 31 (55.4) |
| No | 25 (44.6) |
| Metabolic syndrome | |
| Yes | 5 (8.9) |
| No | 51 (91.1) |
All patients were assigned to the two groups by Chinese BMI classification. 41 , 42 Baseline patients and tumor characteristics between the BMI≥24 and BMI < 24 groups are given in Table 2. At the point of diagnosis, there were 37 patients classified as having a normal weight, while 19 individuals fell into the overweight category. Clinical TNM stage, clinical T stage and LN involvement did not reveal any significant statistical differences between the two BMI groups. Interestingly, we found that overweight patients had significantly higher pCR frequency than normal weight (p = 0.024). The same trend was observed that among hypercholesterolemia (p = 0.003) and metabolic syndrome (p = 0.003) upon initial diagnosis. However, there was no significant difference in prognostic nutrition index (PNI), hypercholesterolemia and dyslipidemia.
TABLE 2.
Comparison of baseline information between BMI groups.
| N (%) | |||
|---|---|---|---|
| Characteristics | BMI < 24, N = 37, 66.1% | BMI ≥ 24, N = 19, 33.9% | p |
| Age (years) | |||
| ≤60 | 22 (59.5) | 16 (84.2) | 0.06 |
| >60 | 15 (40.5) | 3 (15.8) | |
| Sex | |||
| Male | 28 (75.7) | 13 (68.4) | 0.562 |
| Female | 9 (24.3) | 6 (31.6) | |
| Smoking history | |||
| Yes | 14 (37.8) | 7 (36.8) | 0.942 |
| No | 23 (62.2) | 12 (63.2) | |
| Alcohol history | |||
| Yes | 12 (32.4) | 3 (15.8) | 0.183 |
| No | 25 (67.6) | 16 (84.2) | |
| Hypertension | |||
| Yes | 5 (13.5) | 8 (42.1) | 0.039 |
| No | 32 (86.5) | 11 (57.9) | |
| Diabetes | |||
| Yes | 1 (2.7) | 2 (10.5) | 0.546 |
| No | 36 (97.3) | 17 (89.5) | |
| Family history | |||
| Yes | 3 (8.1) | 0 (0) | 0.516 |
| No | 34 (91.9) | 19 (100) | |
| Radiotherapy history | |||
| Yes | 3 (8.1) | 2 (10.5) | 1 |
| No | 34 (91.9) | 17 (89.5) | |
| Concomitant cancer | |||
| Yes | 5 (13.5) | 2 (10.5) | 1 |
| No | 32 (86.5) | 17 (89.5) | |
| Pathological type | |||
| Low to medium differentiated | 32 (86.5) | 12 (63.2) | 0.095 |
| Highly differentiation | 5 (13.5) | 7 (36.8) | |
| cTNM stage | |||
| II–III | 4 (10.8) | 1 (5.3) | 0.846 |
| IV | 33 (89.2) | 18 (94.7) | |
| cT | |||
| 1–2 | 7 (18.9) | 6 (31.6) | 0.467 |
| 3–4 | 30 (81.1) | 13 (68.4) | |
| cN | |||
| No | 18 (48.6) | 8 (42.1) | 0.642 |
| Yes | 19 (51.4) | 11 (57.9) | |
| pCR | |||
| Yes | 10 (27) | 11 (57.9) | 0.024 |
| No | 27 (73) | 8 (42.1) | |
| PNI | |||
| <50.13 | 12 (32.4) | 3 (15.8) | 0.183 |
| ≥50.13 | 25 (67.6) | 16 (84.2) | |
| Hypercholesterolemia | |||
| Yes | 17 (45.9) | 9 (47.4) | 0.920 |
| No | 20 (54.1) | 10 (52.6) | |
| Hypertriglyceridemia | |||
| Yes | 18 (48.6) | 15 (78.9) | 0.029 |
| No | 19 (51.4) | 4 (21.1) | |
| Dyslipidemia | |||
| Yes | 18 (48.6) | 13 (68.4) | 0.159 |
| No | 19 (51.4) | 6 (31.6) | |
| Metabolic syndrome | |||
| Yes | 0 (0) | 5 (26.3) | 0.003 |
| No | 37 (100) | 14 (73.7) | |
3.2. Survival outcomes of OTSCC patients treated with neoadjuvant anti‐PD1 therapy
The duration until the final follow‐up or mortality varied between 6 and 30 months, with a median duration of 15 months. Among the total of 56 patients, absence of disease was observed in 44 individuals (78.6%) during their most recent follow‐up, 8 (12.5%) patients were alive with disease (five cases recurrence within the local region, two cases of distant metastasis, and one case exhibiting both), 6 (10.7%) died of disease. The findings showed the univariate survival analyses conducted on distinct BMI groups (Figure 2A,B). The effects of BMI on PFS as calculated based on fully adjusted univariate and multivariate Cox regressions (Tables 3, 4). Through univariate analysis, a statistically significant association was observed between high BMI and improved PFS (p = 0.027) (Figure 2A; Table 3). Covariates with p‐value <0.1 were subjected to multivariable analysis, including BMI, smoking history, radiotherapy history, radiotherapy, cN, alcohol history, hypertension, hypertriglyceridemia and PNI. By multivariate analysis, high BMI remained significantly associated with improved PFS (p = 0.005) (Table 4). Besides, we also revealed that smoking history (p = 0.023), radiotherapy history (p = 0.017) and cN (p = 0.025) emerged as independent predictors for PFS (Table 4). But not in other subgroups (Figure S1). Of the whole 56 patients, 6 cancer‐related deaths were all reported in BMI < 24 group, and BMI≥24 group has no death. However, when analyzing the impact of increasing BMI on OS, no statistically significant differences were found (p = 0.224) (Figure 2B). These results may be caused by the small‐scale clinical studies and short duration of follow‐up. Hopefully, a large sample size will result in a statistical difference.
FIGURE 2.

Obese patients benefit from anti‐PD1 therapy by increasing infiltration of PD1+ T cells. (A, B) Kaplan–Meier plots of progression‐free survival (A) and overall survival (B) according to body mass index (BMI) group (BMI < 24 and BMI≥24) in patients with tongue squamous cell carcinoma. (C) Verification of BMI and immune cell infiltration in OTSCC (n = 27). immunohistochemical images show the immune cell infiltration (CD4+ T cell, CD8+ T cell, B cell, and PD1+ T cell) in OTSCC tissues. (D–G), human protein quantification analysis results of immunohistochemical staining by Qupath.
TABLES 3.
Univariate analysis of factors associated with progression‐free survival.
| Variables | Progression‐free survival | |
|---|---|---|
| HR (95% CI) | p | |
| Sex | ||
| Male | Reference | 0.426 |
| Female | 1.611 (0.498–5.208) | |
| BMI | ||
| <24 | Reference | 0.027 |
| ≥24 | 0.099 (0.013–0.768) | |
| Age | ||
| ≤60 years | Reference | 0.868 |
| >60 years | 1.097 (0.367–3.278) | |
| cTNM Stage | ||
| II–III | Reference | 0.284 |
| IV | 2.010 (0.561–7.210) | |
| Alcohol history | ||
| No | Reference | 0.097 |
| Yes | 3.624 (0.791–16.610) | |
| Smoking history | ||
| No | Reference | 0.174 |
| Yes | 2.252 (0.699–7.256) | |
| Radiotherapy history | ||
| No | Reference | 0.385 |
| Yes | 0.523 (0.113–2.318) | |
| Hypertension | ||
| No | Reference | 0.158 |
| Yes | 3.135 (0.641–15.340) | |
| Diabetes | ||
| No | Reference | 0.977 |
| Yes | 0.971 (0.126–7.490) | |
| cT | ||
| 1–2 | Reference | 0.683 |
| 3–4 | 0.785 (0.245–2.509) | |
| cN | ||
| No | Reference | 0.079 |
| Yes | 3.147 (0.876–11.310) | |
| Pathological type | ||
| Low to medium differentiated | Reference | 0.167 |
| Highly differentiated | 0.030 (0.000–4.341) | |
| PNI | ||
| Low | Reference | 0.206 |
| High | 0.503 (0.173–1.459) | |
| Hypercholesterolemia | ||
| No | Reference | 0.938 |
| Yes | 0.958 (0.331–2.772) | |
| Dyslipidemia | ||
| No | Reference | 0.247 |
| Yes | 0.533 (0.184–1.545) | |
| Metabolic syndrome | ||
| No | Reference | 0.334 |
| Yes | 0.038 (0.000–29.130) | |
TABLE 4.
Multivariate analysis of factors associated with progression‐free survival.
| Variables | Progression‐free survival | |
|---|---|---|
| HR (95% CI) | p | |
| BMI | ||
| <24 | Reference | 0.005 |
| ≥24 | 0.022 (0.001–0.326) | |
| Alcohol history | ||
| No | Reference | 0.724 |
| Yes | 1.469 (0.174–12.442) | |
| Radiotherapy history | ||
| No | Reference | 0.017 |
| Yes | 0.030 (0.002–0.530) | |
| Radiotherapy | ||
| No | Reference | 0.056 |
| Yes | 5.009 (0.960–26.136) | |
| cN | ||
| No | Reference | 0.025 |
| Yes | 13.789 (1.389–136.905) | |
| Smoking history | ||
| No | Reference | 0.023 |
| Yes | 14.592 (1.442–147.654) | |
| Hypertension | ||
| No | Reference | 0.386 |
| Yes | 3.674 (0.194–69.744) | |
| Family history | ||
| No | Reference | 0.566 |
| Yes | 0.481 (0.040–5.838) | |
| PNI | ||
| Low | Reference | 0.273 |
| High | 2.761 (0.449–16.964) | |
To investigate the effects of BMI on immune infiltration in OTSCC, we measured the expression of CD4, CD8, CD20, PD1 in tumor immune microenvironments (TIMs) involving a total of 27 patients with available of specimen by IHC (Figure 2C). The expression of PD1+ T cells was significantly elevated in high BMI group (Figure 2G), while there were no notable differences detected in the overall expression levels of CD4, CD8 and CD20 among the two groups (Figure 2D–F). These findings demonstrated that obese OTSCC patients may benefit from anti‐PD1 therapy by increasing the infiltration of PD1 + T cells. Obesity is a common cause of chronic inflammation, both systemically and at the tissue level, 43 and chronic inflammation with increased levels of PD‐1 expression in obese patients may increase the efficacy of anti‐PD1 treatment for OTSCC.
3.3. Functional analysis by GSEA and KEGG
As previous studies described, obesity is defined by an elevated BMI, typically because of excess adipose tissue. 44 , 45 And the condition of being obesity leads to a state of meta‐inflammatory characterized by heightened levels of proinflammatory cytokines, glucose, leptin, fatty acids metabolism. These factors have been shown to directly influence the response of T cells. 46 In this research, we conducted an extensive range of bioinformatics analysis methods to thoroughly investigate the influence of lipid metabolism on the efficacy of anti‐PD‐1 therapy. First, the biological role of lipid metabolism‐associated genes (LMAGs) was illustrated through GSEA in pan‐cancer. We enriched all the pathways associated with lipid metabolism, the findings indicated that among the HALLMARK terms, the responder group exhibited significantly elevated NES values in relation to triglyceride metabolic process, lipid storage, regulation of fatty acid metabolic process and fatty acid metabolism. (Figure 3A–D). Second, we identified DEGs between response and non‐response samples and performed KEGG pathway enrichment analyses. The analysis revealed that the responder group exhibited a significant enrichment in lipid acid metabolism, such as central carbon metabolism in cancer, citrate cycle, insulin resistance, lipid and atherosclerosis, and so on (Figure 3E–H). Collectively, these results illustrate that fatty acid metabolism may play a significant role in anti‐PD1 therapy response in pan‐cancer.
FIGURE 3.

Fatty acid metabolism impacts anti‐PD1 therapy effects in pan‐cancer. (A–D) Result of Gene Set Enrichment Analysis (GSEA) between responders and non‐responder groups in melanoma (A), non‐small cell lung cancer (B), renal cell carcinoma (C) and stomach adenocarcinoma (D). (E–H) Result of Kyoto Encyclopedia of Genes and Genomes (KEGG) between responders and non‐responder groups in melanoma (E), non‐small cell lung cancer (F), renal cell carcinoma (G) and stomach adenocarcinoma (H).
3.4. Screening of differentially expressed FAMRGs
To investigate how the fatty acid metabolic process could increase the response rate to immunotherapy. Via limma analysis online tool, we extracted DEGs between responder and non‐responder from PRJEB23709, GSE135222, GSE67501 and PRJEB23709, respectively. The clustering heatmap (Figure S2) and volcano plot depict the differential expression of genes (Figure 4A–D). In total, 468 FAMRGs was downloaded from Molecular Signatures Database (MsigDB) database (Table S1). 40 Then, Venn diagram software was used to identify the differentially expressed FAMRGs in pan‐cancer datasets, respectively. Overall, there are 91 differentially expressed FAMRGs (Genes that contain duplicates), including 14 FAMRGs in melanoma samples, 20 FAMRGs in NSCLC samples, 29 FAMRGs in RCC samples and 28 FAMRGs in STAD samples (Figure 4E,F; Table 5).
FIGURE 4.

Differentially expressed FAMRGs between responder and non‐responder samples. (A‐D) Volcano map of the differentially expressed genes in pan‐cancer. The red, green, and gray dots indicate high, low, and no difference in expression between responder and non‐responder samples (p < 0.05 & |log2 FC|>1). (E–H) Authentication of 91 FAMRGs in the four cancer datasets through Venn diagrams. (Melanoma (A), NSCLC (B), RCC (C), STAD (D)). (The upregulated genes were displayed in red, with downregulated FAMAGs in blue).
TABLE 5.
All 91 differentially expressed genes (DEGs) of FAMRGs were detected from 4 cancer datasets.
| Cancer type | Genes Name |
|---|---|
| Melanoma | MAPKAPK2 MAOA UBE2L6 KMT5A IL4I1 ACSL5 PSME1 PLA2G2D SYK NUDT19 PTPRG PON2 TWIST1 SUCLA2 |
| NSCLC | GAPDHS GK MAPKAPK2 BDH2 UBE2L6 IL4I1 GABARAPL1 ACSL5 PHYH PSME1 PLA2G2D SYK PTPRG ACSF3 ABCC1 HSDL2 P2RX7 TWIST1 PNPLA2 CBR1 |
| RCC | SLCO2B1 PON1 PLIN2 SLCO3A1 HSD17B4 PPARG CBR4 SLC43A3 PECR MTLN ACOT9 ECI2 ELOVL4 IVD PROCA1 GCDH SLC22A5 PPT2CR ABP2 CYP4F22 PTGR1 CRYZ HADHB ACSF3 AIG1 AKR1C3 MECR BCKDHB CBR1 |
| STAD | ANXA1 MDH1 PLA2G2A TPI1 PTGES3 SCD5 UBE2L6 GOT2 DLST MDH2 PHYH RDH11 PSME1 METAP1 GGT1 ERP29 HACD3 PLA2G15 ACAT2 IDI1 PTPRG CPOX AKT1 ECHDC2 HADHA CPT1A LTA4H RAP1GDS1 |
3.5. Identification of hub FAMRGs associated with the effectiveness of anti‐PD1 treatment
A total of 91 FAMRGs with differential expression were identified based on the Venn diagrams. To ascertain the correlation between FAMRGs and the therapeutic efficacy of PD‐1. First, we explored the functions of these genes in fatty acid metabolism (Table S2), second, we compare FAMRGs expression in human adjacent normal versus 24 types of tumor tissues by UALCAN database, the result showed that ACSL5, PLA2G2D, IL4I1, PROCA1, UBE2L6 and PSME1 were significantly upregulated in the most cancer types from TCGA (Figure 5A–F), especially in HNSCC sample (Figure 5G–L). Third, we used TIGER database (http://tiger.canceromics.org/) to compare differentially expressed FAMRGs. These results further showed that higher ACSL5 and PLA2G2D expression in melanoma responder samples compared to that in non‐responder samples. Meanwhile, the same result showed that the expression of IL4I1, PROCA1, UBE2L6 and PSME1 expression were notably elevated in responder tissues compared to non‐responder tissues in NSCLC, RCC and STAD, respectively (Figure 6A–F). Additionally, the overall survival analysis was conducted by Kaplan–Meier plotter database (http://kmplot.com/analysis/index.php?p=background), the results demonstrated that ACSL5 high expression in patients treated with anti‐PD1 therapy significantly prolonged OS compared to low expression, the same trend were also found in PLA2G2D, IL4I1, PROCA1, UBE2L6 and PSME1 (Figure 6G–L). Finally, these 6 FAMRGs were included in the biomarkers in predicting prognosis the efficiency of anti‐PD1 therapy.
FIGURE 5.

(A–F) Histogram of hub FAMRGs expression in 24 types of unpaired normal and normal tissues from TCGA using Wilcoxon rank‐sum test. (G–L) Histograms of hub FAMRGs in normal and HNSCC with significant differences from UALCAN portal.
FIGURE 6.
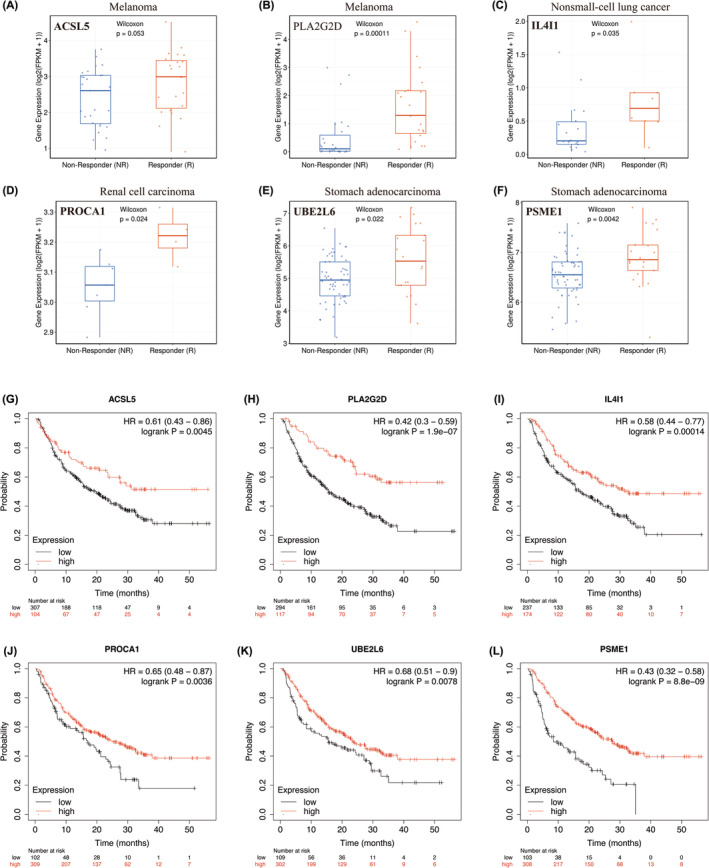
Correlation of hub FAMRGs expression with anti‐PD1 therapy response and prognostic value in cancer samples. (A, B). ACSL5 and PLA2G2D expression levels between responder and non‐responder samples in melanoma. (C) IL4I1 expression levels between responder and non‐responder samples in non‐small cell cancer. (D) PROCA1 expression level between responder and non‐responder samples in renal cell carcinoma. (E, F) UBE2L6 and PSME1 expression level between responder and non‐responder samples in stomach adenocarcinoma. (G–L) The Kaplan–Meier curves of the low and high FAMRGs expression in pan‐cancer patients treated with anti‐PD1 therapy (n = 520).
To explore whether the FAMRGs affect immune cell infiltration in tumor microenvironment, we conducted an analysis using the TIMER database to investigate the infiltration of 6 distinct immune cell types, including B cells, CD8+ T cells, CD4+ T cells, macrophages, neutrophils, and dendritic cells. The findings indicated a positive association between the expression of ACSL5 expression and CD8+ T cell (r = 0.405, p = 3.96e‐20), CD4+ T cell (r = 0.493, p = 8.28e‐31), negativity correlated with tumor purity (Figure 7A). Meanwhile, we evaluated the other hub FAMRGs with these 7 immune cells. The results demonstrated that the levels of PLA2G2D, PROCA1, IL4I1, UBE2L6 and PSME1 exhibited a positive correlation with CD8+ T cell, CD4+ T cell (Figure 7B–F).
FIGURE 7.

FAMRGs affect anti‐PD1 therapy efficiency through T cells infiltration. Correlation analysis of hub FAMRGs (A, ACSL5, B, PLA2G2D, C, IL4I1, D, PROCA1, E, UBE2L6, F, PSME1) and 7 immune cells infiltration from TIMER in HNSCC samples, including B cells, CD8+ T cells, CD4+ T cells, macrophages, neutrophils, dendritic cells. (G–L), Pearson correlation analysis between hub FAMRGs and PD‐1 level in HNSCC Patient characteristics.
To illustrate whether FAMRGs is correlated with the T cell exhaustion biomarker PD1 in HNSCC. We used GEPIA database to evaluate correlation of FAMRGs and PD1 in HNSCC samples. The result showed that ACSL5, PLA2G2D, PROCA1, IL4I1, UBE2L6 and PSME1 (Figure 7G–L) were positively correlated with PD1, respectively. In summary, the above results suggested that fatty acid metabolic process might affect the anti‐PD1 therapy efficiency through regulating immune cell infiltration, especially T cell exhaustion.
4. DISCUSSION
In the present study, we reveal that BMI levels can independently serve as indicators for predicting the efficacy of anti‐PD1 therapy in patients with OTSCC. Consistently, we confirm that BMI is positively correlation with PD1+ T cell in tumor microenvironment (TME). In mechanism, the GSEA and KEGG analyses revealed enrichment of fatty acid metabolism pathways in the responder group. Furthermore, we identified 6 FAMRGs (ACSL5, PLA2G2D, IL4I1, PROCA1, UBE2L6, PSME1) which were high expressed in anti‐PD1 therapy responders, presented a positive correlation with PD1 expression and the infiltration of immune cell. We believe that the results of this study provide the first dataset that assesses and validates the prognostic significance of BMI in predicting responses to immunotherapies in tongue cancer. Furthermore, our study highlights the critical role of fatty acid metabolism and T cell exhaustion in shaping the efficacy of immunotherapies.
Obesity is currently defined by an elevated BMI, typically because of excess adipose tissue (AT). In current research, ATs are characterized as heterogeneous organs that have a significant impact on the regulation of metabolism, 47 inflammation, 48 and anti‐tumor immune responses. 49 But, in recent years, some experts have identified an “obesity paradox”, wherein there is a simultaneous increase in the prevalence of obesity‐associated malignancies and studies investigating the impact of obesity on the efficacy of available antineoplastic therapies. 50 The response to immune checkpoint blockade (ICB) is generally more favorable among patients with obesity‐associated BMI compared to lean patients in NSCLC, melanoma and renal cell carcinoma. 51 This interesting research also reported in head and neck cancer that obesity is an important risk factor, 52 but cancer immunotherapy may exhibit greater anti‐tumor efficacy in obese patients. 53 , 54 , 55 Recent evidence suggested BMI at the time of clinical diagnosis was found to be an independent predictive factor for recurrence/metastasis head and neck squamous cell carcinoma patients using pembrolizumab, and the patients with normal weight have better prognosis than underweight. 56 Our findings are in accord with recent studies indicating that the response rate for immunotherapy in OTSCC patients with high BMI was much higher than patients with low BMI. The most importantly, to date, we found for the first time the prognostic contribution of BMI in OTSCC with immunotherapy.
In addition, we also explore the underlying mechanisms. As described above, by both clinical samples and online datasets analyses, our study showed that an increased prevalence of PD1+ exhausted CD8 T cells in the obese patients have better response to anti‐PD1 therapy. There are similarities with the current study, some researchers found that obesity‐associated increases in systemic leptin were responsible for promoting CD8 T cell exhaustion, as evidenced by elevated surface expression of PD‐1 on CD8 tumor‐infiltrating lymphocytes and loss of cytokine secretion and cytolytic activity. 28 While other studies have suggested that the chronically inflamed obese state and subsequent generation of exhausted T cells may enhance tumor progression while concurrently promoting an environment conductive to ICIs. Additionally, exhausted T cells can be subdivided into multiple populations based on their re‐activation potential, and some subpopulations are more responsive to PD‐1 blockade than others. 57 , 58 In summary, although some of these phenotypes may underlie ICI efficacy in obese cancer patients, the proposition that obesity‐mediated T cell exhaustion in reversed by checkpoint blockade is likely an over‐simplification. Therefore, a large number of studies is needed to further explore the mysteries and allow more patients to benefits from immunotherapy.
As is known to all, obesity is an abnormality of systematic metabolism. Obesity has been proved to induce increased levels of leptin, which affects anti‐tumor immunity by increasing PD‐1 expression and promoting T cell exhaustion. 28 While these impacts immune disorder, they allow for strengthened restoration of T cell activity following anti‐PD1 therapy. 59 It is a prove that systemic metabolism influences the tumor microenvironment (TME) and impact anti‐tumor immunity. Moreover, recent research has demonstrated that CD8+ effector T cells oxidize more fatty acids by the leptin STAT3 axis, which suppresses anti‐tumor immune responses in breast cancer. 60 Thus, the aim of this research was to investigate the influence of obesity on the response to anti‐PD1 therapy. This study did not find any notable variances in the infiltration of CD8+ T cells between two distinct groups when stratified by BMI, however, we show that increased PD‐1+ T cells have been associated with the responsiveness to anti‐PD1 therapy in the OTSCC clinical data. It is also possible that heightened PD‐1 expression on tumor‐infiltrating lymphocytes form patients with obesity simply provides an increased number of targets for engagement of anti‐PD1 antibodies. 28 Furthermore, we found local tumor metabolism influences the efficacy of anti‐PD1 therapy, and we obtain 6 FAMRGs positively associated with PD1 expression in OTSCC. At present, our study suggested that genes associated with fatty acid metabolism have the potential to serve as biomarkers for predicting and evaluating the effectiveness of immunotherapy in OSTCC.
According to the FAM molecular subtypes, we have identified 6 FAMRGs (ACLS5, PLA2G2D, PROCA1, IL4I1, UBE2L6) that could significantly contribute to the response of HNSCC patients undergoing anti‐PD1 therapy. Among the 6 hub FAMRGs, Prior research has indicated that the protein product produced by ACSL5 gene is responsible for converting unbound long chain Fatty Acids into fatty acyl‐coenzyme A, and plays a role in both the uptake of Fatty Acid and the synthesis of triacylglycerol. 61 ACSL5 involved in lipid metabolism and suggesting that it may play a vital role. 62 , 63 , 64 Besides, it has been reported by studies that ASCL5 has been identified as a potential prognostic factor and predictor of response to immunotherapy in cases of pancreatic and cutaneous melanoma cancer. 37 , 65 Analogously, our current findings in OTSCC align with previous studies indicating a positive correlation between the expression of PLA2G2D and immune infiltration, as well as a better prognosis observed in HNSCC, breast cancer, and cervical squamous cell carcinoma, 66 , 67 , 68 which aligns with the outcomes we have currently observed in OTSCC. Moreover, previous research revealed that the lipid metabolism‐associated prognostic signature has potential as a reliable biomarker for forecasting the effectiveness of chemotherapy and anti‐PD‐L1 therapy in colorectal carcinoma, which includes PROCA1. 69 The effects of IL4I1, UBE2L6 and PSME1 on immunotherapy have rarely been reported. We discovered these three newly potential predictor genes that may control the immunotherapy efficacy. Importantly, our research unveiled that these 6 hub FAMRGs possess the potential to serve as biomarkers for prognosticating the efficacy of immunotherapy in patients with HNSCC.
Although our findings are unprecedented, certain limitations are worth mentioning. Firstly, the limited number of clinical studies on neoadjuvant anti‐PD1 therapy in OTSCC patients is primarily attributed to the delayed incorporation of immunotherapy into their treatment protocol. In the future, we aim to recruit more patients who have undergone this treatment for further validation. Secondly, this study lacks the relevant molecular mechanism, and we will explore it in the future. Thirdly, although BMI has been widely used as a surrogate for obesity, it does not reflect more specific measures and the distribution of adipose tissue. Obesity can be more precisely defined by measuring body fat percentage or by medical imaging to assess the fat content in the future. We will delve deeper into this question in further research.
5. CONCLUSION
We identified that BMI could serve as promising prognostic biomarkers in OTSCC patients undergoing immunotherapy. And our findings demonstrate that obesity have profound effects on efficacy of anti‐PD1 therapy by regulating PD1+ T cell infiltration. In addition, OTSCC patients with enhancing fatty acid synthesis metabolism were more likely to respond to anti‐PD1 therapy by high expression of 6 FAMRGs, including ACSL5, PLA2G2D, IL4I1, PROCA1, UBE2L6, and PSME1. Thus, our study provides some novel and efficient biomarkers in predicting prognosis and in the efficiency of anti‐PD1 therapy, thus guiding to an effective therapeutic strategy and facilitating personalized immunotherapy in the future.
AUTHOR CONTRIBUTIONS
Xiyan Tan: Data curation (equal); formal analysis (equal); investigation (equal); methodology (equal); validation (equal); visualization (equal); writing – original draft (lead); writing – review and editing (equal). Guoli Li: Data curation (equal); formal analysis (equal); investigation (equal); methodology (equal); validation (equal); visualization (equal); writing – review and editing (equal). Honghao Deng: Investigation (equal). Guoming Xiao: Investigation (equal). Yaqin Wang: Funding acquisition (equal); writing – review and editing (equal). Chenzhi Zhang: Conceptualization (equal); data curation (equal); funding acquisition (equal); methodology (equal); project administration (equal); resources (equal); supervision (equal); validation (equal); writing – review and editing (equal). Yanfeng Chen: Conceptualization (equal); data curation (equal); funding acquisition (equal); methodology (equal); project administration (equal); resources (equal); supervision (equal); validation (equal); writing – review and editing (equal).
FUNDING INFORMATION
This work was supported by the National Natural Science Foundation of China (grant numbers 82,203,003), the Natural Science Foundation of Guangdong Province (grant numbers 2021A1515010602) and the Health & Medical Collaborative Innovation Project of Guangzhou City (202201011261).
CONFLICT OF INTEREST STATEMENT
The authors declare no conflict of interest.
ETHICS STATEMENT
The study was approved by the Sun Yat‐sen University Cancer Center Institutional Review Board and in accordance with the Helsinki declaration.
Supporting information
Figure S1. Kaplan–Meier plotter of PFS in different subgroups.
Figure S2. The heatmap of the top 50 DEGs between responder and non‐responder samples across four cancer types.
Table S1. Catalog of genes associated with fatty acid metabolism from MsigDB.
Table S2. Functional synopsis of differentially expressed FAMRGs.
Tan X, Li G, Deng H, et al. Obesity enhances the response to neoadjuvant anti‐PD1 therapy in oral tongue squamous cell carcinoma. Cancer Med. 2024;13:e7346. doi: 10.1002/cam4.7346
Xiyan Tan and Guoli Li have contributed equally to this work.
Contributor Information
Chenzhi Zhang, Email: zhangcz@sysucc.org.cn.
Yanfeng Chen, Email: chenyf@sysucc.org.cn.
DATA AVAILABILITY STATEMENT
All the data are available in a public, open‐access repository.
REFERENCES
- 1. Chow LQM. Head and neck cancer. N Engl J Med. 2020;382:60‐72. doi: 10.1056/NEJMra1715715 [DOI] [PubMed] [Google Scholar]
- 2. Siegel RL, Giaquinto AN, Jemal A. Cancer statistics, 2024. CA Cancer J Clin. 2024;74:12‐49. doi: 10.3322/caac.21820 [DOI] [PubMed] [Google Scholar]
- 3. Hussein AA, Helder MN, de Visscher JG, et al. Global incidence of oral and oropharynx cancer in patients younger than 45 years versus older patients: a systematic review. Eur J Cancer. 2017;82:115‐127. doi: 10.1016/j.ejca.2017.05.026 [DOI] [PubMed] [Google Scholar]
- 4. Kim YJ, Kim JH. Increasing incidence and improving survival of oral tongue squamous cell carcinoma. Sci Rep. 2020;10:7877. doi: 10.1038/s41598-020-64748-0 [DOI] [PMC free article] [PubMed] [Google Scholar]
- 5. Marta GN, William WN Jr, Feher O, Carvalho AL, Kowalski LP. Induction chemotherapy for oral cavity cancer patients: current status and future perspectives. Oral Oncol. 2015;51:1069‐1075. doi: 10.1016/j.oraloncology.2015.10.009 [DOI] [PubMed] [Google Scholar]
- 6. Schoenfeld JD, Hanna GJ, Jo VY, et al. Neoadjuvant nivolumab or nivolumab plus ipilimumab in untreated oral cavity squamous cell carcinoma: a phase 2 open‐label randomized clinical trial. JAMA Oncol. 2020;6:1563‐1570. doi: 10.1001/jamaoncol.2020.2955 [DOI] [PMC free article] [PubMed] [Google Scholar]
- 7. Borghaei H, Paz‐Ares L, Horn L, et al. Nivolumab versus docetaxel in advanced nonsquamous non‐small‐cell lung cancer. N Engl J Med. 2015;373:1627‐1639. doi: 10.1056/NEJMoa1507643 [DOI] [PMC free article] [PubMed] [Google Scholar]
- 8. Khunger M, Hernandez AV, Pasupuleti V, et al. Programmed cell death 1 (PD‐1) ligand (PD‐L1) expression in solid tumors as a predictive biomarker of benefit from PD‐1/PD‐L1 axis inhibitors: a systematic review and meta‐analysis. JCO Precis Oncol. 2017;1:1‐15. doi: 10.1200/po.16.00030 [DOI] [PubMed] [Google Scholar]
- 9. Hao X, Chen Z, Li H, Wei M, Zuo Z, Su Q. Small‐molecule drugs in immunotherapy. Mini Rev Med Chem. 2022;23:1341‐1359. doi: 10.2174/1389557522666220930154527 [DOI] [PubMed] [Google Scholar]
- 10. Ferris RL, Blumenschein G Jr, Fayette J, et al. Nivolumab for recurrent squamous‐cell carcinoma of the head and neck. N Engl J Med. 2016;375:1856‐1867. doi: 10.1056/NEJMoa1602252 [DOI] [PMC free article] [PubMed] [Google Scholar]
- 11. Seiwert TY, Burtness B, Mehra R, et al. Safety and clinical activity of pembrolizumab for treatment of recurrent or metastatic squamous cell carcinoma of the head and neck (KEYNOTE‐012): an open‐label, multicentre, phase 1b trial. Lancet Oncol. 2016;17:956‐965. doi: 10.1016/S1470-2045(16)30066-3 [DOI] [PubMed] [Google Scholar]
- 12. Burtness B, Harrington KJ, Greil R, et al. Pembrolizumab alone or with chemotherapy versus cetuximab with chemotherapy for recurrent or metastatic squamous cell carcinoma of the head and neck (KEYNOTE‐048): a randomised, open‐label, phase 3 study. Lancet. 2019;394:1915‐1928. doi: 10.1016/S0140-6736(19)32591-7 [DOI] [PubMed] [Google Scholar]
- 13. Hermann RM, Christiansen H. Pembrolizumab is more effective and better tolerable than methotrexate, docetaxel, or cetuximab in recurrent or metastatic HNSCC (KEYNOTE‐040). Strahlenther Onkol. 2019;195:851‐854. doi: 10.1007/s00066-019-01485-y [DOI] [PubMed] [Google Scholar]
- 14. Uppaluri R, Campbell KM, Egloff AM, et al. Neoadjuvant and adjuvant pembrolizumab in resectable locally advanced, human papillomavirus‐unrelated head and neck cancer: a multicenter, phase II trial. Clin Cancer Res. 2020;26:5140‐5152. doi: 10.1158/1078-0432.Ccr-20-1695 [DOI] [PMC free article] [PubMed] [Google Scholar]
- 15. Ferrarotto R, Bell D, Rubin ML, et al. Impact of neoadjuvant durvalumab with or without tremelimumab on CD8(+) tumor lymphocyte density, safety, and efficacy in patients with oropharynx cancer: CIAO trial results. Clin Cancer Res. 2020;26:3211‐3219. doi: 10.1158/1078-0432.Ccr-19-3977 [DOI] [PMC free article] [PubMed] [Google Scholar]
- 16. Scully C, Bagan J. Oral squamous cell carcinoma: overview of current understanding of aetiopathogenesis and clinical implications. Oral Dis. 2009;15:388‐399. doi: 10.1111/j.1601-0825.2009.01563.x [DOI] [PubMed] [Google Scholar]
- 17. Lin NN, Wang P, Zhao D, Zhang FJ, Yang K, Chen R. Significance of oral cancer‐associated fibroblasts in angiogenesis, lymphangiogenesis, and tumor invasion in oral squamous cell carcinoma. J Oral Pathol Med. 2017;46:21‐30. doi: 10.1111/jop.12452 [DOI] [PubMed] [Google Scholar]
- 18. Bhaskaran K, Douglas I, Forbes H, dos‐Santos‐Silva I, Leon DA, Smeeth L. Body‐mass index and risk of 22 specific cancers: a population‐based cohort study of 5·24 million UK adults. Lancet. 2014;384:755‐765. doi: 10.1016/s0140-6736(14)60892-8 [DOI] [PMC free article] [PubMed] [Google Scholar]
- 19. Trends in adult body‐mass index in 200 countries from 1975 to 2014: a pooled analysis of 1698 population‐based measurement studies with 19·2 million participants. Lancet. 2016;387:1377‐1396. doi: 10.1016/s0140-6736(16)30054-x [DOI] [PMC free article] [PubMed] [Google Scholar]
- 20. McLaughlin T, Ackerman SE, Shen L, Engleman E. Role of innate and adaptive immunity in obesity‐associated metabolic disease. J Clin Invest. 2017;127:5‐13. doi: 10.1172/jci88876 [DOI] [PMC free article] [PubMed] [Google Scholar]
- 21. Buck MD, O'Sullivan D, Pearce EL. T cell metabolism drives immunity. J Exp Med. 2015;212:1345‐1360. doi: 10.1084/jem.20151159 [DOI] [PMC free article] [PubMed] [Google Scholar]
- 22. Khalil DN, Smith EL, Brentjens RJ, Wolchok JD. The future of cancer treatment: immunomodulation, CARs and combination immunotherapy. Nat Rev Clin Oncol. 2016;13:273‐290. doi: 10.1038/nrclinonc.2016.25 [DOI] [PMC free article] [PubMed] [Google Scholar]
- 23. Aguilar EG, Murphy WJ. Obesity induced T cell dysfunction and implications for cancer immunotherapy. Curr Opin Immunol. 2018;51:181‐186. doi: 10.1016/j.coi.2018.03.012 [DOI] [PMC free article] [PubMed] [Google Scholar]
- 24. Desharnais L, Walsh LA, Quail DF. Exploiting the obesity‐associated immune microenvironment for cancer therapeutics. Pharmacol Ther. 2022;229:107923. doi: 10.1016/j.pharmthera.2021.107923 [DOI] [PubMed] [Google Scholar]
- 25. Dyck L, Prendeville H, Raverdeau M, et al. Suppressive effects of the obese tumor microenvironment on CD8 T cell infiltration and effector function. J Exp Med. 2022;219:e20210042. doi: 10.1084/jem.20210042 [DOI] [PMC free article] [PubMed] [Google Scholar]
- 26. Ringel AE, Drijvers JM, Baker GJ, et al. Obesity shapes metabolism in the tumor microenvironment to suppress anti‐tumor immunity. Cell. 2020;183:1848‐1866.e1826. doi: 10.1016/j.cell.2020.11.009 [DOI] [PMC free article] [PubMed] [Google Scholar]
- 27. Pingili AK, Chaib M, Sipe LM, et al. Immune checkpoint blockade reprograms systemic immune landscape and tumor microenvironment in obesity‐associated breast cancer. Cell Rep. 2021;35:109285. doi: 10.1016/j.celrep.2021.109285 [DOI] [PMC free article] [PubMed] [Google Scholar]
- 28. Wang Z, Aguilar EG, Luna JI, et al. Paradoxical effects of obesity on T cell function during tumor progression and PD‐1 checkpoint blockade. Nat Med. 2019;25:141‐151. doi: 10.1038/s41591-018-0221-5 [DOI] [PMC free article] [PubMed] [Google Scholar]
- 29. McQuade JL, Daniel CR, Hess KR, et al. Association of body‐mass index and outcomes in patients with metastatic melanoma treated with targeted therapy, immunotherapy, or chemotherapy: a retrospective, multicohort analysis. Lancet Oncol. 2018;19:310‐322. doi: 10.1016/s1470-2045(18)30078-0 [DOI] [PMC free article] [PubMed] [Google Scholar]
- 30. Lee JH, Kang D, Ahn JS, Guallar E, Cho J, Lee HY. Obesity paradox in patients with non‐small cell lung cancer undergoing immune checkpoint inhibitor therapy. J Cachexia Sarcopenia Muscle. 2023;14:2898‐2907. doi: 10.1002/jcsm.13367 [DOI] [PMC free article] [PubMed] [Google Scholar]
- 31. Hahn AW, Menk AV, Rivadeneira DB, et al. Obesity is associated with altered tumor metabolism in metastatic melanoma. Clin Cancer Res. 2023;29:154‐164. doi: 10.1158/1078-0432.Ccr-22-2661 [DOI] [PMC free article] [PubMed] [Google Scholar]
- 32. Currie E, Schulze A, Zechner R, Walther TC, Farese RV Jr. Cellular fatty acid metabolism and cancer. Cell Metab. 2013;18:153‐161. doi: 10.1016/j.cmet.2013.05.017 [DOI] [PMC free article] [PubMed] [Google Scholar]
- 33. Carracedo A, Cantley LC, Pandolfi PP. Cancer metabolism: fatty acid oxidation in the limelight. Nat Rev Cancer. 2013;13:227‐232. doi: 10.1038/nrc3483 [DOI] [PMC free article] [PubMed] [Google Scholar]
- 34. Luo Y, Wang H, Liu B, Wei J. Fatty acid metabolism and cancer immunotherapy. Curr Oncol Rep. 2022;24:659‐670. doi: 10.1007/s11912-022-01223-1 [DOI] [PubMed] [Google Scholar]
- 35. Xiong Q, Feng D, Wang Z, et al. Fatty acid synthase is the key regulator of fatty acid metabolism and is related to immunotherapy in bladder cancer. Front Immunol. 2022;13:836939. doi: 10.3389/fimmu.2022.836939 [DOI] [PMC free article] [PubMed] [Google Scholar]
- 36. Dong Y, Zhao Z, Simayi M, et al. Transcriptome profiles of fatty acid metabolism‐related genes and immune infiltrates identify hot tumors for immunotherapy in cutaneous melanoma. Front Genet. 2022;13:860067. doi: 10.3389/fgene.2022.860067 [DOI] [PMC free article] [PubMed] [Google Scholar]
- 37. Xu Y, Chen Y, Jiang W, et al. Identification of fatty acid metabolism‐related molecular subtype biomarkers and their correlation with immune checkpoints in cutaneous melanoma. Front Immunol. 2022;13:967277. doi: 10.3389/fimmu.2022.967277 [DOI] [PMC free article] [PubMed] [Google Scholar]
- 38. Li T, Fan J, Wang B, et al. TIMER: a web server for comprehensive analysis of tumor‐infiltrating immune cells. Cancer Res. 2017;77:e108‐e110. doi: 10.1158/0008-5472.Can-17-0307 [DOI] [PMC free article] [PubMed] [Google Scholar]
- 39. Li B, Severson E, Pignon JC, et al. Comprehensive analyses of tumor immunity: implications for cancer immunotherapy. Genome Biol. 2016;17:174. doi: 10.1186/s13059-016-1028-7 [DOI] [PMC free article] [PubMed] [Google Scholar]
- 40. Liberzon A, Subramanian A, Pinchback R, Thorvaldsdóttir H, Tamayo P, Mesirov JP. Molecular signatures database (MSigDB) 3.0. Bioinformatics. 2011;27:1739‐1740. doi: 10.1093/bioinformatics/btr260 [DOI] [PMC free article] [PubMed] [Google Scholar]
- 41. Pan XF, Wang L, Pan A. Epidemiology and determinants of obesity in China. Lancet Diabetes Endocrinol. 2021;9:373‐392. doi: 10.1016/s2213-8587(21)00045-0 [DOI] [PubMed] [Google Scholar]
- 42. Chen K, Shen Z, Gu W, et al. Prevalence of obesity and associated complications in China: a cross‐sectional, real‐world study in 15.8 million adults. Diabetes Obes Metab. 2023;25:3390‐3399. doi: 10.1111/dom.15238 [DOI] [PubMed] [Google Scholar]
- 43. Iyengar NM, Hudis CA, Dannenberg AJ. Obesity and cancer: local and systemic mechanisms. Annu Rev Med. 2015;66:297‐309. doi: 10.1146/annurev-med-050913-022228 [DOI] [PubMed] [Google Scholar]
- 44. Howe LR, Subbaramaiah K, Hudis CA, Dannenberg AJ. Molecular pathways: adipose inflammation as a mediator of obesity‐associated cancer. Clin Cancer Res. 2013;19:6074‐6083. doi: 10.1158/1078-0432.Ccr-12-2603 [DOI] [PMC free article] [PubMed] [Google Scholar]
- 45. Rosen ED, Spiegelman BM. What we talk about when we talk about fat. Cell. 2014;156:20‐44. doi: 10.1016/j.cell.2013.12.012 [DOI] [PMC free article] [PubMed] [Google Scholar]
- 46. Canter RJ, Le CT, Beerthuijzen JMT, Murphy WJ. Obesity as an immune‐modifying factor in cancer immunotherapy. J Leukoc Biol. 2018;104:487‐497. doi: 10.1002/jlb.5ri1017-401rr [DOI] [PMC free article] [PubMed] [Google Scholar]
- 47. Bosello O, Zamboni M. Visceral obesity and metabolic syndrome. Obes Rev. 2000;1:47‐56. doi: 10.1046/j.1467-789x.2000.00008.x [DOI] [PubMed] [Google Scholar]
- 48. Yang H, Youm YH, Vandanmagsar B, et al. Obesity increases the production of proinflammatory mediators from adipose tissue T cells and compromises TCR repertoire diversity: implications for systemic inflammation and insulin resistance. J Immunol. 2010;185:1836‐1845. doi: 10.4049/jimmunol.1000021 [DOI] [PMC free article] [PubMed] [Google Scholar]
- 49. Woodall MJ, Neumann S, Campbell K, Pattison ST, Young SL. The effects of obesity on anti‐cancer immunity and cancer immunotherapy. Cancers (Basel). 2020;12:1230. doi: 10.3390/cancers12051230 [DOI] [PMC free article] [PubMed] [Google Scholar]
- 50. Kichenadasse G, Miners JO, Mangoni AA, Rowland A, Hopkins AM, Sorich MJ. Association between body mass index and overall survival with immune checkpoint inhibitor therapy for advanced non‐small cell lung cancer. JAMA Oncol. 2020;6:512‐518. doi: 10.1001/jamaoncol.2019.5241 [DOI] [PMC free article] [PubMed] [Google Scholar]
- 51. Cortellini A, Bersanelli M, Buti S, et al. A multicenter study of body mass index in cancer patients treated with anti‐PD‐1/PD‐L1 immune checkpoint inhibitors: when overweight becomes favorable. J Immunother Cancer. 2019;7:57. doi: 10.1186/s40425-019-0527-y [DOI] [PMC free article] [PubMed] [Google Scholar]
- 52. Wang K, Yu XH, Tang YJ, Tang YL, Liang XH. Obesity: an emerging driver of head and neck cancer. Life Sci. 2019;233:116687. doi: 10.1016/j.lfs.2019.116687 [DOI] [PubMed] [Google Scholar]
- 53. Peng J, Hu Q, Chen X, et al. Diet‐induced obesity accelerates oral carcinogenesis by recruitment and functional enhancement of myeloid‐derived suppressor cells. Cell Death Dis. 2021;12:946. doi: 10.1038/s41419-021-04217-2 [DOI] [PMC free article] [PubMed] [Google Scholar]
- 54. Iyengar NM, Kochhar A, Morris PG, et al. Impact of obesity on the survival of patients with early‐stage squamous cell carcinoma of the oral tongue. Cancer. 2014;120:983‐991. doi: 10.1002/cncr.28532 [DOI] [PMC free article] [PubMed] [Google Scholar]
- 55. Hicks DF, Bakst R, Doucette J, et al. Impact of obesity on outcomes for patients with head and neck cancer. Oral Oncol. 2018;83:11‐17. doi: 10.1016/j.oraloncology.2018.05.027 [DOI] [PubMed] [Google Scholar]
- 56. Zhang X, Rui M, Lin C, et al. The association between body mass index and efficacy of pembrolizumab as second‐line therapy in patients with recurrent/metastatic head and neck squamous cell carcinoma. Cancer Med. 2023;12:2702‐2712. doi: 10.1002/cam4.5152 [DOI] [PMC free article] [PubMed] [Google Scholar]
- 57. Miller BC, Sen DR, al Abosy R, et al. Subsets of exhausted CD8(+) T cells differentially mediate tumor control and respond to checkpoint blockade. Nat Immunol. 2019;20:326‐336. doi: 10.1038/s41590-019-0312-6 [DOI] [PMC free article] [PubMed] [Google Scholar]
- 58. Beltra JC, Manne S, Abdel‐Hakeem MS, et al. Developmental relationships of four exhausted CD8(+) T cell subsets reveals underlying transcriptional and epigenetic landscape control mechanisms. Immunity. 2020;52:825‐841.e828. doi: 10.1016/j.immuni.2020.04.014 [DOI] [PMC free article] [PubMed] [Google Scholar]
- 59. Wang Y, Zhou S, Yang F, et al. Treatment‐related adverse events of PD‐1 and PD‐L1 inhibitors in clinical trials: a systematic review and meta‐analysis. JAMA Oncol. 2019;5:1008‐1019. doi: 10.1001/jamaoncol.2019.0393 [DOI] [PMC free article] [PubMed] [Google Scholar]
- 60. Zhang C, Yue C, Herrmann A, et al. STAT3 activation‐induced fatty acid oxidation in CD8(+) T effector cells is critical for obesity‐promoted breast tumor growth. Cell Metab. 2020;31:148‐161.e145. doi: 10.1016/j.cmet.2019.10.013 [DOI] [PMC free article] [PubMed] [Google Scholar]
- 61. Senkal CE, Salama MF, Snider AJ, et al. Ceramide is metabolized to Acylceramide and stored in lipid droplets. Cell Metab. 2017;25:686‐697. doi: 10.1016/j.cmet.2017.02.010 [DOI] [PMC free article] [PubMed] [Google Scholar]
- 62. Xia Q, Chesi A, Manduchi E, et al. The type 2 diabetes presumed causal variant within TCF7L2 resides in an element that controls the expression of ACSL5. Diabetologia. 2016;59:2360‐2368. doi: 10.1007/s00125-016-4077-2 [DOI] [PubMed] [Google Scholar]
- 63. Bowman TA, O'Keeffe KR, D'Aquila T, et al. Acyl CoA synthetase 5 (ACSL5) ablation in mice increases energy expenditure and insulin sensitivity and delays fat absorption. Mol Metab. 2016;5:210‐220. doi: 10.1016/j.molmet.2016.01.001 [DOI] [PMC free article] [PubMed] [Google Scholar]
- 64. Luo Q, das A, Oldoni F, et al. Role of ACSL5 in fatty acid metabolism. Heliyon. 2023;9:e13316. doi: 10.1016/j.heliyon.2023.e13316 [DOI] [PMC free article] [PubMed] [Google Scholar]
- 65. Ma W, Li T, Wu S, Li J, Wang X, Li H. LOX and ACSL5 as potential relapse markers for pancreatic cancer patients. Cancer Biol Ther. 2019;20:787‐798. doi: 10.1080/15384047.2018.1564565 [DOI] [PMC free article] [PubMed] [Google Scholar]
- 66. Xiong Y, Si Y, Feng Y, Zhuo S, Cui B, Zhang Z. Prognostic value of lipid metabolism‐related genes in head and neck squamous cell carcinoma. Immun Inflamm Dis. 2021;9:196‐209. doi: 10.1002/iid3.379 [DOI] [PMC free article] [PubMed] [Google Scholar]
- 67. Ye Z, Zou S, Niu Z, Xu Z, Hu Y. A novel risk model based on lipid metabolism‐associated genes predicts prognosis and indicates immune microenvironment in breast cancer. Front Cell Dev Biol. 2021;9:691676. doi: 10.3389/fcell.2021.691676 [DOI] [PMC free article] [PubMed] [Google Scholar]
- 68. Liu H, Xu R, Gao C, et al. Metabolic molecule PLA2G2D is a potential prognostic biomarker correlating with immune cell infiltration and the expression of immune checkpoint genes in cervical squamous cell carcinoma. Front Oncol. 2021;11:755668. doi: 10.3389/fonc.2021.755668 [DOI] [PMC free article] [PubMed] [Google Scholar]
- 69. Yang C, Huang S, Cao F, Zheng Y. A lipid metabolism‐related genes prognosis biomarker associated with the tumor immune microenvironment in colorectal carcinoma. BMC Cancer. 2021;21:1182. doi: 10.1186/s12885-021-08902-5 [DOI] [PMC free article] [PubMed] [Google Scholar]
Associated Data
This section collects any data citations, data availability statements, or supplementary materials included in this article.
Supplementary Materials
Figure S1. Kaplan–Meier plotter of PFS in different subgroups.
Figure S2. The heatmap of the top 50 DEGs between responder and non‐responder samples across four cancer types.
Table S1. Catalog of genes associated with fatty acid metabolism from MsigDB.
Table S2. Functional synopsis of differentially expressed FAMRGs.
Data Availability Statement
All the data are available in a public, open‐access repository.