



Abstract
Fracture risk increases with lower areal bone mineral density (aBMD); however, aBMD-related estimate of risk may decrease with age. This may depend on technical limitations of 2-dimensional (2D) dual energy X-ray absorptiometry (DXA) which are reduced with 3D high-resolution peripheral quantitative computed tomography (HR-pQCT). Our aim was to examine whether the predictive utility of HR-pQCT measures with fracture varies with age. We analyzed associations of HR-pQCT measures at the distal radius and distal tibia with two outcomes: incident fractures and major osteoporotic fractures. We censored follow-up time at first fracture, death, last contact or 8 years after baseline. We estimated hazard ratios (HR) and 95%CI for the association between bone traits and fracture incidence across age quintiles. Among 6835 men and women (ages 40–96) with at least one valid baseline HR-pQCT scan who were followed prospectively for a median of 48.3 months, 681 sustained fractures. After adjustment for confounders, bone parameters at both the radius and tibia were associated with higher fracture risk. The estimated HRs for fracture did not vary significantly across age quintiles for any HR-pQCT parameter measured at either the radius or tibia. In this large cohort, the homogeneity of the associations between the HR-pQCT measures and fracture risk across age groups persisted for all fractures and for major osteoporotic fractures. The patterns were similar regardless of the HR-pQCT measure, the type of fracture, or the statistical models. The stability of the associations between HR-pQCT measures and fracture over a broad age range shows that bone deficits or low volumetric density remain major determinants of fracture risk regardless of age group. The lower risk for fractures across measures of aBMD in older adults in other studies may be related to factors which interfere with DXA but not with HR-pQCT measures.
Keywords: fracture risk, high resolution peripheral quantitative computed tomography, cohort study, osteoporosis
Introduction
Osteoporosis is characterized by low bone mass and deterioration of bone microarchitecture, which increase the risk of fracture. The main diagnostic criterion of osteoporosis is low areal bone mineral density (aBMD) measured by dual energy X-ray absorptiometry (DXA).1 Fracture risk increases with decreasing aBMD2; however, the estimates of risk may vary by age group in older adults. In some,3–9 but not all,10–13 studies, the magnitude of the association between aBMD and fracture decreased with increasing age, such that aBMD was less predictive of fracture risk in the oldest age groups (>85 years of age). The associations between aBMD and fracture with age have not been consistent: some report risks slightly increased,3,9,13,14 others reported decreased risk with age,6,12,14–20 or the fracture risk did not vary7,8,10,11,20,21 across the age ranges of older adults. Also the ages considered within older adult age groups varied with some having lower older adult age limits from 50 to 65 years. Most considered the oldest age group as >85 years of age. Decreases in fracture risk in these previous studies ranged from attenuation to null with loss of statistical significance, and estimated risks also varied by fracture site, sex, site of aBMD measurement and confounders included in statistical modeling.
The association between low aBMD and fracture may decrease with increasing age for several reasons. In clinical studies, the discordances may partly depend on the design of the study (age range, skeletal site of DXA). The association between aBMD and fracture risk may also decrease with age due to excess mortality of the oldest individuals with lower aBMD.22,23 Areal BMD may become less important with age as a risk factor for fracture, whereas high risk of falls may be more important. However, in clinical practice, this may be taken into account with a patient’s medical history and clinical reasoning.
The decreased strength of association between aBMD and risk of hip fracture with increasing age may partly depend on technical limitations of DXA which is a two-dimensional (2D) imaging method. Reduced joint mobility renders positioning for DXA difficult (e.g., rotation of the femur). Calcification adjacent to bone (e.g., in the abdominal aorta or osteophytes at the hip) may bias the aBMD measure.24 The differences in risk with age may partly depend on bone microarchitecture of the aBMD skeletal site. In women, trabecular bone loss typically starts soon after menopause, whereas cortical bone loss accelerates after the age of 70 years.25 However, DXA does not allow one to distinguish cortical and trabecular bone.
The impact of the limitations inherent to 2D DXA may be reduced with the 3D high-resolution peripheral quantitative computed tomography (HR-pQCT). HR-pQCT is a noninvasive method, assessing bone microarchitecture at the distal radius and distal tibia, and can distinguish cortical and trabecular bone compartments.26 HR-pQCT provides both bone densities as well as bone morphology, and can be used to estimate bone strength from microfinite element analysis (μFEA). HR-pQCT measures predicted fractures independently of aBMD and FRAX in several studies.27–34 It is unknown if the association between HR-pQCT measures of bone and subsequent fracture risk also decreases with increasing age, as seen with DXA. If the estimates of fracture risk related to the HR-pQCT measures are homogeneous across older age groups, it would indicate that HR-pQCT may be a valid tool allowing for detection of individuals at high risk of fracture regardless of age, especially in those of very advanced ages.
Therefore, our aim was to determine whether the association of HR-pQCT parameters with fracture risk varies with age group in older adults. Our hypothesis was that the predictive utility of HR-pQCT does not vary across older age groups, regardless of the site of fracture or statistical model (e.g., adjusted for aBMD).
Materials and methods
Study design and participants
The Bone Microarchitecture International Consortium (BoMIC) is a multicenter prospective study.25 It includes seven cohorts: the Framingham Study and the Mayo Clinic in the United States, Canadian Multicenter Osteoporosis Study (CaMos) in Canada, Qualité Osseuse Lyon Orléans (QUALYOR), Os des Femmes de Lyon (OFELY) and Structure of the Aging Men’s Bone (STRAMBO) in France and Geneva Retirees Cohort (GERICO) in Switzerland.28–30,32–37 Men and women from the longitudinal Framingham Offspring Cohort (adult children and spouses of members of the population-based Framingham Heart Study) had an HR-pQCT scan in 2012-2016.36 Women and men from the Mayo study were a part of the cohort including an age-stratified, random sample of residents from Rochester, MN who were selected using the medical records linkage of the Rochester Epidemiology Project.35 The participants from the Calgary sub-cohort of the multicenter CaMos study comprised men and women from the CaMos cohort with additional recruitment of younger subjects.33 QUALYOR is a prospective longitudinal population-based study conducted in Orléans and Lyon including postmenopausal women with a T-score − 1.0 to −3.0 and without prior fragility fracture.37 The OFELY cohort is a prospective study of the determinants of bone loss in women started in 1992.29 Women who had HR-pQCT in 2006-2008 participated in this study. The STRAMBO study is a single-center prospective population-based cohort study of the skeletal fragility and its determinants in men who had the HR-pQCT scan in 2006-2008.34 The GERICO cohort is a prospective study of the risk factors of fracture in retired women (aged 63–67) from the Geneva are recruited in 2008-2011.30 All the BOMIC cohorts are followed over time for subsequent fracture.
Each of the study cohorts evaluated risk factors for fracture, via clinical examinations, questionnaires, and fracture ascertainment. For each participant, follow-up time was defined as the time from baseline HR-pQCT scan to the first of the following events: fracture, death, last contact, or end of study (specific for each cohort). Participants provided written informed consent, and the Institutional Review Board for Human Research at Hebrew SeniorLife approved the study.
Incident fracture
We defined incident fracture as the first fracture (non-traumatic or traumatic) that occurred after HR-pQCT scanning.28 We excluded fractures of the skull, face, sternum, finger, and toe and pathological fractures. We included only incident clinical vertebral fractures. Fractures were ascertained by self-report and medical records with confirmation by health professionals. We considered two outcomes: all incident fractures and major osteoporotic fractures (MOF), defined as incident fractures of the proximal humerus, distal forearm, clinical vertebral, or hip.38
High-resolution peripheral quantitative computed tomography
Volumetric BMD and bone microarchitecture were assessed at the distal radius and distal tibia using HR-pQCT (XtremeCT, Scanco Medical AG, Brüttisellen, Switzerland). In all the cohorts, the scans were obtained using the previously described standardized protocol and the standard software (V6.0).26,28,39,40 If a participant reported a fracture or had metal in the scan region, then the contralateral limb was scanned. Longitudinal stability was monitored by daily scanning of a quality control phantom (QRM, Moehrendorf, Germany). Scans were graded using a 5-point motion artifact scale,41 ranging from none, minor, moderate, severe or extreme. For density measures, scans with movement artifact grades of 1–4 were retained in analyses, whereas only grades 1–3 were kept for the microarchitectural measures. The central coordinating site reviewed the data from each cohort for outliers and consistency. All groups used the same generation scanner, and operators followed the same protocol for scan acquisition and analysis. Bone scans were acquired with imaging at a fixed distance from the distal endplate of the radius or tibia. Overall, 76 tibia scans and 436 radius scans were excluded due to motion artifact.
Micro-finite element analysis
Linear micro-finite element analysis (μFEA; IPLFE, Scanco Medical AG for OFELY, and GERICO; FAIM v6.0, Numerics88 Solutions Inc. for Framingham, CaMos, and Mayo Clinic; FAIM v8.0, for QUALYOR and STRAMBO) was performed as previously described.2-43 Axial compression conditions were applied with 1% apparent strain. Failure load (Newtons, N) and boundary conditions were defined as described previously.42,43 The calibration curves used to standardize different modeling boundary conditions and tissue moduli across cohorts were previously generated with a subset of the BoMIC cohorts (N = 1371).44
Areal BMD by DXA
Areal BMD at the femoral neck (FN aBMD) was assessed by Hologic scanners in QUALYOR, Gerico, STRAMBO, and OFELY cohorts. The Framingham and Mayo Clinic cohorts used scanners from GE Lunar, and CaMos used both Hologic and GE Lunar scanners depending on the clinical site. We standardized FN aBMD values and calculated T-scores using published equations.45
Covariates
Information on covariates was obtained at the time of HR-pQCT scanning. Weight and height were measured using standardized methods. Information on age and osteoporosis medication was self-reported. History of fracture during adulthood was checked via questionnaire and active surveillance in each cohort.28 Prior fracture included non-traumatic and traumatic fracture throughout adulthood, excluding fracture of the skull, finger, toe, hand, foot, ankle, and pathologic fracture.
Statistical analysis
We used individual level data from each cohort to perform the analysis. Two outcomes were considered: all incident fractures and MOF. Follow-up time was censored at 8 years after baseline or before (fracture, death, last contact, loss to follow-up) because few participants were followed for more than 8 years and the assumption of proportional hazard was violated beyond this point. Thus, the follow-up was truncated to 8 years. We used analysis of variance to assess the general association of continuous variables with Gaussian distribution with age quintiles and linear regression to assess the trend across the quintiles. We used Kruskal–Wallis tests to assess general associations of continuous variables with skewed distribution with age quintiles and linear regression with log-transformed variables to assess the trend across the age quintiles. Chi-squared tests were used to assess general association of categorical variables with age quintiles and to test for trends across the age quintiles. We used Cox proportional hazard regression models to calculate hazard ratios (HRs) and 95% confidence intervals (CI) for the association between individual bone parameters and incidence of fracture (all fractures and MOF). HRs were expressed per one standard deviation (SD) in the expected direction of higher fracture risk. The primary multivariable models included age (year), sex, cohort, height (cm), weight (kg), and FN aBMD (g/cm2). When we conducted age-stratified analyses, age (years) was retained in the model to adjust for potential residual confounding within age groups. We selected the bone parameters to examine that were previously demonstrated in our prior work to be most predictive for fracture.28 To test for homogeneity of HRs across age quintiles, we tested the interaction between age quintile (as a categorical variable) and each bone parameter. To test whether the HRs increased linearly across age quintiles, we tested the interaction between age quintile (as a continuous variable) and bone parameter. We evaluated the independence of Schoenfeld residuals over time to validate the assumption of proportional hazards. A P-value of <0.05 was considered statistically significant. All statistical analyses were done with SAS version 9.4.
Results
Our study was comprised of 6835 participants (2012 men, and 4823 women), aged 40 to 96 years, with at least one HR-pQCT scan at baseline. The participants were followed prospectively for a median of 48.3 months [interquartile range (IQR): 36.7; 76.1]. Over 8 years, 681 participants had fractures. The median time to first fracture was 30.0 months [IQR: 16.0; 49.1]. The percentage of men and also of participants with prior fractures or anti-osteoporotic treatment increased across age quintiles (Table 1). Average BMI and FRAX values (for both hip fracture and MOF) increased across age quintiles, whereas average FN aBMD decreased.
Table 1.
Descriptive characteristics of participants by age quintile (means and standard deviations are shown unless otherwise noted).
| Age quintiles | 40–62 years | >62–65.5 years | >65.5–69 years | >69–75.2 years | >75.2–96 years | Trend, P |
|---|---|---|---|---|---|---|
| n | 1374 | 1361 | 1413 | 1321 | 1366 | |
| Age (yr) | 56 ± 6.1 | 64 ± 0.8 | 67 ± 1.1 | 72 ± 1.7 | 81 ± 3.7 | <0.001 |
| Women (n, %) | 1092 (79) | 1031 (76) | 1047 (74) | 863 (66) | 791 (58) | <0.001 |
| Weight (kg) | 70 ± 16.8 | 70 ± 14.5 | 71 ± 15.4 | 72 ± 15.6 | 72 ± 14.6 | <0.001 |
| Height (cm) | 164 ± 8.5 | 164 ± 8.4 | 164 ± 8.7 | 163 ± 8.5 | 162 ± 8.2 | <0.001 |
| BMI (kg/m2) | 25.8 ± 5.14 | 26.0 ± 4.75 | 26.4 ± 4.81 | 27.3 ± 4.72 | 27.3 ± 4.54 | <0.001 |
| Prior fracture (n,%) | 176 (13) | 315 (23) | 350 (25) | 317 (24) | 473 (35) | <0.001 |
| Anti-osteoporotic treatment (n,%) | 90 (6.6%) | 191 (14.0) | 183 (13.0) | 140 (10.6) | 186 (13.6) | <0.001 |
| Femoral neck aBMD (g/cm2) | 0.823 ± 0.131 | 0.799 ± 0.128 | 0.791 ± 0.125 | 0.789 ± 0.125 | 0.772 ± 0.140 | <0.001 |
| FRAX for MOF with FN aBMD** | 3.8 [2.8; 5.5] | 7.1 [4.6; 10.0] | 7.4 [5.1; 10.8] | 7.8 [5.5; 11.0] | 11.0 [6.8; 17.0] | <0.001 |
| FRAX for hip fracture with FN aBMD** | 0.40 [0.17; 0.80] | 0.80 [0.45; 1.50] | 1.10 [0.60; 2.00] | 1.80 [0.95; 3.10] | 3.43 [2.00; 5.68] | <0.001 |
| Missing or poor quality scans | ||||||
| Distal radius (n, %) | 47 (3.4) | 165 (12.1) | 153 (10.8) | 100 (7.6) | 171 (12.5) | <0.001 |
| Distal tibia (n, %) | 29 (2.1) | 36 (2.7) | 30 (2.1) | 37 (2.8) | 46 (3.4) | 0.052 |
**- skewed variable presented as median [and the interquartile range]
FN – femoral neck, aBMD – areal bone mineral density, MOF-major osteoporotic fractures
All fractures
Among the 6628 individuals having a distal radius scan, 546 were excluded from multivariable analyses due to poor scan quality or missing values (Figure 1). Among the remaining 6082 participants, 597 had incident fractures. Among the 6721 individuals having a distal tibia scan, 180 were excluded from multivariable analyses due to poor scan quality or missing values. Of the remaining 6541 participants, 657 had incident fractures.
Figure 1.
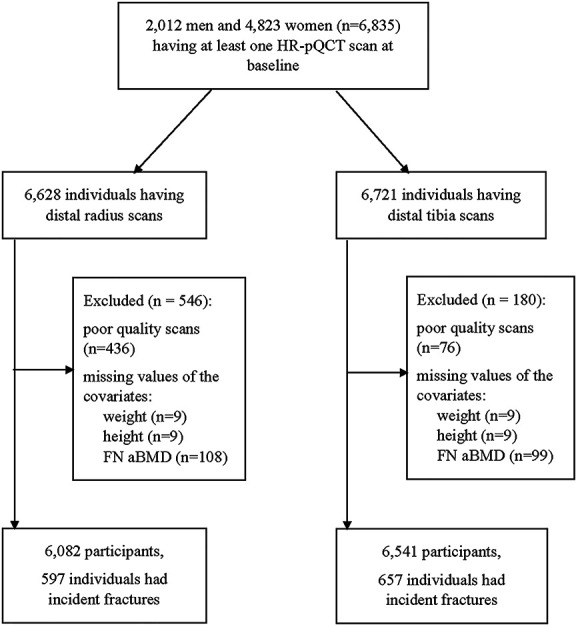
: Flowchart of study participants (ages 40–96), with at least one HR-pQCT scan at baseline, divided into valid radius and tibia scans, with exclusions due to poor scan quality or missing values, and the subsequent number of fractures over follow-up.
Most of the bone parameters at the distal radius and distal tibia were associated with higher fracture risk (Table 2), even after accounting for femoral neck aBMD and confounders in our study, as reported previously.28 The HR estimates of risk did not vary significantly across the quintiles for any of the HR-pQCT parameters at either radius or tibia (all interaction P-values >0.05; range 0.07–0.98). In addition, the P-value for trend across the age quintiles was not statistically significant for any of the HR-pQCT parameters (all p-trend values >0.05; range 0.09-0.94). Of interest, while each of the age groups showed an increased risk for fracture with aBMD, we did not observe an age-related decrease in these risks of fracture with FN aBMD across the oldest age quintiles in our study.
Table 2.
Associations of HR-pQCT bone parameters and femoral neck aBMD with all incident fractures across quintiles of age, HR per 1 standard deviation (SD) decrease* with 95% confidence interval (95% CI), adjusted for age, sex, weight, height, cohort, and femoral neck aBMD.
| Age quintile groups | Interaction P-value | Interaction point estimate and 95% CI | Trend P-value | |||||
|---|---|---|---|---|---|---|---|---|
| 40–62 years | >62–65.5 years | >65.5–69 years | >69–75.2 years | >75.2–96 years | ||||
| Radius | ||||||||
| Fractures/N** | 107/1317 (8.1%) | 127 / 1177 (10.8%) | 130 / 1244 (10.5%) | 89 / 1196 (7.4%) | 144 / 1148 (12.5%) | |||
| Tt.BMD | 1.33 (1.03–1.71) | 1.29 (1.02–1.62) | 1.29 (1.03–1.63) | 1.33 (1.02–1.73) | 1.40 (1.12–1.73) | 0.49 | 1.05 (0.94–1.19) | 0.42 |
| Ct.Th | 1.22 (0.93–1.58) | 1.29 (1.01–1.64) | 1.15 (0.91–1.46) | 1.06 (0.81–1.39) | 1.22 (0.98–1.53) | 0.77 | 1.05 (0.97–1.12) | 0.16 |
| Ct.BMD | 1.01 (0.73–1.41) | 1.31 (0.97–1.76) | 0.88 (0.66–1.13) | 1.10 (0.79–1.54) | 1.13 (0.88–1.47) | 0.22 | 1.05 (0.98–1.12) | 0.09 |
| Ct.Po | 0.99 (0.79–1.25) | 1.18 (0.97–1.43) | 0.78 (0.65–0.94) | 0.95 (0.74–1.22) | 0.99 (0.81–1.20) | 0.07 | 0.98 (0.93–1.05) | 0.94 |
| Tb.BMD | 1.47 (1.13–1.92) | 1.27 (1.01–1.60) | 1.50 (1.18–1.89) | 1.57 (1.20–2.05) | 1.34 (1.11–1.62) | 0.22 | 1.04 (0.98–1.11) | 0.16 |
| Tb.N | 1.50 (1.17–1.92) | 1.26 (1.01–1.57) | 1.40 (1.13–1.73) | 1.35 (1.07–1.71) | 1.25 (1.06–1.48) | 0.69 | 1.02 (0.96–1.08) | 0.63 |
| Tb.Th | 1.18 (0.92–1.52) | 1.11 (0.88–1.39) | 1.31 (1.04–1.66) | 1.26 (1.00–1.60) | 1.18 (0.99–1.40) | 0.32 | 1.03 (0.96–1.09) | 0.31 |
| F. load | 1.60 (1.09–2.34) | 1.75 (1.20–2.54) | 1.98 (1.33–2.96) | 1.33 (0.91–1.95) | 1.30 (0.96–1.74) | 0.39 | 1.04 (0.97–1.13) | 0.25 |
| Tibia | ||||||||
| Fractures/N** | 112/1338 (8.4%) | 143 / 1304 (11.0%) | 153 / 1366 (11.2%) | 93 / 1260 (7.4%) | 156 / 1273 (12.3%) | |||
| Tt.BMD | 1.29 (0.97–1.70) | 1.32 (1.04–1.67) | 1.08 (0.86–1.35) | 1.38 (1.05–1.81) | 1.26 (1.02–1.55) | 0.62 | 1.05 (0.98–1.12) | 0.12 |
| Ct.Th | 1.18 (0.88–1.58) | 1.27 (0.99–1.63) | 0.95 (0.75–1.20) | 1.20 (0.90–1.60) | 1.04 (0.85–1.28) | 0.98 | 1.02 (0.96–1.09) | 0.49 |
| Ct.BMD | 1.05 (0.78–1.42) | 1.24 (1.01–1.54) | 0.92 (0.74–1.13) | 1.33 (1.02–1.73) | 1.24 (1.04–1.48) | 0.15 | 1.05 (0.97–1.13) | 0.24 |
| Ct.Po | 1.00 (0.74–1.36) | 1.11 (0.92–1.34) | 0.87 (0.73–1.05) | 1.14 (0.90–1.44) | 1.26 (1.09–1.47) | 0.26 | 1.06 (0.99–1.13) | 0.11 |
| Tb.BMD | 1.27 (0.99–1.64) | 1.19 (0.96–1.48) | 1.26 (1.02–1.55) | 1.35 (1.05–1.75) | 1.13 (0.94–1.35) | 0.65 | 1.03 (0.97–1.10) | 0.42 |
| Tb.N | 1.26 (0.96–1.62) | 1.01 (0.80–1.28) | 1.29 (1.04–1.60) | 1.32 (1.01–1.73) | 1.02 (0.85–1.23) | 0.18 | 1.04 (0.98–1.10) | 0.27 |
| Tb.Th | 1.03 (0.84–1.27) | 1.18 (0.98–1.42) | 1.02 (0.86–1.22) | 1.08 (0.86–1.35) | 1.03 (0.89–1.19) | 0.76 | 0.97 (0.97–1.03) | 0.40 |
| F. load | 1.90 (1.19–3.04) | 1.99 (1.31–3.02) | 1.51 (1.06–2.16) | 1.66 (1.09–2.52) | 1.49 (1.10–2.01) | 0.76 | 1.05 (0.97–1.14) | 0.20 |
| FN aBMD | 1.51 (1.17–1.94) | 1.34 (1.09–1.63) | 1.56 (1.27–1.92) | 1.65 (1.24–2.18) | 1.53 (1.26–1.87) | 0.26 | 1.05 (0.96–1.15) | 0.71 |
*HR per 1 standard deviation (SD) decrease except for Ct.Po (per 1 SD increase)
**Number of persons with incident fractures/number of individuals and percentage of individuals with incident fractures per age quintile
Tt.BMD – total volumetric bone mineral density (vBMD) (mg/cm3), Ct.Th – cortical thickness (derived) (mm), Ct.BMD – cortical vBMD (mg/cm3), Ct.Po – cortical porosity (%), Tb.BMD – trabecular vBMD (mg/cm3), Tb.N – trabecular number (1/mm), Tb.Th – trabecular thickness (derived) (□m), F. load – failure load (N), aBMD – areal bone mineral density (mg/cm2)
Major osteoporotic fracture
Overall, 348 participants had incident MOF: 306 of the 6082 participants with valid radius scans and 338 in the 6541 participants who had valid tibia scans. After adjustment for age, weight, height, sex, cohort and FNaBMD, several HR-pQCT parameters were associated with the risk of MOF in our study (Table 3). For example, Tt.BMD at the radius has an HR of 1.4 (CI: 1.20-1.62), and at the tibia, the HR was 1.23 (CI: 1.06-1.43). The HR estimates of risk did not vary across age quintiles for any HR-pQCT measure for either radius or tibia sites (interaction P ≥ 0.16); range 0.16–0.99. The P-value for trend was not statistically significant for any HR-pQCT parameter (P ≥ 0.09; range 0.09-0.85). MOFs in our study also did not show an age-related decrease in the risks for fracture with FN aBMD in the oldest age groups.
Table 3.
Associations of HR-pQCT parameters and femoral neck aBMD with incident major osteoporotic fractures (MOF) across quintiles of age, HR per 1 standard deviation (SD) decrease* with 95% confidence interval (95% CI),adjusted for age, sex, weight, height, cohort, and femoral neck aBMD.
| Age quintile groups | Interaction P-value | Interaction point estimate and 95% CI |
Trend
P-value |
|||||
|---|---|---|---|---|---|---|---|---|
| ≤62 years | >62 – 65.5 years | >65.5 – 69 years | >69 – 75.2 years | >75.2 years | ||||
| Radius ** | 45 / 1317 (3.4%) | 56 / 1177 (4.8%) | 65 / 1245 (5.25%) | 49 / 1196 (4.1%) | 91 / 1148 (7.9%) | |||
| Fractures/N** | ||||||||
| Tt.BMD | 1.47 (0.99–2.17) | 1.31 (0.92–1.86) | 1.32 (0.95–1.83) | 1.39 (0.97–1.99) | 1.33 (1.01–1.77) | 0.99 | 1.04 (0.94–1.14) | 0.50 |
| Ct.Th | 1.20 0.80–1.80) | 1.33 (0.91–1.94) | 1.11 (0.79–1.56) | 1.19 (0.82–1.72) | 1.24 (0.92–1.66) | 0.99 | 1.03 (0.94–1.13) | 0.52 |
| Ct.BMD | 1.01 (0.62–1.66) | 1.11 (0.71–1.75) | 0.85 (0.57–1.28) | 1.23 (0.79–1.91) | 1.12 (0.81–1.55) | 0.63 | 1.05 (0.96–1.16) | 0.28 |
| Ct.Po | 0.98 (0.69–1.38) | 1.06 (0.79–1.41) | 0.83 (0.64–1.08) | 1.02 (0.73–1.43) | 0.94 (0.74–1.21) | 0.68 | 1.01 (0.93–1.10) | 0.65 |
| Tb.BMD | 1.71 (1.14–2.58) | 1.27 (0.90–1.80) | 1.66 (1.18–2.32) | 1.61 (1.12–2.31) | 1.25 (0.99–1.59) | 0.60 | 0.96 (0.90–1.08) | 0.66 |
| Tb.N | 1.46 (0.99–2.15) | 1.23 (0.88–1.71) | 1.57 (1.17–2.11) | 1.19 (0.85–1.65) | 1.16 (0.94–1.44) | 0.88 | 0.99 (0.91–1.08) | 0.66 |
| Tb.Th | 1.62 (1.09–2.41) | 1.11 (0.78–1.58) | 1.36 (0.98–1.89) | 1.55 (1.10–2.19) | 1.07 (0.88–1.30) | 0.19 | 0.94 (0.85–1.03) | 0.21 |
| F. load | 1.73 (0.92–3.27) | 1.47 (0.81–2.67) | 2.25(1.26–4.05) | 1.54 (0.88–2.72) | 1.10 (0.75–1.61) | 0.67 | 0.98 (0.87–1.11) | 0.72 |
| Tibia ** | 49 / 1338 (3.7%) | 67 / 1304 (5.1%) | 76 / 1336 (5.6%) | 50 / 1260 (4.0%) | 96 / 1273 (7.5%) | |||
| Fractures/N** | ||||||||
| Tt.BMD | 1.49 (0.98–2.29) | 1.38 (0.97–1.97) | 1.00 (0.73–1.37) | 1.26 (0.87–1.82) | 1.13 (0.86–1.48) | 0.64 | 0.99 (0.91–1.09) | 0.85 |
| Ct.Th | 1.50 (0.94–2.37) | 1.37 (0.94–2.00) | 0.84 (0.60–1.18) | 1.21 (0.83–1.76) | 0.99 (0.76–1.30) | 0.44 | 0.98 (0.89–1.07) | 0.53 |
| Ct.BMD | 1.23 (0.79–1.93) | 1.25 (0.92–1.71) | 0.92 (0.68–1.24) | 1.40 (0.99–2.00) | 1.11 (0.88–1.40) | 0.50 | 1.04 (0.95–1.14) | 0.33 |
| Ct.Po | 1.20 (0.77–1.86) | 1.07 (0.82–1.41) | 1.01 (0.78–1.30) | 1.26 (0.92–1.74) | 1.17 (0.96–1.44) | 0.97 | 1.03 (0.95–1.12) | 0.28 |
| Tb.BMD | 1.30 (0.88–1.91) | 1.13 (0.82–1.57) | 1.14 (0.85–1.54) | 1.26 (0.89–1.79) | 1.04 (0.83–1.30) | 0.85 | 0.98 (0.90–1.07) | 0.57 |
| Tb.N | 1.12 (0.75–1.68) | 0.86 (0.61–1.22) | 1.13 (0.83–1.54) | 1.41 (0.98–2.04) | 0.90 (0.71–1.15) | 0.22 | 1.04 (0.95–1.13) | 0.42 |
| Tb.Th | 1.14 (0.83–1.56) | 1.28 (0.97–1.68) | 1.04 (0.81–1.35) | 0.93 (0.69–1.25) | 1.09 (0.90–1.31) | 0.16 | 0.93 (0.86–1.01) | 0.09 |
| F. load | 2.22 (1.05–4.68) | 2.10 (1.10–4.01) | 1.59 (0.94–2.67) | 1.83 (0.99–3.38) | 1.07 (0.72–1.60) | 0.73 | 0.99 (0.88–1.11) | 0.83 |
| FN aBMD | 1.87 (1.22–2.88) | 1.96 (1.42–2.72) | 1.75 (1.29–2.37) | 1.47 (0.99–2.19) | 1.71 (1.31–2.23) | 0.51 | 1.02 (0.92–1.13) | 0.67 |
*HR per 1 standard deviation (SD) decrease except for Ct.Po (per 1 SD increase)
**Number of persons with incident MOF fractures/number of individuals and percentage of individuals with incident MOF per age quintile
Tt.BMD – total volumetric bone mineral density (vBMD) (mg/cm3), Ct.Th – cortical thickness (derived)(mm), Ct.BMD – cortical vBMD (mg/cm3), Ct.Po – cortical porosity (%), Tb.BMD – trabecular vBMD (mg/cm3), Tb.N – trabecular number (1/mm), Tb.Th – trabecular thickness (derived) (□m), F. load – failure load (N), aBMD – areal bone mineral density (mg/cm2)
Discussion
In a large study of men and women followed prospectively for fracture, the strength of association between the HR-pQCT parameters and fracture risk (all fractures or MOF) did not differ across age quintiles. Further, we found no evidence of interaction or trend with age in the association between HR-pQCT parameters and fracture.
As the point estimates of HRs were similar within age quintiles, the strength of the association between fracture and HR-pQCT parameters did not vary with age in older adults. Our findings may suggest that the lower fracture risk between aBMD and fracture in older adults observed by others may be related to factors that interfere with aBMD measured using DXA, but not with HR-pQCT measures (such as development and progression of vascular calcification or osteoarthritis changes with aging that may mask osteoporosis on DXA measures). In our study, even though aBMD decreased across the age groups (see Table 1), we did not observe an age interaction of aBMD and fracture risk.
Another factor which may spuriously decrease the estimated risk for aBMD is the risk of falling in very old individuals. In older adults, many other factors may predispose an individual to falls and reduce the ability to react to them. In those at higher risk for falling, frailty may be a stronger risk factor for fracture and the usefulness of aBMD may decrease with age.15,17,46,47 However, the risk of falling would have a similar confounding influence on the results of the HR-pQCT parameters.
The higher mortality in those with low aBMD may influence the estimated fracture risk.22,23 In older adults with low aBMD, the risk of death may exceed that of fracture and weaken the link between aBMD and fracture. However, the link between HR-pQCT parameters and mortality has been shown to be weak.(48) In this study, the HR estimates for fracture did not vary with age, despite somewhat higher mortality in the older groups. Thus, the differences in mortality do not seem to influence our results.
It is important to note that technical difficulties to perform bone densitometry may be a DXA-specific factor. These factors increase with age, and may tend to render DXA data inaccurate, thus possibly affecting the estimated fracture risk for aBMD in those individuals most affected. DXA necessitates correct positioning of individuals for accurate and reproducible aBMD measurement. The age-related increase in the prevalence of osteoarthritis also may render the correct DXA position difficult or compromised, and at times unattainable.48 The HR estimate is expected to be lower mainly in the oldest age groups in which the technical difficulties are likely to be the highest. In our study, we did not observe that the association of DXA aBMD with fracture waned with age quintile. Yet most,4,5,16,18,19,49,50 but not all,13 studies show that the decreased predictive value of DXA-derived bone measures was found mainly after age 75 years. In the studies assessing several age groups, the estimated fracture risk decreased with age, mainly for the prediction of hip fracture (but less often for other fractures) and for hip aBMD (but less consistendly for aBMD at other skeletal sites).3,6,8-20 The effect of age on fracture prediction by aBMD may vary by skeletal site assessed and also by the fracture site. Thus, DXA-specific technical difficulties are likely to contribute to a less accurate fracture risk assessment and the lower estimate of risk from aBMD in very old adults. By contrast, HR-pQCT, a 3D method, is less sensitive to positioning errors or imaging artifacts (i.e., osteoarthritis, aortic calcification or osteophytes). However, in our study, the estimated effect for aBMD was as strong as those for most of the HR-pQCT measures. A possible explanation might be that HR-pQCT is more sensitive to movements and partial volume effect because it assesses smaller structures necessitating very high resolution.
The homogeneity of fracture prediction by HR-pQCT after age 75 years shows that deficits in bone density and structure remain major determinants of fracture risk regardless of older age. In this age group, HR-pQCT may be more useful than DXA in clinical practice because it is less influenced by the technical limitations of DXA (osteoarthritis, positioning, as noted above), although the cost of equipment and its lack of approval for clinical use currently limits its widespread application. Yet, this information is particularly important given the high fracture incidence in very old individuals.
Our study has several limitations. The BOMIC cohorts were recruited in Europe and North America, and included few non-white individuals. Older volunteers have better health status than the broader population and may not be fully representative of other individuals with similar age. The cohorts also consisted mainly of home-dwelling individuals. Thus, our results may not extrapolate to institutionalized older adults or to other race or ethnic groups. We did not account for postmenopausal status; however, only 3% were aged ≤50 years (225 women) and presented with few fractures (2% of all fractures, n = 15; of MOF 1.4%, n = 5). DXA and HR-pQCT devices were not cross-calibrated, however we adjusted for cohort in study analyses. Partial volume effects may influence the assessment of how some HR-pQCT bone parameters, (e.g., Tb.Th. and Ct.Th) are calculated. All the self-reported fractures were adjudicated, but false negatives are possible. The number of hip fractures was not sufficient to perform a per-quintile analysis. The results were consistent for MOF and all fractures, yet it is unknown if results would have differed for hip fractures. While the number of participants was large, it may be insufficient to detect possible effect modification. However, given the consistently low values of the point estimates for trend, the likelihood that we missed the trend (type II error) may be low.
It is possible that the oldest and the sickest subjects were more likely to have had poor quality scans that needed to be excluded. As they may have had poorer bone microarchitecture and more fractures, we may have underestimated the number of fractures and the HR value, especially in the oldest age quintile. In our study, the percentage of the scans excluded due to poor quality was dissimilar only in the youngest age quintile for distal radius but not for tibia. However, the interactions between age and the HR-pQCT parameters were similar for both skeletal sites. Finally, as with most observational studies, residual confounding is always possible.
In conclusion, in a pooled analysis of 6835 men and women from 7 cohorts followed prospectively, the strength of the association between the HR-pQCT parameters and incident fracture risk did not differ across the age quintiles of older adults. Thus, HR-pQCT results confirm that bone density, microarchitecture and strength contribute to fracture risk regardless of age within the age ranges considered. Yet, the fracture risk was highest after age 80. Further studies are of utmost priority in this group to examine the ability of HR-pQCT measures to improve fracture prediction in very old individuals, especially for prediction of hip fracture.
Author contributions
Pawel Szulc (Conceptualization, Formal analysis, Investigation, Methodology, Writing—original draft, Writing—review & editing), Alyssa Dufour (Conceptualization, Formal analysis, Investigation, Methodology, Supervision, Writing—original draft, Writing—review & editing), Marian Hannan (Conceptualization, Data curation, Formal analysis, Funding acquisition, Supervision, Writing—original draft, Writing—review & editing), Douglas Kiel (Conceptualization, Data curation, Funding acquisition, Investigation, Resources, Writing—original draft, Writing—review & editing), Roland Chapurlat (Data curation, Funding acquisition, Investigation, Writing—original draft, Writing—review & editing), Elisabeth Sornay-Rendu (Data curation, Funding acquisition, Investigation, Writing—original draft, Writing—review & editing), Blandine MERLE (Data curation, Investigation, Writing—original draft, Writing—review & editing), Steven Boyd (Data curation, Investigation, Methodology, Writing—original draft, Writing—review & editing), Danielle Whittier (Data curation, Investigation, Methodology, Writing—original draft, Writing—review & editing), David Hanley (Data curation, Investigation, Writing—original draft, Writing—review & editing), David Goltzman (Data curation, Investigation, Writing—original draft, Writing—review & editing), Andy Wong (Data curation, Investigation, Writing—original draft, Writing—review & editing), Eric Lespessailles (Data curation, Investigation, Writing—original draft, Writing—review & editing), Sundeep Khosla (Data curation, Investigation, Writing—original draft, Writing—review & editing), Serge Ferrari (Data curation, Investigation, Writing—original draft, Writing—review & editing), Emmanuel Biver (Data curation, Investigation, Writing—original draft, Writing—review & editing), Mary Bouxsein (Data curation, Funding acquisition, Investigation, Writing—original draft, Writing—review & editing) and Elizabeth (Lisa) Samelson (Conceptualization, Formal analysis, Investigation, Supervision, Writing—original draft, Writing—review & editing).
Funding
Research reported in this manuscript was supported by National Institute of Arthritis Musculoskeletal and Skin Diseases of the National Institutes of Health (R01AR061445 and AR027065), the National Heart, Lung, and Blood Institute Framingham Heart Study (N01-HC-25195, HHSN268201500001I), and investigator-initiated research grants from Amgen Inc, and from Merck Sharp & Dohme. and by the Canadian Institutes of Health Research (CIHR 158975 and CIHR 111103), and by grants from Geneva University Hospitals & Faculty of Medicine Clinical Research Centre, and from Geneva University Hospitals Private Foundation. The STRAMBO study was supported by grants from Roche pharmaceutical company (Basel, Switzerland), Agence Nationale de la Recherche (ANR-07-PHYSIO-023, ANR-10-BLAN-1137), Abondement ANVAR (E1482.042), and Hospices Civils de Lyon (50564). The content is solely the responsibility of the authors. Any opinions, findings, conclusions, or recommendations expressed in this publication are those of the authors and do not necessarily reflect the official views of the National Institutes of Health, or of Amgen Inc. or Merck. Additional support was provided the Friends of Hebrew SeniorLife in Boston, MA.
Conflicts of interest
None declared.
Data availability
None delcared.
Contributor Information
Pawel Szulc, INSERM UMR1033, University of Lyon, Lyon 69100, France.
Alyssa B Dufour, Hinda and Arthur Marcus Institute for Aging Research, Hebrew SeniorLife, Boston, MA 02131, United States; Department of Medicine, Beth Israel Deaconess Medical Center, Harvard Medical School, Boston, MA 02215, United States.
Marian T Hannan, Hinda and Arthur Marcus Institute for Aging Research, Hebrew SeniorLife, Boston, MA 02131, United States; Department of Medicine, Beth Israel Deaconess Medical Center, Harvard Medical School, Boston, MA 02215, United States.
Douglas P Kiel, Hinda and Arthur Marcus Institute for Aging Research, Hebrew SeniorLife, Boston, MA 02131, United States; Department of Medicine, Beth Israel Deaconess Medical Center, Harvard Medical School, Boston, MA 02215, United States.
Roland Chapurlat, INSERM UMR1033, University of Lyon, Lyon 69100, France.
Elisabeth Sornay-Rendu, INSERM UMR1033, University of Lyon, Lyon 69100, France.
Blandine Merle, INSERM UMR1033, University of Lyon, Lyon 69100, France.
Steven K Boyd, McCaig Institute for Bone and Joint Health, University of Calgary, Calgary AB, T2N 1N4, Canada.
Danielle E Whittier, McCaig Institute for Bone and Joint Health, University of Calgary, Calgary AB, T2N 1N4, Canada.
David A Hanley, McCaig Institute for Bone and Joint Health, University of Calgary, Calgary AB, T2N 1N4, Canada.
David Goltzman, Departments of Medicine, McGill University and McGill University Health Centre, Montreal, QC, H3A 0G4, Canada.
Andy Kin On Wong, Joint Department of Medical Imaging, University Health Network; and Division of Epidemiology, Dalla Lana School of Public Health, University of Toronto, Toronto, ON, M5R 0A3, Canada.
Eric Lespessailles, Department of Rheumatology and PRIMMO, University Hospital of Orléans, Orléans, 45234, France.
Sundeep Khosla, Division of Endocrinology and Kogod Center on Aging, Mayo Clinic, Rochester, MN 55902, United States.
Serge Ferrari, Division of Bone Diseases, Geneva University Hospitals and Faculty of Medicine, University of Geneva, Geneva, CH-1211, Switzerland.
Emmanuel Biver, Division of Bone Diseases, Geneva University Hospitals and Faculty of Medicine, University of Geneva, Geneva, CH-1211, Switzerland.
Mary L Bouxsein, Dept of Orthopedic Surgery, Harvard Medical School, Center for Advanced Orthopaedics Studies, BIDMC, Boston, MA 02215, United States.
Elizabeth J Samelson, Hinda and Arthur Marcus Institute for Aging Research, Hebrew SeniorLife, Boston, MA 02131, United States; Department of Medicine, Beth Israel Deaconess Medical Center, Harvard Medical School, Boston, MA 02215, United States.
References
- 1.Kanis JA, Melton LJ 3rd, Christiansen C, Johnston CC, Khaltaev N. The diagnosis of osteoporosis. J Bone Miner Res. 1994;9(8):1137–1141. 10.1002/jbmr.5650090802 [DOI] [PubMed] [Google Scholar]
- 2.Cummings SR, Cawthon PM, Ensrud KE, et al. BMD and risk of hip and nonvertebral fractures in older men: a prospective study and comparison with older women. J Bone Miner Res. 2006;21(10):1550–1556. 10.1359/jbmr.060708 [DOI] [PubMed] [Google Scholar]
- 3.Johnell O, Kanis JA, Oden A, et al. Predictive value of BMD for hip and other fractures. J Bone Miner Res. 2005;20(7):1185–1194. 10.1359/JBMR.050304 [DOI] [PubMed] [Google Scholar]
- 4.Schott AM, Cormier C, Hans D, et al. How hip and whole-body bone mineral density predict hip fracture in elderly women: the EPIDOS Prospective Study. Osteoporos Int. 1998;8(3):247–254. 10.1007/s001980050061 [DOI] [PubMed] [Google Scholar]
- 5.Schott AM, Kassaï Koupaï B, Hans D, et al. Should age influence the choice of quantitative bone assessment technique in elderly women? The EPIDOS study. Osteoporos Int. 2004;15(3):196–203. 10.1007/s00198-003-1505-1 [DOI] [PubMed] [Google Scholar]
- 6.Fujiwara S, Kasagi F, Masunari N, Naito K, Suzuki G, Fukunaga M. Fracture prediction from bone mineral density in Japanese men and women. J Bone Miner Res. 2003;18(8):1547–1553. 10.1359/jbmr.2003.18.8.1547 [DOI] [PubMed] [Google Scholar]
- 7.McCloskey EV, Odén A, Harvey NC, et al. A Meta-Analysis of Trabecular Bone Score in Fracture Risk Prediction and Its Relationship to FRAX. J Bone Miner Res. 2016;31(5):940–948. 10.1002/jbmr.2734 [DOI] [PubMed] [Google Scholar]
- 8.Crandall CJ, Schousboe JT, Morin SN, Lix LM, Leslie W. Performance of FRAX and FRAX-Based Treatment Thresholds in Women Aged 40 Years and Older: The Manitoba BMD Registry. J Bone Miner Res. 2019;34(8):1419–1427. 10.1002/jbmr.3717 [DOI] [PubMed] [Google Scholar]
- 9.Kanis JA, Oden A, Johnell O, et al. The use of clinical risk factors enhances the performance of BMD in the prediction of hip and osteoporotic fractures in men and women. Osteoporos Int. 2007;18(8):1033–1046. 10.1007/s00198-007-0343-y [DOI] [PubMed] [Google Scholar]
- 10.Nevitt MC, Johnell O, Black DM, et al. Bone mineral density predicts non-spine fractures in very elderly women. Study of Osteoporotic Fractures Research Group. Osteoporos Int. 1994;4(6):325–331. 10.1007/BF01622192 [DOI] [PubMed] [Google Scholar]
- 11.Siris ES, Brenneman SK, Miller PD, et al. Predictive value of low BMD for 1-year fracture outcomes is similar for postmenopausal women ages 50-64 and 65 and older: results from the National Osteoporosis Risk Assessment (NORA). J Bone Miner Res. 2004;19(8):1215–1220. 10.1359/JBMR.040508 [DOI] [PubMed] [Google Scholar]
- 12.Siris ES, Brenneman SK, Barrett-Connor E, et al. The effect of age and bone mineral density on the absolute, excess, and relative risk of fracture in postmenopausal women aged 50-99: results from the National Osteoporosis Risk Assessment (NORA). Osteoporos Int. 2006;17(4):565–574. 10.1007/s00198-005-0027-4 [DOI] [PubMed] [Google Scholar]
- 13.Looker AC. Femur neck bone mineral density and fracture risk by age, sex, and race or Hispanic origin in older US adults from NHANES III. Arch Osteoporos. 2013;8(1-2):141. 10.1007/s11657-013-0141-4 [DOI] [PubMed] [Google Scholar]
- 14.Lee J, Chang G, Kang H, et al. Impact of bone mineral density on the incidence of age-related vertebral fragility fracture. J Korean Med Sci. 2020;35(17):e116. 10.3346/jkms.2020.35.e116 [DOI] [PMC free article] [PubMed] [Google Scholar]
- 15.Blaizot S, Delmas PD, Marchand F, Chapurlat R, Szulc P. Risk factors for peripheral fractures vary by age in older men--the prospective MINOS study. Osteoporos Int. 2011;22:1755–1764. 10.1007/s00198-010-1386-z [DOI] [PubMed] [Google Scholar]
- 16.Cheng S, Suominen H, Era P, Heikkinen E. Bone density of the calcaneus and fractures in 75- and 80-year-old men and women. Osteoporos Int. 1994;4(1):48–54. 10.1007/BF02352261 [DOI] [PubMed] [Google Scholar]
- 17.Hui SL, Slemenda CW, Johnston CC Jr. Baseline measurement of bone mass predicts fracture in white women. Ann Intern Med. 1989;111(5):355–361. 10.7326/0003-4819-111-5-355 [DOI] [PubMed] [Google Scholar]
- 18.Gärdsell P, Johnell O, Nilsson BE, Gullberg B. Predicting various fragility fractures in women by forearm bone densitometry: a follow-up study. Calcif Tissue Int. 1993;52(5):348–353. 10.1007/BF00310197 [DOI] [PubMed] [Google Scholar]
- 19.Lauppe R, Åkesson KE, Ljunggren Ö, et al. Differing impact of clinical factors on the risk of fracture in younger and older women in the general population and an osteoporosis clinic population. Arch Osteoporos. 2019;14(1):45. 10.1007/s11657-019-0592-3 [DOI] [PubMed] [Google Scholar]
- 20.Gnudi S, Malavolta N, Lisi L, Ripamonti C. Bone mineral density and bone loss measured at the radius to predict the risk of nonspinal osteoporotic fracture. J Bone Miner Res. 2001;16(6):1130–1135. 10.1359/jbmr.2001.16.6.1130 [DOI] [PubMed] [Google Scholar]
- 21.Kanis JA, Borgstrom F, De Laet C, et al. Assessment of fracture risk. Osteoporos Int. 2005;16(6):581–589. 10.1007/s00198-004-1780-5 [DOI] [PubMed] [Google Scholar]
- 22.Szulc P, Maurice C, Marchand F, Delmas PD. Increased bone resorption is associated with higher mortality in community-dwelling men >or=50 years of age: the MINOS study. J Bone Miner Res. 2009;24(6):1116–1124. 10.1359/jbmr.081251 [DOI] [PubMed] [Google Scholar]
- 23.Trivedi DP, Khaw KT. Bone mineral density at the hip predicts mortality in elderly men. Osteoporos Int. 2001;12(4):259–265. 10.1007/s001980170114 [DOI] [PubMed] [Google Scholar]
- 24.Bristow SM, Gamble GD, Horne AM, Reid IR. Longitudinal changes in bone mineral density, bone mineral content and bone area at the lumbar spine and hip in postmenopausal women, and the influence of abdominal aortic calcification. Bone Rep. 2018;10:100190. 10.1016/j.bonr.2018.100190 [DOI] [PMC free article] [PubMed] [Google Scholar]
- 25.Seeman E. Pathogenesis of bone fragility in women and men. Lancet. 2002;359(9320):1841–1850. 10.1016/S0140-6736(02)08706-8 [DOI] [PubMed] [Google Scholar]
- 26.Boutroy S, Bouxsein ML, Munoz F, Delmas PD. In vivo assessment of trabecular bone microarchitecture by high-resolution peripheral quantitative computed tomography. J Clin Endocrinol Metab. 2005;90(12):6508–6515. 10.1210/jc.2005-1258 [DOI] [PubMed] [Google Scholar]
- 27.Mikolajewicz N, Bishop N, Burghardt AJ, et al. HR-pQCT Measures of Bone Microarchitecture Predict Fracture: Systematic Review and Meta-Analysis. J Bone Miner Res. 2020;35(3):446–459. 10.1002/jbmr.3901 [DOI] [PubMed] [Google Scholar]
- 28.Samelson EJ, Broe KE, Xu H, et al. Cortical and trabecular bone microarchitecture as an independent predictor of incident fracture risk in older women and men in the Bone Microarchitecture International Consortium (BoMIC): a prospective study. Lancet Diabetes Endocrinol. 2019;7(1):34–43. 10.1016/S2213-8587(18)30308-5 [DOI] [PMC free article] [PubMed] [Google Scholar]
- 29.Sornay-Rendu E, Boutroy S, Duboeuf F, Chapurlat RD. Bone Microarchitecture Assessed by HR-pQCT as Predictor of Fracture Risk in Postmenopausal Women: The OFELY Study. J Bone Miner Res. 2017;32(6):1243–1251. 10.1002/jbmr.3105 [DOI] [PubMed] [Google Scholar]
- 30.Biver E, Durosier-Izart C, Chevalley T, van Rietbergen B, Rizzoli R, Ferrari S. Evaluation of Radius Microstructure and Areal Bone Mineral Density Improves Fracture Prediction in Postmenopausal Women. J Bone Miner Res. 2018;33(2):328–337. 10.1002/jbmr.3299 [DOI] [PubMed] [Google Scholar]
- 31.Langsetmo L, Peters KW, Burghardt AJ, et al. Volumetric Bone Mineral Density and Failure Load of Distal Limbs Predict Incident Clinical Fracture Independent HR-pQCT BMD and Failure Load Predicts Incident Clinical Fracture of FRAX and Clinical Risk Factors Among Older Men. J Bone Miner Res. 2018;33(7):1302–1311. 10.1002/jbmr.3433 [DOI] [PMC free article] [PubMed] [Google Scholar]
- 32.Ohlsson C, Sundh D, Wallerek A, et al. Cortical Bone Area Predicts Incident Fractures Independently of Areal Bone Mineral Density in Older Men. J Clin Endocrinol Metab. 2017;102:jc.2016–jc.3177. 10.1210/jc.2016-3177 [DOI] [PubMed] [Google Scholar]
- 33.Burt LA, Manske SL, Hanley DA, Boyd SK. Lower bone density, impaired microarchitecture, and strength predict future fragility fracture in postmenopausal women: 5-year follow-up of the Calgary CaMos cohort. J Bone Miner Res. 2018;33(4):589–597. 10.1002/jbmr.3347 [DOI] [PubMed] [Google Scholar]
- 34.Szulc P, Boutroy S, Chapurlat R. Prediction of Fractures in Men Using Bone Microarchitectural Parameters Assessed by High-Resolution Peripheral Quantitative Computed Tomography-The Prospective STRAMBO Study. J Bone Miner Res. 2018;33(8):1470–1479. 10.1002/jbmr.3451 [DOI] [PubMed] [Google Scholar]
- 35.Riggs BL, Melton LJ 3rd, Robb RA, et al. Population-based study of age and sex differences in bone volumetric density, size, geometry, and structure at different skeletal sites. J Bone Miner Res. 2004;19(12):1945–1954. 10.1359/JBMR.040916 [DOI] [PubMed] [Google Scholar]
- 36.Liu CT, Sahni S, Xu H, et al. Long-term and recent weight change are associated with reduced peripheral bone density, deficits in bone microarchitecture, and decreased bone strength: the Framingham osteoporosis study. J Bone Miner Res. 2018;33(10):1851–1858. 10.1002/jbmr.3472 [DOI] [PMC free article] [PubMed] [Google Scholar]
- 37.Chapurlat R, Pialat JB, Merle B, et al. The QUALYOR (QUalité Osseuse LYon Orléans) study: a new cohort for noninvasive evaluation of bone quality in postmenopausal osteoporosis. Rationale and study design. Arch Osteoporos. 2017;13(1):2. 10.1007/s11657-017-0412-6 [DOI] [PubMed] [Google Scholar]
- 38.Kanis JA, Oden A, Johansson H, Borgstrom F, Strom O, McCloskey E. FRAX and its applications to clinical practice. Bone. 2009;44(5):734–743. 10.1016/j.bone.2009.01.373 [DOI] [PubMed] [Google Scholar]
- 39.Buie HR, Campbell GM, Klinck RJ, MacNeil JA, Boyd SK. Automatic segmentation of cortical and trabecular compartments based on a dual threshold technique for in vivo micro-CT bone analysis. Bone. 2007;41(4):505–515. 10.1016/j.bone.2007.07.007 [DOI] [PubMed] [Google Scholar]
- 40.Whittier DE, Boyd SK, Burghardt AJ, et al. Guidelines for the assessment of bone density and microarchitecture in vivo using high-resolution peripheral quantitative computed tomography. Osteoporos Int. 2020;31(9):1607–1627. 10.1007/s00198-020-05438-5 [DOI] [PMC free article] [PubMed] [Google Scholar]
- 41.Pialat JB, Burghardt AJ, Sode M, Link TM, Majumdar S. Visual grading of motion induced image degradation in high resolution peripheral computed tomography: impact of image quality on measures of bone density and micro-architecture. Bone. 2012;50(1):111–118. 10.1016/j.bone.2011.10.003 [DOI] [PubMed] [Google Scholar]
- 42.Pistoia W, van Rietbergen B, Lochmuller EM, Lill CA, Eckstein F, Ruegsegger P. Estimation of distal radius failure load with micro-finite element analysis models based on three-dimensional peripheral quantitative computed tomography images. Bone. 2002;30(6):842–848. 10.1016/S8756-3282(02)00736-6 [DOI] [PubMed] [Google Scholar]
- 43.Wagner PP, Whittier DE, Foesser D, Boyd SK, Chapurlat R, Szulc P. Bone Microarchitecture Decline And Risk Of Fall And Fracture In Men With Poor Physical Performance - The Strambo Study. J Clin Endocrinol Metab. 2021online Jul 12;106:e5180–e5194. 10.1210/clinem/dgab506 [DOI] [PubMed] [Google Scholar]
- 44.Whittier DE, Manske SL, Kiel DP, Bouxsein M, Boyd SK. Harmonizing finite element modelling for non-invasive strength estimation by high-resolution peripheral quantitative computed tomography. J Biomech. 2018;80:63–71. 10.1016/j.jbiomech.2018.08.030 [DOI] [PMC free article] [PubMed] [Google Scholar]
- 45.Fan B, Lu Y, Genant H, Fuerst T, Shepherd J. Does standardized BMD still remove differences between Hologic and GE-lunar state-of-the-art DXA systems? Osteoporos Int. 2010;21(7):1227–1236. 10.1007/s00198-009-1062-3 [DOI] [PMC free article] [PubMed] [Google Scholar]
- 46.Kanis JA. Diagnosis of osteoporosis and assessment of fracture risk. Lancet. 2002;359(9321):1929–1936. 10.1016/S0140-6736(02)08761-5 [DOI] [PubMed] [Google Scholar]
- 47.Dargent-Molina P, Favier F, Grandjean H, et al. Fall-related factors and risk of hip fracture: the EPIDOS prospective study. Lancet. 1996;348(9021):145–149. 10.1016/S0140-6736(96)01440-7 [DOI] [PubMed] [Google Scholar]
- 48.Maggio D, McCloskey EV, Camilli L, et al. Short-term reproducibility of proximal femur bone mineral density in the elderly. Calcif Tissue Int. 1998;63(4):296–299. 10.1007/s002239900530 [DOI] [PubMed] [Google Scholar]
- 49.Cooper C, Barker DJ, Morris J, Briggs RS. Osteoporosis, falls, and age in fracture of the proximal femur. Br Med J. 1987;295(6589):13–15. 10.1136/bmj.295.6589.13 [DOI] [PMC free article] [PubMed] [Google Scholar]
- 50.Hans D, Durosier C, Kanis JA, Johansson H, Schott-Pethelaz AM, Krieg MA. Assessment of the 10-year probability of osteoporotic hip fracture combining clinical risk factors and heel bone ultrasound: the EPISEM prospective cohort of 12,958 elderly women. J Bone Miner Res. 2008;23(7):1045–1051. 10.1359/jbmr.080229 [DOI] [PubMed] [Google Scholar]
Associated Data
This section collects any data citations, data availability statements, or supplementary materials included in this article.
Data Availability Statement
None delcared.