Systematic reviews of healthcare interventions, which are aimed at informing health policy, increasingly include economic evaluations in addition to evaluations of clinical effectiveness.1–3 The challenge reviewers face is collating, appraising, and synthesising economic evidence in such a way that it is clearly helpful in making decisions about the effects and costs of competing alternatives. However, the methodology for summarising the findings of economic evaluations is not as well established as that applied to structured summaries of clinical evidence. The aim of this paper is to illustrate and discuss the relative merits of commonly used methods and to offer a new approach that makes interpreting the evidence easier for decision makers who require a clear overview of the findings.
Summary points
Systematic reviews of healthcare interventions are increasingly integrating clinical and economic evidence
Methods are needed to summarise and convey clearly the findings of these reviews
The methodology for summarising the results of economic evaluations is not well established
Methods for summarising the results of economic evaluations include narratives, tables, the cost effectiveness plane, and permutation matrices
A new hierarchical method offers an effective means of summarising the results of economic evaluations within a systematic review
We describe well established methods that can be used to summarise the findings of a review of economic evaluations, namely narrative summaries, permutation matrices, and the cost effectiveness plane, and we give examples of how a permutation matrix has or could have been used in two published systematic reviews. Finally, a new method is described that presents the same information in a clear, concise, and hierarchical manner and which provides an effective tool for summarising the same results.
Existing summary methods
The most elementary method of summarising the results of a review of economic evaluations is the narrative summary, which, in conjunction with a tabular approach to recording the results, provides a descriptive summary of the review.4 The drawback to this method is that the gist of the findings is not always immediately obvious.
An alternative system for summarising the findings of economic evaluations is the cost effectiveness plane; it presents the results in four quadrants.5 This system is potentially useful because it presents the magnitude of the differences in costs and effectiveness as well as their direction. However, it is somewhat technical in nature, lacks common reference points that can be used across different economic evaluations, and has not been widely used in systematic reviews. Consequently, it is not discussed in this paper.
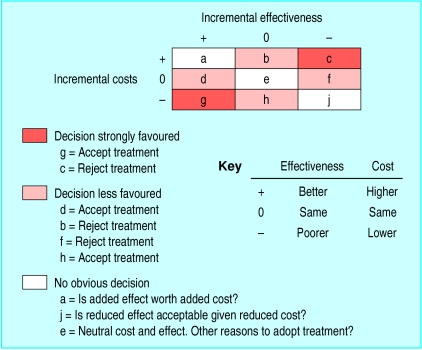
A more common approach is to use a framework for evaluating the possible outcomes of economic evaluations.6 This is a form of permutation matrix that shows the nine possible outcomes in terms of costs and effectiveness. It has been developed further by the use of shading to show the relevant strengths of each permutation of costs and effects in terms of decision making.7 A modified version of this approach, using letters instead of numbers to represent each cell, is summarised in figure 1 . The matrix shows the permutations that indicate that a certain decision is strongly favoured (that is, it has better health outcomes and lower costs) if the decision were either accepted (cell g) or rejected (cell c). The situation in which a decision is less favoured (that is, either costs are lower or health outcomes are better) is shown in cells d, b, f, and h. The cases in which there is no obvious decision—that is, some form of financial or clinical trade off is required (cells a and j) or no differences are observed (cell e)—are also shown. The shading offers a means of more easily identifying the implications for decision making. The details of the economic evaluation can be put in the cells according to their permutations.
Figure 1.
Permutation matrix for possible outcomes of economic evaluations for study of intervention v comparator.7 In the original matrix numbers were used instead of letters
Examples
Two reviews of economic evidence illustrate the use of narrative and structured summaries with the permutation matrix. The first example is a review of the cost effectiveness of taxanes in the treatment of ovarian cancer.8 In this study, economic evaluations were selected after an extensive search and assessment of quality. The results of these evaluations were tabulated and a narrative summary was provided as follows
Nine were cost-effectiveness and three were cost-utility analyses. The range of incremental costs per life-year gained (£7173-£12 417) found in the two UK studies is within the range reported for all studies comparing paclitaxel plus cisplatin to cyclophosphamide plus cisplatin (£3960-£13 660). The two UK studies used carboplatin rather than cisplatin in their analyses. In the cost-utility analyses the range of incremental cost per [quality adjusted life year] gained was £5273-£11 269.8
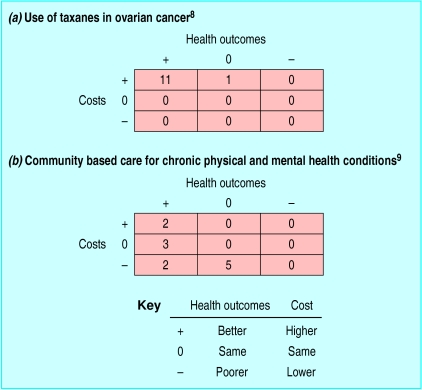
Although not included in this particular review, the matrix described above can be used to enhance the presentation of the summary (fig 2a ).
Figure 2.
Permutation plots summarising findings of economic evaluations for intervention v comparator. Numbers in cells are number of studies relevant to each permutation
The second example addresses community based care for chronic physical and mental health conditions.9 This review used both a narrative description and a permutation plot, a modified version of which is shown in figure 2b; the original version used roman numerals in each numbered cell to identify individual studies. A narrative summary of this review could be: “The main lessons from the 12 studies are that it is as effective or more effective and as expensive or less expensive to offer complete, proactive, community health services to people living with chronic physical and mental health problems than to provide focused services on demand on a piecemeal basis.”
Although the approaches described here offer useful methods of summarising reviews of economic evaluations, they still require a degree of interpretation and an understanding of the underlying methodology.
Hierarchical decision matrix
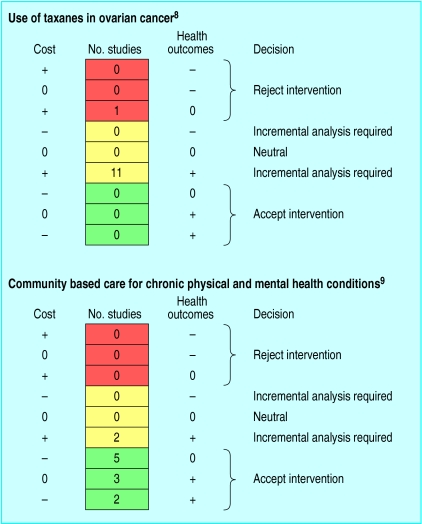
A hierarchical matrix using colour could further enhance the interpretability of reviews of economic evaluations; a model is illustrated in figure 3 . The use of colour in clinical decision making is not new. It has been shown to be useful in helping clinicians make complicated decisions and has also been used, for example, in guidelines on cholesterol treatment.10 Such a system has not been used before in health economics.
Figure 3.
Hierarchical matrix used to summarise findings of economic evaluations for intervention v comparator. Numbers in cells are number of studies relevant to each permutation
This method ranks all possible permutations (as described in figure 1) of costs and health outcomes and provides an instant visual summary of the findings and the likely action for the decision maker. For example, if the intervention is always favoured over the comparator (either strongly or weakly), then the evidence taken as a whole supports the use of the intervention. This is shown in the green (accept) areas of figure 3. An alternative scenario would be to conclude that the intervention is not supportable where it is less effective or equally effective and more costly, as depicted by the red (reject) areas of the figure.
However, if the intervention is not favoured (strongly or weakly), then an incremental (cost effectiveness or cost utility) analysis will be needed to quantify the cost of each additional unit of benefit or effectiveness. This will involve making a decision about trade offs in policy because the intervention will require additional funding either through the acquisition of additional money or by cutting back on other services. The permutations for this scenario are depicted in the yellow areas of the figure.
Although it has not yet been possible to formally assess the views of researchers regarding the likely usefulness of the new matrix, feedback suggests that it will offer an approach that retains the advantages of existing methods but presents the findings in a concise, organised, and simplified manner for decision makers (seminar presented at the NHS Centre for Reviews and Dissemination, University of York, March 2001). The original permutation matrix in figure 1 could also be enhanced by adding colour in a similar manner and may be preferred by some researchers who conduct systematic reviews. However, the transition to a hierarchical design that uses colour is a more efficient development.
Conclusion
Existing methods for summarising the results of economic evaluations within systematic reviews have some limitations for clinicians and policymakers because the methods must be interpreted using the textual and diagrammatic summaries normally provided. Moreover, the methodologies and vocabulary of narrative summaries are often an impediment to understanding the results. The proposed hierarchical method provides an instant visual summary of the findings in terms of effectiveness or benefit and in terms of cost. Other methods, such as the cost effectiveness plane, offer a potentially more inclusive approach but are probably too technical for those charged with making the final decision about competing healthcare interventions.
The method we have proposed is analogous to a traffic light and the associations with its colours will be instantly familiar to most potential users who will understand whether to stop, go forward with the intervention, or take stock of the implications before making a decision. The process of rational decision making will be enhanced by presenting the findings of such reviews with greater transparency.
Acknowledgments
We are grateful for the technical suggestions made in the preparation of this manuscript by Dr Rebecca Warburton of the School of Public Administration, University of Victoria, Canada. We would also like to acknowledge Francis Pang of the Centre for Health Economics, University of York, for commenting on the original concept and related methodology.
Footnotes
Competing interests: None declared.
References
- 1.NHS Executive. London: NHS Executive; 1999. Faster access to modern treatment: how NICE appraisal will work. [Google Scholar]
- 2.Nixon J, Stoykova B, Christie J, Glanville JM, Drummond MF, Kleijnen J. The UK NHS economic evaluation database: economic issues in evaluations of health technology. Int J Health Technol Assess. 2000;16:1–12. doi: 10.1017/s0266462300102016. [DOI] [PubMed] [Google Scholar]
- 3.Nixon J, Stoykova B, Christie J, Glanville JM, Kleijnen J, Drummond MF. NHS economic evaluation database for healthcare decision makers. BMJ. 2000;321:32. doi: 10.1136/bmj.321.7252.32. [DOI] [PMC free article] [PubMed] [Google Scholar]
- 4.NHS Centre for Reviews and Dissemination. Undertaking systematic reviews of research on effectiveness. CRD's guidance for carrying out or commissioning reviews. 2nd ed. York: NHS Centre for Reviews and Dissemination; 2000. [Google Scholar]
- 5.Black WC. The CE plane: a graphic representation of cost-effectiveness. Med Decis Making. 1990;10:212–214. doi: 10.1177/0272989X9001000308. [DOI] [PubMed] [Google Scholar]
- 6.Birch S, Gaffni A. Cost-effectiveness and cost utility analyses: methods for the non-economic evaluation of healthcare programs and how we can do better. In: Geisler E, Heller O, editors. Managing technology in healthcare. Norwell, MA: Kluwer Academic; 1996. [Google Scholar]
- 7.Drummond MF, O'Brien B, Stoddart GL, Torrance GW. Methods for the economic evaluation of health care programmes. 2nd ed. Oxford: Oxford University Press; 1999. [Google Scholar]
- 8.Lister-Sharp D, McDonough M, Khan K, Kleijnen J. A rapid and systematic review of the effectiveness and cost effectiveness of taxanes used in the treatment of advanced breast and ovarian cancer. Health Technol Assess. 2000;4:1–113. [PubMed] [Google Scholar]
- 9.Browne G, Roberts J, Gafni A, Byrne C, Weir R, Majumdar B, et al. Economic evaluations of community-based care: lessons from twelve studies in Ontario. J Eval Clin Pract. 1999;5:367–385. doi: 10.1046/j.1365-2753.1999.00191.x. [DOI] [PubMed] [Google Scholar]
- 10.Kwaliteitsinstituut voor de gezondheidszorg CBO [Dutch Institute of Healthcare Improvement]. Guideline cholesterol. Utrecht: Kwaliteitsinstituut voor de gezondheidszorg CBO, 1997.


