Abstract
Purpose
To evaluate the feasibility of leveraging serial low-dose CT (LDCT) scans to develop a radiomics-based reinforcement learning (RRL) model for improving early diagnosis of lung cancer at baseline screening.
Materials and Methods
In this retrospective study, 1951 participants (female patients, 822; median age, 61 years [range, 55–74 years]) (male patients, 1129; median age, 62 years [range, 55–74 years]) were randomly selected from the National Lung Screening Trial between August 2002 and April 2004. An RRL model using serial LDCT scans (S-RRL) was trained and validated using data from 1404 participants (372 with lung cancer) containing 2525 available serial LDCT scans up to 3 years. A baseline RRL (B-RRL) model was trained with only LDCT scans acquired at baseline screening for comparison. The 547 held-out individuals (150 with lung cancer) were used as an independent test set for performance evaluation. The area under the receiver operating characteristic curve (AUC) and the net reclassification index (NRI) were used to assess the performances of the models in the classification of screen-detected nodules.
Results
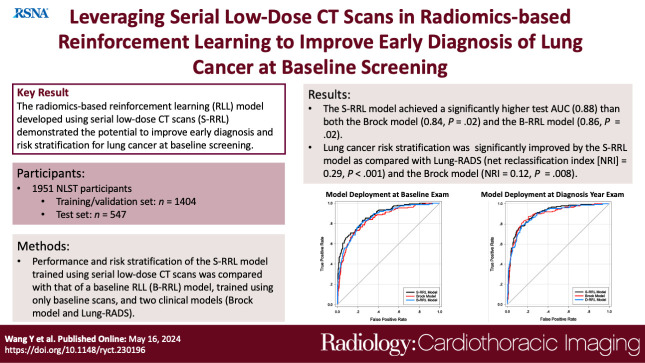
Deployment to the held-out baseline scans showed that the S-RRL model achieved a significantly higher test AUC (0.88 [95% CI: 0.85, 0.91]) than both the Brock model (AUC, 0.84 [95% CI: 0.81, 0.88]; P = .02) and the B-RRL model (AUC, 0.86 [95% CI: 0.83, 0.90]; P = .02). Lung cancer risk stratification was significantly improved by the S-RRL model as compared with Lung CT Screening Reporting and Data System (NRI, 0.29; P < .001) and the Brock model (NRI, 0.12; P = .008).
Conclusion
The S-RRL model demonstrated the potential to improve early diagnosis and risk stratification for lung cancer at baseline screening as compared with the B-RRL model and clinical models.
Keywords: Radiomics-based Reinforcement Learning, Lung Cancer Screening, Low-Dose CT, Machine Learning
© RSNA, 2024
Keywords: Radiomics-based Reinforcement Learning, Lung Cancer Screening, Low-Dose CT, Machine Learning
Summary
A radiomics-based reinforcement learning model trained with serial low-dose CT scans demonstrated potential to improve early diagnosis of lung nodules detected at the baseline screening.
Key Points
■ In a retrospective study of 1951 patients from the National Lung Screening Trial, the radiomics-based reinforcement learning model (RRL) developed using serial low-dose CT (LDCT) scans (S-RRL) achieved an area under the receiver operating characteristic curve of 0.88 on the test set which was significantly higher than performance by the Brock model (0.84; P = .02) and the RRL model developed using only baseline screening LDCT scans (0.86; P = .02).
■ The lung cancer risk reclassification analysis showed that the S-RRL model correctly reclassified (either escalated or de-escalated) 27% of patients compared with Lung CT Screening Reporting and Data System (net reclassification index, 0.29; P < .001) and 23% of participants compared with the Brock model (net reclassification index, 0.12; P = .008) at the baseline screening.
Introduction
Lung cancer remains the leading cause of cancer-related death worldwide, with an overall 5-year relative survival rate of 22.9% (1). Early-stage lung cancer has a better prognosis and is more amenable to treatment, with a 5-year survival rate of 61.2% for patients with local disease compared with 7% for advanced disease. The National Lung Screening Trial (NLST) reported a 20% reduction in lung cancer mortality after three rounds of annual low-dose CT (LDCT) compared with chest radiography (2), and the Dutch-Belgium NELSON trial reported a 26% reduction in lung cancer mortality in male patients and up to a 61% mortality reduction in female patients with LDCT screening compared with no screening (3). While some pulmonary nodules detected at screening LDCT scans are so low risk that no interval evaluation is recommended between screening LDCT examinations, the follow-up for larger nodules is usually an interval LDCT examination before the next annual screening and in a smaller percentage of cases may require diagnostic testing or biopsy (4,5). The NLST used a management paradigm where all noncalcified nodules 4 mm and larger were recommended for follow-up testing, with over 20% of participants having one or more lung nodules in their first round of screening. Of these participants, 90% underwent follow-up examinations, and 96% of nodules were determined to be benign across three rounds of screening. While size and nodule attenuation characteristics generally correlate with the probability of malignancy, definitive assessment of a nodule’s biologic behavior is unknown clinically until the nodule demonstrates more suspicious features, such as growth, or demonstrates stability. Over the past decades, many radiologic guidelines and machine learning methods have been developed for the classification of malignant and benign lung nodules (4–7). However, most of these methods focus on analyzing image features on an individual CT image and comparing these features with those at follow-up examinations to assess nodule progression or stability. Better methods of predicting the biologic behavior of lung nodules found with LDCT lung cancer screening are needed to minimize the potential harm and cost of follow-up diagnostic testing and biopsies for benign nodules while detecting malignancy earlier so that the benefits of early detection can be maximized.
As many diseases, including lung cancer, biologically progress over time, the problems of diagnostic decision-making are by nature sequential. Therefore, it can be expected that disease progression can be effectively formulated by the Markov process and solved by reinforcement learning (RL) algorithms. The purpose of our study was to evaluate the feasibility of leveraging serial LDCT scans to develop a radiomics-based reinforcement learning (S-RRL) model that will have strong predictive ability and can be flexibly deployed to individual years of examinations without waiting for follow-up interval testing and annual screening examinations to detect cancer earlier and reduce unnecessary diagnostic testing and biopsies for benign nodules.
Materials and Methods
Data Sets
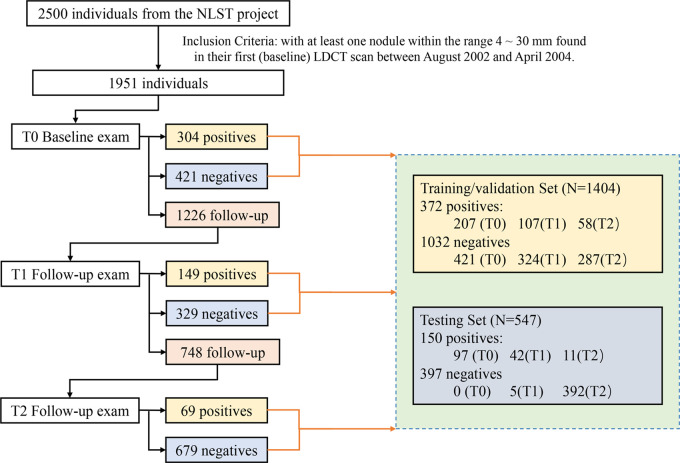
This retrospective Health Insurance Portability and Accountability Act–compliant study was approved by the institutional review board, and informed consent was waived. With permission from the NLST project (2), we collected LDCT scans from 2500 anonymized individuals across all 33 clinical centers that participated in the NLST study between August 2002 and April 2004. The participants underwent annual LDCT screening for up to 3 years and included 639 participants with NLST-reported lung cancer diagnosed with LDCT scans and confirmed by biopsy and 1861 randomly selected participants who were negative for lung cancer. All negative cases were confirmed through 3 years of LDCT scans and/or up to 7 years of subsequent non-CT follow-up (8). Among the 2500 participants, 1951 participants with at least one noncalcified nodule measuring 4–30 mm in diameter at their baseline LDCT scans were included in this study. The LDCT scans were acquired with scanners from four different vendors at the NLST clinical centers. CT scans from GE HealthCare scanners were reconstructed with standard kernel. Philips CT scans were reconstructed with C or D kernel depending on their availability. Siemens CT scans were reconstructed with B30f kernel, and Toshiba CT scans were reconstructed with FC10 kernel. The LDCT image acquisition settings were as follows: 80–120 kVp, 40–120 mAs, and reconstructed at a 1–2.5-mm section interval without intravenous administration of contrast media. Of the 1951 total participants, the 522 participants with lung cancer were randomly split into 372 and 150 for the training/validation and test sets, respectively, and the 1429 participants without lung cancer were split into 1032 and 397, resulting in a total of 1404 and 547 individuals in the training/validation and test sets, respectively (Fig 1). In the NLST, participants were invited to undergo three screenings (T0, T1, and T2) at 1-year intervals with up to 7 years of additional follow-up. Participants diagnosed as positive for lung cancer earlier than T2 were not offered subsequent screening tests, and those with an indeterminate diagnosis were followed up with LDCT up to T2, resulting in a total of 3925 LDCT scans for the 1951 participants during the 3-year NLST study, including 2525 in the training/validation set and 1400 in the test set.
Figure 1:
The flowchart shows the number of participants diagnosed as positive, negative, or indeterminate for lung cancer at each screening year (T0, T1, and T2), and the splitting of the training/validation and test data sets for model development and evaluation. LDCT = low-dose CT, NLST = National Lung Screening Trial.
Radiomics Feature Extraction by Deep Learning Network
Two experienced cardiothoracic radiologists (E.L. and A.C., both with more than 10 years of experience) individually reexamined each documented NLST lung nodule and manually marked the corresponding nodule center on the LDCT images at screening year T0, T1, and T2 for each individual. For individuals with multiple nodules detected at the baseline LDCT screening, the radiologist selected the nodule with the largest size and growth during follow-up (9–11). Each LDCT scan was resampled to an isotropic region with a voxel size of 0.5 × 0.5 mm2 using the spline interpolation method. A region of interest with a side length of 32 mm centered at the radiologist’s manually marked nodule center was extracted. Using nodule region of interests from 2525 available LDCT scans up to 3 years in the training/validation set, a deep residual neural network (ResNet-18) (12) was trained and validated as an encoder to automatically extract 32 deep radiomics features to characterize nodule patterns. The details that relate to the model architecture and training process for feature extraction are described in Appendix S3.
RRL Model Training with Serial CT Scans
The S-RRL model was developed using the RL method with serial LDCT scans in the training/validation set (detailed in the supplemental material). The Markov chain was used to model the transition of nodule patterns from early stage to malignant or benign during the screening years that a lung nodule biologically progressed over time. Based on the offline value iteration algorithm (13), an agent/learner learned to map the states (radiomics features that characterized nodule patterns at each screening examination and patient risk factors) to the diagnostic decisions in a sequential step. The 32 deep radiomics features combined with the individual’s risk factors (age, sex, family history of cancer, and emphysema history) were used to represent the state of each screening examination. The customary mapping was designed based on a value function where the expected cumulative rewards were associated with nodule malignancy. During training of the S-RRL model, the diagnosis action was from the offline NLST data set. A positive reward was assigned if the individual was diagnosed with lung cancer, a negative reward was assigned for a noncancer diagnosis, and a zero reward was assigned when the individual needed follow-up examinations in subsequent years. As a result, the functional value tended to increase when a cancerous nodule was diagnosed as malignant and decreased when a noncancerous nodule was diagnosed as benign or showed no change when follow-up was required. A higher functional value represented a higher risk of malignancy. The details of the RL method and S-RRL model are described in Appendix S1 and S2, respectively.
For comparison, another two RRL models were trained and validated separately with LDCT images from different screening years: (a) a baseline-year RRL (B-RRL) model trained and validated with 1404 LDCT scans acquired from the baseline (T0) screening and (b) a diagnosis-year RRL model (D-RRL) trained and validated with 1404 LDCT scans from the year when the individual was diagnosed as positive for lung cancer (could be T0, T1, or T2) or the last LDCT scan for individuals diagnosed as negative for lung cancer during the NLST study.
Statistical Analysis
The independent test set (n = 547) was used to evaluate the performance of the trained RRL models and clinical models (Lung CT Screening Reporting and Data System [Lung-RADS] and Brock model) for early diagnosis and risk stratification of lung cancer using receiver operating characteristic curve analysis (14–16) and reclassification analysis. The results of Lung-RADS and the Brock model were calculated with required risk factors (17,18), such as patient demographic data and radiologic descriptions of nodules, extracted directly from the NLST data set (2). With the region of interest enclosing a lung nodule at an LDCT scan as the input, the output value from the trained model (value-function; ranging from 0 to 1) was used as the score for assessing the malignancy of the lung nodule. It is important to note that the Brock model and our RRL models are not calibrated to the general screening population. Thus, a higher score on either model indicates a higher risk of malignancy but would not represent the actual risk on the individual patient. The area under the receiver operating characteristic curve (AUC) was used as the performance metric to evaluate the classification performance of the models (14–16,19). The receiver operating characteristic curves of different models were compared using the method of DeLong et al (20). The Hochberg correction (21–23) was employed to adjust the P values for multiple comparisons of S-RRL versus B-RRL and D-RLL and the Brock model. The P values were adjusted using the R (R Foundation for Statistical Computing) software function p.adjust and were considered statistically significant if less than .05. We developed the RRL models using Python 3.6.9. (Python Software Foundation) and PyTorch 1.8.1. The receiver operating characteristic curve and other statistical analyses were performed using the statistical software package ORDBM MRMC 3.0 in Java (Oracle Corporation) (24).
We also conducted reclassification analysis to assess the impact of the S-RRL model on patient risk stratification. The net reclassification index (NRI; calculated as P[up / event] – P [down / event] + P[down / nonevent] – P[up / nonevent], where P is the percentage, up is an escalated risk, and down is a de-escalated risk) (25) was used to quantify the risk prediction increments by adding our S-RRL model to the clinical models of Lung-RADS and the Brock model. We defined the thresholds for low-, medium-, and high-risk subgroups by S-RRL (<0.35, 0.35–0.55, and >0.55), Lung-RADS (<3, 3, and >3) (26,27), and the Brock model (<0.01, 0.01–0.05, >0.05), corresponding to the Lung-RADS buckets (27). The statistical significance was determined using the z statistic following the McNamar test (28).
Results
Participant Characteristics
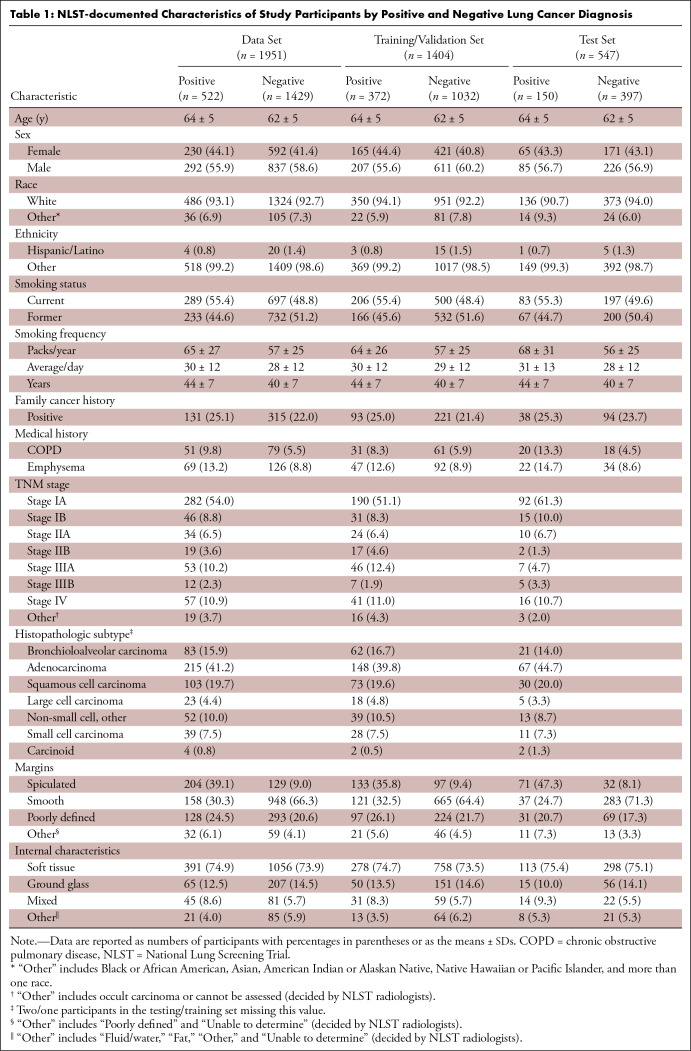
A total of 1951 participants were included in this study. In the training set (1404 participants; average age, 63 years [range, 55–74 years]; 818 male and 586 female participants), the average size of the nodules at baseline screening LDCT was 8.2 mm (range, 4–30 mm) in longest diameter. In the test set (547 participants; average age, 62 years [range, 55–74 years]; 311 male and 236 female participants), the average size of the baseline screening LDCT nodules was 9.6 mm (range, 4–30 mm) in longest diameter. The details of the NLST-documented demographics are summarized in Table 1.
Table 1:
NLST-documented Characteristics of Study Participants by Positive and Negative Lung Cancer Diagnosis
AUC Performance
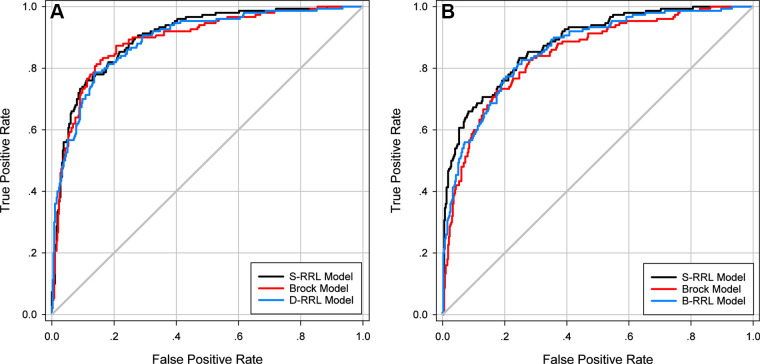
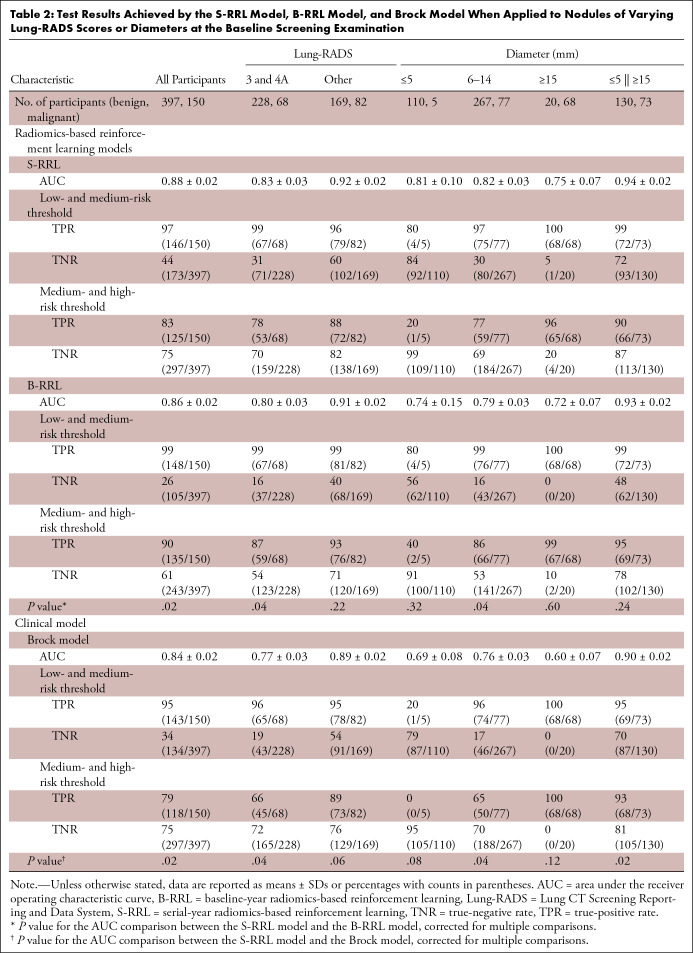
The three RRL models (S-RRL, B-RRL, and D-RRL) trained with LDCT scans from different screening years and the Brock model were directly deployed to the test set (n = 547) at the baseline and/or the diagnosis year for each participant. Note that our S-RRL model was trained with serial LDCT scans based on the Markov chain process. Once trained, it can be flexibly deployed to the LDCT scans at any single screening year (T0, T1, or T2) without requiring prior or subsequent LDCT scans. Figure 2 shows the test receiver operating characteristic curves for the classification of positive and negative cases by the three RRL models (S-RRL, B-RRL, and D-RRL) and the Brock model at the baseline screening year (Fig 2A) and the diagnosis year (ie, the year when the individual was diagnosed as positive for lung cancer or the last LDCT scan for non–lung cancer cases during the NLST study) (Fig 2B). With 547 baseline LDCT scans in the test set, the S-RRL model trained with serial LDCT scans achieved a test AUC of 0.88 ± 0.02 (SD) (95% CI: 0.85, 0.91) for the identification of individuals with lung cancer at the baseline LDCT scan, while the B-RRL model trained with only the baseline LDCT scans achieved a test AUC of 0.86 ± 0.02 (95% CI: 0.83, 0.90; P = .02), and the Brock model achieved a test AUC of 0.84 ± 0.02 (95% CI: 0.81, 0.88; P = .02) (Table 2). When the trained models were deployed to the LDCT scans at the diagnosis year, the S-RRL model achieved a test AUC of 0.90 ± 0.01 (95% CI: 0.87, 0.93), which was comparable to the AUC of 0.89 ± 0.02 (95% CI: 0.86, 0.92; P = .35) by the D-RRL model trained with only the diagnosis year’s LDCT scans and showed no evidence of a difference with the Brock model with an AUC of 0.89 ± 0.02 (95% CI: 0.86, 0.92; P = .35).
Figure 2:
Test receiver operating characteristic curves for classification of lung cancer by the radiomics-based reinforcement learning (RRL) models and the Brock model when deployed to the low-dose CT (LDCT) scans at (A) the baseline screening examinations and (B) the diagnosis year examinations. B-RRL = baseline-year radiomics-based reinforcement learning, D-RRL = diagnosis-year radiomics-based reinforcement learning, S-RRL = serial-year radiomics-based reinforcement learning.
Table 2:
Test Results Achieved by the S-RRL Model, B-RRL Model, and Brock Model When Applied to Nodules of Varying Lung-RADS Scores or Diameters at the Baseline Screening Examination
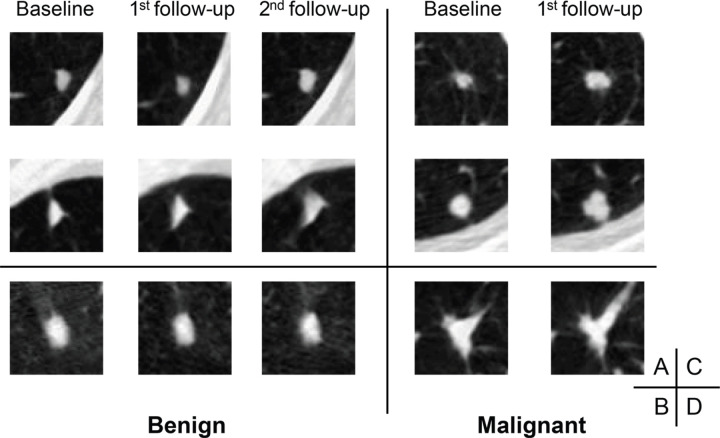
Table 2 shows the test AUC, true-positive rate (sensitivity), and true-negative rate (specificity) achieved by the different models for subgroup nodules categorized by the Lung-RADS at the baseline screening year. The nodules in categories of Lung-RADS 3 and 4A are considered indeterminate nodules that require immediate attention with 6- or 3-month LDCT follow-up (29–31). In our test set, 227 of these nodules were benign and 68 were malignant. The S-RRL model achieved a significantly higher test AUC of 0.83 ± 0.03 (95% CI: 0.78, 0.89) than both the B-RRL model (AUC, 0.80 ± 0.03 [95% CI: 0.74, 0.86]; P = .04) and the Brock model (AUC, 0.77 ± 0.03 [95% CI: 0.70, 0.83]; P = .04). Figure 3 shows some nodule classification examples by using the S-RRL model and the Brock model.
Figure 3:
Axial low-dose CT images show examples of nodules without contrast media that were classified as Lung CT Screening Reporting and Data System (Lung-RADS) 3 or 4A by the serial-year radiomics-based reinforcement learning (S-RRL) model and the Brock model at the time of baseline examinations. (A) With the baseline scan, the S-RRL model correctly identified two benign nodules (underwent 2 years of follow-up scans) as low risk, while the Brock model identified them as medium risk. (B) A benign nodule was identified as medium and high risk by the S-RRL and Brock models, respectively. (C) Two malignant nodules were identified as high risk by the S-RRL model, but the Brock model identified them as low risk. (D) A malignant nodule was identified as medium risk by both models.
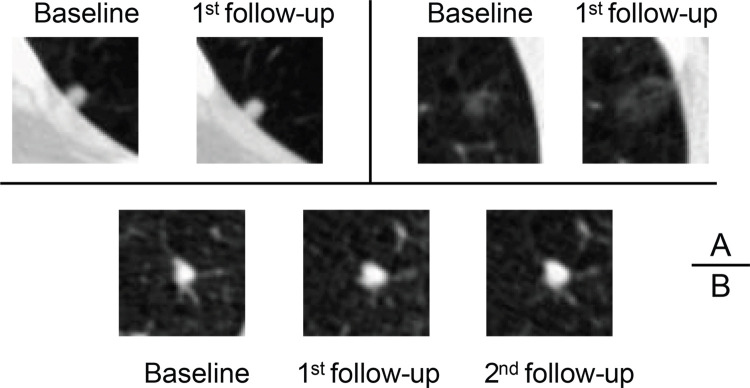
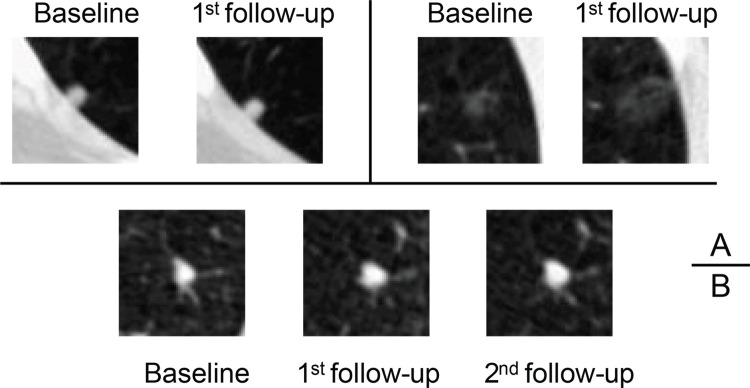
For nodules with a diameter of 5 mm or less in our test set (110 benign and five malignant nodules), the S-RRL model achieved a test AUC of 0.81 ± 0.10 (95% CI: 0.61, >0.99). With selected thresholds (described in the Statistical Analysis), only one of 110 benign nodules was classified as high risk. Among the five malignant nodules, two were considered low risk, two were considered medium risk, and one was considered high risk. In comparison, the Brock model categorized five of 110 benign nodules as high risk and identified four malignant nodules as low risk and one malignant nodule as medium risk. Figure 4 shows classification examples for three nodules by the S-RRL and Brock models. Appendix S4 provides more information about the classification of those five malignant nodules.
Figure 4:
Axial low-dose CT images show examples of small nodules (5 mm or less) without contrast media classified by the serial-year radiomics-based reinforcement learning (S-RRL) model and the Brock model at the baseline screening year. (A) Two malignant nodules were mistakenly classified as low risk by both models (false negatives). (B) The Brock model correctly classified this nodule as low risk. It was the only false-positive classification by the S-RRL model, likely because of the potential of nodule growth predicted by the S-RRL model which was confirmed at the follow-up scans.
For classification of nodules with nodule size ranging from 6 to 14 mm in diameter (Table 2), the S-RRL model achieved a significantly higher test AUC of 0.82 ± 0.03 (95% CI: 0.77, 0.87) than both the B-RRL model (AUC, 0.79 ± 0.03 [95% CI: 0.73, 0.85]; P = .04) and the Brock model (AUC, 0.76 ± 0.03 [95% CI: 0.69, 0.82]; P = .04). Among 88 nodules larger than 14 mm, 20 were confirmed to be benign through 3 sequential years of LDCT examinations, resulting in low specificities (≤0.20) but high sensitivities (≥0.96) for all models when they were deployed to the baseline scans.
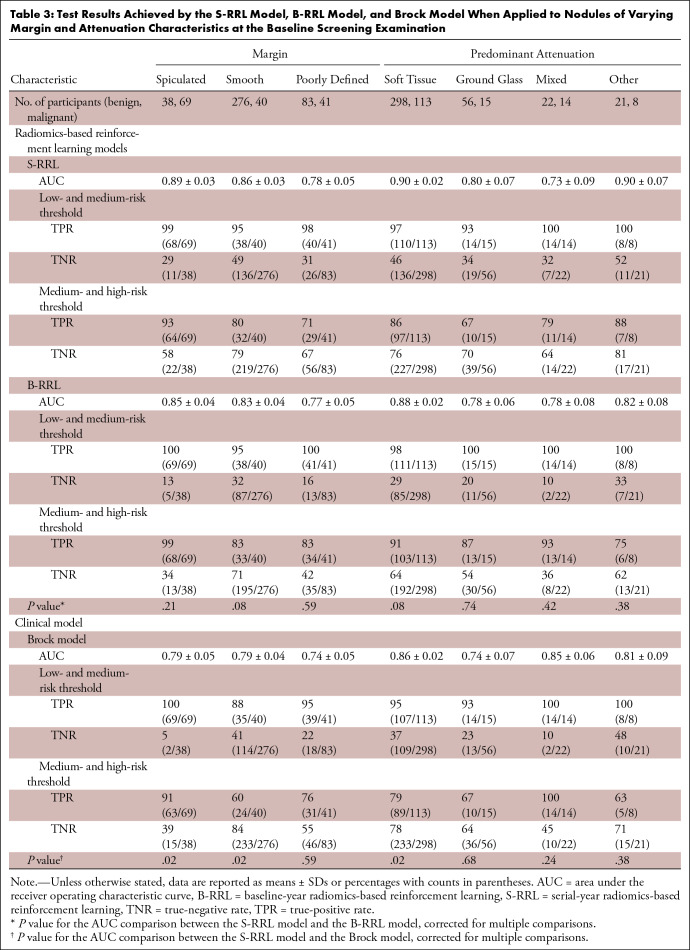
Table 3 shows the classification results by the S-RRL model and comparisons with the Brock model and the B-RRL model for different nodule groups that were categorized based on nodule margins and predominant attenuation (internal characteristics) at the baseline screening year. The results showed that the S-RRL model achieved significantly higher accuracies than the Brock model for noncalcified solid nodules as well as the nodules with spiculated or smooth margin. For nonsolid nodules such as ground-glass opacity, subsolid (mixed), and other nodules, the S-RRL model achieved AUCs higher than or comparable to the Brock model and the B-RRL model without evidence of significance. Figure 5 shows some classification examples for nodules with different margin and attenuation characteristics.
Table 3:
Test Results Achieved by the S-RRL Model, B-RRL Model, and Brock Model When Applied to Nodules of Varying Margin and Attenuation Characteristics at the Baseline Screening Examination
Figure 5:
Axial low-dose CT images show examples of nodules without contrast media with different margins and internal characteristics classified by the serial-year radiomics-based reinforcement learning (S-RRL) model and the Brock model at baseline screening examination. (A) The S-RRL model correctly diagnosed three benign nodules as low risk (underwent 2 years of follow-up scans) (true negatives), while the Brock model mistakenly identified them as high or medium risk (false positives). (B) Three benign nodules were mistakenly identified as high risk (false positives) by both models. (C) Three malignant nodules were correctly diagnosed as high risk by the S-RRL model (true positives), but the Brock model diagnosed them as medium risk (false negatives). (D) Three malignant nodules were mistakenly identified as medium risk by both models (false negatives). GGO = ground-glass opacity.
NRI in Lung Cancer Risk Stratification
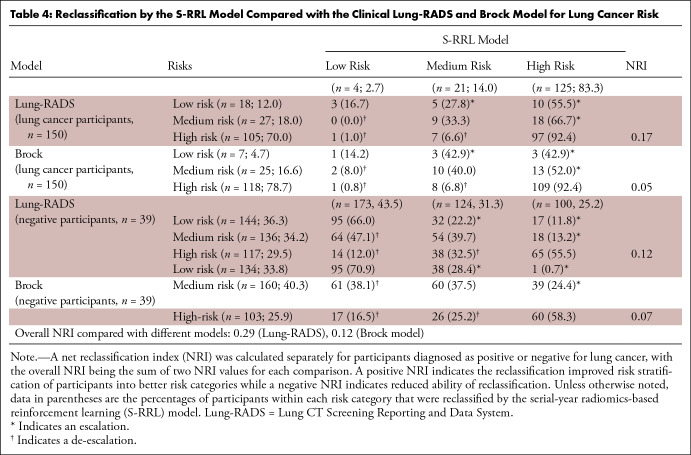
Table 4 shows the NRI for positive and negative cases separately. Among the 150 cancer cases, 33 individuals (22.0%) classified as lower risk based on Lung-RADS (15 with low risk, 18 with medium risk) were escalated to higher risk by the S-RRL model, and eight Lung-RADS–determined high-risk individuals (5.3%) were de-escalated to lower risks by S-RRL (one as low risk and seven as medium risk). The NRI of 0.17 (33/150 – 8/150) for 150 cancer cases was calculated by the difference between the proportion of escalated and de-escalated individuals. For the 397 negative cases, the S-RRL model de-escalated 116 individuals (29.2%) (14 and 38 with high risk, 64 with medium risk) to a lower risk category and escalated 67 individuals (17%) to a higher risk category, achieving an NRI of 0.12 (116/397 – 67/397). The overall NRI was 0.29 (0.17 + 0.12) with a z statistic of 5.31 (P < .001), indicating that the S-RRL was able to reclassify individuals more accurately into different risk categories than Lung-RADS. Compared with the Brock model (Table 4), 123 individuals, including 19 (12.7%) with lung cancer and 104 (26.2%) negative for lung cancer, were correctly reclassified (either escalated or de-escalated) by the S-RRL model with an overall NRI of 0.12 with a z statistic of 2.41 (P = .008).
Table 4:
Reclassification by the S-RRL Model Compared with the Clinical Lung-RADS and Brock Model for Lung Cancer Risk
Figure 6 shows the number of escalated or de-escalated individuals in different categories of nodule characteristics. For lung cancer cases, the S-RRL model correctly escalated the cancer risks of a large number of cases containing noncalcified solid (soft tissue) nonspiculated (smooth or poorly defined margin) nodules from the classification by either Lung-RADS or the Brock model and also escalated the cancer risks of ground-glass opacity nodules from Lung-RADS while a small number of nodules in each category were de-escalated. For noncancer cases, the S-RRL model correctly de-escalated the cancer risks of a large number of cases with solid nodules or nodules with a smooth margin from Lung-RADS. However, the cancer risks of many solid or smooth margin nodule cases were either correctly de-escalated or incorrectly escalated from the Brock model.
Figure 6:
Bar graph shows the distribution of reclassified individuals (A) without cancer and (B) with lung cancer in different nodule characteristic categories. GGO = ground-glass opacity, Lung_RADS = Lung CT Screening Reporting and Data System.
Discussion
An accurate and practical model that can classify an LDCT-detected lung nodule as malignant or benign as early as possible, particularly at the first screening, will potentially reduce delayed diagnosis. Thus, such a model would reduce the risk of morbidity and mortality and costs in a screening program and minimize interval diagnostic testing, anxiety, and procedures for patients who ultimately do not have a malignancy. In this study, we used the RL method to develop a radiomics-based predictive model for the classification of lung nodules and demonstrated that the radiomics-based RL model trained with time-serial LDCT scans (S-RRL) has the potential to improve the early diagnosis of screen-detected lung nodules at the baseline screening. Trained with serial LDCT scans acquired at multiple time points based on the formulation of serial data with the Markov chain process, the S-RRL model used the reinforcement learning method to discover the trajectory of disease evolution. This trajectory represents the pattern and pace of disease progression over time, allowing for more reliable assessment of the malignancy risk for individual nodules. It not only provides a prediction at an early time point but also predicts the nodule state at future time points. Based on the radiomics features that were automatically learned and extracted by a residual neural network (ResNet-18) to characterize nodule patterns manifested at LDCT scans at each sequential time point, we used the RL method to establish the correlation of the nodule characteristics between baseline and follow-up serial scans which leads to optimized decision-making of nodule diagnosis. Our study demonstrated that once our S-RRL model was trained with serial scans, it could be flexibly deployed to any single scan without requiring additional prior or follow-up scans and achieved significantly higher performance (AUC; P < .05) than that of the RRL models trained with only a single year of scans (B-RRL and D-RRL model), not only at the baseline, but also at the diagnosis year when it is more clear to determine if nodules are benign or malignant. Moreover, we examined the impact of the S-RRL model on patient stratification by conducting a reclassification analysis. The positive NRI values indicated that the S-RRL model can significantly improve risk stratification for lung cancer in comparison with Lung-RADS and the Brock model.
In the past decades, many methods have explored the potential of using radiomics for lung nodule classification, including statistical learning–based methods (eg, support vector machine and naive Bayes) and convolutional neural network–based deep learning methods (32–34). As lung cancer biologically progresses over time, the radiomics used in most of the methods that focused on single CT scans may not be indicative of the overall risk for lung cancer, and the temporal analysis to estimate lung nodule changes over time often requires prior examinations. Unlike the conventional models that compare with prior CT scans for temporal analysis during both the training and deployment processes, the S-RRL model required only the prior or serial examinations during training. The results indicated that the S-RRL model can conceptually learn the paths of nodule transition to typically malignant or to typically benign over time. Through iterative reinforcement learning, the model was trained to transfer information from future states back to the present. Thus, when the trained S-RRL model is deployed to the baseline scan of a new case, it will predict the progression of the nodule characteristics through the learned conceptual path based on features manifested at the baseline scan. Moreover, as the RL method can learn the mapping directly from sequential experiences (offline training data) without using a rigorous mathematical model, the unknown and time-varying dynamics can be effectively accounted for by the RL agent (35).
Our results showed that the S-RRL model outperformed both Lung-RADS and the Brock model in terms of overall performance for early diagnosis of lung cancer at the time of baseline screening. This improvement was evident not only in statistical analysis but also in clinical relevance. Compared with the standard Lung-RADS risk stratification, among the 150 individuals with lung cancer, the cancer risks of 33 and eight participants were escalated and de-escalated by the S-RRL model, respectively. The net gain of 25 escalated individuals might potentially impact their mortality if early intervention were implemented. For the 397 individuals diagnosed as negative for lung cancer, the cancer risks of 116 and 67 individuals were de-escalated and escalated by the S-RRL model, respectively. The gain in de-escalation might not have a direct impact on mortality but could potentially reduce unnecessary follow-up and the associated costs and, more importantly, reduce the individual’s anxiety during the follow-up years. Moreover, the S-RRL model significantly improved the classification of indeterminate nodules that were solid and 6 to 14 mm in diameter or categorized as Lung-RADS 3 or 4A. For 253 individuals who had solid nodules ranging from 6 to 14 mm in diameter, the cancer risks of 11 and four individuals were escalated and de-escalated by the S-RRL model, respectively, among the 55 individuals diagnosed with lung cancer, while 90 and 13 individuals were de-escalated and escalated, respectively, among the 198 individuals diagnosed as negative for lung cancer. As these indeterminate nodules usually require follow-up examinations in clinical settings, accurate risk stratification of those nodules, especially at the baseline screening year, has clinical significance for improving early diagnosis of lung cancer, reducing unnecessary follow-up and costs and more appropriately determining the aggressiveness of next management steps. Our results also showed that small malignant nodules less than 6 mm in diameter could be correctly identified when they manifested growth on LDCT images over time, but these nodules were more challenging to detect when they did not manifest growth or grew slowly. This requires further investigation in future studies. Appendix S4 provides more information about the classification of those small malignant nodules.
There were limitations to this study. We used the NLST data set from a randomized, multicenter trial involving 33 centers, which remains the largest available data set in terms of the number and the diversity of enrolled participants. Although the NLST data may be considered outdated because of its collection period, numerous studies have used this data set as an external test set to explore new methods and/or validate previous or newly developed methods. The evolving CT technologies are expected to provide LDCT scans with better image quality. Computer models potentially can further improve diagnostic performances when large sets of new data from advanced CT scanners become available. We are in the process of collecting new internal and external independent data sets to further validate our model’s performance and to improve its generalizability as needed. Another limitation was the retrospective nature of the NLST data set. The benign nodules without pathology might be a concern since they may include false-negative cases. To minimize potential false negatives, our independent test set included only benign nodules that underwent either 1 or 2 years of follow-up and other forms of non-CT follow-ups beyond 2 years. For individuals with lung cancer with multiple nodules, not all of the nodules were pathology-proven and the NLST data did not identify pathology-proven lesions with nodule locations for the LDCT scans. We selected the most suspicious nodule (the one with the largest size or growth rate chosen by our radiologists) as the malignant lesion in our analysis, which may be subjective. We will improve our RRL model in future studies by using only nodules with confirmed pathology and corresponding locations in the LDCT scans to alleviate this limitation. We chose risk stratification thresholds as the operating points for the S-RRL model primarily for the comparison with the clinical Lung-RADS and the Brock model and did not consider other factors involved in clinical practice (eg, the cost and outcome trade-offs between sensitivity and specificity). Furthermore, the use of the NRI has limitations (36). We intended to use the NRI as a supplemental assessment to the receiver operating characteristic analysis, providing information about the potential relative gain or loss from the correct and incorrect risk escalation or de-escalation by the new model in comparison with the baseline models (Lung-RADS and the Brock model). Finally, although the current S-RRL model was shown to be promising in providing statistically significant improvement in risk stratification compared with the clinical models, the improvements were still modest. Further studies are needed to improve the predictive model, including enlarging the data set and exploring additional effective radiomics features by deep learning and traditional methods. The generalizability of the model also has to undergo rigorous validation with large prospective external data sets before clinical translation. In addition, in order for a machine learning model to be acceptable as decision support by physicians, the data processing steps have to be automated without impeding the clinical workflow and be efficient to use in comparison to the current clinical models.
In conclusion, we evaluated the feasibility of developing a deep radiomics feature–based reinforcement learning model trained with serial LDCT scans to improve the early diagnosis of screen-detected lung nodules. The results demonstrated that the S-RRL model could achieve significantly higher performance in diagnosing lung cancers 1 or 2 years earlier at baseline screening LDCT examinations than those achieved by the models (B-RRL, Brock model, and Lung-RADS) solely relying on single-year LDCT scans. This study indicated that the exploitation of the association between lung nodule progression and their underlying early-stage biologic environment as expressed in their radiomics characteristics may play an important role in lung cancer diagnosis.
Supported by the National Institutes of Health (grant no. U01CA216459).
Disclosures of conflicts of interest: Y.W. No relevant relationships. C.Z. No relevant relationships. L.Y. No relevant relationships. E.L. No relevant relationships. H.P.C. No relevant relationships. A.L. No relevant relationships. L.M.H. No relevant relationships. E.A.K. No relevant relationships.
Abbreviations:
- AUC
- area under the receiver operating characteristic curve
- B-RRL
- baseline-year RRL
- D-RRL
- diagnosis-year RRL
- LDCT
- low-dose CT
- Lung-RADS
- Lung CT Screening Reporting and Data System
- NLST
- National Lung Screening Trial
- NRI
- net reclassification index
- RL
- reinforcement learning
- RRL
- radiomics-based reinforcement learning
- S-RRL
- serial-year RRL
References
- 1. Cancer Stat Facts: Lung and Bronchus Cancer . National Cancer Institute . https://seer.cancer.gov/statfacts/html/lungb.html. Accessed September 2022.
- 2. National Lung Screening Trial Research Team ; Aberle DR , Adams AM , et al . Reduced lung-cancer mortality with low-dose computed tomographic screening . N Engl J Med 2011. ; 365 ( 5 ): 395 – 409 . [DOI] [PMC free article] [PubMed] [Google Scholar]
- 3. De Koning H , Van Der Aalst C , Ten Haaf K , Oudkerk M . PL02.05 effects of volume CT lung cancer screening: mortality results of the NELSON randomised-controlled population based trial . J Thorac Oncol 2018. ; 13 ( 10 ): S185 . [Google Scholar]
- 4. Uthoff J , Stephens MJ , Newell JD Jr , et al . Machine learning approach for distinguishing malignant and benign lung nodules utilizing standardized perinodular parenchymal features from CT . Med Phys 2019. ; 46 ( 7 ): 3207 – 3216 . [DOI] [PMC free article] [PubMed] [Google Scholar]
- 5. Venkadesh KV , Setio AAA , Schreuder A , et al . Deep Learning for Malignancy Risk Estimation of Pulmonary Nodules Detected at Low-Dose Screening CT . Radiology 2021. ; 300 ( 2 ): 438 – 447 . [DOI] [PubMed] [Google Scholar]
- 6. Loverdos K , Fotiadis A , Kontogianni C , Iliopoulou M , Gaga M . Lung nodules: A comprehensive review on current approach and management . Ann Thorac Med 2019. ; 14 ( 4 ): 226 – 238 . [DOI] [PMC free article] [PubMed] [Google Scholar]
- 7. White CS , Dharaiya E , Dalal S , Chen R , Haramati LB . Vancouver Risk Calculator Compared with ACR Lung-RADS in Predicting Malignancy: Analysis of the National Lung Screening Trial . Radiology 2019. ; 291 ( 1 ): 205 – 211 . [DOI] [PubMed] [Google Scholar]
- 8. National Lung Screening Trial Research Team . Lung Cancer Incidence and Mortality with Extended Follow-up in the National Lung Screening Trial . J Thorac Oncol 2019. ; 14 ( 10 ): 1732 – 1742 . [DOI] [PMC free article] [PubMed] [Google Scholar]
- 9. Wood DE , Kazerooni EA , Baum SL , et al . Lung cancer screening, version 3.2018, NCCN clinical practice guidelines in oncology . J Natl Compr Canc Netw 2018. ; 16 ( 4 ): 412 – 441 . [DOI] [PMC free article] [PubMed] [Google Scholar]
- 10. Tammemagi MC , Schmidt H , Martel S , et al . Participant selection for lung cancer screening by risk modelling (the Pan-Canadian Early Detection of Lung Cancer [PanCan] study): a single-arm, prospective study . Lancet Oncol 2017. ; 18 ( 11 ): 1523 – 1531 . [DOI] [PubMed] [Google Scholar]
- 11. Callister MEJ , Baldwin DR , Akram AR , et al . British Thoracic Society guidelines for the investigation and management of pulmonary nodules . Thorax 2015. ; 70 ( Suppl 2 ): ii1 – ii54 [Published correction appears in Thorax 2015;70(12):1188.]. [DOI] [PubMed] [Google Scholar]
- 12. He K , Zhang X , Ren S , Sun J . Deep Residual Learning for Image Recognition . In: 2016 IEEE Conference on Computer Vision and Pattern Recognition (CVPR) . IEEE; , 2016. ; 770 – 778 . [Google Scholar]
- 13. Lizotte D . Convergent fitted value iteration with linear function approximation . Adv Neural Inf Process Syst 2011. ; 24 : 2537 – 2545 . [Google Scholar]
- 14. Swets JA . ROC analysis applied to the evaluation of medical imaging techniques . Invest Radiol 1979. ; 14 ( 2 ): 109 – 121 . [DOI] [PubMed] [Google Scholar]
- 15. Bamber D . The area above the ordinal dominance graph and the area below the receiver operating characteristic graph . J Math Psychol 1975. ; 12 ( 4 ): 387 – 415 . [Google Scholar]
- 16. Mann HB , Donald R. Whitney . On a test of whether one of two random variables is stochastically larger than the other . Ann Math Stat 1947. ; 18 ( 1 ): 50 – 60 . [Google Scholar]
- 17. Winter A , Aberle DR , Hsu W . External validation and recalibration of the Brock model to predict probability of cancer in pulmonary nodules using NLST data . Thorax 2019. ; 74 ( 6 ): 551 – 563 . [DOI] [PubMed] [Google Scholar]
- 18. Pinsky PF , Gierada DS , Black W , et al . Performance of Lung-RADS in the National Lung Screening Trial: a retrospective assessment . Ann Intern Med 2015. ; 162 ( 7 ): 485 – 491 . [DOI] [PMC free article] [PubMed] [Google Scholar]
- 19. Tukey J . Bias and confidence in not quite large samples . Ann Math Stat 1958. ; 29 ( 2 ): 614 . [Google Scholar]
- 20. DeLong ER , DeLong DM , Clarke-Pearson DL . Comparing the areas under two or more correlated receiver operating characteristic curves: a nonparametric approach . Biometrics 1988. ; 44 ( 3 ): 837 – 845 . [PubMed] [Google Scholar]
- 21. Hochberg Y . A sharper Bonferroni procedure for multiple tests of significance . Biometrika 1988. ; 75 ( 4 ): 800 – 802 . [Google Scholar]
- 22. Dmitrienko A , D’Agostino RB Sr . Multiplicity considerations in clinical trials . N Engl J Med 2018. ; 378 ( 22 ): 2115 – 2122 . [DOI] [PubMed] [Google Scholar]
- 23. Chen S-Y , Feng Z , Yi X . A general introduction to adjustment for multiple comparisons . J Thorac Dis 2017. ; 9 ( 6 ): 1725 – 1729 . [DOI] [PMC free article] [PubMed] [Google Scholar]
- 24. Dorfman DD , Berbaum KS , Metz CE . Receiver operating characteristic rating analysis. Generalization to the population of readers and patients with the jackknife method . Invest Radiol 1992. ; 27 ( 9 ): 723 – 731 . [PubMed] [Google Scholar]
- 25. Leening MJG , Vedder MM , Witteman JCM , Pencina MJ , Steyerberg EW . Net reclassification improvement: computation, interpretation, and controversies: a literature review and clinician’s guide . Ann Intern Med 2014. ; 160 ( 2 ): 122 – 131 . [DOI] [PubMed] [Google Scholar]
- 26. Huang P , Lin CT , Li Y , et al . Prediction of lung cancer risk at follow-up screening with low-dose CT: a training and validation study of a deep learning method . Lancet Digit Health 2019. ; 1 ( 7 ): e353 – e362 . [DOI] [PMC free article] [PubMed] [Google Scholar]
- 27. Ardila D , Kiraly AP , Bharadwaj S , et al . End-to-end lung cancer screening with three-dimensional deep learning on low-dose chest computed tomography . Nat Med 2019. ; 25 ( 6 ): 954 – 961 [Published correction appears in Nat Med 2019;25(8):1319.]. [DOI] [PubMed] [Google Scholar]
- 28. McNemar Q . Note on the sampling error of the difference between correlated proportions or percentages . Psychometrika 1947. ; 12 ( 2 ): 153 – 157 . [DOI] [PubMed] [Google Scholar]
- 29. Zhang EW , Shepard JO , Kuo A , et al . Characteristics and Outcomes of Lung Cancers Detected on Low-Dose Lung Cancer Screening CT . Cancer Epidemiol Biomarkers Prev 2021. ; 30 ( 8 ): 1472 – 1479 . [DOI] [PubMed] [Google Scholar]
- 30. Rivera MP , Durham DD , Long JM , et al . Receipt of Recommended Follow-up Care After a Positive Lung Cancer Screening Examination . JAMA Netw Open 2022. ; 5 ( 11 ): e2240403 . [DOI] [PMC free article] [PubMed] [Google Scholar]
- 31. Mendoza DP , Petranovic M , Som A , et al . Lung-RADS category 3 and 4 nodules on lung cancer screening in clinical practice . AJR Am J Roentgenol 2022. ; 219 ( 1 ): 55 – 65 . [DOI] [PubMed] [Google Scholar]
- 32. Pradeep KR , Naveen NC . Lung cancer survivability prediction based on performance using classification techniques of support vector machines, C4.5 and Naive Bayes algorithms for healthcare analytics . Procedia Comput Sci 2018. ; 132 : 412 – 420 . [Google Scholar]
- 33. Monkam P , Qi S , Ma H , Gao W , Yao Y , Qian W . Detection and Classification of Pulmonary Nodules Using Convolutional Neural Networks: A Survey . IEEE Access 2019. ; 7 : 78075 – 78091 . [Google Scholar]
- 34. Forte GC , Altmayer S , Silva RF , et al . Deep learning algorithms for diagnosis of lung cancer: a systematic review and meta-analysis . Cancers (Basel) 2022. ; 14 ( 16 ): 3856 . [DOI] [PMC free article] [PubMed] [Google Scholar]
- 35. Buşoniu L , de Bruin T , Tolić D , Kober J , Palunko I . Reinforcement learning for control: Performance, stability, and deep approximators . Annu Rev Control 2018. ; 46 : 8 – 28 . [Google Scholar]
- 36. Pepe MS , Fan J , Feng Z , Gerds T , Hilden J . The net reclassification index (NRI): a misleading measure of prediction improvement even with independent test data sets . Stat Biosci 2015. ; 7 ( 2 ): 282 – 295 . [DOI] [PMC free article] [PubMed] [Google Scholar]


