Abstract
To probe the genetic determinants controlling the interaction between the retroviral restriction gene Fv1 and its murine leukemia virus target, we set out to develop rapid, transient assays for Fv1 function. Cells were transfected or transduced with Fv1 expression plasmids which can produce green fluorescent protein via an internal ribosome entry site positioned between the Fv1 and green fluorescent protein coding sequences. Fv1 function was then assessed by comparing virus replication in green fluorescent protein-positive and -negative cells, using retroviral vectors encoding a second fluorescent marker, yellow fluorescent protein, or β-galactosidase. Using this assay, we could show that Fv1 specificities were not as absolute as previously thought, since the Fv1b allele was capable of interacting with “nonrestricted” B- and NB-tropic viruses and by shuffling the n- and b-alleles of Fv1, it was possible to generate a Fv1 molecule capable of restricting N-, B-, and NB-tropic viruses equally efficiently. Further, we could show that the presence of nonrestricting Fv1 in the same cell as restrictive Fv1 abrogates restriction, implying competition for binding to the retroviral target.
Starting in the 1960s, a number of genes which affect the susceptibility of mice to infection by MLV have been described (21). Many of these genes were found to alter host immune responses to virus (11); only a few represent cell autonomous resistance genes (21). One of these is Fv1 (Friend virus susceptibility 1). First described in 1970 (15), it acts to block retrovirus replication at a stage after penetration but before integration (12, 20). Early studies showed that murine leukemia viruses could be subdivided into three categories based on their ability to replicate on cells derived from the embryos of different strains of mice (16). The still current classification into N-, B-, and NB-tropic viruses is based on whether they are restricted, in vitro and in vivo, by one of the two major Fv1 alleles; B-tropic viruses are restricted by Fv1n, whereas N-tropic viruses are restricted by Fv1b. The NB-tropic viruses appear unaffected by Fv1, since they grow equally well in mice carrying either allele of Fv1 or in cells derived from them. Virus resistance mediated by Fv1 is dominant in genetic crosses, so that Fv1n/b heterozygous animals are resistant to both N- and B-tropic viruses (19). Fv1 restriction is not absolute but results in a 50- to 1,000-fold reduction in viral titer in vitro (10).
Initial studies showed that viral N- or B-tropism is determined by two adjacent amino acids at positions 109 and 110 of CA. N-tropic viruses have glutamine and arginine, at these positions, and B-tropic viruses have threonine and glutamate (7, 18). A more recent study indicates that only the amino acid at position 110 is important (14). The changes resulting in NB-tropism remain to be fully defined. Consistent with the site of action of Fv1, CA remains associated with reverse transcription complexes during the early stages of the retroviral life cycle (9).
Fv1 appears to represent an ancient retroviral gag protein co-opted by the host cell to prevent viral infections (2, 3). The Fv1b allele consists of a single ORF of approximately 1,400 nucleotides encoding a protein product of 459 amino acids (3). Fv1n encodes a protein 19 amino acids shorter than the Fv1b product (3). There are also two other differences between the two alleles near the C terminus: Fv1b has a Glu and Fv1n has a lysine at position 358, and the Arg in Fv1b is replaced by a valine in Fv1n at position 399.
With the cloned Fv1 in hand, we wanted to study the nature of the interaction between the Fv1 gene product and the MLV CA target. One aim has been to carry out a detailed genetic study of the determinants regulating the specificity of this interaction. To facilitate this analysis, we wanted to set up a reliable assay for Fv1 function which would allow us to test multiple Fv1 and CA derivatives rapidly. This paper describes such an assay and some of the first insights into the mechanism of Fv1 that it provides.
MATERIALS AND METHODS
Abbreviations used in this paper.
MLV, murine leukemia virus; CA, the MLV capsid protein (p30); CMV, cytomegalovirus; EGFP, enhanced green fluorescent protein; EYFP, enhanced yellow fluorescent protein; IRES, internal ribosome entry site; ORF, open reading frame; VSV G, vesticular stomatitis virus G protein; B-3T3, BALB 3T3 cells; N-3T3, NIH 3T3 cells; DMEM, Dulbecco's modified Eagle medium; FACS, fluorescence-activated cell sorter; X-Gal, 5-bromo-4-chloro-3-indolyl-β-d-galactopyranoside.
Recombinant DNA.
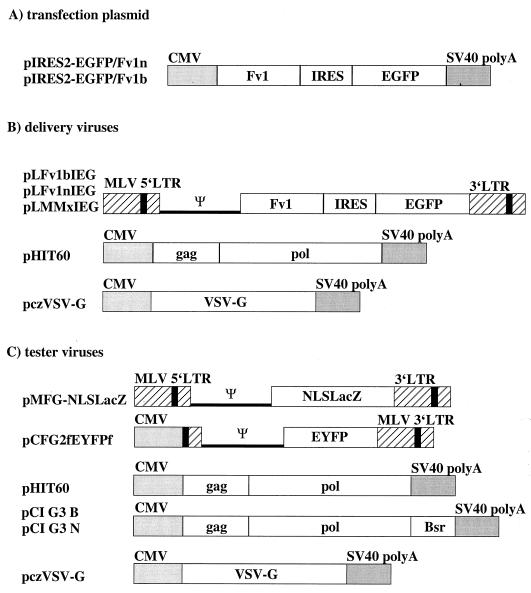
All recombinant DNA work was done by established techniques (22). The constructs used are illustrated in Fig. 1 and are described below; the structure of each plasmid was verified by restriction mapping and/or sequencing prior to use. All DNA preparations were purified on Qiagen columns prior to transfection.
FIG. 1.
Schematic drawings of the plasmid constructs used in the assays. (A) pIRES2-EGFP/Fv1n and pIRES2-EGFP/Fv1b are Fv1 expression vectors used for the transfection assay. Driven by the CMV immediate-early promoter, the Fv1 alleles and EGFP are expressed from a bicistronic mRNA. (B) Constructs used for transient production of delivery viruses after transfection into 293T cells. pLFv1nIEG, pLFv1bIEG, and pLFv1MMxIEG are retroviral packaging vectors for Fv1 and EGFP expression in the target cell; pHIT60 is a gag-pol expression plasmid; and pczVSV-G is a VSV G expression plasmid. (C) Constructs for tester viruses. pCI G3 N, pCI G3 B, and pHIT60 are N-, B-, or NB-tropic gag-pol expression plasmids (Bsr is the blastocidin resistance gene); pMFG-NLSLacZ is a retroviral vector containing lacZ with a nuclear localization signal (NLS); pCFG2fEYFP is a retroviral vector for EYFP. SV40, simian virus 40; LTR, long terminal repeat.
The Fv1n and Fv1b inserts in pCI-neo (pCInorf, pCIborf) (3) were cut out with EcoRI and EcoRI-SalI, respectively, and ligated into the vector pIRES2-EGFP (Clontech) opened in its multiple-cloning site with the same enzymes, resulting in plasmids pIRES2-EGFP/Fv1n and Fv1b, respectively (Fig. 1A). In these constructs, the CMV promoter generates a bicistronic mRNA encoding Fv1 and, separated by an IRES element, EGFP.
The Fv1 expression vectors pLFv1nIEG and pLFv1bIEG (Fig. 1B) were prepared by transferring the Fv1-IRES-EGFP cassette as a BglII-NotI fragment into the large fragment of the BglII-NotI-digested MLV-based retroviral vector pSFG-GFP(S65T) (17). Fv1 mix-and-match constructs were generated with a modified version of the so-called megaprimer PCR for site-directed mutagenesis (6, 13) starting with pCInorf and pCIborf. Constructs are named with three letters corresponding to the three amino acid positions where the products of the n and the b alleles of Fv1 differ (positions 358 and 399 and the C terminus [3]). For example: bbb means Fv1b and bbn is Fv1b with the C terminus of Fv1n. Using primers corresponding to the middle amino acid difference at position 399 and to the 5′ and the 3′ ends of the two alleles of Fv1, various 5′ and 3′ fragments were synthesized and then joined in subsequent PCR steps. The primers were (nucleotides 1195 and 1196 of the Fv1 ORF in bold; added restriction sites underlined) GT11 (5′-GACGCGCTAGCCGAGTTCTAGGGAAA-3′, just upstream of the 5′ end of the Fv1 ORF, NheI site added), GT15 (5′-GGATATGTCGACTCCTCCTCCTGATTTTAA-3′, just downstream of the 3′ end of the Fv1b ORF, SalI site added), GT17 (5′-TGGATAGTCGACATCTATACTATCTTGGTG-3′, just downstream of the 3′ end of the Fv1n ORF, SalI site added), GT18 (5′-GTCCGGGAAACTGTAGAGACTTGGAAG-3′, nt 1183 to 1209 of the Fv1n ORF), GT19 (5′-CTTCCAAGTCTCTACAGTTTCCCGGAC-3′, nt 1209 to 1183 of the Fv1n ORF), GT20 (5′-GTCCGGGAAACTAGAGAGACTTGGAAG-3′, nt 1183 to 1209 of the Fv1b ORF), and GT21 (5′-CTTCCAAGTCTCTCTAGTTTCCCGGAC-3′, nt 1209 to 1183 of the Fv1b ORF). As the first step in the construction of each individual mix-and-match mutant, two fragments were amplified in separate reactions as follows: bbn (pCI-neo/Fv1b template, GT11 5′ primer, GT21 3′ primer; pCI-neo/Fv1n template, GT20 5′ primer, GT17 3′ primer), bnn (b template, GT11 5′ primer, GT19 3′ primer; n template, GT18 5′ primer, GT17 3′ primer) nbn (n template, GT11 5′ primer, GT21 3′ primer; n template, GT20 5′ primer, GT17 3′ primer), nnb (n template, GT11 5′ primer, GT19 3′ primer; b template, GT18 5′ primer, GT15 3′ primer), bnb (b template, GT11 5′ primer, GT19 3′ primer; b template, GT18 5′ primer, GT15 3′ primer), and nbb (n template, GT11 5′ primer, GT21 3′ primer; b template, GT20 5′ primer, GT15 3′ primer). All PCRs were catalyzed by Pfu polymerase, and the cycler settings were 1 cycle of 5 min at 95°C, 2 min at 58°C, and 1.5 min at 72°C; 32 cycles of 1 min at 94°C, 1 min at 58°C, and 1.5 min at 72°C; and 1 cycle of 10 min at 72°C. The two first-round PCR products were mixed, annealed and extended in a second PCR without addition of other primers for five cycles of 30 s at 94°C, 25 min at 60°C, and 5 min at 68°C. In a third PCR, with the same settings as the first PCR, the now full-length products were amplified with primers 5′ GT11 and GT17 (n 3′-end) or GT15 (b 3′-end). After each round of PCR, the products were gel purified and one-fifth of the total yield was used for the next round. Following subcloning and sequencing, the full-length mix-and-match ORFs were subcloned into pCI-neo and then transferred into pIRES2-EGFP and from there into the retroviral vector pSFG-GFP(S65T) to generate the pLMMxIEG series of constructs. The MLV-based retroviral vectors encoding β-galactosidase (pMFG-NLSLacZ) (5) or EYFP, the enhanced yellow fluorescent protein (pCFG2fEYFPf) were kindly provided by Y. Takeuchi and D. Lindemann, respectively.
An MLV gag-pol expression plasmid (pHIT60) encoding NB-tropic CA was provided by Y. Soneoka (23). Constructs encoding N- and B-tropic gag-pol were prepared starting with an RNA-packaging-deficient mutant of N-tropic MLV, pC18deltapsi/10-1-C (4). A 3.7-kb EcoRI-SalI fragment containing all of gag and some of pol was subcloned downstream of the CMV promoter in pCI-neo (Promega), modified by EagI dropout to remove extraneous sequences, generating plasmid pCIG2. A 4.3-kb SaI-EcoRI fragment from pCeB (5), containing the rest of pol plus the Bsr antibiotic resistance gene and the simian virus 40 polyadenylation sequences, was subcloned into PCRScript and then transferred as a SalI-NotI fragment to pCIG2 to generate pCIG3N. pCIG3B was constructed in a similar way, starting with an altered pC18deltapsi/10-1-C EcoRI-SalI derivative which had been modified to encode B-tropic CA by transfer of a 1.4-kb SstII-HindIII fragment from pWB5 (18). Plasmids pC18deltapsi/10-1-C and pWB5 were provided by L. Boone.
An envelope expression construct for the VSV G-protein (pczVSV-G) was also provided by D. Lindemann.
Cells and viruses.
Cell lines from murine fibroblasts (Mus dunni, B-3T3, and N-3T3) and mink lung epithelia (ATCC CCL-64) were cultivated in DMEM containing 10% fetal calf serum and antibiotics. Viruses were generated by simultaneous calcium phosphate-mediated transient transfections of 293T cells with three plasmids providing vector, gag-pol, and env functions (23). At 24 h after transfection, cells were grown for 8 to 10 h in DMEM–10 mM sodium butyrate to stimulate CMV promoter-driven expression. At 48 h after transfection, the virus-containing supernatant was harvested, passed through a 0.45-μm-pore-size filter (Millipore), and stored at −70°C.
FACS.
All FACS experiments were performed using a FACS Vantage (Becton Dickinson). The XF500/T filter set (Glen Spectra) was used to separate the EGFP from the EYFP fluorescence signal. The data were analyzed with the WinMDI 2.8 freeware package (Joseph Trotter, Scripps Institute).
Fv1 assays. (i) Derivation and assay of Fv1-expressing single-cell clones.
CCL-64 cells were transduced with the delivery viruses carrying Fv1n or Fv1b and the EGFP gene. After 72 h, EGFP-positive cells were sorted and recultured. At 5 days later, single-cell clones were isolated by limiting dilution. Clones derived from single cells were retested for EGFP expression after about 5 weeks in culture and for Fv1 function by infection with equal amounts of N-, B-, or NB-tropic, lacZ-carrying tester virus. Quadruplicate cultures of each single-cell clone (2 × 10⁴ cells/well) were set up in 12-well plates (Costar) 16 h prior to infection. At 48 h after infection, the number of β-galactosidase-active cells was determined following staining with X-Gal as previously described (1) by counting blue cells in each well.
(ii) Transfection assay.
A 7.5-μg sample of transfection plasmid (pIRES2-EGFP/Fv1 [Fig. 1A]) was diluted in OptiMEM (containing no serum, proteins, or antibiotics) in a total volume of 150 μl. Then 37.5 μl of Superfect reagent (Qiagen) was added to the DNA solution and mixed, and the solution was incubated at room temperature for 10 min to allow complex formation. M. dunni cells, plated 1 day previously at a density of 105 cells/well in six-well plates, were washed with PBS. A 1-ml volume of DMEM was added to each tube containing DNA complexes for transfection and mixed, and the mixture was transferred to the cells. For each construct studied, four wells of cells were transfected. The reaction mixture was incubated at 37°C for 2.5 h. After this time, the medium was removed and fresh medium was added to the well. The cells were incubated for 24 h, when the medium was replaced with 1 ml of DMEM containing equal titers of N-, B-, or NB-tropic lacZ-carrying tester virus (Fig. 1C), and the cells were incubated at 37°C overnight.
The cells were trypsinised, pooled, and resuspended in DMEM to a concentration of 2 × 10⁵ to 3 × 10⁵ cells/ml. They were then sorted by FACS into GFP-positive and -negative populations. The sorted cells were plated into a 24-well plate at approximately 105 cells/well and allowed to settle overnight. The plates were fixed and stained with X-Gal. The numbers of blue cells in both populations were counted and compared.
(iii) Transduction assay.
A total of 2 × 10⁴ to 3 × 10⁴ cells of each cell line to be tested were seeded per well of a 12-well plate. At 16 h later, the cells were transduced with NB-tropic delivery virus carrying one allele of Fv1 in the Fv1-IRES-EGFP cassette (Fig. 1B). At 56 h later, the cells were split 1:12; they were transduced with the tester virus (Fig. 1C) 16 h later. At 48 h after the second transduction, cells were harvested, fixed in phosphate-buffered saline–3.5% formaldehyde, and examined for their EGFP and EYFP expression by FACS analysis.
RESULTS
To examine the interaction between Fv1 and its viral target, we set out to develop a rapid assay for biological studies of Fv1 function. Such an assay should have the following features: it should enable us to test recombinant Fv1 proteins (and recombinant MLV capsids) with mutations and deletions, and it should be fast, reliable, and reproducible. The key requirement for any Fv1 assay is to measure Fv1 function only in pure populations of cells expressing the gene. Our previous studies (3) had relied on the derivation of single-cell clones to meet this requirement; however, this procedure is both laborious and time-consuming and not all “clones” show activity. As an alternative approach, we have now explored the possibility of coupling Fv1 expression to an EGFP reporter gene using a bicistronic mRNA with an IRES element separating the two coding sequences. In this way, we could distinguish and/or separate Fv1-negative and Fv1-positive populations of cells by FACS analysis. This would allow us to compare directly the infectivity of B-, N-, and NB-tropic or recombinant MLV particles in the presence and absence of Fv1 in the same cell line in one experiment.
Transfection assay for Fv1 restriction.
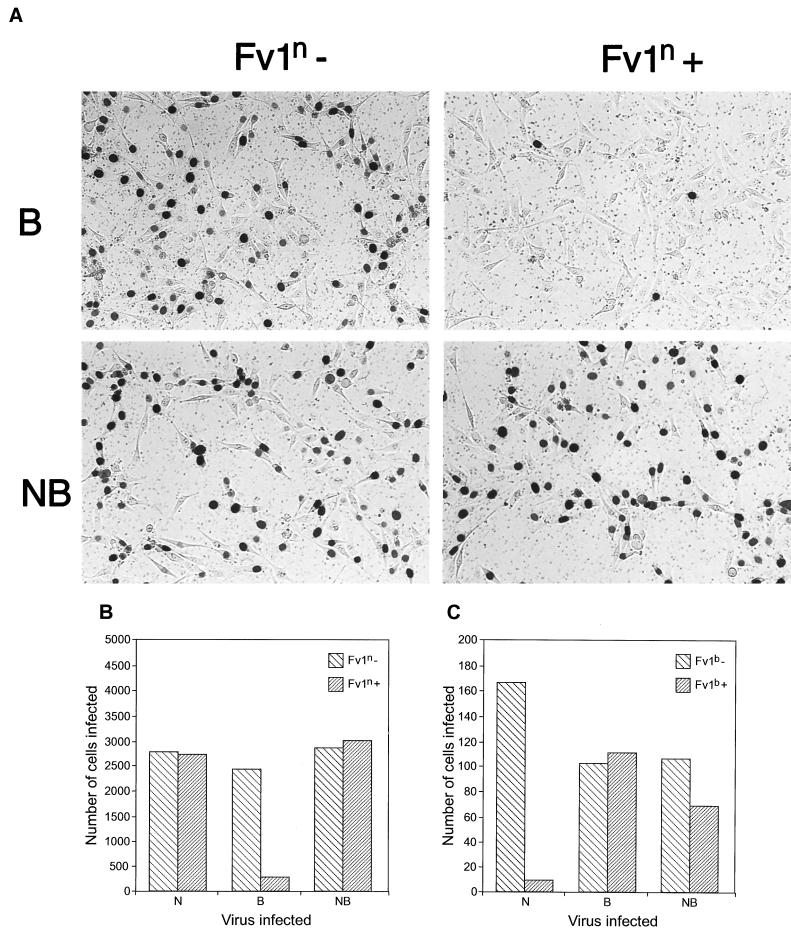
To test the above approach, we prepared Fv1-pIRES2-EGFP constructs by using the n- and b-alleles of Fv1 (Fig. 1A). These were introduced into Fv10 M. dunni cells by transfection. One day later, when a significant fraction of the cells were already expressing EGFP (data not shown), the cells were transduced with MLV vectors consisting of the capsid proteins of interest (N-, B-, or NB-tropic) and carrying the lacZ reporter gene as its genome (Fig. 1C). Another day later, the cells were trypsinized, sorted into EGFP-positive and -negative cells, and replated at equal densities; the next day, they were stained with X-Gal to detect β-galactosidase activity. The relative number of blue cells in the EGFP-negative and EGFP-positive plates will reflect Fv1 activity. Fv1 restriction will be manifested by a significant reduction in the number of blue cells on an EGFP-positive plate compared to the EGFP-negative control. Equal numbers of blue cells in EGFP-positive and -negative plates would indicate the absence of restriction. Figure 2A shows an example of stained plates from such an experiment in which the n allele of Fv1 had been introduced. A reduction in the number of blue cells following infection with B-tropic virus but not NB-tropic virus is obvious. Figure 2B and C show the numbers of blue cells counted in typical experiments with Fv1n and Fv1b, illustrating the expected pattern of restriction of N-tropic virus by Fv1b and B-tropic virus by Fv1n. Interestingly, NB-tropic virus appeared to be restricted by about 35% by the b but not the n allele of Fv1. This result is considered in more detail below.
FIG. 2.
Transfection assay for Fv1 restriction. (A) Typical example of cells stained for β-galactosidase activity following transfection with Fv1n and sorting into EGFP-positive and -negative populations. (B) Blue cell counts for determination of Fv1n restriction. (C) Blue cell counts for determination of Fv1b restriction.
These assays provide proof of principle for using the Fv1-IRES-EGFP construct. However, despite being considerably faster than assays necessitating single-cell cloning (1 week compared to 6 weeks), this assay still has at least two disadvantages. First, sterile sorting of viable cells with the FACS machine is quite slow, and so the number of samples which can be analyzed at any one time is limited. Second, the counting of the X-Gal-stained cells is time-consuming and not particularly accurate.
Transduction assay for Fv1 restriction.
We set out to overcome the above limitations and to devise an assay where we could simultaneously detect both Fv1 expression and the consequences of its expression, thereby taking advantage of the analytical as opposed to the sorting properties of the FACS machine. This necessitates the ability to discriminate signals from two different viruses introduced into cells by transduction. The first virus—the delivery virus—contains the Fv1 allele of interest and encodes the first signaling molecule, here EGFP, expressed from the IRES construct. Fv1 function is tested 3 days later, when the cells are transduced with a second virus—tester virus—which is built up with the capsid protein of interest and coding for the second signaling molecule, EYFP. Two-color FACS analysis identifies four clearly distinguishable populations of cells, allowing one to examine tester virus replication (assessed via EYFP) in cells with or without Fv1 (assessed via EGFP).
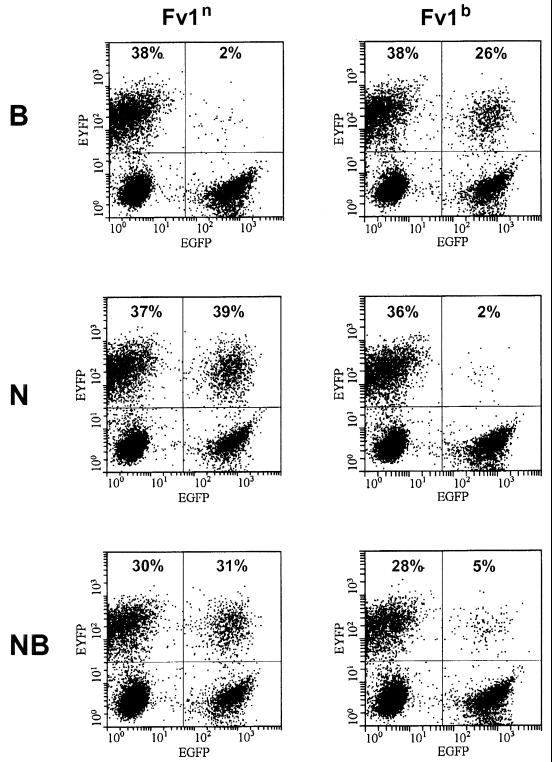
Target cells were infected with the Fv1-IRES2-EGFP delivery virus. To avoid double infections, the virus input was adjusted to result in 20 to 40% EGFP-positive cells. At 3 days later, the cells were transduced with sufficient B-, N-, or NB-tropic tester virus to infect 20 to 40% of the target cells. FACS analysis was performed 2 days after the second transduction. Figure 3 shows data from a typical experiment with M. dunni cells. The left half of each FACS profile serves as the internal control and illustrates infection in the absence of Fv1. The right half shows the proportion of infected cells in the presence of transduced Fv1. The percentages given indicate the proportion of EYFP-positive cells within the EGFP− and the EGFP+ subpopulations and provide a quantitative measure of virus integration in Fv1-negative and Fv1-positive cells.
FIG. 3.
Transduction assay for Fv1 restriction. Typical example of a FACS analysis to examine Fv1n and Fv1b restriction on M. dunni cells. EGFP expression is shown on the x axis, and EYFP expression is shown on the y axis. Percentages given indicate the proportion of EYFP-positive cells in the EGFP− and EGFP+ subpopulations. The delivery virus used in the experiments in the left column was for Fv1n expression, and that in the right column was for Fv1b. Top row, B-tropic tester virus; middle row, N-tropic tester virus; bottom row, NB-tropic tester virus.
Introduction of Fv1n (Fig. 3, left) showed the expected pattern: B-tropic viruses were clearly restricted (38 versus 2%), whereas no restriction was seen with N- or NB-tropic viruses. However, a rather different pattern (Fig. 3, right) emerged following introduction of the b allele. As expected, Fv1b restricted the N-tropic virus. Surprisingly, it also showed strong, but not complete, restriction of the NB-tropic virus (28 versus 5%). In addition, it had a weaker, but significant and reproducible, effect against the B-tropic virus (38 versus 25%). Similar results were also obtained following introduction of Fv1 into mink CCL-64 cells (data not shown).
Restriction of Fv1-transduced single cell clones.
The observation that Fv1b can interact with NB-tropic and B-tropic viruses stood in contrast to all previous reports, which describe Fv1b as directed solely against N-tropic viruses. We therefore decided to investigate whether the cells or assay conditions used could provide an explanation for our divergent results. First, we tested single-cell clones expressing the Fv1-IRES-EGFP construct using a lacZ indicator virus, thereby allowing us to describe restriction in terms of absolute cell counts rather than as percentages of a population.
CCL-64 cells were transduced with the delivery viruses, carrying Fv1n or Fv1b and encoding EGFP, at a multiplicity of infection of 0.1 to ensure that no cell became doubly infected. EGFP-positive cells were sorted using the FACS machine, and 5 days later single-cell clones were isolated by limiting dilution. After 5 weeks, we obtained 21 EGFP-positive single-cell clones of the CCL-64 cells transduced with Fv1n, of which 19 showed the expected restriction pattern. Of the 20 Fv1b single-cell clones, 19 showed restriction. For our infection experiment with the lacZ-carrying tester viruses, we chose 17 clones of each allele with comparable growth rates.
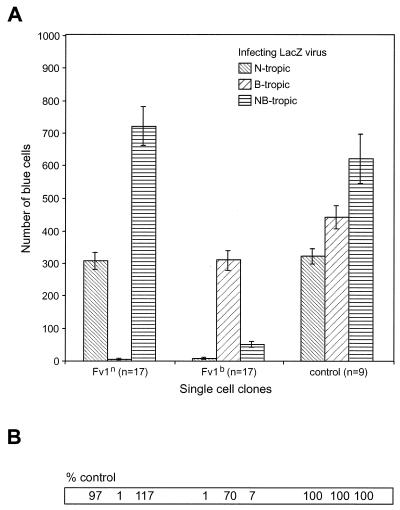
We infected the single-cell clones with B-, N- or NB-tropic lacZ-carrying viruses and counted the blue cells after staining for β-galactosidase activity (Fig. 4). Consistent with previous reports, the Fv1n-expressing clones exerted an approximately 100-fold restriction on the B-tropic viruses and had no effect on N- and NB-tropic viruses. Fv1b also restricted the N-tropic viruses by a factor of 100 and reduced the number of blue cells after an infection with B-tropic viruses to 70% of the number in Fv1-negative controls and it restricted the NB-tropic viruses by a factor of 10. The overall outcome of this experiment closely resembled that obtained by FACS analysis, thereby providing validation for the former approach as an assay method.
FIG. 4.
Restriction of Fv1-transduced single-cell clones after infection with lacZ tester viruses. (A) A total of 17 single-cell clones for each Fv1 allele and 9 Fv1-negative controls were tested. The mean values and standard error are given. (B) The mean values for the controls were arbitrarily set to 100, and the corresponding values for the single-cell clones were calculated relative to the controls.
Transduction assay on cells naturally expressing Fv1.
We wondered whether the differences observed in Fv1b specificity might result from differences in Fv1 mRNA level and thus in the level of Fv1 protein. Previous experiments (unpublished data cited in reference 3) had indicated that the natural level of expression was very low, whereas Fv1 in our experiments (except in the transfection assay, where Fv1 expression was driven by the CMV promoter) was expressed from the more active MLV long terminal repeat promoter. To address this issue, we examined the natural Fv1-expressing cell lines N-3T3 (Fv1n) and B-3T3 (Fv1b) in our transduction assay.
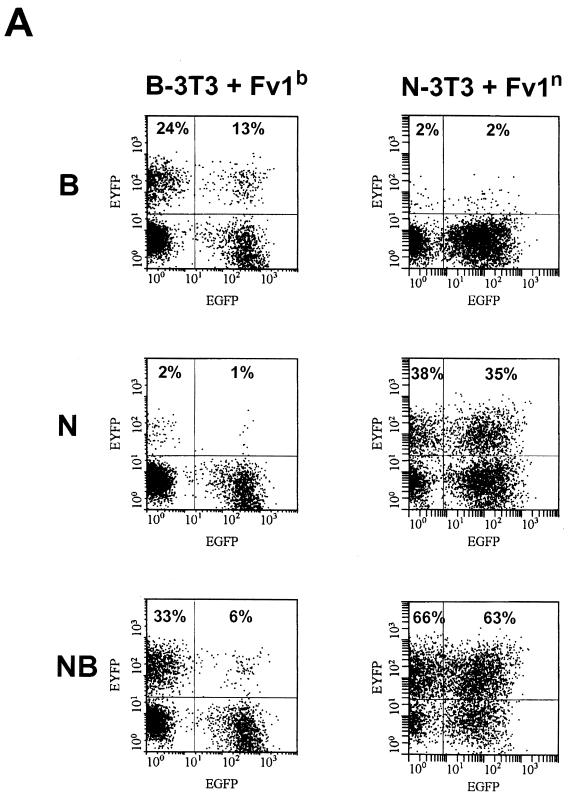
The introduction of Fv1n into N-3T3 cells (Fig. 5A, left) did not enhance the restriction of B-tropic viruses (2 versus 2%). Consistent with the previous findings, Fv1n had no significant influence on N-tropic (38 versus 35%) or NB-tropic (66 versus 63%) viruses. On the other hand, additionally expressed Fv1b in B-3T3 cells (Fig. 5A, right) clearly inhibited NB-tropic (33 versus 6%) and B-tropic (24 versus 13%) viruses. The enhancement of restriction of N-tropic viruses was not significant (2 versus 1%). These results are fully consistent with the proposition that increasing the level of Fv1b can reveal a previously unsuspected ability to interact with, and restrict, B- and NB-tropic viruses. Fv1n seems to lack this ability.
FIG. 5.
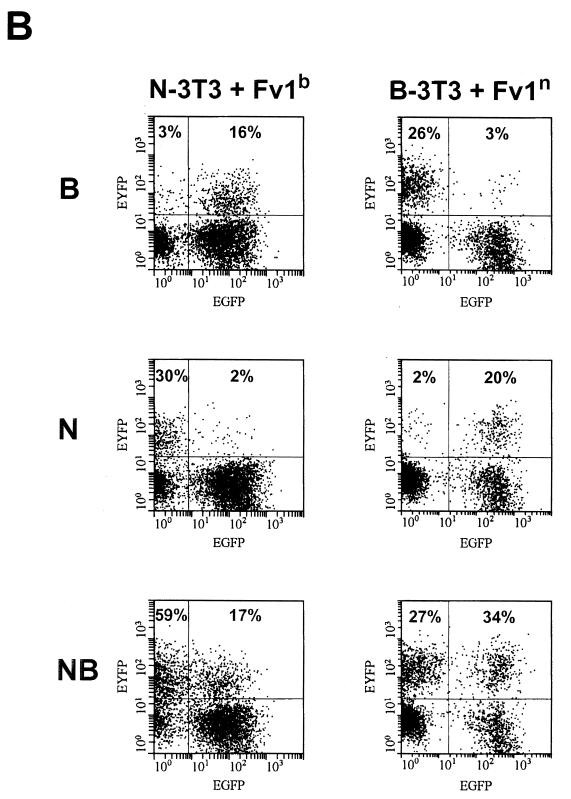
Transduction assay on B-3T3 and N-3T3 cells. (A) Transduction of B-3T3 cells with Fv1b (left) and transduction of N-3T3 cells with Fv1n (right). Top row, B-tropic tester virus; middle row, N-tropic tester virus; bottom row, NB-tropic tester virus. (B) Transduction of B-3T3 cells with Fv1n (left) and transduction of N-3T3 cells with Fv1b (right). Top row, B-tropic tester virus; middle row, N-tropic tester virus; bottom row, NB-tropic tester virus.
In the same experiment, the effect of expressing the opposite allele in each cell (i.e., Fv1n in B-3T3 and Fv1b in N-3T3) was investigated (Fig. 5B). As expected, these transductions rendered N-3T3 resistant to N-tropic virus and B-3T3 resistant to B-tropic virus (Fig. 5B left middle and right top). Unexpectedly, however, normal restriction was lost to a significant degree, implying that restricting and nonrestricting Fv1 molecules compete for binding to virions. For example, N-3T3 cells transduced with Fv1b allow significant levels of B-tropic virus infection (16 versus 3% in Fig. 5B left top). Similarly, Fv1n-positive B-3T3 cells appeared to lose the ability to restrict N-tropic virus (20 versus 2% in Fig. 5B right middle). There was also a slight, but reproducible, increase in NB-tropic virus levels from 27 to 34% (Fig. 5B, right bottom), implying that even in B-3T3 cells, some natural, Fv1-associated reduction in the NB-tropic virus titer is taking place. Taken together, these results imply that Fv1 concentrations are likely to have important effects in determining levels of restriction.
Restriction of Fv1 mix-and-match mutants.
The products of the n and b alleles of Fv1 differ at amino acid positions 358 (b, Glu; n, Lys) and 399 (b, Arg; n, Val) and the C terminus (3). We wanted to investigate which of these differences are responsible for the specificity in Fv1 action against a particular MLV CA protein. For this purpose, we constructed the six possible mix-and-match mutants using megaprimer PCR and cloned them into our retroviral plasmid vector for the delivery virus (Fig. 1B, pLMMxIEG). Then we tested these Fv1 variants for restriction in the transduction assay with B-, N-, and NB-tropic viruses on M. dunni and CCL-64 cells.
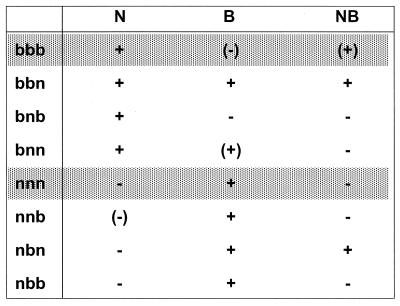
Similar results were obtained with both cell lines. Figure 6 depicts the qualitative results of these experiments. Restriction specificity was determined in a complex manner involving all three positions. The amino acid at position 358 had the strongest influence on restriction specificity: all mutants with a Lys at this position (nxx) restricted B-tropic viruses, and all mutants with a Glu (bxx) restricted N-tropic viruses. Arg at position 399 (xbx) was necessary for restriction of NB-tropic viruses (bbb, bbn, and nbn), whereas Val at position 399 (xnx) seemed to have only minor importance. More difficult to interpret is the influence of the C termini on the restrictive behavior of the variants: generally, the long b C-terminus (xxb) had a restriction weakening effect. The short n C-terminus (xxn) augmented the NB-restricting ability of Arg at 399 (bbn and nbn), and together with a Glu at 358, it seemed to determine a second way to restrict B-tropic viruses (bbn and bnn).
FIG. 6.
Restriction of Fv1 mix-and-match mutants in the transduction assay. The mix-and match mutants are named with three letters; the first and second letters stand for the allelic origin of the amino acids at positions 358 and 399, respectively, and the last letter indicates the allelic origin of the C terminus. The extent of restriction is as follows: +, restriction; (+), slightly less restriction (example, Fv1b on NB-tropic viruses [Fig. 3]); (−), slight inhibition (example, Fv1b on B-tropic viruses); −, no restriction. Essentially identical results were obtained on both M. dunni and CCL-64 cells.
The variant bbn was perhaps the most interesting Fv1 derivative, since it showed full restriction of all three tester viruses. To test this variant further, we also prepared tester viruses with feline leukemia virus type A and gibbon ape leukemia virus gag-pol expression plasmids. Feline leukemia virus and gibbon ape leukemia virus packaged our EYFP constructs as efficiently as MLV did (data not shown). However, these two relatively closely related mammalian C-type retroviruses were not restricted by bbn or by any other Fv1 variant described above (data not shown). The inability of recombinant Fv1 to restrict these related retroviruses suggests that it has coevolved with the MLV strains and acts in a very specific fashion on them alone.
DISCUSSION
Currently, little is known about how Fv1 interacts with its target, the CA of MLVs. To study the Fv1-CA interaction in more detail, we have developed a novel assay for Fv1 function. This assay enables us to test the activity of both wild-type and mutant Fv1 in a fast, reproducible, and reliable manner. We anticipate that use of this assay will allow us to shed light on some of the early events in the retroviral life cycle.
The assay has a number of important differences from previous assays of Fv1 function. All the viruses we used are transiently produced in 293T cells after transfection of three plasmids (23), a gag-pol expression plasmid, a plasmid for the VSV G protein as an envelope protein, and an MLV vector lacking all sequences encoding gag, pol, and env but instead encoding the Fv1-IRES-EGFP cassette (delivery viruses) or a marker gene (tester viruses). This allows us to introduce precisely defined changes into Fv1 and CA and to compare their effects in a single cell type. Further, these viruses are replication incompetent, and no secondary effects caused by viral replication in the target cells can complicate the experimental outcome. The use of VSV G as the envelope protein allows the use of a wide range of cell lines, including both those that naturally express Fv1 and those that do not, with a single virus preparation. The ability to control the number of cells expressing Fv1 by altering the multiplicity of infection of the delivery virus gives us a natural internal control for all our experiments. Finally, because we can identify Fv1-expressing cells by use of a bicistronic expression plasmid without lengthy drug selections to obtain clonal cell populations, the assays are much more rapid than those we have used previously (3). From designing a mutation in Fv1 to knowing its effect currently takes us less than 3 weeks (K. N. Bishop, unpublished data).
In our system, Fv1n behaved exactly as predicted based on previous studies of “natural” Fv1 resistance (10, 12); it restricted B-tropic viruses and had no effect on N- and NB-tropic viruses. By contrast, Fv1b did not give the exact phenotype reported previously. Although it restricted N-tropic viruses, it also showed unexpected but reproducible inhibitory effects on B-tropic (30% reduction of infected cells) and NB-tropic (5- to 10-fold reduction) viruses. However, two lines of argument persuade us that this does not represent a significant discrepancy but instead reflects the power of our assay to pick up relatively subtle differences. First, previous biological assays would not have picked up a 30% reduction in viral titer given the non-Fv1-associated differences between any two different cell lines. Even a 5- to 10-fold reduction might have been equivocal. However, the presence of an internal nontransduced control gives us confidence in even relatively small decreases such as the reduction in B-tropic virus titer in Fv1b-transduced versus nontransduced cells shown in Fig. 3 and 5. Second, the level of Fv1 mRNA expression is likely to be much higher with our constructs, driven by the MLV promoter, than with the natural promoter. Ongoing experiments to determine the amounts of Fv1 protein present in transduced cells seem to confirm this view (M. Bock, unpublished data). It would also be consistent with the effects of Fv1b on B- and NB-tropic MLV replication in B-3T3 cells (Fig. 5A). We conclude that restriction by Fv1b and by Fv1n are not simply reciprocal interactions but that Fv1b can interact with a wider spectrum of viruses. Interestingly, although Fv1 concentration appears to influence the target for restriction, it does not appear to increase the level of restriction (50- to 100-fold [Fig. 4]) observed in previous studies with the endogenous gene (10).
Amino acid 110 of CA clearly plays an important role in determining N- or B-tropism. Natural N-tropic MLV isolates have the basic residue Arg at position 110, whereas B-tropic MLV has the acidic amino acid Glu (7, 18), but replacement of Arg by Lys or Glu by Asp does not change the tropism (14). It was therefore striking that one of the differences (amino acid 358) between Fv1n and Fv1b was a reciprocal acidic-to-basic change (Fv1n contains Lys; Fv1b contains Glu) (3). The mix-and-match experiments presented in Fig. 6 confirm that this amino acid plays a key role in virus restriction. All the constructs carrying a Lys at this position restricted B-tropic MLV; similarly, a Glu at this position was associated with N-tropic virus restriction. Determination of whether the Fv1 region around amino acid 358 binds directly to the capsid region around amino acids 109 and 110 awaits the development of a specific binding assay. However, the results show that specific restriction can also be achieved by other combinations of the three determinants, including a very strong restriction of the NB-tropic virus by Fv1 bbn. Therefore, the data provide further evidence for our conclusion that the interaction between Fv1 and CA is more than a simple reciprocal one-point binding involving CA position 110 and Fv1 position 358.
The finding that the transduced Fv1 can compete with the naturally expressed Fv1 in N-3T3 and B-3T3 cells (Fig. 5A) came as something of a surprise in light of the genetic data showing that Fv1 is a dominant gene (19), but again it points to the importance of Fv1 concentration. One possible explanation is that Fv1 always binds to the incoming subviral particles whether or not it can restrict it. In this case, the transduced and highly expressed nonrestrictive Fv1 covers the binding sites on the virus particle, preventing binding by the normally restricting natural Fv1. Such a mechanism would imply that binding per se does not cause restriction. An alternative explanation postulates that Fv1 should be localized in a specific cell compartment that the virus particle traverses en route to the nucleus. High levels of transduced, nonrestricting Fv1 would then simply outcompete the natural Fv1 for localization rather than binding to CA. The observation that Fv1 restriction can be abrogated by preinfection with restricted but not nonrestricted MLV (8) perhaps argues for the latter possibility.
ACKNOWLEDGMENTS
We thank D. Lindemann, Y. Takeuchi, M. Eiden, A. Terry, G. Soneoka, and L. Boone for generously providing plasmids and C. Atkins for invaluable help with FACS analysis.
This work was supported by the United Kingdom Medical Research Council.
REFERENCES
- 1.Beddington R S, Morgernstern J, Land H, Hogan A. An in situ transgenic enzyme marker for the midgestation mouse embryo and the visualization of inner cell mass clones during early organogenesis. Development. 1989;106:37–46. doi: 10.1242/dev.106.1.37. [DOI] [PubMed] [Google Scholar]
- 2.Bénit L, de Parseval N, Casella J-F, Callebaut I, Cordonnier A, Heidmann T. Cloning of a new murine endogenous retrovirus, MuERV-L, with strong similarity to the human HERV-L element and a gag coding sequence closely related to the Fv1 restriction gene. J Virol. 1997;71:5652–5657. doi: 10.1128/jvi.71.7.5652-5657.1997. [DOI] [PMC free article] [PubMed] [Google Scholar]
- 3.Best S, Le Tissier P, Towers G, Stoye J P. Positional cloning of the mouse retrovirus restriction gene Fv1. Nature. 1996;382:826–829. doi: 10.1038/382826a0. [DOI] [PubMed] [Google Scholar]
- 4.Boone L R, Innes C L, Glover P L, Linney E. Development and characterization of an Fv-1-sensitive retrovirus-packaging system: single-hit titration kinetics observed in restrictive cells. J Virol. 1989;63:2592–2597. doi: 10.1128/jvi.63.6.2592-2597.1989. [DOI] [PMC free article] [PubMed] [Google Scholar]
- 5.Cosset F-L, Takeuchi Y, Battini J-L, Weiss R A, Collins M K L. High-titer packaging cells producing recombinant retroviruses resistant to human serum. J Virol. 1995;69:7430–7436. doi: 10.1128/jvi.69.12.7430-7436.1995. [DOI] [PMC free article] [PubMed] [Google Scholar]
- 6.Datta A K. Efficient amplification using ‘megaprimer’ by asymmetric polymerase chain reaction. Nucleic Acids Res. 1995;23:4530–4531. doi: 10.1093/nar/23.21.4530. [DOI] [PMC free article] [PubMed] [Google Scholar]
- 7.DesGroseillers L, Jolicoeur P. Physical mapping of the Fv-1 tropism host range determinant of BALB/c murine leukemia viruses. J Virol. 1983;48:685–696. doi: 10.1128/jvi.48.3.685-696.1983. [DOI] [PMC free article] [PubMed] [Google Scholar]
- 8.Duran-Troise G, Bassin R H, Rein A, Gerwin B I. Loss of Fv-1 restriction in Balb/3T3 cells following infection with a single N tropic murine leukemia particle. Cell. 1977;10:479–488. doi: 10.1016/0092-8674(77)90035-6. [DOI] [PubMed] [Google Scholar]
- 9.Fassati A, Goff S P. Characterization of intracellular reverse transcription complexes of Moloney murine leukemia virus. J Virol. 1999;73:8919–8925. doi: 10.1128/jvi.73.11.8919-8925.1999. [DOI] [PMC free article] [PubMed] [Google Scholar]
- 10.Hartley J W, Rowe W P, Huebner R J. Host-range restrictions of murine leukemia viruses in mouse embryo cell cultures. J Virol. 1970;5:221–225. doi: 10.1128/jvi.5.2.221-225.1970. [DOI] [PMC free article] [PubMed] [Google Scholar]
- 11.Hasenkrug K J, Chesebro B. Immunity to retroviral infection: the Friend virus model. Proc Natl Acad Sci USA. 1997;94:7811–7816. doi: 10.1073/pnas.94.15.7811. [DOI] [PMC free article] [PubMed] [Google Scholar]
- 12.Jolicoeur P. The Fv-1 gene of the mouse and its control of murine leukemia virus replication. Curr Top Microbiol Immunol. 1979;86:67–122. doi: 10.1007/978-3-642-67341-2_3. [DOI] [PubMed] [Google Scholar]
- 13.Kammann M, Laufs J, Schell J, Gronenborn B. Rapid insertional mutagenesis of DNA by polymerase chain reaction (PCR) Nucleic Acids Res. 1989;17:5404. doi: 10.1093/nar/17.13.5404. [DOI] [PMC free article] [PubMed] [Google Scholar]
- 14.Kozak C A, Chakraborti A. Single amino acid changes in the murine leukemia virus capsid protein gene define the target for Fv1 resistance. Virology. 1996;225:300–306. doi: 10.1006/viro.1996.0604. [DOI] [PubMed] [Google Scholar]
- 15.Lilly F. Fv-2: identification and location of a second gene governing the spleen focus response to Friend leukemia virus in mice. J Natl Cancer Inst. 1970;45:163–169. [PubMed] [Google Scholar]
- 16.Lilly F, Pincus T. Genetic control of murine viral leukemogenesis. Adv Cancer Res. 1973;17:231–277. [Google Scholar]
- 17.Lindemann D, Bock M, Schweizer M, Rethwilm A. Efficient pseudotyping of murine leukemia virus particles with chimeric human foamy virus envelope proteins. J Virol. 1997;71:4815–4820. doi: 10.1128/jvi.71.6.4815-4820.1997. [DOI] [PMC free article] [PubMed] [Google Scholar]
- 18.Ou C-Y, Boone L R, Koh C-K, Tennant R W, Yang W K. Nucleotide sequences of the gag-pol regions that determine the Fv-1 host range property of BALB/c N-tropic and B-tropic murine leukemia viruses. J Virol. 1983;48:779–784. doi: 10.1128/jvi.48.3.779-784.1983. [DOI] [PMC free article] [PubMed] [Google Scholar]
- 19.Pincus T, Hartley J W, Rowe W P. A major genetic locus affecting resistance to infection with murine leukemia viruses. I. Tissue culture studies of naturally occurring viruses. J Exp Med. 1971;133:1219–1233. doi: 10.1084/jem.133.6.1219. [DOI] [PMC free article] [PubMed] [Google Scholar]
- 20.Pryciak P M, Varmus H E. Fv-1 restriction and its effects on murine leukemia virus integration in vivo and in vitro. J Virol. 1992;66:5959–5966. doi: 10.1128/jvi.66.10.5959-5966.1992. [DOI] [PMC free article] [PubMed] [Google Scholar]
- 21.Rosenberg N, Jolicoeur P. Retroviral pathogenesis. In: Coffin J M, Hughes S H, Varmus H E, editors. Retroviruses. Cold Spring Harbor, N.Y: Cold Spring Harbor Laboratory Press; 1997. pp. 475–585. [PubMed] [Google Scholar]
- 22.Sambrook J, Fritsch E F, Maniatis T. Molecular cloning: a laboratory manual. 2nd ed. Cold Spring Harbor, N.Y: Cold Spring Harbor Laboratory Press; 1989. [Google Scholar]
- 23.Soneoka Y, Cannon P M, Ramsdale E E, Griffiths J C, Romano G, Kingsman S M, Kingsman A J. A transient three-plasmid expression system for the production of high titer retroviral vectors. Nucleic Acids Res. 1995;23:628–633. doi: 10.1093/nar/23.4.628. [DOI] [PMC free article] [PubMed] [Google Scholar]


