Abstract
Background:
Bile acids mediate gut-liver cross-talk through bile acid receptors. Serum, hepatic, and microbial bile acid metabolism was evaluated in HCV-compensated chronic liver disease.
Methods:
Patients underwent liver biopsy; portal and peripheral blood were obtained before (HCVi), and 6 months after sustained virologic response (SVR), splenic blood was obtained only after SVR. The fecal microbiome and liver transcriptome were evaluated using RNA-Seq. Twenty-four bile acids were measured in serum, summed as free, taurine-conjugated bile acids (Tau-BAs), and glycine-conjugated bile acids.
Results:
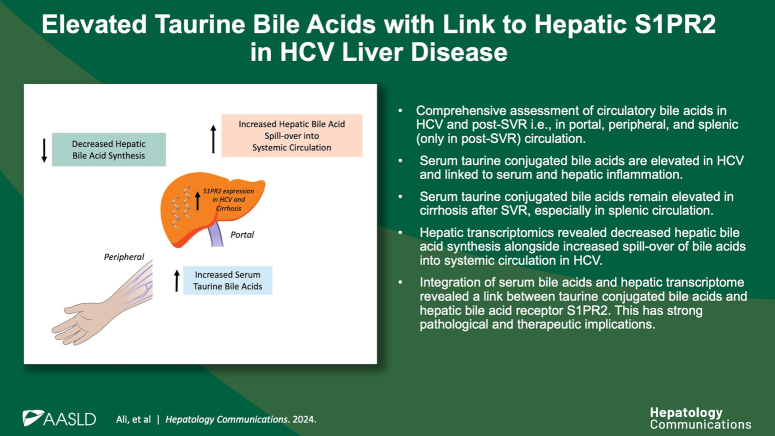
Compared to SVR, HCVi showed elevated conjugated bile acids, predominantly Tau-BA, compounded in HCVi cirrhosis. In the liver, transcription of bile acids uptake, synthesis, and conjugation was decreased with increased hepatic spillover into systemic circulation in HCVi. There was no difference in the transcription of microbial bile acid metabolizing genes in HCVi. Despite an overall decrease, Tau-BA remained elevated in SVR cirrhosis, mainly in splenic circulation. Only conjugated bile acids, predominantly Tau-BA, correlated with serum proinflammatory markers and hepatic proinflammatory pathways, including NLRP3 and NFKB. Among hepatic bile acid receptors, disease-associated conjugated bile acids showed the strongest association with hepatic spingosine-1-phosphate receptor 2 (S1PR2).
Conclusions:
Enhanced expression of hepatic S1PR2 in HCVi and HCVi-cirrhosis and strong associations of S1PR2 with Tau-BAs suggest pathological relevance of Tau-BA-hepatic S1PR2 signaling in chronic liver disease. These findings have therapeutic implications in chronic liver diseases.
INTRODUCTION
The liver is an immunometabolic organ located at the nexus of bile acid–mediated microbial-host crosstalk.1 Despite an inordinate amount of study, bile acids remain relatively underexplored in humans. In addition to their fundamental role as master regulators of energy metabolism, bile acids, like the liver, are at the intersection of metabolism, immunity, and inflammation.2,3
Bile acids are an ideal medium to explore the interplay between the gut microbiome and the host in chronic liver disease. Most of our current understanding of the gut-liver axis and bile acid perturbations has been derived from studies exploring individual aspects of this multicompartment system, typically in animal models.4
Increasing clarity is now being derived about the highly specific immunometabolic functions of bile acids and their relevant receptors, enabling opportunities to modulate bile acid metabolism for better therapeutic targeting of diseases of the gut-liver axis.5,6 Despite recent studies on the therapeutic relevance of bile acid receptors in humans, the pathophysiological underpinnings of these receptors in liver disease are not fully elucidated.7
There is extensive literature on bile acid alterations in metabolic and cholestatic disorders where eradication of the underlying etiology remains challenging.2 Advent of direct-acting antiviral therapy for HCV infection affords a unique opportunity to evaluate the bile acid circuit in chronic liver disease before and after elimination of the trigger to identify themes that may extend to non-HCV liver disease etiologies.
The primary objective of this study was to provide a more complete understanding of the role of bile acids in chronic liver disease by integrating multiple compartments of the gut-liver axis. To this end, we performed a detailed characterization of the bile acid profile in the systemic and portal circulation and the major organs relevant to host bile acid metabolism, that is, the liver and the fecal microbiome in patients with HCV with compensated liver disease (HCVi) with re-evaluation after the sustained virologic response (SVR). To expand on the role of bile acids in liver disease progression, circulatory bile acid alternations were integrated with the liver transcriptome and with markers of liver disease severity.
We recently described alterations in the hepatic peroxisome, mitochondrial function, and microbial energy metabolism in HCVi liver disease.8 In this manuscript, we have extended the knowledge of metabolic perturbations in chronic liver disease by exploring a diverse range of bile acids in serum and hepatic bile acid genes on a transcriptional level. This analysis has revealed a circulatory predominance of taurine-conjugated bile acids (Tau-BAs) and a concomitant decrease in hepatic bile acid synthesis in HCVi liver disease. Only by direct evaluation of splenic serum we identified the relevance of conjugated primary bile acids circulating in the splenic vein in SVR cirrhosis. By integrating the hepatic bile acid receptors with liver disease severity and serum bile acids, we have emphasized the pathological and therapeutic relevance of conjugated bile acid-hepatic spingosine-1-phosphate receptor 2 (S1PR2) signaling and its link to hepatic and systemic inflammation in HCVi liver disease.
METHODS
Patient selection and sample collection
For full details, please refer to the Methods section previously published.8 In brief, of the initially assessed 36 patients seen at the National Institutes of Health Clinical Center, 30 patients (the accrual ceiling) were eligible and agreed to participate in the study. All research was conducted in accordance with the Declarations of Helsinki and Istanbul; all patients signed informed consent for participation in an NIDDK Institutional Review Board–approved protocol (NCT02400216). Of 30 patients consented, 29 patients with chronic hepatitis C completed phase one evaluation (HCVi). One patient was excluded due to HCC. All patients achieved SVR after 12 weeks of treatment with sofosbuvir/velpatasvir. Of 29 patients, 23 completed posttreatment evaluation (SVR) (Table 1). All patients underwent sampling of the portal and peripheral blood, feces, and liver tissue at both time points (Figure 1). In addition, splenic vein samples were obtained from 20 patients with SVR. All authors had access to data, reviewed, and approved the final manuscript.
TABLE 1.
Patient characteristics
| HCVi | SVR | Wilcoxon paired test (HCVi vs. SVR) | |
|---|---|---|---|
| Number of subjects (n) | 29 | 23 | 22 |
| Age; median (IQR) | 59 (54.5–62) | 58 (48–67) | — |
| Gender; Males, n (%) | 18 (62.1) | 14 (61) | — |
| Race; n (%) | |||
| Caucasian | 19 (65.5) | 15 (65.2) | — |
| African American | 5 (17.2) | 5 (21.7) | — |
| Asian | 2 (6.8) | 1 (4.3) | — |
| Hispanic | 3 (10.3) | 2 (8.7) | — |
| HCV genotype; n (%) | |||
| 1a | 10 (34.5) | — | — |
| 1b | 8 (27.5) | — | — |
| 2a/c | 1 (3.4) | — | — |
| 2b | 5 (17.2) | — | — |
| 3a | 4 (13.8) | — | — |
| 4 | 1 (3.4) | — | — |
| Histological and laboratory parameters, median (IQR) | |||
| log HCV RNA (IU/mL) | 6.4 (5.75–6.88) | Undetectable | — |
| Ishak fibrosis score | 4 (2–6) | 3 (0–6) | 0.2483 |
| HAI inflammatory score | 8 (7–10) | 3 (2–3) | <0.0001 |
| Direct portal pressures (mm Hg) | 19 (12–25) | 19 (12–22) | 0.9488 |
| Laboratory parameters, median (IQR) | |||
| ALT (IU/L) | 85 (46.0–145.5) | 21 (17–29) | <0.0001 |
| AST (IU/L) | 72 (34.5–109.5) | 24 (21–28) | <0.0001 |
| ALP (IU/L) | 81 (73.0–108.5) | 76 (63–106) | 0.1172 |
| GGT (IU/L) | 113 (35.5–169.0) | 33 (20–43) | 0.0001 |
| Albumin (g/dL) | 4.1 (4.0–4.4) | 4.3 (4.1–4.5) | 0.0532 |
| Total bilirubin (mg/dL) | 0.6 (0.5–0.8) | 0.4 (0.3–0.6) | 0.0020 |
| Platelet count (×109 /L) | 165 (116.0–201.5) | 170.5 (140.8–195.8) | 0.3331 |
| PT-INR | 1.07 (0.99–1.13) | 1.09 (1.01–1.17) | 0.0083 |
| BMI (kg/m2) | 27.3 (24.4–31.4) | 27.7 (23.8–31.1) | 0.2313 |
Note: Twenty-nine patients infected with HCV were assessed at the initial time point, that is, HCVi cohort. Twenty-three patients completed evaluation at the second time point, 6 months after sustained virologic response, that is, SVR cohort. Of these, 22 patients were included in the paired analysis between the 2 time points, 2-sided Wilcoxon matched-pairs signed rank test.
Abbreviations: ALP, alkaline phosphatase; ALT, alanine aminotransferase; AST, aspartate aminotransferase; BMI, body mass index; GGT, gamma-glutamyl transferase; HAI, hepatic activity index; HCVi, HCVi, patients infected with HCV; PT-INR, prothrombin time-international normalized ratio; SVR, sustained virologic response.
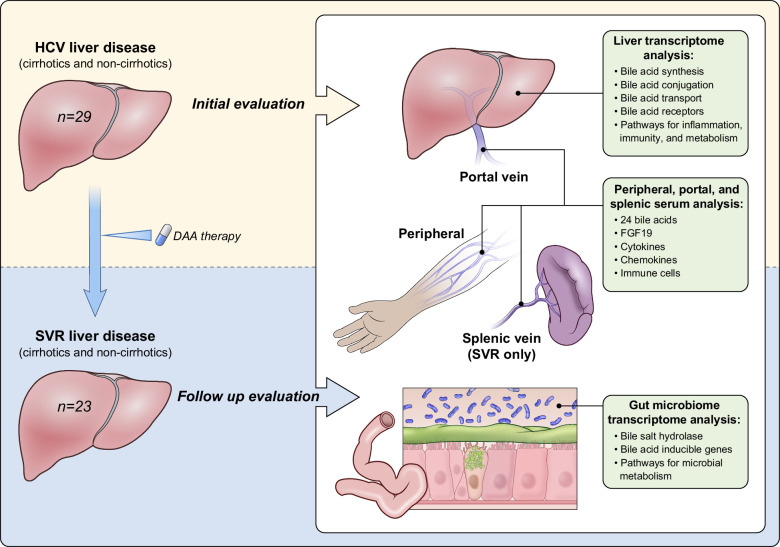
FIGURE 1.
Study design. Patients with compensated liver disease were assessed before (HCVi) and 6 months after HCV clearance with direct-acting antiviral therapy (SVR). To evaluate bile acids in the gut-liver axis, a comprehensive sampling of the portal and peripheral blood, feces, and liver tissue was performed at both time points. Splenic vein samples were obtained from 20 patients with SVR. Liver and microbial RNA-Seq analyzed genes critical for hepatic primary bile acid metabolism and signaling, and microbial secondary BA metabolism. Abbreviations: DAA, direct-acting antiviral; HCVi, patients infected with HCV; SVR, sustained virologic response.
Liver tissue samples and RNA-Seq analysis
Liver biopsy samples were scored in a blinded manner by a hepatopathologist, Dr David Kleiner.9,10 Patients were stratified using Ishak fibrosis score from liver biopsies corresponding to HCVi and SVR time points. Ishak fibrosis score = 0–4 were characterized as noncirrhotic (HCVi non-cirrhotics [HCVi-NC], n = 16; SVR-NC, n = 14) and Ishak fibrosis score = 5–6 as cirrhotics (HCVi-cirrhotics [HCVi-Cirr], n = 13; SVR cirrhotics [SVR-Cirr], n = 9). Ribonucleic acid sequencing (RNA-Seq) analysis was performed as described,8 and analysis on liver transcriptome had HCVi, n = 27 (HCVi-Cirr, n = 12 and HCVi-NC, n = 15) and SVR, n = 23 (SVR-Cirr, n = 9 and SVR-NC, n = 14). For paired analysis on liver transcriptomics, n = 22 due to data filtering as described.8
Bile acid measurement
Metabolon conducted the global metabolomics assays serum at both time points using ultra-performance liquid chromatography-mass spectrometry as described.8,11 Twenty-four bile acids were measured in peripheral and portal serum in HCVi (n = 29) and peripheral, portal, and splenic serum in SVR (n = 23 for peripheral and portal serum, n = 20 for splenic serum). For paired analysis, n = 23. For all serum bile acid analyses, we performed log transformation and imputation of missing values, if any, with the minimum observed value for each compound. The final unit for serum bile acids is “relative quantification” as defined.8 Relative differences in bile acid composition were assessed based on HCV status and cirrhosis.
Grouping of serum BA based on conjugation and hydroxylation
BA was summed up into groups based on conjugation and hydroxylation into conjugated or free BA and primary or secondary BA, respectively. Primary BA includes the sum of free chenodeoxycholate (CDCA) and cholate (CA); glycine, taurine, and sulfated conjugates of CDCA and CA; hyocholate; tauro-beta-muricholate (TBMCA); and glycochenodeoxycholate glucuronide. Secondary BA includes the sum of free deoxycholic acid (DCA) and ursodeoxycholate (UDCA) and glycine, taurine, and sulfated conjugates of DCA, UDCA, and LCA. Total Free includes the sum of CDCA, CA, DCA, UDCA, and hyocholate. Total glycine includes the sum of glycochenodeoxycholate, glycocholate, glycodeoxycholate, glycoursodeoxycholate, glycolithocholate, and glycohycholate (GHC). Total taurine includes the sum of taurochenodeoxychate, tricarboxylic acid cycle intermediates, taurodeoxycholate, tauroursodeoxycholate, and TBMCA. Total sulfated includes the sum of glycodeoxycholate sulfate, glycodeoxycholate sulfate, glycolithocholate sulfate, taurolithocholate 3-sulfate, glycocholenate sulfate, and taurocholenate sulfate.
Immune markers
Serum markers were measured in HCVi and SVR as described.8 Each assay was conducted following the respective manufacturer’s protocols. All assays were performed in duplicate.
Flow cytometry
EDTA anticoagulated peripheral, portal, and splenic blood samples were processed for flow cytometry as described.8
16S rRNA and RNA-Seq analysis on the fecal microbiome
HCVi and SVR fecal samples were collected and flash-frozen with storage at −80°C. Methods of obtaining 16S rRNA and RNA-Seq are as described.8 Briefly, for RNA-Seq analysis, the MetaHIT Consortium database of over 3 million distinct nucleic acid sequences was used as a reference. In total, 889,668 individual nucleotide sequences from MetaHit were aligned to the samples’ trimmed reads using Bowtie in Partek Flow (Version 10.0) (Computer software, Partek Inc. 2020). The distinct nucleotide sequences were then summarized into microbial Kyoto Encyclopedia of Genes and Genomes Ortholog genes or Clusters of Orthologous Groups genes. Sequences were aligned using BLAST (Basic Local Alignment Search Tool) (https://blast.ncbi.nlm.nih.gov/Blast.cgi) to determine microbial species of origin if >99% similarity. Due to data filtering, analysis on microbial transcriptome had HCVi, n = 26 and SVR, n = 23.
Statistical analysis
Statistical analysis was performed using GraphPad Prism 8.0 (GraphPad Software Inc) and R software (versions 3.5.0 and 4.0.2). Statistical, bioinformatics, dimensionality reduction (WGNCA), and enrichment analyses were performed as described.8,12,13,14
RESULTS
Patients with HCVi underwent liver biopsy with portal vein cannulation at two time points: HCVi (n = 29) and 6 months after SVR (n = 23) (Figure 1, Table 1). Using ultra-performance liquid chromatography-mass spectrometry, 24 bile acids were measured in peripheral and portal serum in HCVi, and in peripheral, portal, and splenic serum in SVR (Supplemental Figure S1, http://links.lww.com/HC9/A951). Bile acid composition was evaluated by combining individual bile acids based on conjugation and hydroxylation (Figure 2A). To assess bile acid alterations based on cirrhosis, patients were stratified by fibrosis at HCVi and SVR time points.
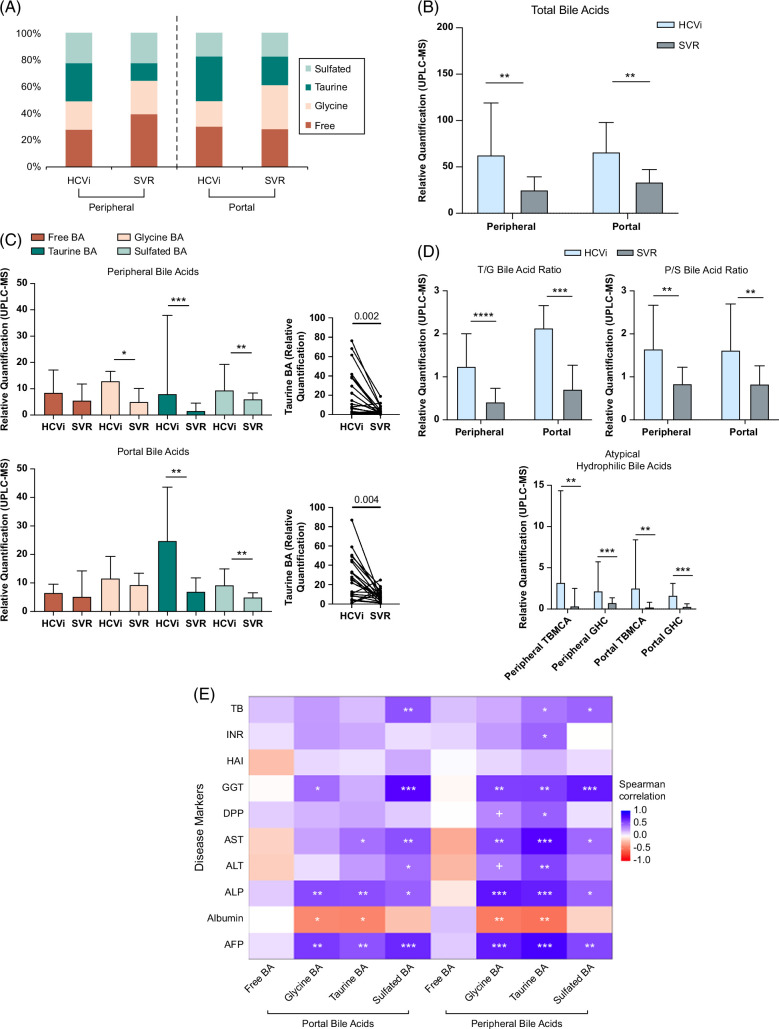
FIGURE 2.
Elevated serum-conjugated, especially taurine-conjugated bile acids in HCVi and associated with liver disease severity. (A) Bar plots showing the percentage distribution of BA groups. Circulatory compartment and HCV status on x axis (HCVi, n = 29; SVR, n = 23). In HCVi compared to SVR, portal and peripheral serum had (B) higher total BA (TBA) pool, that is, sum of 24 measured serum BA (C) higher conjugated but not free BA, example of Taurine-BA (D) higher ratios of Tau-BA to Gly-BA (T/G BA ratio), primary to secondary BA, and higher atypical triple-hydroxylated BA, that is, TBMCA and GHC. Two-sided Wilcoxon matched-pairs signed rank test (HCVi vs. SVR, n = 22). Column bar graph, median with IQR. FDRp value + =0.05–0.1, *0.05–0.01, **0.01–0.001, ***0.001–0.0001, ****< 0.0001. (E) Only conjugated, not free BA correlated with liver disease severity markers in HCVi (n = 29). Heatmap with two-sided Spearman correlation. unadjusted p value + =0.05–0.1, *0.05–0.01, **0.01–0.001, ***< 0.001. Abbreviations: BA, bile acid; GHC, glycohycholate; HCVi, patients infected with HCV; SVR, sustained virologic response; TBA, total bile acid; TBMCA, tauro-beta-muricholate.
Conjugated bile acids are elevated in HCVi and cirrhosis
Compared to SVR, portal and peripheral total bile acids were elevated in HCVi (FDRp < 0.1) (Figure 2B). While there was no difference in free bile acids, HCVi showed higher glycine-conjugated bile acids, Tau-BAs, and sulfated bile acids (Figure 2C). By comparing relative proportions, we identified higher ratios of Tau-BA/glycine-conjugated bile acid (T/G) and primary/secondary bile acids (Figure 2D). Unexpectedly, 2 atypical triple-hydroxylated primary bile acids, TBMCA and GHC were profoundly elevated in HCVi (eg, portal TBMCA fold-change of 9.1) (Figure 2D, Supplemental Table S1, http://links.lww.com/HC9/A975). TBMCA is thought to be murine-specific, but its presence in humans has been described.15,16 Moreover, elevated TBMCA and GHC have been noted in disorders of the gut-liver axis in humans.17,18,19
Furthermore, within HCVi, liver injury was most strongly associated with higher conjugated bile acids, especially Tau-BA, when correlated with liver disease severity markers and stratified by cirrhosis (Spearman rank, unadjusted p < 0.05) (Figure 2E, Supplemental Figures S2A, B, http://links.lww.com/HC9/A952).
Our findings extend the known concept of elevated conjugated bile acids in liver disease by showing the predominance of taurine-conjugated and atypical hydrophilic bile acids in HCVi, compounded in cirrhosis. These alterations may be a compensatory response as conjugated bile acids are less toxic and easier to eliminate.20,21
Hepatic bile acid metabolism is reduced with enhanced systemic spillover in HCVi
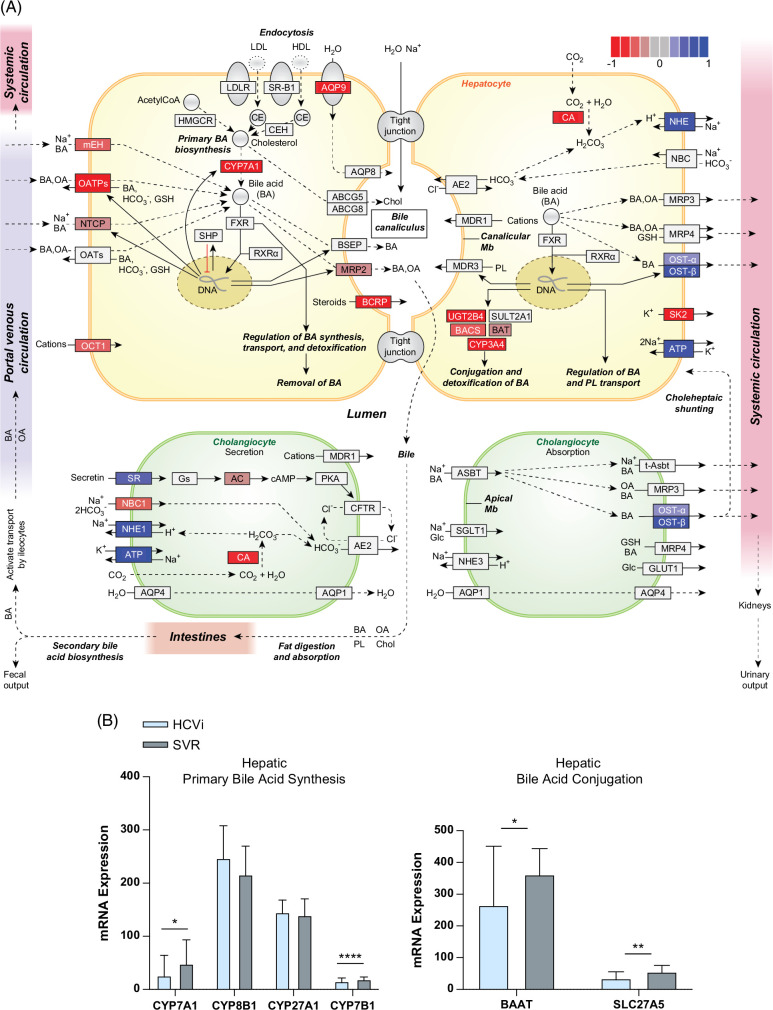
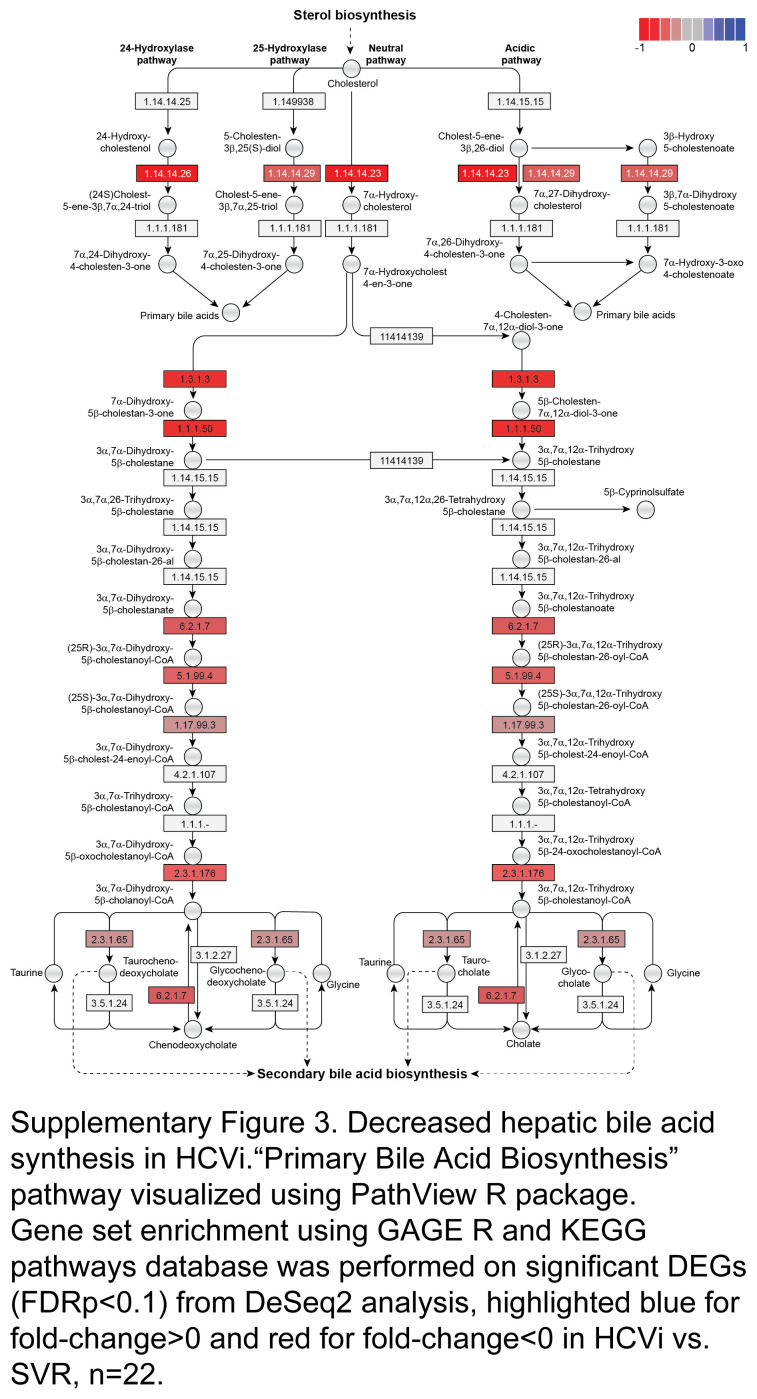
Next, to understand if serum bile acid alterations are related to hepatic bile acid synthesis or metabolism in HCVi, we assessed the hepatic transcriptome from paired liver biopsies in HCVi and SVR. Gene set enrichment analysis was performed on differentially expressed genes using gene sets from the Kyoto Encyclopedia of Genes and Genomes (DeSeq2, FDRp < 0.1). HCVi showed significant alterations in hepatic bile acid synthesis and transport compared to SVR (Figure 3A, Supplemental Table S2, http://links.lww.com/HC9/A975). Specifically, HCVi showed decreased hepatic gene expression for bile acid uptake by hepatocytes (mEH, OATPs, and NTCP), primary bile acid synthesis across classic (CYP7A1), alternative (CYP7B1), 24-hydroxylase and 25-hydroxylase pathways, bile acid conjugation (BAAT and SLC27A5), bile acid detoxification (BAUGT2B4 and CYP3A4), and bile acid secretion into bile canaliculi (MRP2) (Figures 3A, B, Supplemental Figure S3, http://links.lww.com/HC9/A953). Decreased hepatic uptake and synthesis were coupled with increased bile acid secretion into the systemic circulation (OST-alpha and OST-beta). Serum 7-alpha-hydroxy-3-oxo-4-cholestenoate (7-HOCA) has been suggested as a surrogate biomarker for the rate of bile acid synthesis in the liver. Reduced hepatic bile acid synthesis in HCVi was supported by the measurement of serum 7-HOCA with lower peripheral 7-HOCA levels in HCVi compared to SVR (Supplemental Figure S4, http://links.lww.com/HC9/A954).
FIGURE 3.
Reduced hepatic bile acid synthesis with enhanced peripheral spillover in HCVi. (A) Hepatic “Bile Secretion” pathway visualized using PathView R package. Gene set enrichment using GAGE R and KEGG pathways database on differentially expressed genes (FDRp < 0.1) from DeSeq2, highlighted blue for fold-change >0 and red for fold-change <0 in HCVi versus SVR (n = 22). (B) Decreased hepatic BA synthesis genes CYP7A1 and CYP7B1, and BA conjugation genes BAAT and SLC27A5/BACS. Two-sided Wilcoxon matched-pairs signed rank test (n = 22). Column bar graph, median with IQR. FDRp value + =0.05–0.1, *0.05–0.01, **0.01–0.001, ***0.001–0.0001, ****< 0.0001. Abbreviations: BA, bile acid; FDR, false discovery rate; HCVi, patients infected with HCV; KEGG, Kyoto Encyclopedia of Genes and Genomes.
Microbial bile acid metabolism is not altered in HCVi
Next, we explored changes in microbial bile acid transformation in HCVi. Unlike most studies evaluating microbial composition,22 we explored microbial function and composition using metatranscriptomics and 16S rRNA analysis, respectively. Microbial RNA sequences were aligned to MetaHIT Consortium and 889,668 nucleotide sequences were captured and annotated using Clusters of Orthologous Groups. Compared to SVR, there was no difference in microbial deconjugation gene expression microbial bile salt hydrolase (BSH) or microbial primary to secondary bile acid conversion genes Bai (bile acid–inducible genes) in HCVi (data not shown). Furthermore, bile acids showed no significant associations with microbial genes to explain the elevated serum-conjugated primary bile acids in HCVi.
By direct assessment of hepatic and microbial transcriptomics, we have shown how elevated systemic conjugated primary bile acids in HCVi are not driven by de novo hepatic bile acid synthesis or microbial bile acid transformation, at least in compensated liver disease. Enhanced expression of hepatocyte bile acid exporters into the systemic circulation (OST-alpha and OST-beta) suggests hepatic spillover as an explanation for the elevated serum bile acids.
Bile acids in splenic serum play a role in chronic liver disease after SVR
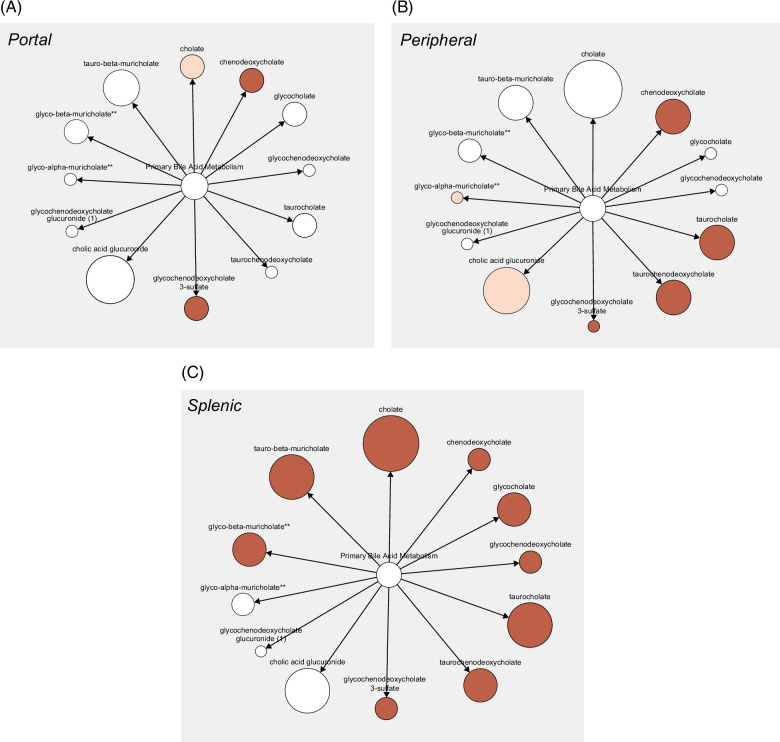
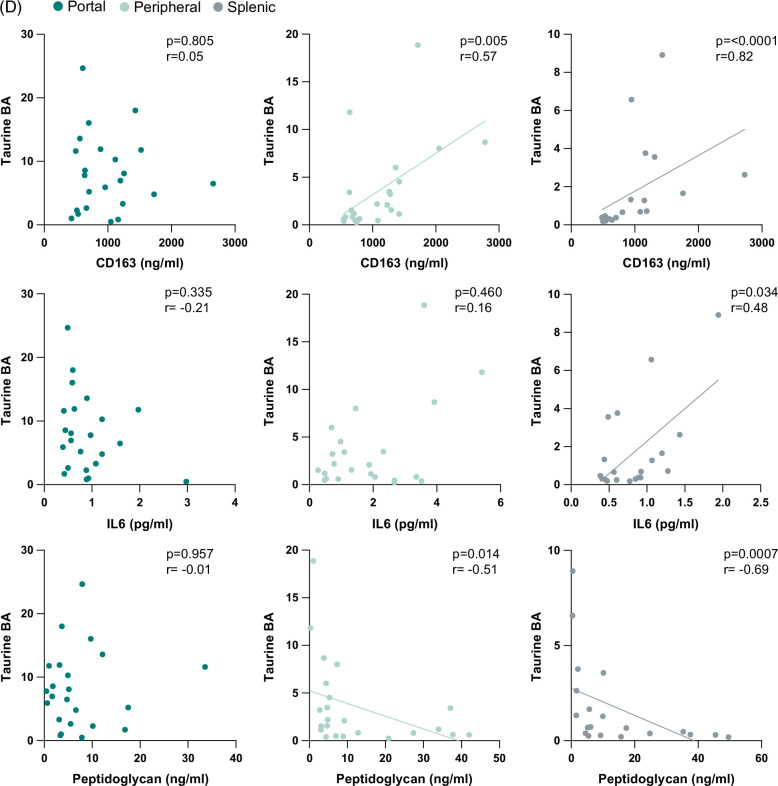
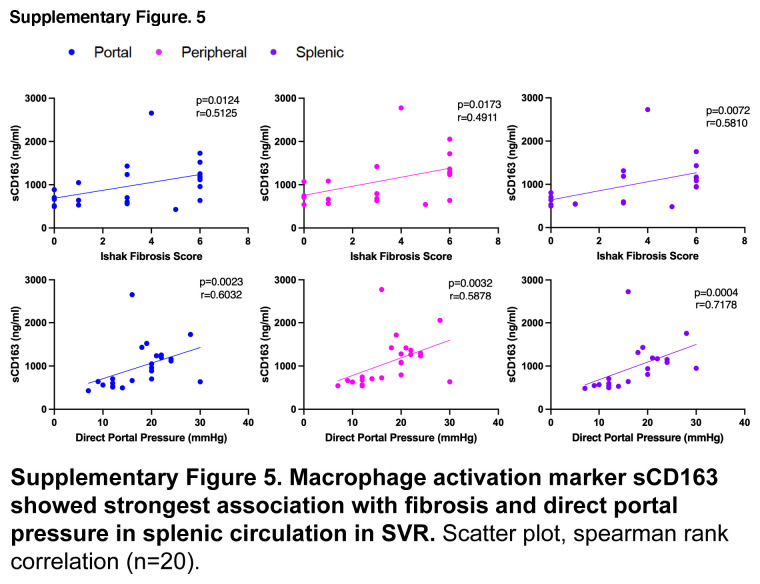
Assessment of portal and splenic blood in SVR allowed us to explore circulating primary bile acids from the gut and spleen, respectively. Intriguingly, SVR-Cirr showed persistent elevation in primary bile acids compared to SVR non-cirrhotics (SVR-NC), and these changes were most predominant in splenic serum (Figures 4A–C). As tissue macrophages play a role in the alternative pathway of bile acid synthesis, we explored a possible link between serum bile acids and macrophage activity.23 Splenic primary Tau-BA showed the strongest association with higher splenic soluble cluster of differentiation (sCD163) (macrophage activation marker), IL6 (macrophage-derived proinflammatory cytokine), and peptidoglycan (microbial cell wall marker, phagocytosed predominantly by macrophages) in SVR (Figure 4D). None of these associations was noted in portal blood and was less pronounced in the peripheral circulation. The pathological relevance of splenic macrophage activity was further exemplified by the strongest association of hepatic fibrosis and direct portal pressure with splenic sCD163 in SVR (Supplemental Figure S5, http://links.lww.com/HC9/A955).
FIGURE 4.
Re-evaluation after SVR revealed the importance of splenic bile acids in cirrhosis independent of HCV. Graphic visualization of primary BA (Metabolon Pathway Explorer) comparing SVR-Cirr versus SVR-NC in (A) portal, (B) peripheral, and (C) splenic serum. Node and node size represent primary BA and fold-change, respectively, colored red for unadjusted p < 0.05, one-way ANOVA. For peripheral/portal BA, SVR-Cirr, n = 9; SVR-NC, n = 14; for splenic BA, SVR-Cirr, n = 8 and SVR-NC, n = 12. (D) In SVR, macrophage activation markers sCD163, IL6, and peptidoglycan showed the strongest association with splenic Tau-BA. Scatter plot, Spearman rank correlation (n = 20). Abbreviations: BA, bile acid; SVR, sustained virologic response; SVR-Cirr, SVR cirrhotics; SVR-NC, SVR non-cirrhotics.
Studies have shown a shift in bile acid synthesis from the classic to the alternative pathway and elevated taurine-conjugated primary bile acids across liver disease etiologies.20,21 By direct evaluation of splenic blood after SVR, we have uncovered a role of the spleen in bile acid metabolism. Splenic macrophage activity and elevated primary bile acids in the splenic circulation may have pathological relevance in cirrhosis even after SVR.
Taurine-conjugated bile acids are strongly linked to hepatic bile acid receptors in HCVi
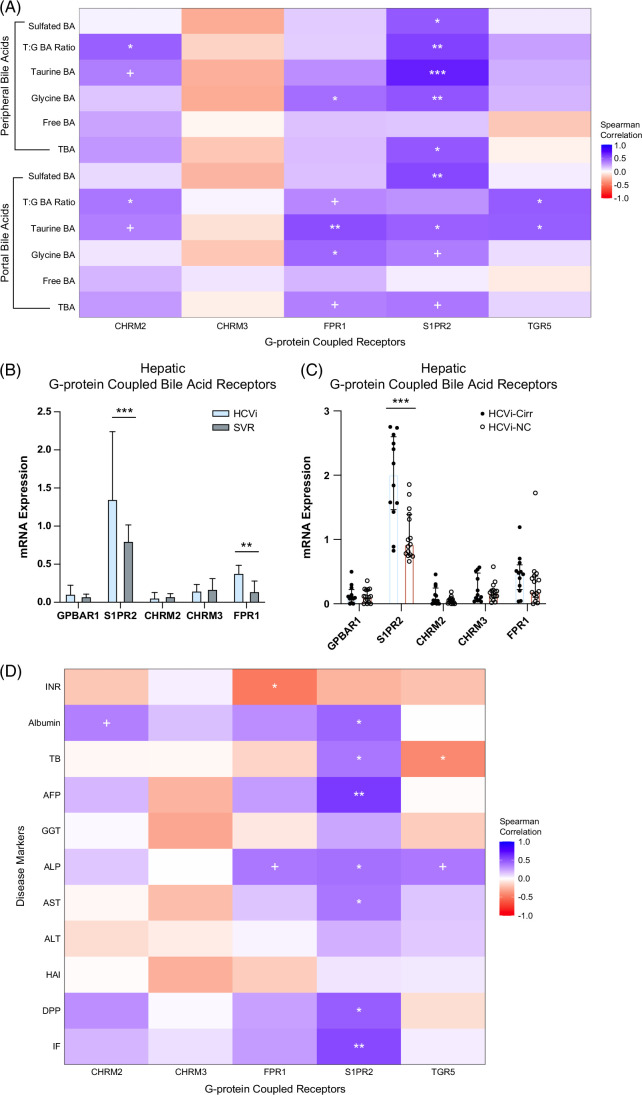
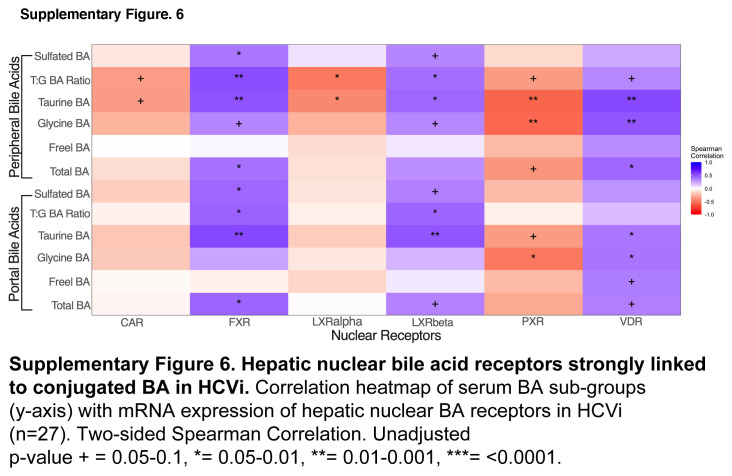
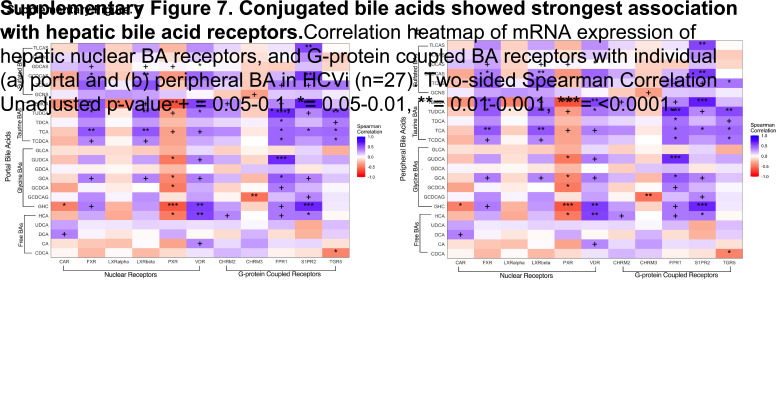
We next explored the hepatic bile acid receptors to elucidate the downstream effects of serum bile acid alterations in HCVi. Bile acids mediate immunometabolic effects through bile acid binding nuclear and G-protein–coupled receptors (GPCRs) that have varying affinity for bile acids based on hydroxylation and conjugation.5 Serum bile acids were correlated with hepatic expression of nuclear bile acid receptors (FXR, LXR alpha, LXR beta, VDR, CAR, and PXR) and GPCR (TGR5, S1PR2, CHM2, CHM3, and FPR1) in HCVi (Figure 5A, Supplemental Figure S6, http://links.lww.com/HC9/A956, Supplemental Figures S7A, B, http://links.lww.com/HC9/A957). Distinct associations were found between hepatic bile acid receptors, including FXR, S1PR2, and conjugated bile acids.
FIGURE 5.
Hepatic bile acid receptors, especially S1PR2, strongly linked to conjugated BA and liver disease severity in HCVi. (A) Correlation heatmap of serum BA subgroups (y axis) with mRNA expression of hepatic G-protein–coupled BA receptors (GPCR) in HCVi (n = 27). Two-sided Spearman correlation. Unadjusted p value + =0.05–0.1, *0.05–0.01, **0.01–0.001, ***<0.0001. (B) Among hepatic GPCR, only S1PR2 and FPR1 showed enhanced expression in HCVi. Two-sided Wilcoxon matched-pairs signed rank test. HCVi versus SVR (n = 22). Column bar graph, median with IQR. FDRp value + =0.05–0.1, *0.05–0.01, **0.01–0.001, ***0.001–0.0001, ****< 0.0001. (C) Only S1PR2 showed elevated hepatic expression in HCVi-Cirr; 2-sided Mann-Whitney U test, HCVi-Cirr (n = 13) versus HCVi-NC (n = 16), interleaved scatter with bars graph, median with IQR, unadjusted p value + =0.05–0.1, *0.05–0.01, **0.01–0.001, ***0.001–0.0001, ****< 0.0001, and (D) among hepatic GPCR (x axis), S1PR2 correlated with liver disease severity markers (y axis). Same parameters as panel A. Abbreviations: BA, bile acid; GPCR, G-protein–coupled receptor; HCVi, patients infected with HCV; HCV-Cirr, HCVi cirrhotics; HCVi-NC, HCVi non-cirrhotics; S1PR2, spingosine-1-phosphate receptor 2.
Hepatic S1PR2 has pathological implications in HCVi liver disease
Conjugated primary bile acids strongly correlated with enhanced hepatic expression of S1PR2, TGR5, and FPR1 (microbial sensing product) (Figure 5A, Supplemental Figures S7A, B, http://links.lww.com/HC9/A957). Among all hepatic GPCRs, the strongest associations were noted between conjugated bile acids and hepatic S1PR2, a unique bile acid receptor that exclusively binds to conjugated bile acids, not free bile acids.6 Conjugated bile acid-S1PR2 interaction influences hepatic inflammation and fibrosis through multiple downstream signaling pathways.6 Hepatic S1PR2 was the only GPCR with a direct association with the 2 disease-associated bile acids, TBMCA and GHC. Further highlighting the pathological relevance of hepatic S1PR2, it was 1 of 2 GPCRs with higher expression in HCVi compared to SVR, and the only GPCR with higher expression in HCVi-Cirr compared to HCVi-NC (Figures 5B, C). Lastly, hepatic S1PR2 was the only GPCR that correlated with increased markers of hepatic injury and dysfunction (Figure 5D). Our findings suggest a mechanism of immune modulation by conjugated bile acids through a putative role for hepatic S1PR2 in liver disease pathogenesis.
Conjugated bile acids linked to circulatory and hepatic inflammation
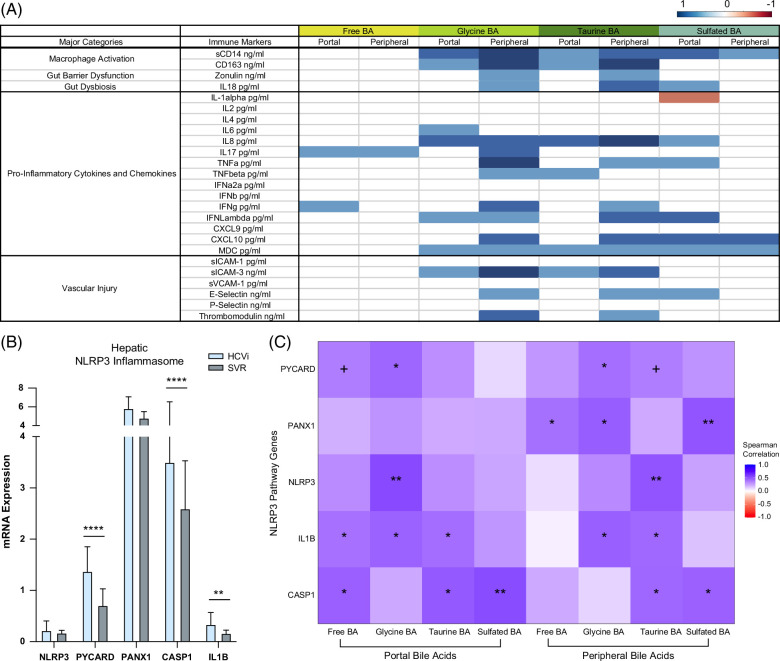
To explore the immunological role of conjugated bile acids, we correlated bile acids with serum immune markers and hepatic inflammatory pathways (Figure 6A, Supplemental Table S3, http://links.lww.com/HC9/A975). In HCVi, portal and peripheral-conjugated, not free, bile acids showed a positive association with markers of macrophage activation, gut dysbiosis, intestinal barrier dysfunction, proinflammatory cytokines/chemokines, and vascular injury. This is consistent with previous studies in inflammatory bowel disease and colitis, whereby higher luminal exposure to taurine bile acids has been linked to antimicrobial effects and colonic inflammation in obesity.24,25 The strongest association of immune markers with peripheral bile acids suggests an intrahepatic and/or posthepatic source of these immune mediators.
FIGURE 6.
Conjugated bile acids linked to circulatory immune markers and enhanced hepatic inflammation. (A) Correlations of serum BA grouped by conjugation with serum markers of macrophage activation, gut barrier dysfunction, dysbiosis, inflammation, and vascular injury in HCVi. Cells colored blue or orange for Spearman correlation coefficient when unadjusted p < 0.05 (n = 29). Exact p values in Supplemental Table S3, http://links.lww.com/HC9/A975. (B) Hepatic NLRP3 inflammasome genes in HCVi compared to SVR. Two-sided Wilcoxon matched-pairs signed rank test (n = 22). Column bar graph, median with IQR. FDRp value + =0.05–0.1, *0.05–0.01, **0.01–0.001, ***0.001–0.0001, ****< 0.0001. (C) Correlation heatmap of hepatic NLRP3 pathway genes (y axis) with portal and peripheral grouped BA (x axis), 2-sided Spearman correlation (n = 27). unadjusted p value + =0.05–0.1, *0.05–0.01, **0.01–0.001, ***0.001–0.0001, ****< 0.0001. Abbreviations: BA, bile acid; HCVi, patients infected with HCV; NLRP3, NLR family pyrin domain-containing 3 inflammasome; SVR, sustained virologic response;
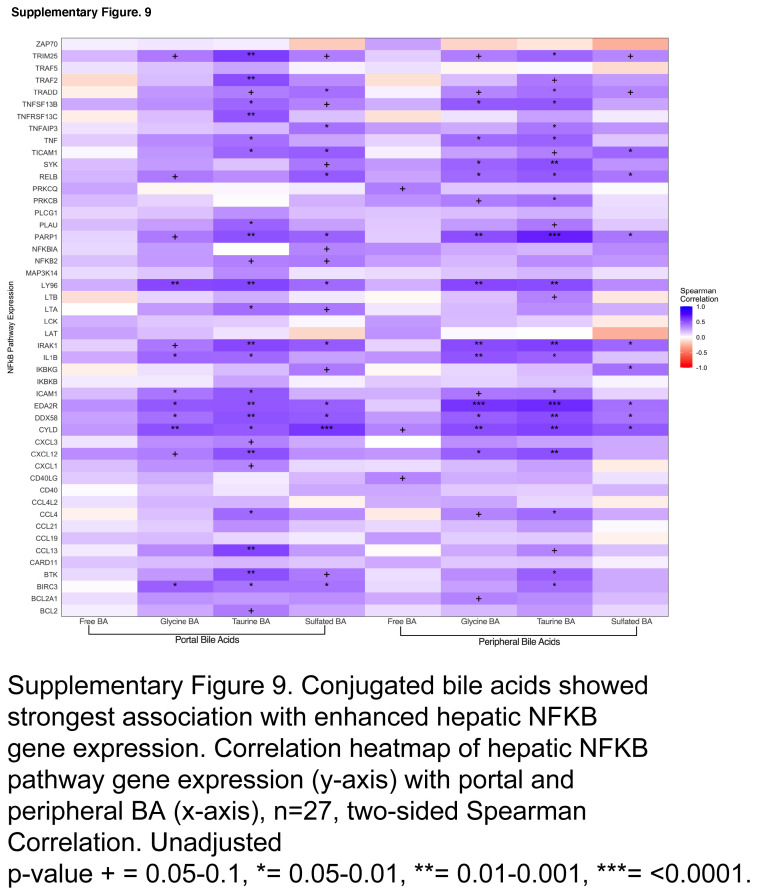
Conjugated bile acids mediate immunological effects through nuclear factor kappa-light-chain-enhancer of activated B cells (NFkB)6 and NLR family pyrin domain-containing 3 inflammasome (NLRP3).26 By exploring the hepatic transcriptome, we have identified similar concepts in HCVi liver disease. Compared to SVR, HCVi showed higher expression of 3 of 5 NLRP3 inflammasome genes and 48 of 101 genes in the NFkB signaling pathway (Figure 6B, Supplemental Figure S8, http://links.lww.com/HC9/A958). Most hepatic genes in NLRP3 and NFKB pathways were strongly linked to conjugated, not free bile acids (Figure 6C, Supplemental Figure S9, http://links.lww.com/HC9/A959). These findings corroborate a role for conjugated bile acids in hepatic inflammation through a conjugated bile acid-hepatic S1PR2 axis in HCVi liver disease.
Conjugated bile acids linked to hepatic pathways for immunity and metabolism
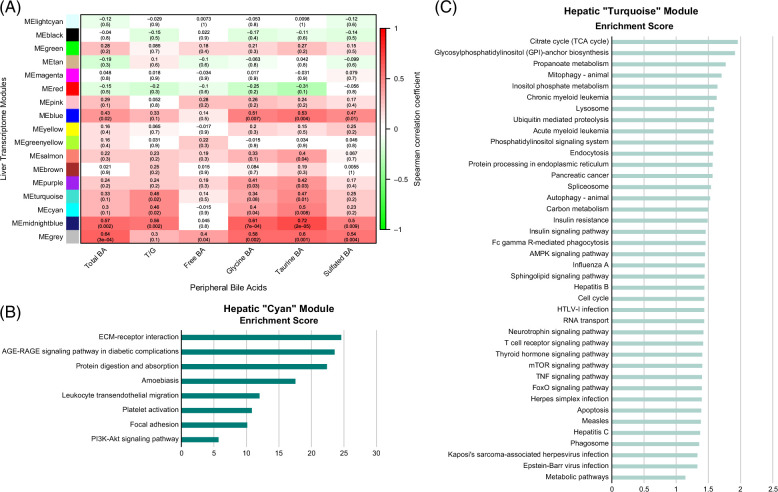
To explore the complete extent of hepatic functions linked to circulatory bile acids in HCVi, we performed WGCNA on hepatic genes and correlated hepatic coexpressed modules with serum bile acids (Figure 7A, Supplemental Figure S10, http://links.lww.com/HC9/A960). Serum-conjugated bile acids, especially Tau-BA, were linked to 6 hepatic coexpressed modules. These hepatic modules were not only enriched in bile acid metabolism genes, including S1PR2, FXR, and BAAT, but also hepatic pathways related to immunity, inflammation, fibrogenesis, and hepatic energy metabolism (Figures 7B, C, Supplemental Table S4, http://links.lww.com/HC9/A975). This agnostic approach has demonstrated the pathological relevance of conjugated bile acids, especially Tau-BA, in HCVi liver disease.
FIGURE 7.
Conjugated bile acids linked to hepatic pathways for inflammation and metabolism. (A) Correlation heatmap of serum grouped BA (x axis) in peripheral blood with hepatic coexpressed gene modules in HCVi (y axis). ME, module expression; upper row, Spearman correlation coefficient; parenthesis, 2-sided unadjusted p value. Hepatic coexpressed gene modules were constructed using WGCNA (Methods). Over-representation analysis of genes in hepatic modules (B) “MECyan” and (c) “METurquoise” visualized as bar plots. NetworkAnalyst, annotated to KEGG pathway database. Only visualized pathways with FDRp < 0.1. Abbreviations: BA, bile acid; FDR, false discovery rate; KEGG, Kyoto Encyclopedia of Genes and Genomes; WGCNA, weighted gene co-expression network analysis.
DISCUSSION
Longitudinal assessment of bile acids across multiple circulatory compartments before and after SVR has uncovered elevated Tau-BAs in HCVi and cirrhosis. Integration of serum bile acids with the liver and microbial transcriptome has extended the knowledge of bile acids in liver disease pathogenesis. Demonstration of an immunometabolic role for Tau-BAs through hepatic bile acid receptor S1PR2 suggests S1PR2 as a therapeutic target in HCVi liver disease.
Detailed serum bile acids analysis has reinforced previous findings of elevated conjugated bile acids, especially Tau-BAs in HCVi, compounded in cirrhosis. A shift toward taurine conjugation rather than glycine is consistent with prior findings across liver disease etiologies.21,27,28 Persistently elevated taurine bile acids in SVR cirrhosis emphasize the relevance of taurine bile acids in chronic liver disease independent of HCV.
Simultaneous evaluation of the hepatic transcriptome has revealed concomitant downregulation of hepatic bile acid uptake, synthesis, conjugation, and secretion into bile canaliculi in HCVi. This may be an attempt to limit intrahepatic bile acid–mediated injury, as postulated.28
Bile acid perturbations in relation to the gut microbiome in liver disease have been widely studied and have predominantly focused on microbial composition.22 By directly exploring the microbial metatranscriptome, we found no relation between serum bile acids and microbial bile acid deconjugation and dehydroxylation genes. Thus, the gut microbiome is unlikely responsible for elevated serum-conjugated primary bile acids in HCVi. Previous studies suggesting altered BSH activity in liver disease have done so by mostly extrapolating BSH expression from microbial composition.27,29 Smirnova et al,30 however, did demonstrate increased BSH activity in NAFLD from microbial metatranscriptome which may be due to distinct disease etiologies.
Alternative pathways for bile acid synthesis have long been known to contribute to serum bile acids.31,32 A shift from classic to alternative pathways of intrahepatic bile acid synthesis may contribute to circulating bile acids in chronic liver disease.23,33,34 Unlike previous studies, the hepatic alternative pathway cannot account for primary bile acids in our HCVi cohort, given the reduced hepatic expression of CYP7B1, a major alternative pathway gene.32
Bile acid metabolism is emerging as an important concept beyond its synthesis in the liver and derangements in liver diseases. Bile acid precursors synthesized through alternative pathways are believed to flow to the liver from extrahepatic sites.35,36 Bile acid metabolism genes have been found in extrahepatic macrophages and immune cells, highly abundant in the spleen.37 These concepts are important as we have shown how primary bile acids remain elevated in SVR cirrhosis and show a strong association with macrophage activity, predominantly in splenic circulation. The pathological relevance of the spleen in the context of bile acid alterations is a field of limited research.38 Our study cannot conclude that the spleen may be a source of elevated bile acids in SVR cirrhosis, given the absence of splenic biopsies for transcriptomics analysis. However, our findings strongly encourage the study of splenic immunology in relation to bile acids in liver disease.39 Alternatively, these concepts can be explored further through studies on human-derived bone marrow cells.
Evaluation of serum bile acids and hepatic transcriptome has identified distinct bile acid receptors in liver disease as potential therapeutic targets. Only through an unbiased approach have we identified the pathological relevance of an under35,36-appreciated G-protein–coupled bile acid receptor, S1PR2. This bile acid receptor is unique as it exclusively binds to conjugated bile acids.6 Not only did we find the strongest associations between hepatic S1PR2 and disease-associated Tau-BAs, but S1PR2 was the only bile acid receptor with enhanced hepatic expression in HCVi as a whole cohort and in cirrhosis within HCVi. These are important findings as conjugated bile acid-hepatic S1PR2 signaling is being studied in the context of cholestasis, lipid metabolism, hepatic encephalopathy, and carcinogenesis.6,40,41
Despite similar beneficial effects on energy metabolism, hepatic S1PR2 and TGR5 have opposing effects on inflammation.6 Hepatic S1PR2 exhibits proinflammatory effects, and its manipulation in mouse models has led to endothelial and stellate cell activation, elevated portal pressures, immune cell adhesion, macrophage polarization to M1 phenotype, and NFkB activation. These concepts are highly relevant in liver disease pathogenesis but have mostly been explored in animal models. Our findings from human samples have revealed that the conjugated bile acid-hepatic S1PR2 signaling may, in fact, be the mechanism explaining the link between conjugated bile acids, systemic immune signatures, and hepatic inflammation through NLRP3 and NFKB signaling in HCVi. Furthermore, longitudinal analysis after HCV clearance with a subsequent decrease in conjugated bile acids and hepatic S1PR2 expression strengthens the role of conjugated bile acid-hepatic S1PR2 in host response to HCV-induced stress. Therapeutic implications of these findings in HCVi and non-HCVi liver disease etiologies are supported by S1PR2 inhibition as a therapeutic target in cholestasis, fibrosis, and inflammation across metabolic and cholestatic liver diseases.7,40,42 The role of S1PR2 is increasingly being recognized even beyond liver diseases in colorectal tumorigenesis and vascular inflammatory disorders, again emphasizing the potential therapeutic importance of S1PR2, which is worthy of further study.43,44
While a longitudinal cohort study, most of the findings remain associative without a control cohort and require validation in experimental models. HCV was chosen as a model as it is possible to cure HCV, making the SVR non-cirrhotic cohort, in essence, an imperfect control group. A further limitation was the lack of splenic blood in HCVi, as the concept of studying splenic blood only arose immediately before the evaluation of the SVR cohort. Even though only studied at the second time point, bile acid analysis in the splenic vein uncovered biological associations with pathological relevance in liver disease pathogenesis. Another significant omission was the direct study of biliary bile acids and luminal microbes, which could explain the absence of a link between liver disease and microbial bile acid metabolism. Lastly, the number of patients in the various subgroups is small. Each patient was to be deeply pedigreed, and the nature of the study was invasive, thus limiting the ability to study large numbers of patients.
CONCLUSIONS
In summary, we have shown elevated serum-conjugated bile acids in HCVi liver alongside a decrease in hepatic bile acid synthesis in HCVi compared to SVR. These findings have been described to varying extents across liver diseases, including NAFLD, suggesting a commonality and broader applicability. We have further elucidated the importance of splenic biology in the liver, especially in the context of bile acid metabolism in cirrhosis even after SVR. Examining the interplay between serum bile acids and hepatic bile acid receptors has demonstrated that Tau-BAs are most biologically active in HCVi and may play a role in liver disease pathogenesis through S1PR2-mediated hepatic inflammation. By integrating circulatory and transcriptional signals relevant to bile acid metabolism, we have allowed for the possibility of refinement in therapy, targeting of biological pathways, and minimization of side effects in the treatment of liver disease.4,5,45
Supplementary Material
Supplementary Material
DATA AVAILABILITY STATEMENT
Please note that the microbial and liver transcriptome sequence data set has been made available in the BioProject repository. The DOI URL is https://www.ncbi.nlm.nih.gov/bioproject/?term=PRJNA727609.Other data sets generated during and/or analyzed during the current study are available from the corresponding authors on reasonable request.
AUTHOR CONTRIBUTIONS
All authors had a substantial contribution to this work. All authors provided approval for the final submitted version of the manuscript. Individual contributions are listed as follows: Rabab O. Ali: study design; acquisition, analysis, and interpretation of data; and drafted initial work and substantively revised it. James A. Haddad: analysis and interpretation of data. Gabriella M. Quinn, Grace Y. Zhang, and Elizabeth Townsend: acquisition, analysis, and interpretation of data. Lisa Scheuing and Kareen L. Hill: acquisition and analysis of data. Matthew Menkart, Jenna L. Oringher, and Regina Umarova: analysis and interpretation of data. Shakuntala Rampertaap, Sergio D. Rosenzweig, Christopher Koh, Elliot B. Levy, and David E. Kleiner: acquisition of data. Ohad Etzion: design of the work, acquisition, analysis, and interpretation of data. Theo Heller: conception and design of the work; the acquisition, analysis, and interpretation of data; and drafted the initial work and substantively revised it.
ACKNOWLEDGMENTS
The authors thank the patients, staff, Michael W. Krause, Jim E. Balow, T. Jake Liang, Jay H. Hoofnagle, and the Institutional Review Board.
FUNDING INFORMATION
Financial support was provided by the intramural programs of the National Institute of Diabetes and Digestive and Kidney Diseases (DK054514), National Cancer Institute, and Clinical Center of the National Institutes of Health. In addition, the project was funded by an intramural NIH Bench to Bedside and Back Program Award: Mechanisms of microbial translocation in hepatitis C related liver disease 2014.
CONFLICTS OF INTEREST
The authors have no conflicts to report.
Footnotes
Abbreviations: BSH, bile salt hydrolase; CA, cholate; CDCA, chenodeoxycholate; DCA, deoxycholic acid; GHC, glycohycholate; GPCR, G-protein–coupled receptor; HCVi, patients infected with hepatitis C virus; HCV-Cirr, HCVi cirrhotics; HCVi-NC, HCVi non-cirrhotics; MetaHIT, Metagenomics of the Human Intestinal Tract; NLRP3, NLR family pyrin domain-containing 3; RNA-Seq, ribonucleic acid Sequencing; S1PR2, spingosine-1-phosphate receptor 2; sCD, soluble cluster of differentiation; SVR, sustained virologic response; SVR-Cirr, SVR cirrhotics; SVR-NC, SVR non-cirrhotics; Tau-BA, total taurine-conjugated bile acids; T/G, ratio of total taurine-conjugated bile acids to total glycine-conjugated bile acids; TBMA, tauro-beta-muricholate; TBMCA, tauro-beta-muricholate; UDCA, ursodeoxycholate; WGCNA, weighted gene co-expression network analysis; 7-HOCA, 7-alpha-hydroxy-3-oxo-4-cholestenoate.
Supplemental Digital Content is available for this article. Direct URL citations are provided in the HTML and PDF versions of this article on the journal’s website, www.hepcommjournal.com.
Contributor Information
Rabab O. Ali, Email: rabab.ali226@gmail.com.
James A. Haddad, Email: jamesahaddad@gmail.com.
Gabriella M. Quinn, Email: gabriella.m.quinn@gmail.com.
Grace Y. Zhang, Email: grac3.zhang@gmail.com.
Elizabeth Townsend, Email: Ltowns22@gmail.com.
Lisa Scheuing, Email: lss83@georgetown.edu.
Kareen L. Hill, Email: kareen.hill12@gmail.com.
Matthew Menkart, Email: matthew@menk.com.
Jenna L. Oringher, Email: jloleigh12@gmail.com.
Regina Umarova, Email: regina.umarova@nih.gov.
Shakuntala Rampertaap, Email: shakuntala.rampertaap@nih.gov.
Sergio D. Rosenzweig, Email: sergio.rosenzweig@nih.gov.
Christopher Koh, Email: christopher.koh@nih.gov.
Elliot B. Levy, Email: levyeb@cc.nih.gov.
David E. Kleiner, Email: kleinerd@mail.nih.gov.
Ohad Etzion, Email: ohadet34@yahoo.com.
Theo Heller, Email: theoh@intra.niddk.nih.gov.
REFERENCES
- 1. Macpherson AJ, Heikenwalder M, Ganal-Vonarburg SC. The liver at the nexus of host-microbial interactions. Cell Host Microbe. 2016;20:561–571. [DOI] [PubMed] [Google Scholar]
- 2. Shapiro H, Kolodziejczyk AA, Halstuch D, Elinav E. Bile acids in glucose metabolism in health and disease. J Exp Med. 2018;215:383–396. [DOI] [PMC free article] [PubMed] [Google Scholar]
- 3. Fiorucci S, Biagioli M, Zampella A, Distrutti E. Bile acids activated receptors regulate innate immunity. Front Immunol. 2018;9:1853. [DOI] [PMC free article] [PubMed] [Google Scholar]
- 4. Agus A, Clément K, Sokol H. Gut microbiota-derived metabolites as central regulators in metabolic disorders. Gut. 2020;70:1174–1182. [DOI] [PMC free article] [PubMed] [Google Scholar]
- 5. Fiorucci S, Distrutti E. The Pharmacology of Bile Acids and Their Receptors. In: Fiorucci S, Distrutti E, eds. Bile Acids and Their Receptors Handbook of Experimental Pharmacology. Springer International Publishing; 2019:3–18. [DOI] [PubMed] [Google Scholar]
- 6. Keitel V, Stindt J, Häussinger D. Bile Acid-Activated Receptors: GPBAR1 (TGR5) and Other G Protein-Coupled Receptors. In: Fiorucci S, Distrutti E, eds. Bile Acids and Their Receptors Handbook of Experimental Pharmacology. Springer International Publishing; 2019:19–49. [DOI] [PubMed] [Google Scholar]
- 7. Keitel V, Dröge C, Häussinger D. Targeting FXR in Cholestasis. In: Fiorucci S, Distrutti E, eds. Bile Acids and Their Receptors Handbook of Experimental Pharmacology. Springer International Publishing; 2019:299–324. [DOI] [PubMed] [Google Scholar]
- 8. Ali RO, Quinn GM, Umarova R, Haddad JA, Zhang GY, Townsend EC, et al. Longitudinal multi-omics analyses of the gut–liver axis reveals metabolic dysregulation in hepatitis C infection and cirrhosis. Nat Microbiol . 2023;8:12–27. [DOI] [PubMed] [Google Scholar]
- 9. Knodell RG, Ishak KG, Black WC, Chen TS, Craig R, Kaplowitz N, et al. Formulation and application of a numerical scoring system for assessing histological activity in asymptomatic chronic active hepatitis. Hepatol Baltim Md. 1981;1:431–435. [DOI] [PubMed] [Google Scholar]
- 10. Ishak K, Baptista A, Bianchi L, Callea F, De Groote J, Gudat F, et al. Histological grading and staging of chronic hepatitis. J Hepatol. 1995;22:696–699. [DOI] [PubMed] [Google Scholar]
- 11. Evans A, Bridgewater BR. High resolution mass spectrometry improves data quantity and quality as compared to unit mass resolution mass spectrometry in high-throughput profiling metabolomics. J Postgenomics Drug Biomark Dev. 2014;04:1–7. [Google Scholar]
- 12. Kanehisa M, Sato Y, Kawashima M, Furumichi M, Tanabe M. KEGG as a reference resource for gene and protein annotation. Nucleic Acids Res. 2016;44:D457–D462. [DOI] [PMC free article] [PubMed] [Google Scholar]
- 13. Langfelder P, Horvath S. WGCNA: An R package for weighted correlation network analysis. BMC Bioinform. 2008;9:559. [DOI] [PMC free article] [PubMed] [Google Scholar]
- 14. Luo W, Friedman MS, Shedden K, Hankenson KD, Woolf PJ. GAGE: Generally applicable gene set enrichment for pathway analysis. BMC Bioinform. 2009;10:161. [DOI] [PMC free article] [PubMed] [Google Scholar]
- 15. Takahashi S, Fukami T, Masuo Y, Brocker CN, Xie C, Krausz KW, et al. Cyp2c70 is responsible for the species difference in bile acid metabolism between mice and humans. J Lipid Res. 2016;57:2130–2137. [DOI] [PMC free article] [PubMed] [Google Scholar]
- 16. García-Cañaveras JC, Donato MT, Castell JV, Lahoz A. Targeted profiling of circulating and hepatic bile acids in human, mouse, and rat using a UPLC-MRM-MS-validated method. J Lipid Res. 2012;53:2231–2241. [DOI] [PMC free article] [PubMed] [Google Scholar]
- 17. Xiao Y-T, Cao Y, Zhou K-J, Lu L-N, Cai W. Altered systemic bile acid homeostasis contributes to liver disease in pediatric patients with intestinal failure. Sci Rep. 2016;6:39264. [DOI] [PMC free article] [PubMed] [Google Scholar]
- 18. Nakashima T, Yoh T, Sumida Y, Kakisaka Y, Mitsuyoshi H. Differences in the efficacy of ursodeoxycholic acid and bile acid metabolism between viral liver diseases and primary biliary cirrhosis. J Gastroenterol Hepatol. 2001;16:541–547. [DOI] [PubMed] [Google Scholar]
- 19. Bell LN, Wulff J, Comerford M, Vuppalanchi R, Chalasani N. Serum metabolic signatures of primary biliary cirrhosis and primary sclerosing cholangitis. Liver Int. 2015;35:263–274. [DOI] [PMC free article] [PubMed] [Google Scholar]
- 20. Luo L, Aubrecht J, Li D, Warner RL, Johnson KJ, Kenny J, et al. Assessment of serum bile acid profiles as biomarkers of liver injury and liver disease in humans. PLoS One. 2018;13:e0193824. [DOI] [PMC free article] [PubMed] [Google Scholar]
- 21. Puri P, Daita K, Joyce A, Mirshahi F, Santhekadur PK, Cazanave S, et al. The presence and severity of nonalcoholic steatohepatitis is associated with specific changes in circulating bile acids. Hepatology. 2018;67:534–548. [DOI] [PMC free article] [PubMed] [Google Scholar]
- 22. Ridlon JM, Kang D-J, Hylemon PB, Bajaj JS. Gut microbiota, cirrhosis, and alcohol regulate bile acid metabolism in the gut. Dig Dis. 2015;33:338–345. [DOI] [PMC free article] [PubMed] [Google Scholar]
- 23. Pandak WM, Kakiyama G. The acidic pathway of bile acid synthesis: Not just an alternative pathway. Liver Res. 2019;3:88–98. [DOI] [PMC free article] [PubMed] [Google Scholar]
- 24. Devkota S, Wang Y, Musch MW, Leone V, Fehlner-Peach H, Nadimpalli A, et al. Dietary-fat-induced taurocholic acid promotes pathobiont expansion and colitis in Il10-/- mice. Nature. 2012;487:104–108. [DOI] [PMC free article] [PubMed] [Google Scholar]
- 25. Long SL, Gahan CGM, Joyce SA. Interactions between gut bacteria and bile in health and disease. Mol Aspects Med. 2017;56:54–65. [DOI] [PubMed] [Google Scholar]
- 26. Hao H, Cao L, Jiang C, Che Y, Zhang S, Takahashi S, et al. Farnesoid X receptor regulation of the NLRP3 inflammasome underlies cholestasis-associated sepsis. Cell Metab. 2017;25:856–867.e5. [DOI] [PMC free article] [PubMed] [Google Scholar]
- 27. Chen W, Wei Y, Xiong A, Li Y, Guan H, Wang Q, et al. Comprehensive analysis of serum and fecal bile acid profiles and interaction with gut microbiota in primary biliary cholangitis. Clin Rev Allergy Immunol. 2020;58:25–38. [DOI] [PubMed] [Google Scholar]
- 28. Brandl K, Hartmann P, Jih LJ, Pizzo DP, Argemi J, Ventura-Cots M, et al. Dysregulation of serum bile acids and FGF19 in alcoholic hepatitis. J Hepatol. 2018;69:396–405. [DOI] [PMC free article] [PubMed] [Google Scholar]
- 29. Lee G, You HJ, Bajaj JS, Joo SK, Yu J, Park S, et al. Distinct signatures of gut microbiome and metabolites associated with significant fibrosis in non-obese NAFLD. Nat Commun. 2020;11:4982. [DOI] [PMC free article] [PubMed] [Google Scholar]
- 30. Smirnova E, Muthiah MD, Narayan N, Siddiqui MS, Puri P, Luketic VA, et al. Metabolic reprogramming of the intestinal microbiome with functional bile acid changes underlie the development of NAFLD. Hepatology. 2022;76:1811–1824. [DOI] [PMC free article] [PubMed] [Google Scholar]
- 31. Wachtel N, Emerman S, Javitt NB. Metabolism of cholest-5-ene-3β, 26-diol in the rat and hamster. J Biol Chem. 1968;243:5207–5212. [PubMed] [Google Scholar]
- 32. Chiang JY. Recent advances in understanding bile acid homeostasis. F1000Res. 2017;6:2029. [DOI] [PMC free article] [PubMed] [Google Scholar]
- 33. Lake AD, Novak P, Shipkova P, Aranibar N, Robertson D, Reily MD, et al. Decreased hepatotoxic bile acid composition and altered synthesis in progressive human nonalcoholic fatty liver disease. Toxicol Appl Pharmacol. 2013;268:132–140. [DOI] [PMC free article] [PubMed] [Google Scholar]
- 34. Pabst O, Hornef MW, Schaap FG, Cerovic V, Clavel T, Bruns T. Gut–liver axis: Barriers and functional circuits. Nat Rev Gastroenterol Hepatol. 2023;20:447–461. [DOI] [PubMed] [Google Scholar]
- 35. Smith LP, Nierstenhoefer M, Yoo SW, Penzias AS, Tobiasch E, Usheva A. The bile acid synthesis pathway is present and functional in the human ovary. PLoS One. 2009;4:e7333. [DOI] [PMC free article] [PubMed] [Google Scholar]
- 36. Baloni P, Funk CC, Yan J, Yurkovich JT, Kueider-Paisley A, Nho K, et al. Metabolic network analysis reveals altered bile acid synthesis and metabolism in Alzheimer’s disease. Cell Rep Med. 2020;1:100138. [DOI] [PMC free article] [PubMed] [Google Scholar]
- 37. Uhlén M, Fagerberg L, Hallström BM, Lindskog C, Oksvold P, Mardinoglu A, et al. Tissue-based map of the human proteome. Science. 2015;347:1260419. [DOI] [PubMed] [Google Scholar]
- 38. Ohkubo H, Okuda K, Iida S, Ohnishi K, Ikawa S, Makino I. Role of portal and splenic vein shunts and impaired hepatic extraction in the elevated serum bile acids in liver cirrhosis. Gastroenterology. 1984;86:514–520. [PubMed] [Google Scholar]
- 39. D’Ambrosio R, Aghemo A, Rumi MG, Ronchi G, Donato MF, Paradis V, et al. A morphometric and immunohistochemical study to assess the benefit of a sustained virological response in hepatitis C virus patients with cirrhosis. Hepatol Baltim Md. 2012;56:532–543. [DOI] [PubMed] [Google Scholar]
- 40. Wang Y, Aoki H, Yang J, Peng K, Liu R, Li X, et al. The role of sphingosine 1-phosphate receptor 2 in bile-acid-induced cholangiocyte proliferation and cholestasis-induced liver injury in mice. Hepatol Baltim Md. 2017;65:2005–2018. [DOI] [PMC free article] [PubMed] [Google Scholar]
- 41. McMillin M, Frampton G, Grant S, Khan S, Diocares J, Petrescu A, et al. Bile acid-mediated sphingosine-1-phosphate receptor 2 signaling promotes neuroinflammation during hepatic encephalopathy in mice. Front Cell Neurosci. 2017;11:191. [DOI] [PMC free article] [PubMed] [Google Scholar]
- 42. Zhao X, Yang L, Chang N, Hou L, Zhou X, Yang L, et al. Neutrophils undergo switch of apoptosis to NETosis during murine fatty liver injury via S1P receptor 2 signaling. Cell Death Dis. 2020;11:1–14. [DOI] [PMC free article] [PubMed] [Google Scholar]
- 43. Petti L, Rizzo G, Rubbino F, Elangovan S, Colombo P, Restelli S, et al. Unveiling role of sphingosine-1-phosphate receptor 2 as a brake of epithelial stem cell proliferation and a tumor suppressor in colorectal cancer. J Exp Clin Cancer Res. 2020;39:253. [DOI] [PMC free article] [PubMed] [Google Scholar]
- 44. Zhang G, Yang L, Kim GS, Ryan K, Lu S, O’Donnell RK, et al. Critical role of sphingosine-1-phosphate receptor 2 (S1PR2) in acute vascular inflammation. Blood. 2013;122:443–455. [DOI] [PMC free article] [PubMed] [Google Scholar]
- 45. Wahlström A, Sayin SI, Marschall H-U, Bäckhed F. Intestinal crosstalk between bile acids and microbiota and its impact on host metabolism. Cell Metab. 2016;24:41–50. [DOI] [PubMed] [Google Scholar]
Associated Data
This section collects any data citations, data availability statements, or supplementary materials included in this article.


