

Abstract
The COVID‐19 pandemic led to unprecedented challenges to healthcare quality in the emergency department, including directly impacting quality metrics and worsening barriers to the quality improvement process such as burnout, staff turnover, and boarding. We aimed to develop a blueprint for postpandemic quality improvement to address these specific barriers, focused on prioritizing frontline staff engagement from idea generation to implementation and assessment. Drawing from teamwork literature, we constructed a process that emphasized egalitarian conversations, psychological safety, and creating an environment where staff could feel heard at every step of the process. We applied this blueprint to improving rates of patients who leave without being seen and achieved a four percentage point reduction (9% vs. 5%, p < 0.001), with high rates of staff satisfaction with the process. We conclude that while postpandemic quality improvement presents significant challenges, we can rise to meet those challenges by adapting existing quality improvement processes to increase frontline staff engagement.
Keywords: burnout, COVID‐19, operations, quality, triage, wait times
1. BACKGROUND
The COVID‐19 pandemic had a significant impact on healthcare quality across multiple domains. Hospital‐wide, standard national quality metrics, such as hospital‐acquired infections, increased. 1 In the emergency department (ED), multifactorial operational challenges precipitated a nationwide boarding crisis, 2 , 3 leading to several downstream effects including diminished ED throughput and increased wait times. Even with lower patient volumes, ED length of stay (LOS), 4 boarding, and crowding increased. 5 The COVID‐19 pandemic also changed patient concerns and considerations while visiting the ED, including increased scrutiny of waiting room safety and exposure to fellow patients (Figure 1). 6
FIGURE 1.
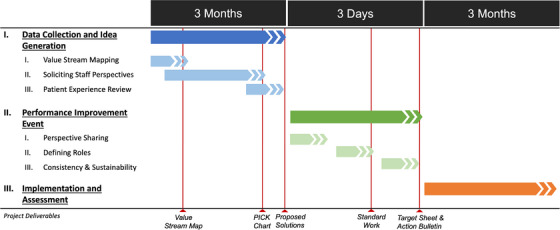
Project timeline for postpandemic, staff‐engaged quality improvement process. PICK signifies “Possible, Implement, Challenge, Kill” chart, a commonly used quality improvement framework to evaluate the feasibility and efficacy of potential interventions.
Between 2020 and 2023, quality improvement initiatives at our institution and others focused primarily on optimizing our response to the pandemic. 7 , 8 , 9 , 10 The specific challenges of the COVID‐19 pandemic were well suited for application of quality improvement methods given the need for organized and methodical approaches to a rapidly evolving situation. 11 However, these efforts did not address the larger drivers behind reduced efficiency, including workforce shortages, hospital‐wide scheduling delays, boarding, and access to postacute care facilities, all of which significantly worsened during the pandemic and have had lasting impact on ED operations. 12
Emerging from the COVID‐19 pandemic has left EDs in a unique position: the need for quality improvement is greater than ever, but increasing frontline staff burnout, workforce attrition, and deeply entrenched multidepartmental systems problems such as boarding have weakened our ability to effectively apply improvement methods. 13 , 14 Traditional improvement efforts rely heavily on frontline staff for implementation, but reduced capacity in the postpandemic era is a significant barrier to bolstering performance.
We aimed to create a blueprint for postpandemic quality improvement, using familiar tools that were updated to account for the current workforce environment, with a focus on improving triage in our ED. In particular, we drew upon teamwork literature to prioritize psychological safety and feeling heard, which are associated with lower rates of burnout and greater ability to adapt to new processes. 15 While traditional quality improvement methods emphasize rapid prototyping and implementation, we prioritized a long discovery phase targeted toward increased frontline engagement, emphasis on consensus building, tools to promote psychological safety, and multimodal outcomes that prioritize staff and patient needs.
2. DEFINING THE PROBLEM
Increasing wait times have been associated with worse patient experience 16 and higher rates of patients who left without being seen (LWBS). 17 , 18 , 19 These trends were reflected in our ED at the Zuckerberg San Francisco Hospital and Trauma Center, an urban, academic, safety‐net hospital with 397 licensed beds. In the year prior to implementation, we had 66,541 registered patient encounters and 4924 LWBS, for an LWBS rate of 7.4%. During this same time, the median ED LOS for admitted patients was 1341 min, while the LOS for patients discharged from the ED was 309 min.
3. OUR APPROACH
Prior to the pandemic, our organization utilized 5‐day rapid improvement events known as “Kaizen Workshops” to support organizational performance improvement priorities. These were planned by a small leadership team over a period of four weekly meetings prior to the event and followed up by a 30‐day action plan to achieve targets within 90 days. 20
Despite past successes with this model, we identified several key barriers in the current environment and sought to optimize the model for the staffing‐constrained, low‐capacity postpandemic ED (Table 1). We assembled a multidisciplinary Triage Improvement Task Force consisting of registered nurses (RNs), nurse practitioners (NPs) or physician assistants, physicians, departmental leadership, representatives from our hospital's Kaizen Promotion Office (performance improvement department), and executive sponsors to update this process for a postpandemic environment. RN representatives were recruited via broad outreach from nursing leadership, while all other tasks for members were appointed by their respective leadership.
TABLE 1.
Postpandemic barriers to success for standard quality improvement process and proposed solutions.
| Phase | Challenge associated with standard quality improvement process | Our solution |
|---|---|---|
| Idea generation | Current triage process not easily demonstrated by available formatting of electronic health record (EHR) data | Develop robust value stream map (VSM) leveraging EHR throughput data to visualize the triage process at a granular level |
| Idea generation | Limited time to solicit multidisciplinary perspectives, especially from frontline staff | Three‐month lead up to improvement event with frontline staff perspective sharing via online survey and daily at emergency department (ED) huddle board |
| Idea generation | Perspectives from patients are underutilized or absent | Rigorous review of quantitative and qualitative patient experience data, alongside staff experience and standard metrics review |
| Idea generation | Perspectives from those who cannot attend improvement event are limited | Employ asynchronous perspective solicitation and idea generation so that all shifts (including night shift) were represented in proposed projects |
| Performance improvement event | Attendance is limited to those who can leave clinical duties, made more difficult with limited staffing in post‐pandemic period | Three‐day event instead of 5‐day event, making attendance easier for frontline staff |
| Performance improvement event | Focus on rapid idea generation limits multidisciplinary perspectives | Day 1 of event focused on empathy building and intentional flattening of hierarchy |
| Performance improvement event | Takes time to brainstorm ideas and solutions, high time burden on attendees, with limited time spent on implementation | Three‐month lead in period allowed projects to be defined in advance, shifted focus to implementation |
| Implementation and assessment | Implementation reliant on frontline staff, difficult with staffing challenges and high burnout post‐pandemic | Longitudinal staff engagement throughout process increased buy‐in for projects, including performance huddles and electronic surveys |
| Implementation and assessment | Prioritize quantitative and efficiency‐focused metrics | Measure patient experience and staff experience, alongside quantitative throughput metrics |
| Implementation and assessment | Limited post‐implementation support | Post‐workshop coaching, check‐ins, and team meetings to increase sustainability of results |
3.1. Phase I: Data collection and idea generation
Our ED Triage Improvement Task Force used electronic health record data from the prior calendar year (2022) and asynchronous observations of triage to create a value stream map (VSM) to map each step of the process to identify waste (Supporting Information Appendix A1). Our VSM revealed that average wait time between triage and medical screening exam or initial evaluation was close to an hour (51.1 min) (Figure 2).
FIGURE 2.
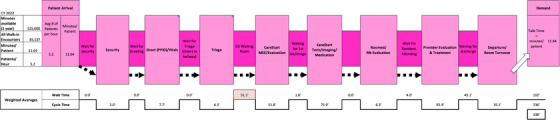
Value Stream Map (VSM) displaying total time at each step of emergency department (ED) visit. “Wait Time” indicates time between steps, while “Cycle Time” indicates time taken during each step. Triage wait time, defined as the time from triage end to CareStart medical screening evaluation (MSE), is highlighted in red. RN signifies registered nurse.
Second, we conducted an analysis of internal patient experience data from our hospital's patient experience survey—conducted via telephone, text, and email after an ED visit for all discharged patients (Supporting Information Appendix A2). We used data from 4466 respondents and found that patient satisfaction with wait times was the lowest of all other process metrics measured. Most patients expected to wait less than 30 min and were dissatisfied with their wait time and waiting experience.
Third, we reviewed the VSM and patient experience data with staff and solicited staff perspectives using online surveys and our ED's huddle board, a centrally located repository for quality improvement efforts and real‐time data tracking, as well as the site of our daily multidisciplinary huddle. All ED team members were invited to comment on their perceived barriers to efficient care in triage, including the following specific questions:
What makes a good/hard day in triage?
What do we have control over to change in triage?
What can we do better in triage?
What would improve the patient experience regarding triage?
What questions should we be asking?
We collected responses over 2 months and organized responses by themes, which were used to generate a preliminary list of improvement ideas. Improvement ideas were organized into a PICK chart in quadrants (ie, possible, implement, challenge, and kill) based on perceived ease of implementation and potential benefits. 21 The PICK chart was posted on the huddle board and staff voted on their favorite ideas using stickers for 2 weeks. Common themes for highly rated interventions are summarized in Figure 3.
FIGURE 3.
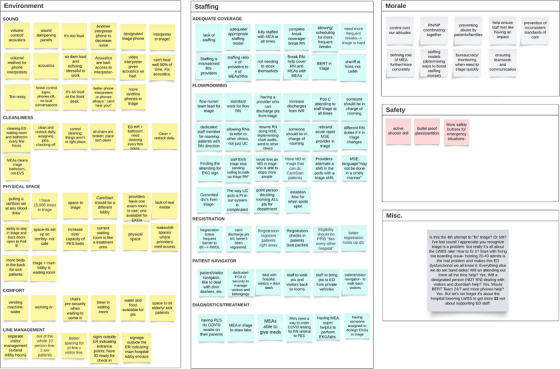
Thematic analysis of interventions proposed by frontline staff.
3.2. Phase II: Performance improvement event
The Triage Improvement Task Force planned and hosted 3‐day performance improvement event that confirmed support for proposed solutions, elevated multidisciplinary perspectives and encouraged empathy across roles, and defined standard work for new and updated triage roles (Supporting Information Appendix A3). This event included seven RNs, including a nursing union representative, three emergency physicians, one NP, three quality improvement staff members, and two executive sponsors.
3.2.1. Day 1 (perspective sharing)
The emphasis of day 1 was to build empathy, psychological safety, and an environment where people felt heard, in line with prior ED teamwork literature. 15 Exercises included forming empathy dyads, where participants across disciplines practiced humble inquiry to learn about each other's roles, observed each other's roles in triage, and reported out about each other's roles to the group during the event. Key takeaways from the empathy dyads included (1) all roles felt moral injury when sick patients wait too long or leave without being seen and (2) burnout rates were high across roles and participants expressed a high desire to participate in the workshop to improve patient experience.
3.2.2. Day 2 (defining roles)
After sharing and validating the VSM and proposed project ideas with highest support from frontline staff, the group worked collaboratively to define standard work for existing triage roles and to define the new roles of Triage Team Lead (TTL) and Patient Experience Specialist, which were highly rated interventions by frontline staff. These roles were then tested in several tabletop and walk‐through simulations with multiple different patient scenarios (including pediatric patients and patients presenting with chest pain or behavioral health concerns), which were used to adjust prototypes for standard work based on physical space and process constraints.
3.2.3. Day 3 (consistency and sustainability)
Day 3 focused on implementation and measuring success. We created a target sheet defining metrics for initiative success and a Kaizen Action Bulletin, listing each project with a designated project lead, associated action items, with due dates (Supporting Information Appendix A4). Primary outcomes included decreasing LWBS from 6.9% to 3% and improving patient rating of being “seen in a timely manner” (reported as percent of patients who answered “yes definitely”) 22 from 37.3 to 39.9 in 3 months following implementation. We also tracked rates of patients absent without leave (AWOL) and the number of patients discharged directly from triage as secondary metrics of triage improvement.
3.3. Phase III: Implementation
The new triage workflows, including the TTL role, were piloted starting on November 1, 2023. New standard work for existing roles were also implemented, including medical evaluation assistant (MEA) greeter, greeter RN, triage RN, medical screening evaluation NP or physician, and discharge NP or physician. Staff were encouraged to fill out a widely distributed survey at the end of every shift to evaluate staff experience and identify areas for improvement during the rollout. Updates to standard work were made based on feedback from the triage team during weekly meetings and were sequentially implemented as part of ongoing plan‐do‐study‐act (PDSA) cycles. The taskforce concurrently implemented multiple capital improvement projects including more interpreter phones, new sound panels, updated equipment, and improved desk ergonomics.
To increase frontline staff engagement after implementation, members of the triage task force completed daily check‐ins with frontline staff to validate standard work. We also disseminated daily huddle board announcements, weekly email updates, and a monthly summary communication from triage project leadership (Supporting Information Appendix A5). These one‐page documents included updated metrics on LWBS, AWOL, discharges from triage, and patient experience, as well as real‐time results of staff surveys and next steps for the project. The patient experience data were communicated via huddle board displays (Supporting Information Appendix A6).
4. EVALUATION
We evaluated the efficacy of our intervention using a mixed‐methods approach. We extracted total patient encounters, rates of LWBS/AWOL, patients discharged from triage, and boarding data from the electronic medical record. We defined the postimplementation period as the 3 months following implementation (November 2023–January 2024). We compared this period to two preimplementation periods: 3 months prior to implementation (August 2023–October 2023) and the same 3 months a year prior to control for seasonal trends (November 2022–January 2023). We used a two‐proportion Z‐test to evaluate for statistical significance, with a significance threshold of 0.05.
We extracted patient experience ratings on the survey question “I was seen in a timely manner” from our hospital's patient satisfaction survey. We assessed workshop participants’ satisfaction with the triage performance improvement process using an online survey, distributed by email (with one follow‐up reminder email) to all workshop participants via Qualtrics 23 in December 2023. A second survey was distributed to all ED providers who work in triage (with one follow‐up reminder email) to evaluate the efficacy of various interventions in addition to the after‐shift feedback forms.
5. RESULTS
5.1. LWBS and patient satisfaction
In the 3 months prior to implementation, we had 16,930 registered patient encounters with 1256 patients LWBS for an LWBS rate of 7.4% (Table 2). Following improvement effort implementation, the LWBS rate dropped to 5.4% (p < 0.001), with 934 patients LWBS in 17,271 encounters. In comparison, during the same 3‐month period 1 year prior (November 22–January 23), the LWBS rate was 9.2% with 1471 patients LWBS in 15,997 registered patient encounters.
TABLE 2.
Left without being seen (LWBS) prior to and following triage improvement project implementation.
| Registered encounters | LWBS | LWBS% | p‐value | |
|---|---|---|---|---|
| Pre‐implementation | ||||
| Nov. 22–Jan. 23 | 15,997 | 1471 | 9.2 | <0.001 |
| Aug. 23–Oct. 23 | 16,930 | 1256 | 7.4 | <0.001 |
| Post‐implementation | ||||
| Nov. 23–Jan. 24 | 17,271 | 934 | 5.4 | – |
Note: p‐Value compares preimplementation period to postimplementation period using a two‐proportion Z‐test, with a significance threshold of 0.05. LWBS designates patients who leave without being seen. LWBS% is the proportion of patients who leave without being seen relative to all registered encounters in a given time period.
Notably, this decrease in LWBS after implementation occurred during winter months which tend to see higher volumes of ED visits, 24 as well as with both higher patient volumes (Figure 4) and increased ED boarding compared to both preimplementation periods. Before implementation, we had less boarded patients per month on average, with 791 patients before (SD 12.4 patients) versus 837 patients after (SD 6.7 patients). We also had longer median boarding times after implementation, with 597 min before (interquartile range [IQR] 82 min) versus 711 min after (IQR 135 min).
FIGURE 4.
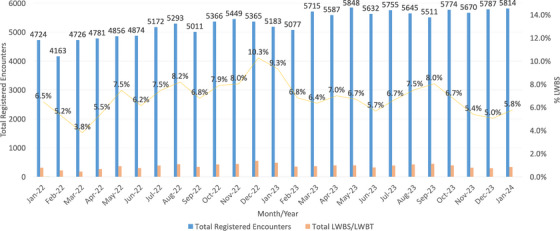
Total patient encounters and left without being seen (LWBS) rate by month, Jan. 2022–Jan. 2024.
Patient satisfaction scores for being seen in a timely manner did not change meaningfully compared to immediately prior to implementation (39.7% pre vs. 39.1% post). However, our patient experience scores are typically lower during winter months and were three percentage points higher after implementation than the same 3 months a year prior. Immediately prior to implementation (Oct. 2023), patient experience scores reached a low of 35.5 before improving during the implementation phase.
The percentage of AWOL patients increased from 5.1% in the 3 months before implementation to 6.0% after implementation. The year prior to implementation, we averaged 22 patients discharged from triage per day in Nov. 2022–Jan. 2023, which increased to 23.7 patients per day in the 3 months before implementation (Aug. 2023–Oct. 2023). After implementation, patients discharged from triage increased steadily, averaging 28.5 per day over the 3‐month period. This metric steadily increased during the implementation period from 25.9 patients per day in Nov. 2023, 28.9 in Dec. 2023, and 30.7 in Jan. 2024.
5.2. Staff satisfaction
Twelve participants in the performance improvement workshop responded to our survey, which represented 80% of the 15 workshop participants still employed at our hospital. Half of respondents (N = 6) were RNs. Other respondents included two attending physicians, one hospital executive, and three members of our hospital's Kaizen Promotion (quality improvement) Office.
The net‐promoter score for the workshop was 41.67, which is considered favorable (above 50 is excellent). 25 In general, workshop participants agreed on what constituted a hard or a good day in triage (Table 2). After the workshop, 100% of participants either strongly agreed or agreed that they were motivated to improve triage. Half of participants strongly agreed that the workshop led to improvements in triage, while 42% agreed with this statement (Figure 5).
FIGURE 5.
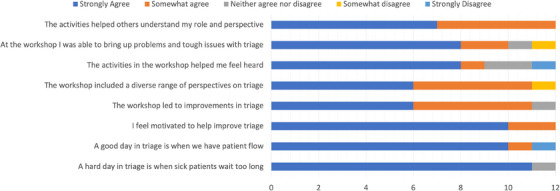
Survey results from triage improvement workshop participants (n = 12).
Qualitative comments on the postworkshop survey supported the quantitative results. Multiple participants commented on their ability to be heard and hear others during the workshop. Participants appreciated the opportunity to make direct observations of the triage process. Multiple participants provided constructive feedback to allow more time to conduct rapid PDSA cycles during the workshop and commented on the difficulty of not being able to address deeper root cause issues including boarding.
After implementation, 92 staff members working in triage responded to our all‐staff survey for a response rate of 47% of providers who work in triage. The majority of respondents were RNs (n = 56), accounting for 44% of all triage‐trained RNs. 47% of physicians (n = 26) and 100% of NPs (n = 10) responded. For improving staff experience, the most favorable intervention was developing and staffing the TTL role, with 43% of respondents rating this as the most impactful intervention. About 17% felt that having a physician in triage from 9 a.m. to 1 a.m. was the most impactful intervention, followed by 13% who felt that prioritizing staffing an MEA was the most impactful intervention. For improving patient flow, 56% rates the TTL most impactful, followed by 17% for physician in triage and 11% for staffing an MEA.
6. DISCUSSION
Our novel, frontline staff‐engaged quality improvement process resulted in significant decreases in LWBS rates alongside high rates of staff satisfaction with both process and outcomes. These improvements were seen even in the context of higher patient volumes and boarding compared to prior time periods. Our three‐day improvement workshop achieved its aim of promoting psychological safety and feeling heard among a diverse group of staff. Our postpandemic quality improvement blueprint retains the core features of traditional quality improvement but updates the process to optimize staff engagement to combat the high burden of burnout, which presents a barrier to process improvement.
Traditional quality improvement processes centers PDSA cycles, with the goal of beginning intervention early and experimenting with proposed ideas to improve upon a starting prototype. 26 , 27 While these methods have historically been effective in the ED when staff are engaged, 28 , 29 , 30 the COVID‐19 pandemic and postpandemic workforce constraints have presented barriers to traditional quality improvement including greater and novel operational challenges and increasing staff burnout.
We addressed these barriers in several key ways. First, our robust discovery period and solicitation of ideas from frontline staff led to interventions including standard work and the TTL role that ultimately ended up being highly supported by frontline staff after implementation. By broadening opportunities to participate in both generating and voting on ideas via the huddle board PICK chart, we ensured that the ideas prioritized in the performance improvement workshop would have a broad base of support during implementation. The asynchronous process ensured that perspectives from all shifts, including night shift, were represented.
Our performance improvement event emphasized activities that improved employee engagement in the quality improvement process, including showcasing a diverse range of perspectives on triage and creating space for staff to bring up difficult issues with triage. Postworkshop surveys showed high rates of satisfaction with these components of the workshop. We continued to build staff engagement through the implementation phase via regular email updates on project milestones and next steps. Prior literature has shown that employee engagement is associated with increased patient satisfaction 31 and even patient safety. 32 , 33 , 34 In the era of increased burnout and workforce attrition following the COVID‐19 pandemic, we found that extra emphasis on engagement helped support implementation and efficacy of our quality improvement project.
Our project has several limitations. First, we implemented multiple interventions simultaneously without employing a control group, so we cannot determine which intervention was the most impactful on LWBS rates or our other measured outcomes. However, the primary aim of our project was to validate the quality improvement process in the real‐world environment. Second, external factors including boarding impact wait times and LWBS rates. However, we saw improvements in LWBS rates even during a period of increased patient volumes and boarding compared to the prior year. Lastly, this was a single‐center project at an urban, academic, public hospital. While other institutions may face unique challenges, we provide our process and materials as a blueprint that can be adapted to a variety of acute care settings.
While traditional quality improvement methods have historically performed well in the ED, the systemic challenges of the COVID‐19 pandemic have directly impacted the efficacy of these processes. In an era of reduced ED capacity, we suggest that targeted adjustments of traditional quality improvement addressing are both beneficial and necessary to bring ED operations into a postpandemic equilibrium.
AUTHOR CONTRIBUTIONS
Conceptualization: Christopher R. Peabody, Hemal K. Kanzaria, and William Huen. Data collection: Christopher R. Peabody and Hemal K. Kanzaria. Data analysis: Christopher R. Peabody and Hope Schwartz. Critical review and evaluation of results: Hope Schwartz, Christopher R. Peabody, Hemal K. Kanzaria, and William Huen. Primary authorship of the paper: Hope Schwartz and Christopher R. Peabody. Review and editing of the paper: Hope Schwartz, William Huen, Hemal K. Kanzaria, and Christopher R. Peabody. Study supervision: Christopher R. Peabody, Hope Schwartz, and William Huen.
CONFLICT OF INTEREST STATEMENT
Christopher Peabody is a consultant for FujiFilm and SonoSite on unrelated projects. On work unrelated to the current submission, Dr. Kanzaria's salary is supported by a grant from the Benioff Homelessness and Housing Initiative, University of California, San Francisco, CA, and he works as an advisor for Amae Health, Inc. All other authors declare no conflicts of interest.
Supporting information
Supporting information
Supporting information
Supporting information
Supporting information
Supporting information
Supporting information
Supporting information
ACKNOWLEDGMENTS
The authors thank Jason J. Victoriano, MPH, Katherine Henaghan, MPH, and Christopher Ross, MSIE, for administrative and Kaizen event support.
Schwartz H, Huen W, Kanzaria HK, Peabody CR. Quality improvement in the era of boarding and burnout: A postpandemic blueprint. JACEP Open. 2024;5:e13234. 10.1002/emp2.13234
Supervising Editor: Adam Landman, MD, MS
REFERENCES
- 1. Lastinger LM, Alvarez CR, Kofman A, et al. Continued increases in the incidence of healthcare‐associated infection (HAI) during the second year of the coronavirus disease 2019 (COVID‐19) pandemic. Infect Control Hosp Epidemiol. 2023;44(6):997‐1001. doi: 10.1017/ice.2022.116 [DOI] [PMC free article] [PubMed] [Google Scholar]
- 2. Kelen GD, Wolfe R, D'Onofrio G, et al. Emergency department crowding: the canary in the health care system. Catal Non‐Issue Content. 2021;2(5). doi: 10.1056/CAT.21.0217 [DOI] [Google Scholar]
- 3. Kanzaria HK, Cooper RJ. The unspoken inequities of our boarding crisis. Ann Emerg Med. 2023;82(3):255‐257. doi: 10.1016/j.annemergmed.2023.02.004 [DOI] [PubMed] [Google Scholar]
- 4. Lucero A, Sokol K, Hyun J, et al. Worsening of emergency department length of stay during the COVID‐19 pandemic. J Am Coll Emerg Physicians Open. 2021;2(3):e12489. doi: 10.1002/emp2.12489 [DOI] [PMC free article] [PubMed] [Google Scholar]
- 5. Oskvarek JJ, Zocchi MS, Black BS, et al. Emergency department volume, severity, and crowding since the onset of the coronavirus disease 2019 pandemic. Ann Emerg Med. 2023;82:650‐660. doi: 10.1016/j.annemergmed.2023.07.024 [DOI] [PubMed] [Google Scholar]
- 6. Karalius VP, Kaskar SB, Levine DA, Darling TA, Loftus TM, McCarthy DM. Emergency department patient experiences during the COVID‐19 pandemic. J Patient Exp. 2021;8:23743735211033752. doi: 10.1177/23743735211033752 [DOI] [PMC free article] [PubMed] [Google Scholar]
- 7. Stark N, Kerrissey M, Grade M, Berrean B, Peabody C. Streamlining care in crisis: rapid creation and implementation of a digital support tool for COVID‐19. West J Emerg Med. 2020;21:1095‐1101. doi: 10.5811/westjem.2020.7.48537 [DOI] [PMC free article] [PubMed] [Google Scholar]
- 8. Oesterreich S, Cywinski JB, Elo B, Geube M, Mathur P. Quality improvement during the COVID‐19 pandemic. Cleve Clin J Med. 2020. doi: 10.3949/ccjm.87a.ccc041 [DOI] [PubMed] [Google Scholar]
- 9. Ortíz‐Barrios MA, Coba‐Blanco DM, Alfaro‐Saíz JJ, Stand‐González D. Process improvement approaches for increasing the response of emergency departments against the COVID‐19 pandemic: a systematic review. Int J Environ Res Public Health. 2021;18(16):8814. doi: 10.3390/ijerph18168814 [DOI] [PMC free article] [PubMed] [Google Scholar]
- 10. Al‐Shareef AS, Al Jabarti A, Babkair KA, Jamajom M, Bakhsh A, Aga SS. Strategies to improve patient flow in the emergency department during the COVID‐19 pandemic: a narrative review of our experience. Emerg Med Int. 2022;2022:e2715647. doi: 10.1155/2022/2715647 [DOI] [Google Scholar]
- 11. Mondoux S, Thull‐Freedman J, Dowling S, et al. Quality improvement in the time of coronavirus disease 2019 – a change strategy well suited to pandemic response. Cjem. 2020;22:422‐425. doi: 10.1017/cem.2020.386 [DOI] [PMC free article] [PubMed] [Google Scholar]
- 12. Schmitz GR, Viccellio P, Litvak E. Emergency department crowding after coronavirus disease 2019: time to change the hospital paradigm. Ann Emerg Med. 2023;82:301‐312. doi: 10.1016/j.annemergmed.2023.08.008 [DOI] [PubMed] [Google Scholar]
- 13. Gettel CJ, Courtney DM, Bennett CL, Keim SM, Camargo CA, Venkatesh AK. Attrition from the US emergency medicine workforce during early stages of the COVID‐19 pandemic. Ann Emerg Med. 2023;82:234‐236.doi: 10.1016/j.annemergmed.2023.03.002 [DOI] [PMC free article] [PubMed] [Google Scholar]
- 14. Petrino R, Riesgo LGC, Yilmaz B. Burnout in emergency medicine professionals after 2 years of the COVID‐19 pandemic: a threat to the healthcare system? Eur J Emerg Med. 2022;29(4):279‐284. doi: 10.1097/MEJ.0000000000000952 [DOI] [PMC free article] [PubMed] [Google Scholar]
- 15. Kerrissey MJ, Hayirli TC, Bhanja A, Stark N, Hardy J, Peabody CR. How psychological safety and feeling heard relate to burnout and adaptation amid uncertainty. Health Care Manage Rev. 2022;47(4):308. doi: 10.1097/HMR.0000000000000338 [DOI] [PMC free article] [PubMed] [Google Scholar]
- 16. Nyce A, Gandhi S, Freeze B, et al. Association of emergency department waiting times with patient experience in admitted and discharged patients. J Patient Exp. 2021;8:23743735211011404. doi: 10.1177/23743735211011404 [DOI] [PMC free article] [PubMed] [Google Scholar]
- 17. Rowe BH, Channan P, Bullard M, et al. Characteristics of patients who leave emergency departments without being seen. Acad Emerg Med Off J Soc Acad Emerg Med. 2006;13(8):848‐852. doi: 10.1197/j.aem.2006.01.028 [DOI] [PubMed] [Google Scholar]
- 18. Shaikh SB, Jerrard DA, Witting MD, Winters ME, Brodeur MN. How long are patients willing to wait in the emergency department before leaving without being seen? West J Emerg Med. 2012;13(6):463‐467. doi: 10.5811/westjem.2012.3.6895 [DOI] [PMC free article] [PubMed] [Google Scholar]
- 19. Janke AT, Melnick ER, Venkatesh AK. Monthly rates of patients who left before accessing care in US emergency departments, 2017‐2021. JAMA Netw Open. 2022;5(9):e2233708. doi: 10.1001/jamanetworkopen.2022.33708 [DOI] [PMC free article] [PubMed] [Google Scholar]
- 20. Sherman PJ. Understanding Kaizen events. ASCM Insights. Accessed October 24, 2023. https://www.ascm.org/ascm‐insights/understanding‐kaizen‐events/
- 21. PHF . Quality improvement tools for strategy and strategic planning. Accessed February 13, 2024. https://www.phf.org/programs/QItools/Pages/Quality_Improvement_Strategy_and_Strategic_Planning.aspx
- 22. AHRQ . CAHPS emergency department survey. Accessed February 13, 2024. https://www.ahrq.gov/cahps/surveys‐guidance/ed‐cahps/index.html
- 23. Qualtrics. 2005. https://www.qualtrics.com/
- 24. Anesi GL, Xiong RA, Delgado MK. Frequency and trends of pre‐pandemic surge periods in U.S. emergency departments, 2006–2019. Crit Care Explor. 2023;5(8):e0954. doi: 10.1097/CCE.0000000000000954 [DOI] [PMC free article] [PubMed] [Google Scholar]
- 25. Qualtrics . What is a good net promoter score (NPS)?. Accessed June 2, 2023. https://www.qualtrics.com/experience‐management/customer/good‐net‐promoter‐score/
- 26. Nicolay CR, Purkayastha S, Greenhalgh A, et al. Systematic review of the application of quality improvement methodologies from the manufacturing industry to surgical healthcare. Br J Surg. 2012;99(3):324‐335. doi: 10.1002/bjs.7803 [DOI] [PubMed] [Google Scholar]
- 27. Chan AKM, Rudolph JW, Lau VNM, et al. Rapid cycle system improvement for COVID‐19 readiness: integrating deliberate practice, psychological safety and vicarious learning. BMJ Simul Technol Enhanc Learn. 2020;7(4):199‐206. doi: 10.1136/bmjstel-2020-000635 [DOI] [PMC free article] [PubMed] [Google Scholar]
- 28. Lukas CV, Holmes SK, Cohen AB, et al. Transformational change in health care systems: an organizational model. Health Care Manage Rev. 2007;32(4):309‐320. doi: 10.1097/01.HMR.0000296785.29718.5d [DOI] [PubMed] [Google Scholar]
- 29. Dickson EW, Anguelov Z, Vetterick D, Eller A, Singh S. Use of lean in the emergency department: a case series of 4 hospitals. Ann Emerg Med. 2009;54(4):504‐510. doi: 10.1016/j.annemergmed.2009.03.024 [DOI] [PubMed] [Google Scholar]
- 30. Holden RJ. Lean thinking in emergency departments: a critical review. Ann Emerg Med. 2011;57(3):265‐278. doi: 10.1016/j.annemergmed.2010.08.001 [DOI] [PMC free article] [PubMed] [Google Scholar]
- 31. Buhlman NW, Lee TH. When patient experience and employee engagement both improve, hospitals’ ratings and profits climb. Harv Bus Rev. 2019. Accessed February 7, 2024. https://hbr.org/2019/05/when‐patient‐experience‐and‐employee‐engagement‐both‐improve‐hospitals‐ratings‐and‐profits‐climb [Google Scholar]
- 32. Kang R, Kunkel ST, Columbo JA, Goodney PP, Wong SL. Association of hospital employee satisfaction with patient safety and satisfaction within veterans affairs medical centers. Am J Med. 2019;132(4):530‐534.e1. doi: 10.1016/j.amjmed.2018.11.031 [DOI] [PubMed] [Google Scholar]
- 33. Janes G, Mills T, Budworth L, Johnson J, Lawton R. The association between health care staff engagement and patient safety outcomes: a systematic review and meta‐analysis. J Patient Saf. 2021;17(3):207. doi: 10.1097/PTS.0000000000000807 [DOI] [PMC free article] [PubMed] [Google Scholar]
- 34. Scott G, Hogden A, Taylor R, Mauldon E. Exploring the impact of employee engagement and patient safety. Int J Qual Health Care. 2022;34(3):mzac059. doi: 10.1093/intqhc/mzac059 [DOI] [PMC free article] [PubMed] [Google Scholar]
Associated Data
This section collects any data citations, data availability statements, or supplementary materials included in this article.
Supplementary Materials
Supporting information
Supporting information
Supporting information
Supporting information
Supporting information
Supporting information
Supporting information