

Summary
Bromodomain protein BRD4 binds to acetylated histones to regulate transcription. BRD4 also drives cancer cell proliferation. However, the role of BRD4 in normal cell growth has remained unclear. Here, we investigated this question by using mouse embryonic fibroblasts with conditional Brd4 knockout (KO). We found that Brd4KO cells grow more slowly than wild type cells; they do not complete replication, fail to achieve mitosis, and exhibit extensive DNA damage throughout all cell cycle stages. BRD4 was required for expression of more than 450 cell cycle genes including genes encoding core histones and centromere/kinetochore proteins that are critical for genome replication and chromosomal segregation. Moreover, we show that many genes controlling R-loop formation and DNA damage response (DDR) require BRD4 for expression. Finally, BRD4 constitutively occupied genes controlling R-loop, DDR and cell cycle progression. In summary, BRD4 epigenetically marks above genes and serves as a master regulator of normal cell growth.
Subject areas: Natural sciences, Biological sciences, Biochemistry, Cell biology, Cancer
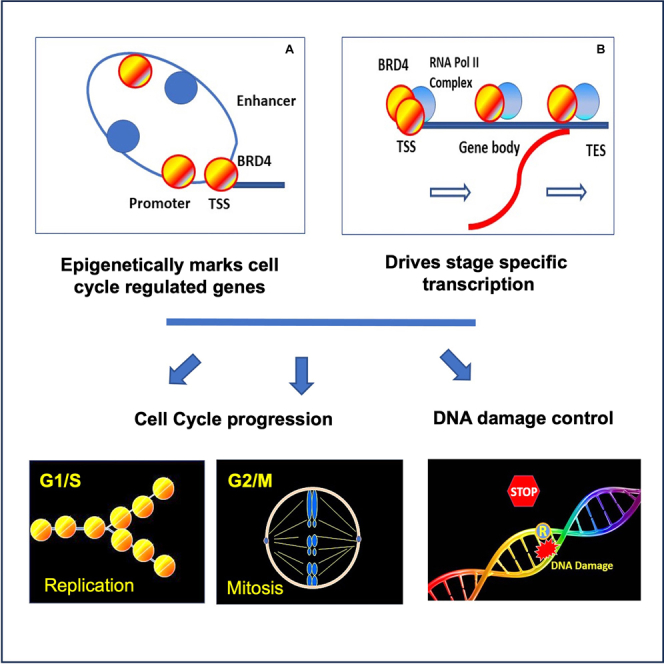
Graphical abstract
Highlights
-
•
BRD4 constitutively occupies cell cycle/DDR genes as epigenetic marks on these genes
-
•
BRD4 contributes to target gene transcription as part of RNA pol II elongation complex
-
•
BRD4 orchestrates cell cycle progression by integrating R-loop and DDR regulation
-
•
Thus, BRD4 ensures genome integrity and healthy cell renewal
Natural sciences; Biological sciences; Biochemistry; Cell biology; Cancer
Introduction
BRD4 is a BET family bromodomain protein, expressed in most cells.1,2 It binds to acetylated histones through the two bromodomains.3,4 BRD4 also binds to P-TEFb, RNA polymerase II, mediators, and others to stimulate transcriptional elongation of numerous genes.4,5,6,7 It was reported that BRD4 acts as a kinase and histone acetylase.8 BRD4 broadly occupies intra- and intergenic regions of the genome. It binds on expressed genes with a peak binding at/near the transcription start site (TSS), although it also binds to enhancers, often found distant from the genic region.4,9,10,11,12,13 BRD4 is essential for embryonic development, and Brd4 knockout (KO) is early embryonic lethal.14,15 BRD4 facilitates proliferation of many cancer cells.16 Small molecule inhibitors (BETi) arrest cancer growth by blocking interaction of BRD4 with acetylated histones.7,11,17 BETi are thought to be attractive anti-cancer drugs, as they are reported to disrupt oncogene enhancers, but have only a minor effect on normal cell growth.18,19,20 More recently developed PROTAC-based BRD4 inhibitors are also reported to inhibit cancer growth.21 Despite the importance for oncology research, the question of whether BRD4 affects growth of normal cells has remained elusive. We undertook this study since growing evidence points to a pivotal role of BRD4 in cell cycle progression of non-oncogenic cells.8,13,22
DNA replication and mitosis are two fundamental events in the cell cycle, which are directed by sequential transcription of more than 1,000 genes.23 E2F family of transcription factors are central to G1 to S transition.23,24 FOXM1 is another transcription factor that directs S to G2 transition and G2/M progression.23,25,26 ATR and ATM, previously known to control DNA damage,27 are more recently shown to control G2/M stage of cell cycle.28,29 ATR activated at the end of replication helps ensures S phase completion and at mitosis it binds to centromere enabling proper chromosomal segregation.28,29
Recent reports on in vitro cancer cell models demonstrated that BET and BRD4 inhibitors increase R-loop formation and DNA damage leading to cancer growth arrest.30,31,32 BET inhibitors are thus being tested in clinics.33,34 However, mechanisms by which BRD4 regulate R-loop formation and DNA damage have remained inconclusive. Even more importantly, it has been unclear whether BRD4 depletion causes growth inhibition in non-cancerous cells.
We examined mouse embryonic fibroblast in which Brd4 was conditionally knocked out to determine the role of BRD4 in cell cycle passage and DNA damage. We found that Brd4KO cells were unable to complete replication and failed to execute mitosis. BRD4 inhibitors led to a similar inhibition in human diploid cells. Moreover, Brd4KO cells incurred extensive DNA damage and increased R-loop formation as evidenced by increased γH2AX foci, comet tails and nuclear S9.6 signals, observed at all stages of cell cycle in Brd4KO cells. Transcriptome analysis found that Brd4KO cells are impaired in expressing many previously known cell cycle genes and histone genes required for replication, and genes necessary for mitosis. Further, Brd4KO cells were defective in expressing genes involved in R-loop regulation and DNA damage control, including RnaseH1, RnaseH2, Top1, Top2, Topbp1, Atr, Atm, H2ax, as well as p53 and p21. Lastly, ChIP-seq analysis found that BRD4 occupied numerous cell cycle genes as well as genes controlling R-loop formation and DNA damage response (DDR) throughout the entire cell cycle as detected on the promoter, TSS and gene body. Together our work demonstrates that BRD4 epigenetically marks genes controlling R-loop formation and DDR along with many cell cycle genes and ensures ordered cell cycle events and the maintenance of genome integrity.
Results
Brd4 deletion impedes cell cycle progression
To assess the role of BRD4 in cell cycle control, we examined mouse embryonic fibroblasts in which Brd4 was conditionally deleted upon tamoxifen (TMX) treatment (Figures S1A–S1C).13 Growth curve analysis showed that Brd4KO cells grew much more slowly than WT cells during 12 days of culture, and total cell recovery rate of Brd4KO cells was about 1% of WT cells (Figure 1A). To determine the reason for this growth defect, cells were synchronized at G0 by serum starvation for 72 hours (h), and cell cycle progression was monitored by propidium iodide staining after released by serum addition (Figure 1B). Flow cytometry analysis showed that WT cells, upon exiting G0, evidently proceeded through G1, reaching S at 12–16 h and G2/M at 20 h. By 24 h, the majority of WT cells finished one cell cycle, and returned to G1 (Figure 1C). In contrast, Brd4KO cells were delayed in S entry (16 h), then progressed very slowly, leaving many cells at S phase even at 24 h and beyond without reenter G1 (Figures 1C and S1D). The results indicate that Brd4KO cells are defective in G1/S transition,22 but also in S-G2/M passage.
Figure 1.

Brd4 deletion and a BET inhibitor impede cell cycle progression
(A) Cell growth curve. WT and Brd4KO cells (5 × 10⁵) seeded in a 10-mL plate were successively passed, and cell numbers were counted on indicated days. Values are the mean of three biologically separate experiments +/− S.D.
(B) The experimental scheme. WT and Brd4KO cells were serum starved for 72 h, released, and allowed to proceed for 24 h (Figure S1D). Flow cytometry profiles of PI staining are shown.
(C) Cells were stained with propidium iodide (25 μg/mL), and DNA contents were determined by flow cytometry. Arrows indicate Sub-2N particles.
(D) S phase progression after double thymidine block. WT and Brd4KO cells were treated with thymidine (200 μg/mL) twice, released, allowed to proceed up to 6 h, and then PI-stained cells were analyzed by flow cytometry (Figure S1D). Quantification of S phase cells (the percentage) at each time point is shown. The numbers are the average of three biological repeats. Significance was calculated using unpaired t test (∗∗∗p < 0.0001; ∗∗p < 0.001; ∗p < 0.01).
(E) WT cells were synchronized by serum starvation for 72 h and released. JQ1 (0.5 μg) or DMSO (control) was added at time 0. Flow cytometry profiles of PI-stained cells at indicated time are shown.
(F) WT cells were synchronized by serum starvation for 72 h and released as above, and ARV-825 (1.0μM) or DMSO (control) was added at time 0. Flow cytometry profiles of PI-stained cells are shown.
(G) Growth curve analyses of WI38 cells. WI38 cells treated with 0.5μM of JQ1 or DMSO. (left), 0.5μM ARV-825 or DMSO (right) were successively passed, and cell numbers were counted on indicated days. Fold changes are the mean of three biologically separate experiments +/− S.D.
(H) Cell cycle progression of WI38 cells. WI38 cells were treated with 0.5μM of JQ1 (left) and ARV-825 (right), were stained with PI (25 μg/ml) and DNA contents were determined by flow cytometry (Figures S1K and S1L). Quantification of G1, S and G2 phase cells are shown as the percentage. The numbers are the average of three biological repeats. (Student’s t test ∗∗p < 0.01).
To determine the impact of BRD4 deletion on the progression through S phase, we synchronized cells by thymidine double block at late G1 and early G1/S transition,35 and monitored progression with flow cytometry analysis. The counts of WT cells in S phase peaked at 0–3 h, and G2 cells reached maximum at 6 h (Figures 1D and S1E). In contrast, S phase progression is significantly blocked (Figure 1D) in Brd4KO cells, as there was very little change in G1 and G2 cell counts from 0 h to 6 h (Figure S1E). These data indicate that Brd4KO cells fail to move through and complete S phase, presumably due to defective replication. Indeed, BrdU incorporation was markedly lower in Brd4KO cells than in WT cells (Figures S1F and S1G). Thus, Brd4KO cells were deficient in DNA replication/genome duplication.
We also investigated the effect of JQ1 (a BETi) and ARV-825 (a BRD4 PROTAC inhibitor) on cell cycle progression of WT cells after release from serum starvation (Figures 1E and 1F). JQ1 and PROTAC inhibitor led to the loss of BRD4 and caused clear defects in S phase progression, resulting in a dramatic reduction in S phase cells (Figures S1I and S1J). Brd4KO cell population also contained more sub-2N particles than WT cells (arrows in Figure 1C), indicating increased apoptosis. Indeed, Annexin V staining revealed higher rate of apoptotic cells among Brd4KO cells than among WT cells (Figures S1H and 7B right panel for additional immunoblotting for apoptosis genes).
Figure 7.

BRD4 directs transcription of genes controlling R-loop and DDR
(A) qRT-PCR analyses of R-loop and DDR genes. Transcript expression of R-loop genes (RNASEH1, RNASEH2b, RNASEH2C, Top1, Top3b and Topbp1 on left); DDR genes (H2ax, p53, p21, Parp1 Setx and Rpa3 on right) in WT and Brd4KO cells synchronized were tested by qRT-PCR. Blue line for WT and red line for Brd4KO cells.
(B) Immunoblot detection of R-loop and DDR genes. WT and Brd4KO cells synchronized by serum starvation, released and allowed to proceed for indicated times. Nuclear extracts (20 μg) were separated on 4–12% NuPAGE gel and blotted with antibodies indicated on the left. Left and right panels represent antibodies for R-loop and DDR proteins, respectively.
(C) IGV profiles of BRD4 occupancy (top) and RNA-seq peaks (middle and bottom) for Rnaseh1, Top1, H2afx and p53 genes in WT and Brd4KO cells. Gene names and the exon-intron organization are shown on the top and bottom, respectively.
To ascertain whether BRD4 is important for the growth of not just mouse cells, but normal human cells, we examined the effect of a BETi, JQ1 and BRD4 PROTAC inhibitor ARV-825 on WI38 cells, a human primary diploid cell line.36,37 In the absence of inhibitor, WI38 cells grew logarithmically during 6–8 days of culture (Figure 1G). In the presence of JQ1 or ARV-825, WI38 cells ceased to grow on day 2, and did not increase cell number for the remaining duration of culture. PI staining profiles indicated a reduction of cycling cells after treatment with JQ1 and ARV825 (Figures 1H, S1K and S1L). Immunostaining of ARV835 treated cells confirmed depletion of BRD4 (Figures S1M and S1N). Thus, BRD4 is required for proliferations of normal noncancerous mouse and human cells.
BRD4 is essential for proper expression of genes important for cell cycle progression
To identify cell cycle genes regulated by BRD4, we performed RNA-seq analysis of WT and Brd4KO cells synchronized by serum starvation (G0) and at various times after release from serum starvation (Figure S2A). In WT cells, there were 2,860 genes showing FC > 2 with p-value <0.05 relative to cells at 0 h. We designated these genes as cell cycle regulated genes (Figure 2A; Table S1). These genes were then classified into G0, G1, S, G2 and M specific genes according to the time of expression and the published classification (Figure 2B; Heatmap and GO analysis in Figures S2B and S2C).23 Supporting our designation, 751 of the 2,860 genes were previously assigned as cell cycle genes in human cells (Figure 2C).23 We found that 2,166 genes were differentially expressed in Brd4KO cells (Figure S2D; Table S2), and that 564 genes were cell cycle genes (Figure 2D). Of these 564 genes, 455 were significantly downregulated in Brd4KO cells, indicating that these genes required BRD4 for proper expression (Figure 2E). These genes were expressed in a stage specific manner, either at G0, G1, S, or G2-M, signifying that BRD4 is required at each cell cycle stage (Figure 2F; Table S3). Many of the S and G2/M genes downregulated in Brd4KO cells are well known for their roles in DNA replication and mitosis (see the list on Figure 2F). For example, genes involved in DNA replication such as Mcms, Orcs, and some E2Fs were downregulated in Brd4KO cells (Figures 2F and S2E). It is worth noting that the expression of a master proliferation-associated transcription factor, FoxM1,23,38 was lower in Brd4KO cells (Figures S2B and S2E). G2 and M genes which were downregulated in Brd4KO cells also included cyclins and kinases that signal entry into and completion of mitosis, e.g., Cdc20, Cdc25b, Cdk1, Cdk2, Ccnb1, Aurka, b, and Plk1 (Figures 2F and S2E). In GO analysis, Brd4 dependent genes showed the greatest functional association with mitotic events (Figure 2G). Together, these results illustrate the necessity of BRD4 for S and G2/M progression, an aspect not fully appreciated before.
Figure 2.

RNA-seq identification of BRD4 dependent cell cycle genes
(A) Volcano plot identifying cell cycle regulated genes in WT cells. The Y axis represents -log10 p Values and the X axis fold changes (log2 fold change). 2,860 genes (FC > 2, p value < 0.05) between 0,4, 8, 12,16, 20 and 24 h were designated as cell cycle regulated genes. Peak expression of each gene was assigned based on peak correlation to the idealized phase expression profiles (Figure S2B).
(B) Pie chart showing the number of cell cycle genes expressed at G0, G1, S and G2/M.
(C) Venn diagram showing the relationship between cell cycle-regulated genes (3669) in four human cancer cell lines (in U2OS, HeLa cells, Foreskin fibroblasts and HaCaT cells)20 and cell cycle regulated genes in mouse (2860).
(D) Venn diagram showing the relation between cell cycle regulated genes and BRD4 regulated genes. 564 genes (in the overlapped area) represent cell cycle regulated genes that are also regulated by BRD4.
(E) Boxplots representing expression ranges of each gene in WT (Blue) and Brd4KO cells (red) at each time point with p value <0.0001 by two-way ANOVA analysis. Of 564 BRD4 regulated genes, 455 genes were reduced in Brd4KO cells, while 109 genes were increased in expression.
(F) Heatmap representation of Brd4 dependent cell cycle genes. Genes are grouped according to the cell cycle stages. The number in parentheses indicates the number of genes downregulated in Brd4KO cells for each stage. Names of representative cell cycle genes are shown.
(G) GO analysis of BRD4 dependent cell cycle genes. GO terms showing the highest p-values are shown. The number of the genes identified in this study vs. total gene numbers in the category are shown on the right.
Brd4KO reduces histone expression at S phase and hampers induction of G2/M master regulators
RNA-seq analysis showed that transcription of as many as 52 of the 86 core histone genes was downregulated in Brd4KO cells (Heatmap in Figure S2E). These genes are mapped to the core histone gene clusters 1 and 2, transcribed along with DNA replication during S phase. The striking reduction in histone gene transcription in Brd4KO cells39 (Figure S2E) prompted us to examine histone protein levels in synchronized Brd4KO cells. Histones were acid extracted and subjected to SDS PAGE analysis (Figure 3A). Quantification showed that the amount of H2A, H2B/H3, and H4 increased about 2-fold in WT cells after S phase as would be expected, but little or no increase was observed for any of the histones in Brd4KO cells (Figure 3B). Furthermore, genes encoding centromere/kinetochore proteins CenpA, CenpE, CenpN and CenpF and Kinesin family proteins (Kifs,40) (Figures 2F, 2E, and S2E) were also downregulated in Brd4KO cells (Figure 3C). The RNA-seq data were further confirmed by qRT-PCR (Figure S3A), and protein levels were determined by western blotting analysis (Figure S3B). Thus, consistent with an obligatory doubling of core histones and centromere/kinetochore components for successful genome duplication, we observed the reduction in BrdU incorporation in Brd4KO cells (Figure S1G), which correlated to the reduced expression of core histones. The reduced expression of core histone and centromere/kinetochore genes may lead to the arrest and/or defects of the cell cycle.
Figure 3.

Protein levels for Histones, FOXM1 and ATR/ATM are reduced in Brd4KO cells
(A) Acid extracted histone (2 μg) preparations were separated on 12% NuPAGE gel and stained with SYPRO Orange. GST-H4 was added in histone extracts to be used as loading control.
(B) Core histones were normalized against GST-H4, quantified by the ChemiDoc MP Imaging System.
(C–E) Immunoblot analyses of proteins for G2/M passage, ATR-CHK1 pathway and ATM-CHK2 pathway in synchronized WT and Brd4KO cells. β-ACTIN was used as a loading control.
We also confirmed protein levels of major G2/M genes such as FOXM1, ATR and ATM, since their transcript levels were reduced in Brd4KO cells. As shown in Figure 3C, the amount of FOXM1 was lower in Brd4KO cells throughout the cell cycle (Figure S3B). In addition, the levels of PLK1, CENP-F, and CENP-A, downstream targets of FOXM1, required for ordered mitotic processes were lower in Brd4KO cells than in WT cells. As shown in Immunoblot data in Figures 3D and 3E, the amounts of ATR and ATM, and the downstream kinases, CHK1, CHK2, CDK1 and CDK2 were also lower in Brd4KO cells, consistent with the lower transcript levels (Immunoblot images of whole gels in Figure S8). We noted that despite reduced protein expression of ATR, the amount of phosphorylated ATR was higher in Brd4KO cells than WT cells, however, we did not observe a clear difference in phospho-ATM levels (Figures 3E and S3B). These results provide the first suggestive evidence for DNA damage in Brd4KO cells (Figures 3D and S3B). In conclusion, BRD4 is essential for proper expression of genes important for genome replication and chromosome segregation.
BRD4 constitutively marks genes regulating cell cycle and genome stability
BRD4 has been shown to distribute broadly over the mouse and human genome, and within the genic regions including promoters, exons and introns, and the occupancy correlates with active gene expression.13,41,42,43 Here, we performed ChIP-seq analysis of synchronized cells to examine genome-wide BRD4 distribution at each stage of the cell cycle. The overall BRD4 binding increased in cells exiting G0 and entering G1 (8 h) and peaked at S (16 h) followed by a slight decline at G2/M (20 h) (Figure 4A).
Figure 4.

BRD4 constitutively marks cell cycle genes with the peak occupancy at S phase
(A) Pie charts depicting genome-wide distribution of BRD4 binding at G0, G1, S and G2/M (0 h, 8 h, 16 h, 20 h). The numbers below indicate the total peak counts at each stage. BRD4 distribution over the promoter (blue), genic (pink+ red) and distal intergenic regions (green) are shown. Note the highest peak counts at S (16 h).
(B) Top, heat maps, BRD4 binding on cell cycle regulated genes are plotted over the TSS, gene body, TES +/− 5 kb at indicated cell cycle stage. Genes are aligned according to BRD4 signal intensity (high to low), with Cluster 1 (C1) showing the highest BRD4 signals, while C4 the lowest. The numbers of genes belonging to each cluster are shown on the left. Bottom, average BRD4 distributions. Note the highest BRD4 signals at S phase.
(C) Metascape based pathway analysis for Cluster1 to Cluster 3 genes (Figure 4B). The network of enriched terms is color-coded by cluster ID, where nodes that share the same cluster ID are typically close to each other (top) and colored by p-value, where terms containing more genes tend to have a more significant p-value (Bottom).
(D) IGV profiles of BRD4 occupancy (top) and RNA-seq peaks (middle and bottom) for select cell cycle genes in WT and Brd4KO cells. Gene names and the exon-intron organization are shown below.
We then examined BRD4 occupancy on the 2,191 cell cycle genes as defined by RNA-seq data. The heat maps in Figure 4B depict BRD4 occupancy over the promoter, transcription start site (TSS), gene body and the transcription end site (TES) and the flanking 5Kb regions. As shown in Figure 4B, cell cycle genes occupied by BRD4 were aligned according to BRD4 signal intensity, from the highest to the lowest (from top to bottom). These genes were divided into four clusters (C1 to C4). C1, with the highest BRD4 signals, contained 61 genes. C2, C3 and C4 contained 486, 1037 and 600 genes, respectively (see Table S4 for gene lists in each cluster). The average BRD4 binding profile for each cluster is shown at the lower panel of Figure 4B. In each cluster, BRD4 binding was the highest at the promoter/TSS region, and trailed over the gene body, similar to the binding profile seen with other genes in other cells.11,13 Although BRD4 bound to both cell cycle and non-cell cycle genes, binding intensity was significantly higher on cell cycle genes than on non-cell cycle genes (Figure S4A). It was interesting that the pattern of BRD4 binding was similar throughout all cell cycle stages, also seen when peak BRD4 binding was plotted at the center (Figure S4B). These results indicate that BRD4 binds to cell cycle genes at all stages, even though the expression of these genes is stage specific. Metascape-based GO analysis of genes in C1 through C3 revealed enrichment with the terms such as cell cycle, cell cycle transition, and DNA replication (Figure 4C). To verify constitutive BRD4 occupancy on cell cycle genes, we plotted BRD4 binding on G0, G1, S and G2/M specific genes identified in Figure 2F separately and observed again constant BRD4 binding to those genes throughout cell cycle (Figure S4C). Interestingly, S phase genes displayed the highest BRD4 intensity, while G0 genes were the lowest. Genome views of genes showing constitutive BRD4 binding but stage specific RNA expression is presented in Figures 4D and S4D. Genes representing G1 (Rgs2, Ddit4), S (7 histone genes, Chek1) and S-G2 (FoxM1, Aurkb, Cdk1, Ccnb1) are shown for BRD4 binding (Top) and RNA expression in WT (Middle, blue) and in Brd4KO cells (Bottom, Red). These genes were always bound by BRD4, although binding intensity varied at different stages, likely reflecting BRD4’s participation in transcription elongation. Taken together, BRD4 binds numerous cell cycle genes throughout the entire cell cycle but directs stage specific transcription. We later found that BRD4 also constitutively occupied genes that regulate R-loop formation and DDR and was required for their RNA expression (described below, see Figures 7C and S7B).
Brd4KO cells are defective in mitotic entry and undergo mitotic failure
The above genome-wide analyses showed that BRD4 is critical for proper regulation of S and G2/M genes. To further investigate cell cycle progression of Brd4KO cells, we performed live cell imaging of cells expressing a GFP-tagged histone H3.1. Images of asynchronous cell population revealed many healthy mitotic cells in WT culture (Figures 5A and S5D video, left panel, top). In contrast, cells with large nuclei, presumably at late S phase dominated Brd4KO culture, with very few mitotic cells. Some of the Brd4KO cells accompanied small, micronucleus-like structures (Figures 5A and S5D left pane, middle and bottom.).44,45 Consistent with these images, PI staining profiles of asynchronous cells showed that aberrant G1, S and G2/M distribution in Brd4KO cells (Figure S5A). To further ascertain whether Brd4KO cells are unable to pass through G2/M, we performed nocodazole block experiments. Nocodazole inhibits microtubule polymerization and arrests cells at prometaphase where chromosomes begin to line up at the mitotic plate.46 Asynchronously growing WT and Brd4KO cells were treated with nocodazole for 8 h, and prometaphase arrested cells were identified by DNA stain (arrows in Figure 5B). Whereas a large fraction of WT cells was arrested by Nocodazole, very few Brd4KO cells displayed mitotic arrest (Figure 5B, on the right). Flow cytometry profiles showed that nocodazole treatment led to accumulation of 4N cells in WT cells, but many Brd4KO cells remained in mid to late S, indicating the inability of Brd4KO cells to reach prometaphase (Figure S5B). Consistent with these results, other mitotic inhibitors, (+)-S-trityl-L- cysteine (STLC) and MG132, did not bring Brd4KO cells to 4N47,48 (Figures S5B and S5C). To further corroborate defective mitotic entry, we immuno-stained nocodazole treated WT and Brd4KO cells with antibody for H3pS10, a marker of chromosome condensation and mitosis.49 Brd4KO or ARV-825 treated WT cell populations contained fewer H3pS10-positve cells with condensed chromosomes (Figure 5C at bottom). Immunoblot analyses of cells synchronized by serum starvation showed a marked increase in H3pS10 signals in WT cells after 16 h consistent with the timing of mitotic entry, whereas H3pS10 signals remained low at all stages in Brd4KO cells (Figure 5D).
Figure 5.

Live cell imaging reveals catastrophic mitotic failure with chromosomal mis-segregation in Brd4KO cells
(A) Representative snapshots of live WT and Brd4KO cells expressing H3.1-GFP. Arrows Indicate large, morphologically unusual cells. Scale bar = 50μm. Percentages of cells with unusual morphology were quantified from 9 separate fields from WT and Brd4KO cells, respectively (left), quantification of cells with aberrant morphology. N indicates the number of cells counted (right).
(B) Nocodazole induced mitotic arrest. Asynchronous WT and Brd4KO cells were treated with Nocodazole (100 ng/ml) or DMSO (control) for 8 h, stained with Hoechst 33342, and viewed on confocal microscopy. Scale bar = 10μm. Mitotically arrested cells are marked by arrow (left). Quantification of mitotically arrested cells (%). N indicates the number of cells counted (right).
(C) Immunostaining of H3pS10 in mitotic cells. Nocodazole (50 ng/ml) arrested WT, Brd4KO cells and ARV-825 treated WT cells, were immuno-stained with H3pS10 antibody. Mitotic specific chromatins were indicated with H3pS10 staining WT (left), Brd4KO (middle) and ARV-825 treated WT (right) cells (Pink), and counterstained with Hoechst 33342 (blue) for DNA (top). Quantification of mitotically arrested cells (% of H3pS10- or H3pS10+ cells). (bottom).
(D) Immunoblot of H3pS10. WT and BRD4KO cells were harvested at indicated time points after serum starvation and release. Acid extracted histones were separated on 12% NuPAGE gel and blotted with H3S10ph antibody (top). H3S10ph bands were normalized against the loading control (High molecular weight band in the acidic extract) and subsequently quantified using ImageJ software (bottom).
(E) S phase cells treated with JQ1. WT cells were synchronized by serum starvation, released and allowed to proceed for 16 h. JQ1 (0.5μM) or DMSO was added at this time and cells were further incubated for 8 h (top). Cells were stained with propidium iodide and DNA contents were analyzed by flow cytometry (right). The percentages of cells at G1(2N), and G2/M (4N) are quantified (left).
(F) Live cell imaging of WT and Brd4KO cells. Frames of representative films monitoring mitosis. Note that most WT cells (Top panel) completed mitosis within 55 min. Some Brd4KO cells failed to achieve mitotic cell division and disintegrated (middle panel). Other Brd4KO cells were delayed in metaphase-anaphase progression and displayed chromosomal mis-segregation (bottom panel).
(G) Quantification of failed (left), defective as bridge during mitosis progression (middle) and duration of mitosis (right) and (Figure S5D) in Brd4KO and WT cells.
We next tested JQ1 for its effect on G2/M passage in WT cells. Cells were synchronized by serum starvation, and JQ1 was added at 16 h when cells were at S phase (Figure 5E, top). FACS analysis showed that majority of cells without JQ1 treatment completed one cell cycle and were back in G1 by 24 h (Figure 5E, Bottom). In contrast, JQ1 treated cells remained at or before G2/M stage. These results show that JQ1 interferes with S to G2/M passage in normal cells, independently of its inhibition on G1/S transition. Thus, Brd4 is important for proper cell cycle progression at every stage of the cell cycle.
It should be noted that although most Brd4KO cells encountered delay in mitotic entry, some cells managed to reach mitosis. We monitored mitotic progression by time lapse imaging of WT and Brd4KO cells undergoing mitosis (Figures S5D right panel, video, and snapshots 5F and S5E). As shown in Figures 5F top and S5E top, WT cells completed mitosis within 55 min, starting from chromosomal condensation, alignment on the mitotic plate, sister chromatid separation to the formation of two daughter cells. In contrast, few Brd4KO cells showed signs of mitosis. Although some Brd4KO cells exhibited chromosomal condensation, many of them failed to line up on the mitotic plate (Figure 5F, middle and bottom; Figure S5E bottom). Consequently, these cells did not progress beyond this stage and eventually disintegrated presumably by apoptosis. Some other Brd4KO cells reached a metaphase-like state, followed by chromosomal segregation, but taking much longer time and showing a higher frequency of chromosomal miss-segregation, such as lagging chromosomes and chromosomal bridges (Figures 5F and S5E bottom), similar to previously reported anaphase DNA bridges.50 Quantification in Figure 5G showed a much higher frequency of failed mitosis and defective segregation of Brd4KO cells than WT cells. These data indicate that BRD4 deficiency can lead not only growth arrest, but also a loss of genome integrity.
BRD4KO cells incur DNA damage
Above results highlighted the importance of BRD4 in DNA replication and mitotic cell division. We next asked whether defects in Brd4KO cells include DDR, a question prompted by the observed changes in the expression and phosphorylation status of ATR and ATM in Brd4KO cells (Figures 3D, 3E, and S3B). These kinases are reported to be activated following DSBs.27,51 Furthermore, it has been shown that depletion of BRD4 by inhibitors causes increased DNA damage in cancer cells.52,53,54,55 To assess DNA damage, WT and Brd4KO cells were immuno-stained with antibody against phosphorylated H2AX (γH2AX).56 As shown in Figures 6A and S6A, most Brd4KO cells displayed intense γH2AX foci over the nuclei, while WT cells had much fewer γH2AX positive nuclei, indicating double-strand breaks (DSBs). DNA double-strand breaks induce H2Ax phosphorylation domains in a contact-dependent manner.57 Moreover, treatment of human WI38 cells with JQ1 and ARV-825 resulted in significantly higher γH2AX signals compared to control cells treated with vehicle alone (Figure 6B).
Figure 6.

R-loop accumulation and DNA damage following BRD4 depletion
(A) Immunostaining of γH2AX in randomly growing cells. WT and Brd4KO cells were immuno-stained with γH2AX antibody (left). Quantification of γH2AX Fluorescence (right), Significance was assessed using two-tailed unpaired t test.
(B) Immunostaining of γH2AX in JQ1 treated WI38 cells. WI38 cells were treated with JQ1 (2.5μM) or ARV-825 for 24 h and immuno-stained with γH2AX antibody (left). IF intensity in each cell was quantified (right). Significance was assessed using Mann-Whitney test (∗∗∗∗p < 0.0001 and ∗∗p < 0.001).
(C) Comet assay. WT, Brd4KO and ARV-825 treated WT cells were subjected to Comet assay in alkaline conditions. Comet tails were quantified using tail moment of open comet program (n = 3 independent experiments (right). Significance was calculated using unpaired t test.
(D) Immunostaining of γH2AX in synchronized cells. WT and Brd4KO cells were synchronized by serum starvation, released and incubated for indicated times. WT cells (top), Brd4KO cells (middle) and WT cells were treated with ARV-825 (low) were immuno-stained with γH2AX antibody at indicated times. Quantification of mean γH2AX intensity was performed using two-tailed unpaired t test (bottom. ∗∗∗p < 0.001).
(E) RNase digestion on asynchronous cells. Representative images of single planes of randomly growing WT and Brd4KO cells which were mock-treated or pretreated with RNase H1, RNase III, and RNase T1 for 1 h at 37°C, and then stained with S9.6 antibody. Scale bar, 10μm (left). Quantification of nuclear S9.6 intensity was performed using ImageJ (p < 0.0001, p < 0.01), and significance of IF intensity was assessed using two-tailed unpaired t test (right).
(F) RNase H1 digestion of synchronized cells. WT and Brd4KO cells were synchronized by serum starvation and allowed to proceed to indicated times after release. Cells were then mock-treated or treated with RNase H for 1 h at 37°C and immunoassayed with S9.6 antibody. Scale bar, 10μm (right). Quantification of nuclear S9.6 intensity was performed using ImageJ (p < 0.0001), and significance of IF intensity was assessed using two-tailed unpaired t test (left).
To further verify that BRD4 depletion leads to DNA damage, we performed Comet assays that detect cells with DNA damage.58,59 This is a single cell gel electrophoresis assay where cells with DNA strand breaks produce comet tails which are visualized by microscopy. When tested under alkaline conditions which detect both single strand breaks (SSB) and double-strand breaks (DSB), we found many Brd4KO cells, but not WT cells exhibiting discernible comet tails (Figure 6C). As expected, WT cells treated with ARV825 also produced comet tails (Figure 6C).
However, we did not find a significant number of cells showing comet tails under neutral conditions which exclusively detects DSB (pH7.5, Figure S6C). These results suggest the presence of significant levels of SSBs in Brd4KO cells. Given that both SSB and DSB are detected under alkaline conditions, Brd4KO cells likely undergo both types of breaks.
To determine whether the extent of DNA damage varies during cell cycle, we examined γH2AX signals in synchronized WT, Brd4KO, and ARV825 treated WT cells (Figure 6D). Cells released from serum starvation were cultured for 0 h, 12 h, 20 h, 24 h, and then immuno-stained for γH2AX, as these samples were enriched with G0, G1, S and G2/M, respectively. As shown in Figure 6D, Brd4KO cells and ARV825 treated cells showed much higher γH2AX signals than vehicle treated cells at all stages. Overall, levels of γH2AX signals were always similar in Brd4KO and ARV825 treated cells, and consistently higher than in WT cells (quantification in Figure 6D bottom). In addition, flow cytometry was carried out to detect γH2AX in synchronized WT and Brd4KO cells. Data in Figure S6B showed that γH2AX signals were higher in Brd4KO cells than WT cells at all stages of cell cycle (Quantification in Figure S6B bottom). These results show that Brd4 depletion causes DNA damage not only in cancer cells but in normal fibroblasts as well.
Brd4KO cells accumulate R-loops
It has recently been reported that BRD4 depletion results in accumulation of R-loop in some cancer cells, leading to DNA damage.30,31,32 R-loop, an RNA-DNA hybrid, representing about 5% of mammalian genome throughout cell cycle, has a fundamental role in transcription, replication and telomere maintenance.60,61,62,63 R-loop can accumulate during replication due to collision of replication fork and transcription. Some R-loops cause double strand DNA breaks.30,31,32 R-loops are recognized by the monoclonal antibody S9.6 which preferentially reacts with RNA-DNA hybrid over ds and ssDNA.64 However, S9.6 can react, though to a much lesser extent, with ssDNA and dsDNA that are abundant in mammalian nucleus. In immunofluorescence staining experiments, sensitivity to RNASEH1 has been used to verify detection of R-loops by the antibody, as the enzyme specifically degrades RNA-DNA hybrid.65 We first verified that RNA-DNA hybrids were detected by S9.6 antibody in Brd4KO cells. Immunostaining data in Figure S6E revealed that RNASEH1 treatment significantly reduced fluorescent signals in the nucleus. As expected, treatment with RNAse III and RNASET1 reduced the signals even more (see quantification on the right). Next, we performed immune-stained experiments for synchronized cells with or without RNASEH1 treatment. Images in Figure 6F showed that RNA-DNA hybrids were present at 0 h, 8 h and 16 h at similar levels in Brd4KO cells (quantification on the left). In contrast, S9.6 signals were much lower in WT cells. The results show that R-loops are present in Brd4KO cells at all stages of cell cycle. In line with these results, RNASEH1 sensitive S9.6 signals were found in asynchronized Brd4KO cells (Figure 6E). S9.6 staining was found in the cytoplasm of all cells as well, likely representing mitochondrial R-loop.66 Further, we found that many of the S9.6 nuclear signals overlapped with those of γH2AX, suggesting physical proximity of R-loop and DNA damage (Figure S6D, enlarged image at the bottom, quantification on the right). These results reinforce the conclusion that Brd4 deletion leads to R-loop accumulation throughout cell cycle in normal fibroblasts.
BRD4 directs transcription of genes controlling R-loop and DDR
Despite multiple publications presenting strong evidence that BRD4 depletion causes R-loop accumulation and DNA damage, the underlying mechanisms by which BRD4 controls R-loop formation have not been fully deciphered. It was recently reported that BRD4 directly interacts with Topoisomerase 1 (Top1) to resolve R-loops.30 In line with this, it was also reported that Top1, BRD4 and RNA pol II coregulate transcription elongation.67 As an alternative but not exclusive possibility, we hypothesized that BRD4 regulates transcription of genes that suppress R-loop formation. To this end, we examined transcript levels of Rnaseh1 and Rnaseh2 coding for enzymes resolving R-loops68,69 as well as Top1, Top2a, and Top3 reported to reduce R-loop formation.67,70,71 qRT-PCR data on synchronized WT cells showed that mRNA levels for Rnaseh1, Rnaseh2, Top1, and Top3 were expressed at similar levels over G0, G1 and S, and increased at 24 h (Figure 7A left). Top2, however, was induced at S phase in WT cells (Figure 7A, left). Importantly, transcript levels of all these genes were lower in Brd4KO cells throughout cell cycle stages.
We also examined genes regulating DDR, including H2ax, Topbp1, p53, p21 and Parp1. Topbp1 associates with topoisomerase complexes and controls ATR activation.72,73 p53, tumor suppressor is activated by DNA damage and directs DNA repair, and downstream cellular events.74,75 p21, induced by activated p53, is critical for DNA damage mediated cell-cycle arrest. Parp1 takes part in DNA repair among other functions.76 Data in Figure 7A (right) showed that in WT cells, H2AX transcripts increased from G0 through G2/M. However, in Brd4KO cells H2Ax expression remained very low throughout all stages. Other DDR genes, p53, p21, Topbp1 and Parp1, were induced at S or G2/M in WT cells. In contrast, none of these genes were induced in Brd4KO cells, as their transcript levels remained low throughout all stages (Figure 7A right). In addition, activation of p53 in Brd4KO cells (Figure 7B) points to DSBs.77 Consistent with the qRT-PCR data, RNA-seq analyses showed that RNA peaks for these DDR genes as well as the R-loop regulator genes above were distinctly lower in Brd4KO cells than in WT cells (see IGV profiles for RNA peaks in Figures 7C and S7B). It is of note that some R-loop regulators and DDR genes, e.g., Setx and Rpa3, were expressed at similar levels in WT and Brd4KO cells, indicating selectivity of BRD4 regulation. These results indicate that BRD4 plays a central role in timely expression of R-loop repressing enzyme genes as well as DDR genes.
Immunoblot data in Figures 7B and S7A show levels of proteins for the above R-loop and DDR genes at different cell cycle stages. Amounts of RNASEH1, RNASEH2, TOP1, TOPBP1, P53 and P21 were lower in Brd4KO cells at all or most stages. However, Brd4KO cells showed higher phospho-p53, gH2AX and PARP1, while total protein levels were similar, the amount of 89kD cleavage products, involved in apoptosis, were higher in Brd4KO cells.78 These results indicate that Brd4KO cells are deficient in proteins that repress R-loop formation as well as those necessary for mounting proper DDR.
To assess whether BRD4 directly controls expression of above genes, BRD4 occupancy was examined for these genes. As seen in IGV profiles in Figures 7C and S7B, BRD4 bound all the above genes at the TSS and gene bodies, irrespective of cell cycle stages. However, the levels and locations of BRD4 binding varied at different stages, presumably due to BRD4’s participation in transcription elongation. Like cell cycle genes, R-loop and DDR genes showed the highest BRD4 binding at the TSS, and the binding trailed somewhat down in the gene body. Middle and lower panels in Figures 7C and S7B depict RNA peaks at each cell cycle stage in WT (Red) and Brd4KO cells (black), respectively, confirming reduced transcript expression in Brd4KO cells. These results indicate that BRD4 epigenetically marks R-loop and DDR genes and facilitates their transcription. Thus, R-loop and DDR genes require BRD4 for expression and the absence of BRD4 leads to defective R-loop resolution, dysregulated DDR along with defective replication and mitosis.
Discussion
Our results that Brd4 drives cell cycle progression of normal cells would provide further insight into how Brd4 may function in normal cells, given that BRD4 has been reported to selectively promote cancer cell growth.11,19 Thus, our data would have important clinical significance, since it is important to improve our current understanding of normal tissue effects of Brd4-directed therapeutics, Analyses of synchronized WT and Brd4KO cells by serum starvation, thymidine double block at S phase, mitotic block by nocodazole revealed that BRD4 directs S phase passage independent of G1/S regulation; the absence of BRD4 impeded completion of S phase and passage to G2/M. Consistent with the importance of BRD4 in this step, frequency of mitotic cells was markedly lower in Brd4KO culture than in WT cell population. Moreover, the few Brd4KO cells that reached mitotic stage were either disintegrated or produced daughter cells with unequal chromosomal segregation. Thus, BRD4 has a decisive role in two fundamental events in cell growth, i.e., genome replication and mitosis.23 Together, BRD4 directs not only G1/S transition as noted before,22 but the progression in the later stages of cell cycle, which has not been fully explored and appreciated before.
Transcriptome analysis revealed that more than 450 genes involved in cell cycle progression require BRD4 for expression, the numbers far higher than other cell cycle regulators such as E2Fs and FOXM1.23 Many genes necessary for DNA replication/genome duplication and mitosis were dependent on BRD4 for proper regulation. In addition, some factors that direct DNA replication, such as members of the Mcm and Orc families were downregulated in Brd4KO cells, illustrating that BRD4 is critical for chromosomal duplication. It is likely that coordination of DNA replication and subsequent chromatin assembly is grossly defective in Brd4KO cells. Moreover, BRD4 was required for expression of many key proteins necessary for mitosis, those involved in the formation of centromeres and kinetochores, and regulation of spindle fibers, including Cenps and Kifs plus various G2/M kinases. Thus, transcriptome data are consistent with phenotypic defects most prominent in Brd4KO cells undergoing mitosis.
Remarkably, BRD4 is required for transcription of 52 of the 86 histone genes including all core and linker histones, which were downregulated in Brd4KO cells. Histone gene regulation in mammalian cells has not been fully deciphered, although some factors including YY1 and NPAT are shown to control histone expression.39,79,80 Given that BRD4 was bound to individual histone genes shown by our ChIP-seq data, BRD4 is likely required for transcription of these histone genes. So, our study adds BRD4 as a critical factor for global regulation of histone gene transcription. In line with RNA levels, histone proteins were severely reduced in Brd4KO cells, verifying that BRD4 is essential for histone production. It appears that histone mRNA levels increased later in Brd4KO cells, but histone protein levels did not. The delayed mRNA increase is likely due to delayed arrival of S phase in Brd4KO cells, as observed with other S phase genes (Figures 2F and S2B). Then why did this not result in an increase in histone protein expression? The difference is likely explained by complex but tightly controlled histone mRNA expression and histone protein degradation.81,82 Histone mRNAs are expressed at the beginning of S phase upon activation of the transcription factor NPAT in the distinct histone locus. Histone mRNAs carry a stem-loop structure through which they are processed and eliminated in a timely manner. Histone proteins are synthesized in the cytoplasm, imported into the nucleus and then incorporated into nucleosomes. Nucleosomal histones are thought to be highly stable, remaining for weeks. However, unincorporated histones are reported to be degraded by a ubiquitin-proteasomal pathway or hydrolysis, to maintain stable chromatin environment. It is possible that one or some of these mechanisms are deficient in Brd4KO cells, resulting in what we observed.
One of the key features of this study is that BRD4 occupied target cell cycle genes at all times, while their transcription was restricted to specific stages. BRD4 binding was apparent even at G0, although the binding intensity fluctuated during cell cycle and tended to be higher at the time of transcription. In general, the highest BRD4 occupancy was seen at the proximal promoter/TSS area, but its binding was evident on the gene body as well. In light of previous reports that BRD4 plays a role in gene marking across mitosis, it is reasonable to suggest that BRD4 marks cell cycle genes to ensure the ordered transcription (see model in Highlights).13,83
Brd4KO cells had many more γH2A foci at every stage of cell cycle and exhibited more Comet tails than WT cells. That JQ1 treatment of human WI38 cells also led to DNA damage lends further credence to the role of BRD4 in preventing DNA damage. Our results are similar to earlier reports that BRD4 inhibitors induce DNA damage and growth arrest in cancer cells,30,31,32 but offer an important modification in that it occurs in normal cells as well. Consistent with these published reports that increased R-loop formation accounts for DNA damage in Brd4 depleted cancer cells, we found that non-cancerous cells when depleted of BRD4 also accumulate R-loops, as evidenced by increased RNASEH1 sensitive S9.6 signals. In contrast to the published reports that increased R-loops in cancer cells were due to transcription-replication conflict31,32 suggesting R-loop accumulation during S phase, our data show that Brd4 depleted cells accumulate R-loops throughout all stages of cell cycle, which is in line with the view that R-loop accumulation in Brd4KO cells is a result of aberrant transcription.30 This view is consistent with the fact that BRD4 is a part of the transcription elongation complex and helps drive nascent mRNA synthesis of numerous cellular genes.9,84,85 We addressed underlying mechanisms by which BRD4 controls R-loop and identified a number of genes critical for preventing and resolving R-loops whose expression depends on BRD4. These genes include Rnaseh1, RnaseH2b, RnaseH2c, Top1, Top2 and Top3.67,68,69,70,71 The proteins encoded by these genes were likewise strikingly lower in Brd4KO cells at all cell cycle stages. This feature of BRD4 function is also observed for a number of DDR genes, in that mRNA and protein expression of H2Ax, p53 and p21 was markedly reduced in Brd4 KO cells. These data reveal that BRD4 controls DDR gene expression, in that defective DDR is not due to R-loop accumulation per se, but due to defective transcription of key DDR genes as well. This view is reinforced by our ChIP-seq data that R-loop suppressor genes and DDR genes were occupied by BRD4 at all times during cell cycle, indicating that these genes are book-marked presumably to ensure continued expression across multiple cell divisions. Our finding that the occupancy patterns shifted during cell cycle, mostly over the gene body illustrates BRD4’s participation in transcription elongation.
It is well known that DNA damage recognition by γH2A, phosphorylation status of checkpoint proteins such as ATR/CHEK1 and/or ATM/CHEK2 pathways help to arrest cell for either DNA repair or apoptosis during cell cycle.27 Our data that ATR was activated in Brd4KO cells led to a revelation that BRD4 is involved in DNA damage control, and that the dramatic downregulation but concomitant activation of ATR in Brd4KO cells are consistent with the accumulation of DNA single-stranded breaks and the impaired ability of Brd4KO cells to repair single-stranded DNA breaks.
Together, our results are consistent with a model where BRD4 directs transcription of select R-loop and DDR regulator genes along with many cell cycle genes (see model in Highlights). In conclusion, BRD4 orchestrates cell cycle progression by integrating mechanisms of regulating R-loop formation and DDRs to ensure genome integrity and healthy cell renewal.
Limitations of the study
A major finding of our study is that BRD4 facilitates cell cycle progression by preventing DNA damage. The focus of the study is on the role of BRD4 in R-loop metabolism and DNA damage response, and our data provide new insight into how Brd4 may function in mitotic progression of normal cells. However, a quantitative determination of ssDNA and dsDNA breaks could not be made due to technical limitations. It would be interesting for future studies to determine the exact contribution of ssDNA and dsDNA breaks in Brd4KO cells, which may provide further insight into the role of Brd4 in the regulation of DNA damage response and repair pathways.
STAR★Methods
Key resources table
| REAGENT or RESOURCE | SOURCE | IDENTIFIER |
|---|---|---|
| Antibodies | ||
| FOXM1 | Abcam | Cat#ab180710 |
| PLK1 | Abcam | Cat#ab61118 |
| AURORA b | Thermo Fisher Scientific | Cat#PA5_14075 |
| CENP F | Abcam | Cat#ab5 |
| CENP A | Bioss.com | Cat#bs-2753R |
| CREST | Protintech | Cat#12439-1-A9 |
| βACTIN | Cell Signaling com | Cat#3700 |
| ATR | Santa Cruz Biotech.Inc | Cat# sc- 515173 |
| pATR | Cell Signaling com | Cat# 2853S |
| CHEK1 | Cell Signaling com | Cat#2360s |
| pCHEK1 | Cell Signaling com | Cat#2348s |
| CDK1 | Abcam | Cat#ab133327 |
| ATM | Abcam | Cat#ab78 |
| pATM | Cell Signaling com | Cat#5883s |
| CHK2 | Cell Signaling com | Cat#2662s |
| CDK2 | Abcam | Cat#ab32147 |
| H3pS10 | Sigma | Cat#06-507 |
| S9.6 | Kerafast | Cat#ENH001 |
| Nucleolin | Abcam | Cat# ab22758 |
| TOPBP1 | Thermo Fisher Scientific | Cat# PA5-76824 |
| TOP1 | Thermo Fisher Scientific | Cat# MA5 -32228 |
| TOP2a | Thermo Fisher Scientific | Cat# MA5 -38371 |
| RNASEH1 | Thermo Fisher Scientific | Cat# 15606-1-AP |
| RNASEH2C | Abcam | Cat#ab89726 |
| p53 | Thermo Fisher Scientific | Cat# MA5 -14067 |
| Phospho-p53 | https://Cell Signaling.com | Cat#9284s |
| γH2AX | Cell Signal.com | Cat#9718 |
| PARP1 | Cell Signaling com | Cat#9542 |
| p21 | Santa Cruz Biotech.Inc | Cat#sc-6246 |
| PARP1 | Cell Signaling com | Cat#9542 |
| anti-mouse Alexa Fluor 594 | Invitrogen | Cat#A21058 |
| anti-Rabbit Alexa Fluor 488 | Invitrogen | Cat#A11034 |
| Chemicals, peptides, and recombinant proteins | ||
| Dulbecco’s Modified Eagle’s Medium (DMEM) 1x |
Corning | Cat#2MT10027CV |
| 4-hydroxytamoxifen | Sigma | Cat#H7904 |
| Thymidine | Sigma | Cat#T1895 |
| JQ1 | Sigma | Cat#SML0974 |
| ARV-825 | Selleckchem.com | Cat#S8297 |
| Nocodazole | Sigma | Cat#SML1665 |
| (+)-S-trityl-L- cysteine | Sigma | Cat#CS-W011818 |
| MG132 | Sigma | Cat#SML1135 |
| Annexin V-fluorescein isothiocyanate | BD Biosciences Pharmingen | Cat#9542 |
| RNase H1 | Abcam | Cat#ab153634 |
| RNase HIII | New England Biolab | Cat#M0245S |
| RNaseT1 | Thermo Fisher Scientific | Cat#EN0541 |
| Protease Inhibitor Cocktail Tablets -Complete, EDTA-free | Roche-Merck | Cat#05056489001 |
| Hoechst 33342 | Thermo Fisher Scientific | Cat#62249 |
| Critical commercial assays | ||
| DNA clean & concentrator | Zymo research | D4014 |
| Quick-RNA Miniprep Kit | Zymo research | Cat#R1055 |
| SuperSignal West Femto Maximum Sensitivity Substrate | Thermo Fisher Scientific | Cat#34095 |
| SuperSignal™ West Pico PLUS Chemiluminescent Substrate | Thermo Fisher Scientific | Cat#34580 |
| Comet Assay | TREVIGEN | Cat#4250-050-01 |
| Data and code availability | ||
| Raw data files RNA-seq | This study | GEO: GSE148222 |
| Raw data files Chip-seq | This study | GEO: GSE153572 |
| Experimental models: Cell lines | ||
| Mouse: MEFs | Ozato’s Lab | N/A |
| Human: WI-38 | ATCC | Cat#CCL-75 |
| Oligonucleotides | ||
| All the primers used are based on information from PrimerBank | (https://pga.mgh.harvard.edu/primerbank/index.html) | |
| Primer Name | Primer Sequence (synthesized by Eurofins) | |
| Brd2 Forward | ATGCTGCAAAACGTGACTCC | This paper |
| Brd2 Reverse | AAGCTGGTACAGAAGCCATTG | This paper |
| Brd3 Forward | AAAAAGGCTCCCACCAAGAAG | This paper |
| Brd3 Reverse | TGTCAAGGCTAAGTTGTCGCT | This paper |
| H3132-Forward | CGGCGCTACCAGAAGTCGACC | This paper |
| H3132-Reverse | GTCTTGAAGTCCTGCGCGATCTCG | This paper |
| Foxm1-Forward | CTGATTCTCAAAAGACGGAGGC | This paper |
| Foxm1-Reverse | TTGATAATCTTGATTCCGGCTGG | This paper |
| ATM-Forward | GATCTGCTCATTTGCTGCCG | This paper |
| ATM-Reverse | GTGTGGTGGCTGATACATTTGAT | This paper |
| ATR-Forward | GAATGGGTGAACAATACTGCTGG | This paper |
| ATR-Reverse | TTTGGTAGCATACACTGGCGA | This paper |
| Plk1-Forward | CCCGCTGGCGAAAGAAATTC | This paper |
| Plk1-Reverse | CATTTGGCGAAGCCTCCTTTA | This paper |
| E2f1-Forward | CTCGACTCCTCGCAGATCG | This paper |
| E2f1-Reverse | GATCCAGCCTCCGTTTCACC | This paper |
| E2f5-Forward | CCACCAAATTCGTGTCGTTGC | This paper |
| E2f5-Reverse | AGCACCTACACCCTTCCACT | This paper |
| Mcm2-Forward | TGTGGTGAGGGACACTGTTGA | This paper |
| Mcm2-Reverse | GGCTGCCAACCACAAAGC | This paper |
| ccnb1-Forward | CTTGCAGTGAGTGACGTAGAC | This paper |
| ccnb1-Reverse | CCAGTTGTCGGAGATAAGCATAG | This paper |
| Cenpa-Forward | CTCCAGTGTAGGCTCTCAGAC | This paper |
| Cenpa-Reverse | CTGAAAGGCTTCTTCCTGAACA | This paper |
| Cenpf-Forward | GCACAGCACAGTATGACCAGG | This paper |
| Cenpf-Reverse | CTCTGCGTTCTGTCGGTGAC | This paper |
| Cenpe-Forward | CTTCAGTGGCTGTCTGTGTTC | This paper |
| Cenpe-Reverse | CCATCGCTCTGATAAATAGCGTT | This paper |
| Cdk2-Forward | CCTGCTTATCAATGCAGAGGG | This paper |
| Cdk2-Reverse | TGCGGGTCACCATTTCAGC | This paper |
| Cdk1-Forward | AGAAGGTACTTACGGTGTGGT | This paper |
| Cdk1-Reverse | GAGAGATTTCCCGAATTGCAGT | This paper |
| Chk1-Forward | TGTCGCTGTGCTTGGAGTC | This paper |
| Chk1-Reverse | AAGTTTGCACCAAATCCCAGT | This paper |
| Chk2-Forward | TGACAGTGCTTCCTGTTCACA | This paper |
| Chk2-Reverse | GAGCTGGACGAACCCTGATA | This paper |
| p21-Forward | CCTGGTGATGTCCGACCTG | This paper |
| p21-Reverse | CCATGAGCGCATCGCAATC | This paper |
| H2aX-Forward | CGGGCGTCTGTTCTAGTGTT | This paper |
| H2aX-Reverse | GGTGTACACGGCCCACTG | This paper |
| Top1-Forward | GTTCACGAATCAAGGGTGAG | This paper |
| Top1-Reverse | TCCTTCTCATTGCCTGCTCT | This paper |
| Top2a-Forward | GAGAGGCTACGACTCTGACC | This paper |
| Top2a-Reverse | CTCCAGGTAGGGGGATGTTG | This paper |
| Top3b-Forward | ACCGGACTATCTGACTGAGGC | This paper |
| Top3b-Reverse | CTTCGGATGGTGGGGAGTA | This paper |
| Topbp1-Forward | CAGGATTGTTGGTCCTCAAGTG | This paper |
| Topbp1-Reverse | ACAGGATACAGTTACGTCAGACA | This paper |
| Rnaseh2b-Forward | GCCAGGCAGCTAGTGTTCC | This paper |
| Rnaseh2b-Reverse | AGGCCCCCTGATTGAACTGA | This paper |
| Rnaseh1-Forward | TGAGTTGGAGTGAGTGCAAAG | This paper |
| Rnaseh1-Reverse | CTTCGCCTGTGACTTCTGCTC | This paper |
| RnaseH2C-Forward | GAACCCGGAGGAAGCGGCAGAC | This paper |
| RnaseH2C-Reverse | GTCTGCATCGTGGCGGACGGC | This paper |
| Rpa3-Forward | ACCGTGCTCTGTGCATCTTAT | This paper |
| Rpa3-Reverse | GGAAGCCCTACAGGGAAAAACT | This paper |
| Setx-Forward | GTGGGTCTTCCACCATTGATG | This paper |
| Setx-Reverse | CCACACACTCTAAGCAGTAGCA | This paper |
| Parp1 Forward | GGCAGCCTGATGTTGAGGT | This paper |
| Parp1 Reverse | GCGTACTCCGCTAAAAAGTCAC | This paper |
| p53-Forward | TCCCACCCTCGCATAAGTTTC | This paper |
| p53-Reverse | CAAACCAAAGCTACAGCCGA | This paper |
| Software and algorithms | ||
| ImageJ (1.54) | ImageJ | https://imageJ.org |
| FlowJo (10.10.0) | ABI | https://www.flowjo.com |
| IGV (2.16.0) | IGV | https://igv.org |
| Metascape | Metascape | https://metascape.org |
| GraphPad Prism 9.3.1 | GraphPad | https://www.graphpad.com |
| Imaging Lab 5.2 | Bio-Rad | https://www.bio-lab.com |
Resource availability
Lead contact
For further information and requests for resources and reagents contact the lead contact, Wu Tiyun (wutiyun@mail.nih.gov).
Materials availability
All materials and reagents generated in this study are available upon request.
Data and code availability
Experimental model and study participant details
Cell culture and method details for synchronization, and drug treatments
Embryonic fibroblasts were prepared from Brd4f/f ER2−Cre mice and cultured in Dulbecco’s modified Eagle’s medium (DMEM) supplemented with 10% (v/v) fetal bovine serum (FBS) and 1% penicillin-streptomycin (Invitrogen) at 37°C and 5% CO2 as described.13 To delete Brd4, cells were treated with 2 μM 4-hydroxytamoxifen (TMX, Sigma) for 96 h. Cells were treated with JQ1 1(Sigma), BET bromodomain PROTAC ARV-825 (Selleckchem.com), Thymidine (Sigma-Aldrich), Nocodazole (Sigma-Aldrich), MG132 (Sigma-Aldrich), and (+)-S-Trityl-L-cysteine (HTLC) (Sigma-Aldrich) at the concentration and duration indicated in Figure Legends.
The WI38 cells were cultured by EMEM with 10% FBS, HEPES, NEAA. Growth Curve for WI-38 primary cells, 50,000 WI-38 cells were plated onto a 12-well plate. After 24 h, the cells were treated with 0.5μM JQ1 or 0.5μM ARV-825 and then fixed with 4% paraformaldehyde. For staining, the plates were incubated with 0.1% crystal violet in PBS for 30 min at room temperature, followed by three washes with water. The dye was dissolved in 1 mL of 10% acetic acid after the plates were completely dried. Cell growth was measured by the absorbance at 590nm.
For synchronization, WT and Brd4KO cells were incubated in DMEM with 0.05% FBS for 72 h, released in the complete media at indicated times. Cells were fixed with 70% Ethanol, stained with propidium iodide (25 μg/mL) and analyzed by flow cytometry on FACS Caliber interfaced with the Cell Quest software (BD Biosciences).
For thymidine double block used to synchronize cells in late G1/early S,86 WT and Brd4KO cells were first treated with thymidine (25 μg/mL) at 37°C for 22 h, released in complete media at 37°C for 6 h, followed by a second treatment with thymidine (25 μg/mL) at 37°C for 16 h, and finally released in complete media, and cells were collected at indicated time points. Cells were then fixed with 70% Ethanol, stained with propidium iodide (25 μg/mL), and analyzed by flow cytometry on BD FACSCalibur interfaced with the Cell Quest software (BD Biosciences).
To detect apoptosis, cells were stained with propidium Iodide and annexin V-fluorescein isothiocyanate (BD Biosciences Pharmingen) according to the manufacturer’s instructions.
Quantitative real time (qRT)-PCR and RNA-Seq analysis
Total RNA was prepared by Quick-RNA Miniprep Kit (ZYMO research). Gene-specific cDNA was synthesized with random hexamers (Thermo Scientific). Quantitative Real-Time PCR (qRT- PCR) was performed using Fast SYBR Green Master Mix (Applied Biosystems, Thermo Fisher Scientific).
For RNA-seq Libraries were prepared from total RNA as above using a Mondrian SP (NuGEN Technologies Inc.) and the Ovation SP Ultralow Library system (NuGEN). Fragments ranging from 250 to 450 bp were subjected to paired-end sequencing on a HiSeq 2000 sequencing system (Illumina). mRNA-seq samples were pooled and sequenced using Illumina TruSeq Stranded mRNA Library Prep and paired-end sequencing. The samples have 20M pass filter reads with more than 92% of bases above the quality score of Q30. Reads from the samples were trimmed for adapters and low-quality bases using Trimmomatic software before alignment with the reference genome (mm10) and the annotated transcripts using STAR. The mapping statistics were calculated using Picard software. Library complexity was measured in terms of unique fragments in the mapped reads using Picard’s MarkDuplicate utility. The gene expression quantification analysis was performed for all samples using STAR/RSEM tools.
Data normalization was conducted using the FPKM method for within-sample comparisons, and the TMM method was applied for among-sample normalization in RNA-Seq data analysis. Then the differentially expressed genes were analyzed by Limma pipeline with +/−2 fold and p-value of 0.05. Pathway and GO analyses were performed by Gene GO web portal (https://portal.genego.com/cgi/data_manager.cgi). Raw data files are available at the NCBI Gene Expression Omnibus (GEO) server under the accession number GSE148222.
ChIP-seq
WT and Brd4KO cells (∼5 × 10⁶ in 15-cm plate) were fixed with 1% formaldehyde (Sigma) in buffer A (50 mM HEPES, pH 7.5, 100 mM NaCl, 1 mM EDTA, and 0.5 mM EGTA) for 10 min and quenched with 0.125 M glycine for 5 min. Cells were washed and incubated in nucleus isolation buffer (50 mM HEPES, pH 7.9, 140 mM NaCl, 1 mM EDTA, 10% Glycerol, 0.5% NP-40, 0.25% Triton X-100). Nuclear pellets (∼2 × 10⁷) were re-suspended in 1 mL shearing buffer (1 × TE, pH 8, and 0.1% SDS) and transferred to Covaris millitubes and sonicated in Covaris ME200 sonicator. Sonicated chromatin was precipitated with anti-BRD4 antibody (IgG) pre-bound to Dynabeads Protein G (Thermo Fisher) (Dey et al., 2019).
Immunoprecipitated DNA was de-crosslinked, digested with proteinase K, and purified using QIAquick PCR Purification Kit (Qiagen). Precipitated DNA was validated by qChIP. Precipitated DNA (∼20 ng) was used for library construction using NEBNext Ultra II DNA Library Prep Kit for Illumina (New England Biolab). Library DNA with fragment length of 200–400 bp was subjected to single end sequencing on a Nextseq system (Illumina). For data analysis, ChIP-seq reads were mapped to the mouse reference genome (mm10) using Bowtie2 v.2.3.4.1 with the following parameters: --sensitive-local. The clonal reads from the aligned reads were removed using PCARD MarkDuplicates and REMOVE_DUPLICATES = true for further analysis. The peak calling was performed using macs2/2.1.1.20160309 program using the following command: macs2 callpeak -t $i.bam -c $i.input.bam -g mm -n $i --outdir $i-Macs-BroadPeak -B -f BAM -- broad --keep-dup auto --nomodel --extsize 200. The bam files were converted to 1× sequence depth normalized bigWig files as reads per genomic content (RPGC) using deeptools v2.5.46 15 bamCoverage command. For the clustering of cell cycle genes based on BRD4 binding profiles, we used deepTools computeMatrix command to calculate average gene body distribution of BRD4 using the command scale-regions -p 10 -R All-Cell-Cycle2k.bed NonBrd41602.bed Brd4-Cell-564Cycle.bed -S ∗.bw -b 5000 -a 5000 --regionBodyLength 8000 -- skipZeros -o Brd4-Cycle_scaled.gz --outFileNameMatrix Brd4-Cycle_scaled.tab -- outFileSortedRegions Brd4-Cell_genes.bed. The resulting matrix file was subjected to K-means clustering using plotHeatmap tool and the value of K was chosen at 4. The bed coordinates from the Clusters (C1-C4) were used to predict the genes in each cluster. GO analysis was performed for genes in each cluster using Metascape and GO terms are ranked based on p-values. The raw data are submitted under the following accession number GSE153572.
Acid extraction of histones
Acidic extraction of histones was performed as reported (https://www.abcam.com/protocols/histone-extraction-protocol-for-western-blot). Briefly, WT and KO MEF cells were harvested at several time points (0, 8, 10, 12, 16, 18, 20 and 24 h) after serum starvation induced synchronization. First, cells were washed with ice-cold PBS. Subsequently equal number of cells were lysed in Triton extraction buffer [PBS containing 0.5% Triton X-100 (v/v), 2 mM phenylmethylsulfonyl fluoride (PMSF), 0.02% (w/v) NaN3] for 10 min on ice. Nuclei pellets were collected by centrifugation at 4°C for 10 min at 6500g. Nuclei were further washed in Triton extraction buffer. Washed nuclei were resuspended in equal amount of 0.2N HCl and acid extracted overnight at 4°C. Histones (supernatant) were collected by centrifugation at 4°C for 10 min at 6500g. Acid extracted histones were further neutralized with 2M NaOH. Histones were separated on NuPAGE 12% Bis-Tris gel. Two mg of extracts was separated on 12% SDS-PAGE. Gels were stained with SYPRO Orange (Molecular Probers), photographed and quantified using the ChemiDoc MP Imaging System and its accompanying software, Imaging Lab 5.2 (Bio-Rad).
Immunoblotting
For detection of other proteins, synchronized WT and BRD4KO cells were harvested at several time points (0, 8, 16, and 24 h) after serum starvation for synchronization (72 h), nuclear extracts were prepared as described.87 Twenty mg of extracts was separated on 4–20% SDS-PAGE, transferred to polyvinylidene difluoride (PVDF) membranes (Millipore), blocked in 5% of milk in PBS with 0.1% Tween 20 and incubated at 4oC with primary antibodies overnight. Membranes were washed and incubated with horseradish peroxidase-conjugated secondary antibody (1:2000) for 1 h, then incubated with ECL (Pierce or GE Healthcare) and imaged using Ecomax X-ray Film Processor (Protec) or by Azure c600 Biosystems. The Following antibodies with indicated dilution were used: ATM (ab78, Abcam, 1:1000 dilution), ATR (Santa Cruz Biotechnology Inc, sc- 515173, 1:500), Foxm1 (ab180710, Abcam, 1:1000), PLK1 (ab61118, Abcam, 1:1000), CDK1(ab133327, Abcam, 1:2000), CDK2 (ab32147, Abcam, 1:2000), CENP F (ab5, Abcam, 1:1000), AUROR A (ab13824, Abcam, 1:1000), AUROR B (PA5_14075, Thermo Fisher Scientific, 1:1000), CENPA (bs-2753R, Bioss.com, 1:500), PARP1 (Cell Signal.com 9542, 1:1000), pATM (Cell Signal.com 5883S, 1:1000), pATR (Cell Signal.com 2348S, 1:1000), CHK1 (Cell Signal.com 2360S, 1:1000; ab13824, Abcam, 1:1000), ChK2 (Cell Signal.com 2662S, 1:1000), H3pS10 (Sigma-Aldrich, 06–507 1:1000), CREST (Protintech #12439-1-A9) and β-ACTIN (8H10D10) (#3700 Cell Signal.com), Topbp1 (Invitrogen #PA576824, 1:1000 dilution), Top1 (Invitrogen #MA5-32228, 1:1000 dilution), Top2a (ThermoFisher. #MA5-38371, 1:500 dilution), RNASEH1 (ThermoFisher. #15606-1-AP, 1:500 dilution), RNASEH2C (abcam ab89726, 1:1000 dilution). Blots were normalized against the loading control β-ACTIN) and subsequently quantified using ImageJ software.
Immuno-staining
For immunostaining, cells grown on poly-l-lysine-coated coverslips were fixed in 4% paraformaldehyde for 10 min at room temperature, permeabilized with methanol for 10 min, and stained with primary antibodies for γH2AX (1: 500 #9718 Cell Signal.com), BRD4 (1:250), H3pS10 (1:500), overnight at 4C. After washing cells were incubated in alexa-fluor secondary antibodies for 1 h and counterstained with Hoechst 33342 (5 ng/ml). For detection of nuclear DNA-RNA hybrid cells were fixed with 100% methanol for 10 min at −20°C and were blocked in 2% BSA in PBS overnight at 4°C and incubated in primary antibody for mouse S9.6 (1:200) (#ENH001 Kerafast) and rabbit Nucleolin (#22758 Abcam).66 Images were captured with Zeiss 880 confocal microscope with 40X water 1.2NA objective. From the captured images intensity per nuclei were determined using ImageJ software.32 Statistical significance of fluorescence intensity between experimental condition was determined by two-tailed unpaired t-test using Graph Pad Prizm 9.4.0 software. To determine nuclear S9.6 signal, nuclei were overlaid with Hoechst signal (denoted by white circles in Figure 6) and then intensity were determined by nucleolin subtracted remaining signal of S9.6 using ImageJ.
Cell fixation and nuclease treatment
Nuclease treatment was performed as described65 with some modifications. Both synchronized (after serum starvation and release) and asynchronized WT and Brd4 KO MEF cells were cultured on cover glasses in 12 well plates. Cells were washed with PBS once and fixed with 100% cold Methanol at −20°C for 10 min. Cells were washed once again with PBS and incubated in staining buffer (TBST with 0.1% BSA) for 10 min. For RNase treatment cells were incubated in staining buffer containing 3 mM MgCl2 with recombinant human RNase H1 (ab153634; Abcam) at a 1:150 dilution, with ShortCut RNase III (M0245S; New England Biolabs) and RNase T1 (EN0541; Thermo Fisher Scientific) at a 1:200 dilution for 1 h at 37°C. Next, cells were washed with staining buffer and incubated further in anti-S9.6 (ENH001; Kerafast) and anti- Nucleolin antibody (ab22758; Abcam) for 1 h at room temperature. Cells were washed thoroughly with staining buffer and subsequently stained with anti-mouse Alexa Fluor 633 and anti-rabbit Alexa Fluor 488 secondary antibody and were counterstained with Hoechst dye. Coverslips were mounted using ProLong Gold antifade mountant. Anti-nucleolin antibody recognized nucleoli, thereby nuclear ROI were drawn away from nucleoli, hence allowing measurement of S9.6 nuclear fluorescence intensities. Nuclear fluorescence intensity of each nucleus was measured by selecting multiple ROI from Mock or RNase treated cells using ImageJ Fiji. p values were determined by using unpaired t test.
Time lapse microscopy and live cell imaging
WT and Brd4KO cells were transduced with a retroviral vector containing H3.1-GFP.85 Cells were incubated in Tokai Hit stage-top incubator at 5% CO2 and ∼100% humidity, with both the chamber and microscope objective (Nikon Plan Apo l 60x NA1.4 oil) warmed to 37°C. Cells were imaged for approximately 18 h using Yokogawa CSU-W1 spinning disc confocal system (50μm pinhole radius) on Nikon Ti2 Eclipse microscope. Sample was illuminated with AOTF-controlled 488nm laser (5% relative power), and fluorescence was detected through FITC emission filter (525/50 nm) using Hamamatsu C13440 (Orca Flash 4.0) sCMOS camera. z stack (13 × 1 um steps, 200msec. exposure/step) was acquired once every 300 s for each of the 9 well-separated areas across the cell culture sample, and maximum intensity projection (NIS software) was used to flatten Z-stacks for analysis as well as image and movie preparation (ImageJ).
Comet assay
Comet assay was performed using Comet Assay Electrophoresis Systems following manufacturer’s instructions (Trevigen) with some modifications.59,88 Brd4KO, WT or WT Cells treated with ARV-825 were synchronized by serum starvation in serum-free DMEM medium for 24 h, and subsequently harvested, washed, and suspended in ice-cold PBS at 2.0 × 10⁵ cells/mL. LMAgarose (Trevigen) at 37°C was added to suspended cells at a ratio of 10:1 (v/v), and the mixture was spread over sample area of comet slides (Trevigen). Slides were kept in dark at 4°C for 10 min.
For comet assays under neutral conditions, slides were then immersed in neutral lysis solution (10 mM Tris-HCl, pH7.5, 1% Triton X-100, 2.5 M NaCl, 0.1 M EDTA), and equilibrated in electrophoresis buffer (0.5× TBE). Electrophoresis was in 0.5× TBE at 21 V for 15 min at 4°C. Then, slides were immersed in DNA precipitation solution (6.7 mL of 7.5 M NH4Ac, 43.3 mL of 95% EtOH) for 30 min, followed in 70% EtOH for 30 min. Slides were dried at 37°C for 10–15 min. The DNA was stained with SYBR-Gold in 10 mL of TE buffer (10 mM Tris-CL, 1 mM EDTA, pH8) for 30 min at room temperature. Slides were briefly rinsed with dH2O and dried at 37°C. Comet images were captured with Zeiss 880 confocal microscope with 40X water 1.2NA objective.
For comet assays under alkaline conditions, slides were immersed in alkaline lysis solution (10 mM Tris-HCl, pH 9.5, 2.5 M NaCl, 0.1 M EDTA, 1% Triton X-100) for 18 h at 4°C, and equilibrated in electrophoresis buffer (0.2 M NaOH, 1 mM EDTA) for 20 min at 4°C. Electrophoresis was performed in 0.2 M NaOH, 1 mM EDTA at 21 V for 15 min at 4°C. After electrophoresis, slides were washed twice in dH2O for 5 min and 70% ethanol for 5 min then dried at 37°C for 30 min. The DNA was stained with SYBR-Gold in 10 mL of TE buffer (10 mM Tris-CL, 1 mM EDTA, pH8) for 30 min at room temperature. Slides were briefly rinsed with dH2O and dried at 37°C. Comet images were captured with Zeiss 880 confocal microscope with 40X water 1.2NA objective. Tail moments were determined using ImageJ software with open comet plugin.32,89
Quantification and statistical analysis
Statistical analysis
Graphpad Prism 9.3.1 was used for all statistical analyses of cell progression (Figures 1D, 5E, S5A, and S5C) and apoptosis assay (Figure S1H) during cell cycle. Statistical tests used, number of 3 replicates (and p values are described in figures, text and figure legends. Significance was calculated using unpaired t test.
Graphpad Prism 9.3.1 was also used for all statistical analyses of imaging data, Living cell imaging (Figures 5A, 5F, and S5E), Nocodazole induced mitotic arrest (Figure 5B), Immunoassaying of H3pS10 (Figure 5C), γH2AX, S9.6 and RNase digestion (Figures 6, S6A, S6D, and S6E). Statistical tests used, significance was calculated using unpaired t test or using Mann-Whitney test.
RNA-seq data normalization was conducted using the FPKM method for within-sample comparisons, and the TMM method was applied for among-sample normalization in RNA-Seq data analysis. Then the differentially expressed genes were analyzed by Limma pipeline with +/−2 fold and p-value of 0.05 (Figures 2A and S2D). Pathway and GO analyses were performed by Gene GO web porta (https://portal.genego.com/cgi/data_manager.cgi).
Acknowledgments
The authors thank J. Cooper, D. Singer, C. Wu (NCI) for advice, discussions, and critical reading of the manuscript. We thank Dr. Crouch and Uehara for providing instrument and information for comet assays. We also thank Paula Maia for technical assistance, members of the Ozato lab for technical advice. This work was supported by the NICHD Intramural programs ZIA HD008015-13.
Author contributions
K.O. conceived the study, steered the project along with T.W. T.W. performed FACS, RNA-seq, ChIPseq, RT-qPCR, immunoblot, and immunostaining for H2AX and S9.6, time lapse imaging and analyses and comet assay. H.H. carried out S and G2/M block study. X.C. analyzed RNA-seq data. M.B. and R.P. analyzed ChIP-seq data. J.W. conducted time lapse imaging and analyses. C.C. performed apoptosis assay. A.D. performed ARV-825 treated cells, immunostaining for H3pS10, pATR, ATM, cell fixation, and nuclease treatment and comet assay. F.K. worked in WI38 cell and performed parallel work as in MEFs. S.C. performed and analysis with core histone proteins and immunoblot for H3pS10. H.X. helped with analysis of core histone proteins and gave general guidance throughout the work. T.W. and K.O. prepared figures and wrote the manuscript.
Declaration of interests
All authors declare no competing financial interests.
Published: April 30, 2024
Footnotes
Supplemental information can be found online at https://doi.org/10.1016/j.isci.2024.109797.
Supplemental information
References
- 1.Dey A., Ellenberg J., Farina A., Coleman A.E., Maruyama T., Sciortino S., Lippincott-Schwartz J., Ozato K. A Bromodomain Protein, MCAP, Associates with Mitotic Chromosomes and Affects G2-to-M Transition. Mol. Cell Biol. 2000;20:6537–6549. doi: 10.1128/mcb.20.17.6537-6549.2000. [DOI] [PMC free article] [PubMed] [Google Scholar]
- 2.Wu S.Y., Chiang C.M. The double bromodomain-containing chromatin adaptor Brd4 and transcriptional regulation. J. Biol. Chem. 2007;282:13141–13145. doi: 10.1074/jbc.R700001200. [DOI] [PubMed] [Google Scholar]
- 3.Dey A., Chitsaz F., Abbasi A., Misteli T., Ozato K. The double bromodomain protein Brd4 binds to acetylated chromatin during interphase and mitosis. Proc. Natl. Acad. Sci. USA. 2003;100:8758–8763. doi: 10.1073/pnas.1433065100. [DOI] [PMC free article] [PubMed] [Google Scholar]
- 4.Kanno T., Kanno Y., LeRoy G., Campos E., Sun H.W., Brooks S.R., Vahedi G., Heightman T.D., Garcia B.A., Reinberg D., et al. BRD4 assists elongation of both coding and enhancer RNAs by interacting with acetylated histones. Nat. Struct. Mol. Biol. 2014;21:1047–1057. doi: 10.1038/nsmb.2912. [DOI] [PMC free article] [PubMed] [Google Scholar]
- 5.Jang MK M.K., Zhou M., Jeong H.S., Brady J.N., Ozato K. The Bromodomain Protein Brd4 Is a Positive Regulatory Component of P-TEFb and Stimulates RNA Polymerase II-dependent Transcription. Mol. Cell. 2005;19:523–534. doi: 10.1016/j.molcel.2005.06.027. [DOI] [PubMed] [Google Scholar]
- 6.Whyte W.A., Orlando D.A., Hnisz D., Abraham B.J., Lin C.Y., Kagey M.H., Rahl P.B., Lee T.I., Young R.A. Master transcription factors and mediator establish super-enhancers at key cell identity genes. Cell. 2013;153:307–319. doi: 10.1016/j.cell.2013.03.035. [DOI] [PMC free article] [PubMed] [Google Scholar]
- 7.Pelish HE L.B., Nitulescu I.I., Tangpeerachaikul A., Poss Z.C., Da Silva D.H., Caruso B.T., Arefolov A., Fadeyi O., Christie A.L., Du K., et al. Mediator kinase inhibition further activates super-enhancer-associated genes in AML. Nature. 2015;526:273–276. doi: 10.1038/nature14904. [DOI] [PMC free article] [PubMed] [Google Scholar]
- 8.Devaiah B.N., Case-Borden C., Gegonne A., Hsu C.H., Chen Q., Meerzaman D., Dey A., Ozato K., Singer D.S. BRD4 is a histone acetyltransferase that evicts nucleosomes from chromatin. Nat. Struct. Mol. Biol. 2016;23:540–548. doi: 10.1038/nsmb.3228. [DOI] [PMC free article] [PubMed] [Google Scholar]
- 9.Devaiah B.N., Singer D.S. Two faces of brd4: mitotic bookmark and transcriptional lynchpin. Transcription. 2013;4:13–17. doi: 10.4161/trns.22542. [DOI] [PMC free article] [PubMed] [Google Scholar]
- 10.Hnisz D., Abraham B.J., Lee T.I., Lau A., Saint-André V., Sigova A.A., Hoke H.A., Young R.A. Super-Enhancers in the Control of Cell Identity and Disease. Cell. 2013;155:934–947. doi: 10.1016/j.cell.2013.09.053. [DOI] [PMC free article] [PubMed] [Google Scholar]
- 11.Lovén J.,H.H., Lin C.Y., Lau A., Orlando D.A., Vakoc C.R., Bradner J.E., Lee T.I., Young R.A. Selective Inhibition of Tumor Oncogenes by Disruption of Super-Enhancers. Cell. 2013;153:320–334. doi: 10.1016/j.cell.2013.03.036. [DOI] [PMC free article] [PubMed] [Google Scholar]
- 12.Whyte G.F., Vilar R., Woscholski R. Molecular recognition with boronic acids-applications in chemical biology. J. Chem. Biol. 2013;6:161–174. doi: 10.1007/s12154-013-0099-0. [DOI] [PMC free article] [PubMed] [Google Scholar]
- 13.Dey A Y.W., Gegonne A., Nishiyama A., Pan R., Yagi R., Grinberg A., Finkelman F.D., Pfeifer K., Zhu J., Singer D., et al. BRD4 directs hematopoietic stem cell development and modulates macrophage inflammatory responses. EMBO J. 2019;38 doi: 10.15252/embj.2018100293. [DOI] [PMC free article] [PubMed] [Google Scholar]
- 14.Houzelstein D B.S., Lynch D.E., Grigorieva E.F., Wilson V.A., Beddington R.S. Growth and Early Postimplantation Defects in Mice Deficient for the Bromodomain-Containing Protein Brd4. Mol. Cell Biol. 2002;22:3794–3802. doi: 10.1128/MCB.22.11.3794-3802.2002. [DOI] [PMC free article] [PubMed] [Google Scholar]
- 15.Nishiyama A D.A., Miyazaki J., Ozato K. Brd4 Is Required for Recovery from Antimicrotubule Drug-induced Mitotic Arrest: Preservation of Acetylated Chromatin□D. Mol. Cell. Biol./ 2006;17:814–823. doi: 10.1091/mbc.e05-08-0729. [DOI] [PMC free article] [PubMed] [Google Scholar]
- 16.Shi J., Vakoc C.R. The mechanisms behind the therapeutic activity of BET bromodomain inhibition. Mol. Cell. 2014;54:728–736. doi: 10.1016/j.molcel.2014.05.016. [DOI] [PMC free article] [PubMed] [Google Scholar]
- 17.Filippakopoulos P., Bradner J.E., Qi J., Picaud S., Shen Y., Smith W.B., Fedorov O., Morse E.M., Keates T., Hickman T.T., et al. Selective inhibition of BET bromodomains. Nature. 2010;468:1067–1073. doi: 10.1038/nature0950. [DOI] [PMC free article] [PubMed] [Google Scholar]
- 18.Delmore J.E., Issa G.C., Lemieux M.E., Rahl P.B., Shi J., Jacobs H.M., Kastritis E., Gilpatrick T., Paranal R.M., Qi J., et al. BET bromodomain inhibition as a therapeutic strategy to target c-Myc. Cell. 2011;146:904–917. doi: 10.1016/j.cell.2011.08.017. [DOI] [PMC free article] [PubMed] [Google Scholar]
- 19.Zuber J.,S.J., Wang E., Rappaport A.R., Herrmann H., Sison E.A., Magoon D., Qi J., Blatt K., Wunderlich M., Taylor M.J., et al. RNAi screen identifies Brd4 as a therapeutic target in acute myeloid leukaemia. Nature. 2011;478:524–528. doi: 10.1038/nature10334. [DOI] [PMC free article] [PubMed] [Google Scholar]
- 20.White ME F.J., Carson WE. 3rd. Emerging roles of and therapeutic strategies targeting BRD4 in cancer. Cell. Immunol. 2019;337:48–53. doi: 10.1016/j.cellimm.2019.02.001. [DOI] [PMC free article] [PubMed] [Google Scholar]
- 21.Raina K., Lu J., Qian Y., Altieri M., Gordon D., Rossi A.M.K., Wang J., Chen X., Dong H., Siu K., et al. PROTAC-induced BET protein degradation as a therapy for castration-resistant prostate cancer. Proc. Natl. Acad. Sci. USA. 2016;113:7124–7129. doi: 10.1073/pnas.1521738113. [DOI] [PMC free article] [PubMed] [Google Scholar]
- 22.Mochizuki K., Nishiyama A., Jang M.K., Dey A., Ghosh A., Tamura T., Natsume H., Yao H., Ozato K. The bromodomain protein Brd4 stimulates G1 gene transcription and promotes progression to S phase. J. Biol. Chem. 2008;283:9040–9048. doi: 10.1074/jbc.M707603200. [DOI] [PMC free article] [PubMed] [Google Scholar]
- 23.Grant G.D., Brooks L., 3rd, Zhang X., Mahoney J.M., Martyanov V., Wood T.A., Sherlock G., Cheng C., Whitfield M.L. Identification of cell cycle-regulated genes periodically expressed in U2OS cells and their regulation by FOXM1 and E2F transcription factors. Mol. Biol. Cell. 2013;24:3634–3650. doi: 10.1091/mbc.E13-05-0264. [DOI] [PMC free article] [PubMed] [Google Scholar]
- 24.Bertoli C., Skotheim J.M., de Bruin R.A. Control of cell cycle transcription during G1 and S phases. Nat. Rev. Mol. Cell Biol. 2013;14:518–528. doi: 10.1038/nrm3629. [DOI] [PMC free article] [PubMed] [Google Scholar]
- 25.Costa R.H. FoxM1 dances with mitosis. Nat. Cell Biol. 2005;7:108–110. doi: 10.1038/ncb0205-108. [DOI] [PubMed] [Google Scholar]
- 26.Laoukili J., Kooistra M.R.H., Brás A., Kauw J., Kerkhoven R.M., Morrison A., Clevers H., Medema R.H. FoxM1 is required for execution of the mitotic programme and chromosome stability. Nat. Cell Biol. 2005;7:126–136. doi: 10.1038/ncb1217. [DOI] [PubMed] [Google Scholar]
- 27.Blackford A.N., Jackson S.P. ATM, ATR, and DNA-PK: The Trinity at the Heart of the DNA Damage Response. Mol. Cell. 2017;66:801–817. doi: 10.1016/j.molcel.2017.05.015. [DOI] [PubMed] [Google Scholar]
- 28.Kabeche L.,N.H., Buisson R., Zou L.A. A mitosis-specific and R loop–driven ATR pathway promotes faithful chromosome segregation. Science. 2018;359:108–114. doi: 10.1126/science.aan6490. [DOI] [PMC free article] [PubMed] [Google Scholar]
- 29.Saldivar J.C.,H.S., Bocek M.J., Chung M., Bass T.E., Cisneros-Soberanis F., Samejima K., Xie L., Paulson J.R., Earnshaw W.C., Cortez D., et al. An intrinsic S/G2 checkpoint enforced by ATR. Science. 2018;361:806–810. doi: 10.1126/science.aap9346. [DOI] [PMC free article] [PubMed] [Google Scholar]
- 30.Kim J.J., Lee S.Y., Gong F., Battenhouse A.M., Boutz D.R., Bashyal A., Refvik S.T., Chiang C.M., Xhemalce B., Paull T.T., et al. Systematic bromodomain protein screens identify homologous recombination and R-loop suppression pathways involved in genome integrity. Genes Dev. 2019;33:1751–1774. doi: 10.1101/gad.331231.119. [DOI] [PMC free article] [PubMed] [Google Scholar]
- 31.Edwards D.S., Maganti R., Tanksley J.P., Luo J., Park J.J.H., Balkanska-Sinclair E., Ling J., Floyd S.R. BRD4 Prevents R-Loop Formation and Transcription-Replication Conflicts by Ensuring Efficient Transcription Elongation. Cell Rep. 2020;32 doi: 10.1016/j.celrep.2020.108166. [DOI] [PMC free article] [PubMed] [Google Scholar]
- 32.Lam F.C., Kong Y.W., Huang Q., Vu Han T.L., Maffa A.D., Kasper E.M., Yaffe M.B. BRD4 prevents the accumulation of R-loops and protects against transcription-replication collision events and DNA damage. Nat. Commun. 2020;11:4083. doi: 10.1038/s41467-020-17503-y. [DOI] [PMC free article] [PubMed] [Google Scholar]
- 33.Andrikopoulou A., Liontos M., Koutsoukos K., Dimopoulos M.A., Zagouri F. Clinical perspectives of BET inhibition in ovarian cancer. Cell. Oncol. 2021;44:237–249. doi: 10.1007/s13402-020-00578-6. [DOI] [PMC free article] [PubMed] [Google Scholar]
- 34.Kharenko O.A., Patel R.G., Calosing C., van der Horst E.H. Combination of ZEN-3694 with CDK4/6 inhibitors reverses acquired resistance to CDK4/6 inhibitors in ER-positive breast cancer. Cancer Gene Ther. 2022;29:859–869. doi: 10.1038/s41417-021-00375-9. [DOI] [PubMed] [Google Scholar]
- 35.Choi E.H., Yoon S., Park K.S., Kim K.P. The Homologous Recombination Machinery Orchestrates Post-replication DNA Repair During Self-renewal of Mouse Embryonic Stem Cells. Sci. Rep. 2017;7 doi: 10.1038/s41598-017-11951-1. [DOI] [PMC free article] [PubMed] [Google Scholar]
- 36.Hayflick L. The Limited in Vitro Lifetime of Human Diploid Cell Strains. Exp. Cell Res. 1965;37:614–636. doi: 10.1016/0014-4827(65)90211-9. [DOI] [PubMed] [Google Scholar]
- 37.Casella G., Munk R., Kim K.M., Piao Y., De S., Abdelmohsen K., Gorospe M. Transcriptome signature of cellular senescence. Nucleic Acids Res. 2019;47 doi: 10.1093/nar/gkz879. [DOI] [PMC free article] [PubMed] [Google Scholar]
- 38.Wierstra I. The transcription factor FOXM1 (Forkhead box M1): proliferation-specific expression, transcription factor function, target genes, mouse models, and normal biological roles. Adv. Cancer Res. 2013;118:97–398. doi: 10.1016/B978-0-12-407173-5.00004-2. [DOI] [PubMed] [Google Scholar]
- 39.Marzluff W.F., Gongidi P., Woods K.R., Jin J., Maltais L.J. The human and mouse replication-dependent histone genes. Genomics. 2002;80:487–498. [PubMed] [Google Scholar]
- 40.Walczak C.E., Cai S., Khodjakov A. Mechanisms of chromosome behaviour during mitosis. Nat. Rev. Mol. Cell Biol. 2010;11:91–102. doi: 10.1038/nrm2832. [DOI] [PMC free article] [PubMed] [Google Scholar]
- 41.Hargreaves D.C., Horng T., Medzhitov R. Control of inducible gene expression by signal-dependent transcriptional elongation. Cell. 2009;138:129–145. doi: 10.1016/j.cell.2009.05.047. [DOI] [PMC free article] [PubMed] [Google Scholar]
- 42.Nicodeme E., Jeffrey K.L., Schaefer U., Beinke S., Dewell S., Chung C.W., Chandwani R., Marazzi I., Wilson P., Coste H., et al. Suppression of inflammation by a synthetic histone mimic. Nature. 2010;468:1119–1123. doi: 10.1038/nature09589. [DOI] [PMC free article] [PubMed] [Google Scholar]
- 43.Zhang W., Prakash C., Sum C., Gong Y., Li Y., Kwok J.J.T., Thiessen N., Pettersson S., Jones S.J.M., Knapp S., et al. Bromodomain-containing protein 4 (BRD4) regulates RNA polymerase II serine 2 phosphorylation in human CD4+ T cells. J. Biol. Chem. 2012;287:43137–43155. doi: 10.1074/jbc.M112.413047. [DOI] [PMC free article] [PubMed] [Google Scholar]
- 44.Crasta K., Ganem N.J., Dagher R., Lantermann A.B., Ivanova E.V., Pan Y., Nezi L., Protopopov A., Chowdhury D., Pellman D. DNA breaks and chromosome pulverization from errors in mitosis. Nature. 2012;482:53–58. doi: 10.1038/nature10802. [DOI] [PMC free article] [PubMed] [Google Scholar]
- 45.Lewis C.W., Golsteyn R.M. Cancer cells that survive checkpoint adaptation contain micronuclei that harbor damaged DNA. Cell Cycle. 2016;15:3131–3145. doi: 10.1080/15384101.2016.1231287. [DOI] [PMC free article] [PubMed] [Google Scholar]
- 46.Nishiyama A., Dey A., Tamura T., Ko M., Ozato K. Activation of JNK triggers release of Brd4 from mitotic chromosomes and mediates protection from drug-induced mitotic stress. PLoS One. 2012;7 doi: 10.1371/journal.pone.0034719. [DOI] [PMC free article] [PubMed] [Google Scholar]
- 47.Skoufias D.A., DeBonis S., Saoudi Y., Lebeau L., Crevel I., Cross R., Wade R.H., Hackney D., Kozielski F. S-trityl-L-cysteine is a reversible, tight binding inhibitor of the human kinesin Eg5 that specifically blocks mitotic progression. J. Biol. Chem. 2006;281:17559–17569. doi: 10.1074/jbc.M511735200. [DOI] [PubMed] [Google Scholar]
- 48.Santaguida S., Amon A. Short- and long-term effects of chromosome mis-segregation and aneuploidy. Nat. Rev. Mol. Cell Biol. 2015;16:473–485. doi: 10.1038/nrm4025. [DOI] [PubMed] [Google Scholar]
- 49.Wei Y., Yu L., Bowen J., Gorovsky M.A., Allis C.D. Phosphorylation of histone H3 is required for proper chromosome condensation and segregation. Cell. 1999;97:99–109. doi: 10.1016/s0092-8674(00)80718-7. [DOI] [PubMed] [Google Scholar]
- 50.Liu Y., Nielsen C.F., Yao Q., Hickson I.D. The origins and processing of ultra fine anaphase DNA bridges. Curr. Opin. Genet. Dev. 2014;26:1–5. doi: 10.1016/j.gde.2014.03.003. [DOI] [PubMed] [Google Scholar]
- 51.Williams R.M., Zhang X. Roles of ATM and ATR in DNA double strand breaks and replication stress. Prog. Biophys. Mol. Biol. 2021;161:27–38. doi: 10.1016/j.pbiomolbio.2020.11.005. [DOI] [PubMed] [Google Scholar]
- 52.Floyd S.R., Pacold M.E., Huang Q., Clarke S.M., Lam F.C., Cannell I.G., Bryson B.D., Rameseder J., Lee M.J., Blake E.J., et al. The bromodomain protein Brd4 insulates chromatin from DNA damage signalling. Nature. 2013;498:246–250. doi: 10.1038/nature12147. [DOI] [PMC free article] [PubMed] [Google Scholar]
- 53.Donati B., Lorenzini E., Ciarrocchi A. BRD4 and Cancer: going beyond transcriptional regulation. Mol. Cancer. 2018;17:164. doi: 10.1186/s12943-018-0915-9. [DOI] [PMC free article] [PubMed] [Google Scholar]
- 54.Zhang J., Dulak A.M., Hattersley M.M., Willis B.S., Nikkilä J., Wang A., Lau A., Reimer C., Zinda M., Fawell S.E., et al. BRD4 facilitates replication stress-induced DNA damage response. Oncogene. 2018;37:3763–3777. doi: 10.1038/s41388-018-0194-3. [DOI] [PMC free article] [PubMed] [Google Scholar]
- 55.Barrows J.K., Lin B., Quaas C.E., Fullbright G., Wallace E.N., Long D.T. BRD4 promotes resection and homology-directed repair of DNA double-strand breaks. Nat. Commun. 2022;13:3016. doi: 10.1038/s41467-022-30787-6. [DOI] [PMC free article] [PubMed] [Google Scholar]
- 56.Bonner W.M., Redon C.E., Dickey J.S., Nakamura A.J., Sedelnikova O.A., Solier S., Pommier Y. GammaH2AX and cancer. Nat. Rev. Cancer. 2008;12:957–967. doi: 10.1038/nrc2523. [DOI] [PMC free article] [PubMed] [Google Scholar]
- 57.Collins P.L., Purman C., Porter S.I., Nganga V., Saini A., Hayer K.E., Gurewitz G.L., Sleckman B.P., Bednarski J.J., Bassing C.H., Oltz E.M. DNA double-strand breaks induce H2Ax phosphorylation domains in a contact-dependent manner. Nat. Commun. 2020;11:3158. doi: 10.1038/s41467-020-16926-x. [DOI] [PMC free article] [PubMed] [Google Scholar]
- 58.Ostling O., Johanson K.J. Microelectrophoretic study of radiation-induced DNA damages in individual mammalian cells. Biochem. Biophys. Res. Commun. 1984;123:291–298. doi: 10.1016/0006-291x(84)90411-x. [DOI] [PubMed] [Google Scholar]
- 59.Olive P.L., Banáth J.P. The comet assay: a method to measure DNA damage in individual cells. Nat. Protoc. 2006;1:23–29. doi: 10.1038/nprot.2006.5. [DOI] [PubMed] [Google Scholar]
- 60.Sollier J., Cimprich K.A. Breaking bad: R-loops and genome integrity. Trends Cell Biol. 2015;25:514–522. doi: 10.1016/j.tcb.2015.05.003. [DOI] [PMC free article] [PubMed] [Google Scholar]
- 61.Hegazy Y.A., Fernando C.M., Tran E.J. The balancing act of R-loop biology: The good, the bad, and the ugly. J. Biol. Chem. 2020;295:905–913. doi: 10.1074/jbc.REV119.011353. [DOI] [PMC free article] [PubMed] [Google Scholar]
- 62.Niehrs C., Luke B. Regulatory R-loops as facilitators of gene expression and genome stability. Nat. Rev. Mol. Cell Biol. 2020;21:167–178. doi: 10.1038/s41580-019-0206-3. [DOI] [PMC free article] [PubMed] [Google Scholar]
- 63.Crossley M.P., Bocek M., Cimprich K.A. R-Loops as Cellular Regulators and Genomic Threats. Mol. Cell. 2019;73:398–411. doi: 10.1016/j.molcel.2019.01.024. [DOI] [PMC free article] [PubMed] [Google Scholar]
- 64.Bou-Nader C., Bothra A., Garboczi D.N., Leppla S.H., Zhang J. Structural basis of R-loop recognition by the S9.6 monoclonal antibody. Nat. Commun. 2022;13:1641. doi: 10.1038/s41467-022-29187-7. [DOI] [PMC free article] [PubMed] [Google Scholar]
- 65.Smolka J.A., Sanz L.A., Hartono S.R., Chédin F. Recognition of RNA by the S9.6 antibody creates pervasive artifacts when imaging RNA:DNA hybrids. J. Cell Biol. 2021;220 doi: 10.1083/jcb.202004079. [DOI] [PMC free article] [PubMed] [Google Scholar]
- 66.Sollier J., Stork C.T., García-Rubio M.L., Paulsen R.D., Aguilera A., Cimprich K.A. Transcription-coupled nucleotide excision repair factors promote R-loop-induced genome instability. Mol. Cell. 2014;56:777–785. doi: 10.1016/j.molcel.2014.10.020. [DOI] [PMC free article] [PubMed] [Google Scholar]
- 67.Baranello L., Wojtowicz D., Cui K., Devaiah B.N., Chung H.J., Chan-Salis K.Y., Guha R., Wilson K., Zhang X., Zhang H., et al. RNA Polymerase II Regulates Topoisomerase 1 Activity to Favor Efficient Transcription. Cell. 2016;165:357–371. doi: 10.1016/j.cell.2016.02.036. [DOI] [PMC free article] [PubMed] [Google Scholar]
- 68.Lima W.F., Murray H.M., Damle S.S., Hart C.E., Hung G., De Hoyos C.L., Liang X.H., Crooke S.T. Viable RNaseH1 knockout mice show RNaseH1 is essential for R loop processing, mitochondrial and liver function. Nucleic Acids Res. 2016;44:5299–5312. doi: 10.1093/nar/gkw350. [DOI] [PMC free article] [PubMed] [Google Scholar]
- 69.Cristini A., Tellier M., Constantinescu F., Accalai C., Albulescu L.O., Heiringhoff R., Bery N., Sordet O., Murphy S., Gromak N. RNase H2, mutated in Aicardi-Goutieres syndrome, resolves co-transcriptional R-loops to prevent DNA breaks and inflammation. Nat. Commun. 2022;13:2961. doi: 10.1038/s41467-022-30604-0. [DOI] [PMC free article] [PubMed] [Google Scholar]
- 70.Promonet A., Padioleau I., Liu Y., Sanz L., Biernacka A., Schmitz A.L., Skrzypczak M., Sarrazin A., Mettling C., Rowicka M., et al. Topoisomerase 1 prevents replication stress at R-loop-enriched transcription termination sites. Nat. Commun. 2020;11:3940. doi: 10.1038/s41467-020-17858-2. [DOI] [PMC free article] [PubMed] [Google Scholar]
- 71.Saha S., Yang X., Huang S.Y.N., Agama K., Baechler S.A., Sun Y., Zhang H., Saha L.K., Su S., Jenkins L.M., et al. Resolution of R-loops by topoisomerase III-beta (TOP3B) in coordination with the DEAD-box helicase DDX5. Cell Rep. 2022;40 doi: 10.1016/j.celrep.2022.111067. [DOI] [PMC free article] [PubMed] [Google Scholar]
- 72.Dunphy W.G. TopBP1 comes into focus. Mol. Cell. 2021;81:1126–1127. doi: 10.1016/j.molcel.2021.02.027. [DOI] [PubMed] [Google Scholar]
- 73.Frattini C., Promonet A., Alghoul E., Vidal-Eychenie S., Lamarque M., Blanchard M.P., Urbach S., Basbous J., Constantinou A. TopBP1 assembles nuclear condensates to switch on ATR signaling. Mol. Cell. 2021;81:1231–1245.e8. doi: 10.1016/j.molcel.2020.12.049. [DOI] [PubMed] [Google Scholar]
- 74.Williams A.B., Schumacher B. p53 in the DNA-Damage-Repair Process. Cold Spring Harb. Perspect. Med. 2016;6 doi: 10.1101/cshperspect.a026070. [DOI] [PMC free article] [PubMed] [Google Scholar]
- 75.Engeland K. Cell cycle regulation: p53-p21-RB signaling. Cell Death Differ. 2022;29:946–960. doi: 10.1038/s41418-022-00988-z. [DOI] [PMC free article] [PubMed] [Google Scholar]
- 76.Ray Chaudhuri A., Nussenzweig A. The multifaceted roles of PARP1 in DNA repair and chromatin remodelling. Nat. Rev. Mol. Cell Biol. 2017;18:610–621. doi: 10.1038/nrm.2017.53. [DOI] [PMC free article] [PubMed] [Google Scholar]
- 77.Menon V., Povirk L. Involvement of p53 in the repair of DNA double strand breaks: multifaceted Roles of p53 in homologous recombination repair (HRR) and non-homologous end joining (NHEJ) Subcell. Biochem. 2014;85:321–336. doi: 10.1007/978-94-017-9211-0_17. [DOI] [PMC free article] [PubMed] [Google Scholar]
- 78.Mashimo M., Onishi M., Uno A., Tanimichi A., Nobeyama A., Mori M., Yamada S., Negi S., Bu X., Kato J., et al. The 89-kDa PARP1 cleavage fragment serves as a cytoplasmic PAR carrier to induce AIF-mediated apoptosis. J. Biol. Chem. 2021;296 doi: 10.1074/jbc.RA120.014479. [DOI] [PMC free article] [PubMed] [Google Scholar]
- 79.Ye X., Wei Y., Nalepa G., Harper J.W. The cyclin E/Cdk2 substrate p220(NPAT) is required for S-phase entry, histone gene expression, and Cajal body maintenance in human somatic cells. Mol. Cell Biol. 2003;23:8586–8600. doi: 10.1128/mcb.23.23.8586-8600.2003. [DOI] [PMC free article] [PubMed] [Google Scholar]
- 80.Nizami Z., Deryusheva S., Gall J.G. The Cajal body and histone locus body. Cold Spring Harbor Perspect. Biol. 2010;2 doi: 10.1101/cshperspect.a000653. [DOI] [PMC free article] [PubMed] [Google Scholar]
- 81.Gunjan A., Paik J., Verreault A. The emergence of regulated histone proteolysis. Curr. Opin. Genet. Dev. 2006;16:112–118. doi: 10.1016/j.gde.2006.02.010. [DOI] [PubMed] [Google Scholar]
- 82.Marzluff W.F., Koreski K.P. Birth and Death of Histone mRNAs. Trends Genet. 2017;33:745–759. doi: 10.1016/j.tig.2017.07.014. [DOI] [PMC free article] [PubMed] [Google Scholar]
- 83.Behera V., Stonestrom A.J., Hamagami N., Hsiung C.C., Keller C.A., Giardine B., Sidoli S., Yuan Z.F., Bhanu N.V., Werner M.T., et al. Interrogating Histone Acetylation and BRD4 as Mitotic Bookmarks of Transcription. Cell Rep. 2019;27:400–415.e5. doi: 10.1016/j.celrep.2019.03.057. [DOI] [PMC free article] [PubMed] [Google Scholar]
- 84.Patel M.C., Debrosse M., Smith M., Dey A., Huynh W., Sarai N., Heightman T.D., Tamura T., Ozato K. BRD4 coordinates recruitment of pause release factor P-TEFb and the pausing complex NELF/DSIF to regulate transcription elongation of interferon-stimulated genes. Mol. Cell Biol. 2013;33:2497–2507. doi: 10.1128/MCB.01180-12. [DOI] [PMC free article] [PubMed] [Google Scholar]
- 85.Sarai N., Nimura K., Tamura T., Kanno T., Patel M.C., Heightman T.D., Ura K., Ozato K. WHSC1 links transcription elongation to HIRA-mediated histone H3.3 deposition. EMBO J. 2013;32:2392–2406. doi: 10.1038/emboj.2013.176. [DOI] [PMC free article] [PubMed] [Google Scholar]
- 86.Galgano P.J., Schildkraut C.L. G1/S Phase Synchronization using Double Thymidine Synchronization. CSH Protoc. 2006;2006 doi: 10.1101/pdb.prot4487. [DOI] [PubMed] [Google Scholar]
- 87.Abmayr S.M., Yao T., Parmely T., Workman J.L. Preparation of nuclear and cytoplasmic extracts from mammalian cells. Curr. Protoc. Mol. Biol. 2006;12 doi: 10.1002/0471142727.mb1201s75. Unit 12.1. [DOI] [PubMed] [Google Scholar]
- 88.Uehara R., Cerritelli S.M., Hasin N., Sakhuja K., London M., Iranzo J., Chon H., Grinberg A., Crouch R.J. Two RNase H2 Mutants with Differential rNMP Processing Activity Reveal a Threshold of Ribonucleotide Tolerance for Embryonic Development. Cell Rep. 2018;25:1135–1145.e5. doi: 10.1016/j.celrep.2018.10.019. [DOI] [PMC free article] [PubMed] [Google Scholar]
- 89.Gyori B.M., Venkatachalam G., Thiagarajan P.S., Hsu D., Clement M.V. OpenComet: an automated tool for comet assay image analysis. Redox Biol. 2014;2:457–465. doi: 10.1016/j.redox.2013.12.020. [DOI] [PMC free article] [PubMed] [Google Scholar]
Associated Data
This section collects any data citations, data availability statements, or supplementary materials included in this article.