

Abstract
Proteoforms, which arise from post-translational modifications, genetic polymorphisms and RNA splice variants, play a pivotal role as drivers in biology. Understanding proteoforms is essential to unravel the intricacies of biological systems and bridge the gap between genotypes and phenotypes. By analysing whole proteins without digestion, top-down proteomics (TDP) provides a holistic view of the proteome and can decipher protein function, uncover disease mechanisms and advance precision medicine. This Primer explores TDP, including the underlying principles, recent advances and an outlook on the future. The experimental section discusses instrumentation, sample preparation, intact protein separation, tandem mass spectrometry techniques and data collection. The results section looks at how to decipher raw data, visualize intact protein spectra and unravel data analysis. Additionally, proteoform identification, characterization and quantification are summarized, alongside approaches for statistical analysis. Various applications are described, including the human proteoform project and biomedical, biopharmaceutical and clinical sciences. These are complemented by discussions on measurement reproducibility, limitations and a forward-looking perspective that outlines areas where the field can advance, including potential future applications.
Introduction
The central dogma of biology describes the flow of information from DNA to processed mRNA and finally proteins, which are the primary effectors of biological function1,2. Numerous proteoforms lead to a vast range of chemically diverse protein families. Proteoforms occur due to post-translational modifications (PTMs), RNA splice variants and genetically defined amino acid sequences, including genetic polymorphisms2 (Fig. 1a). As a result, a comprehensive knowledge of proteoforms is essential to understand biological systems and establish the link between genotypes and phenotypes3. However, the number of possible proteoforms greatly exceeds the number of genes, presenting an analytical challenge4.
Fig. 1 |. Proteoforms and the top-down approach.
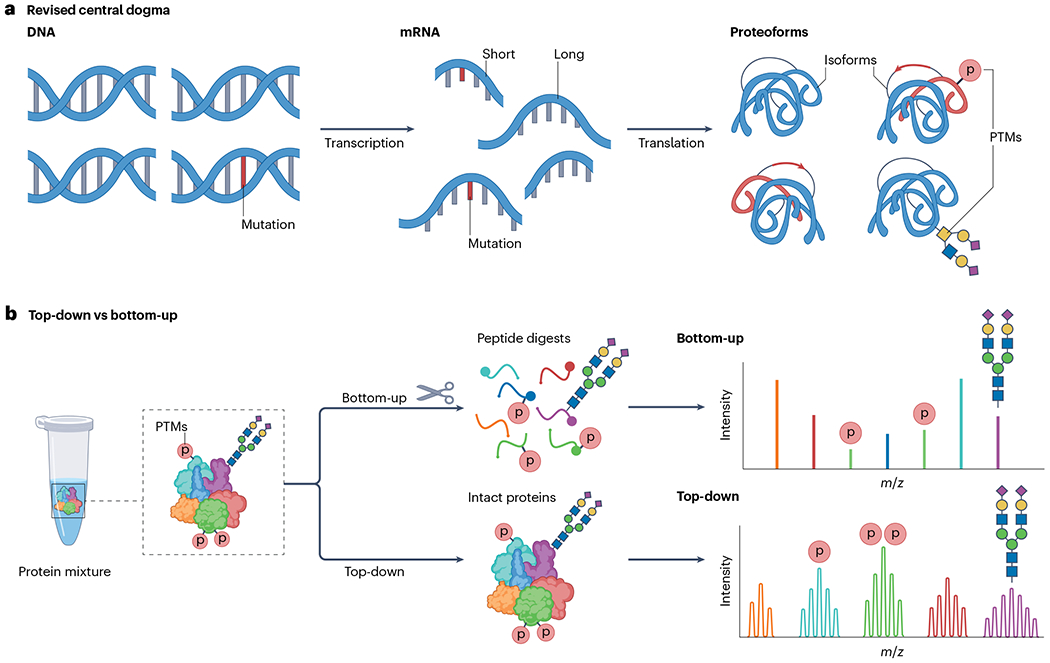
a, A revised central dogma of biology describing the flow of information from DNA to RNA, and, after processing, from RNA to mRNA and finally protein. Genetic variations, alternative splicing and post-translational modifications (PTMs) can form many proteoforms, all originating from the same gene. b, Illustration of the conventional bottom-up proteomics approach that analyses peptides obtained from protein digests and the alternative top-down proteomics approach that analyses intact proteins. The red p represents protein phosphorylation.
Top-down proteomics (TDP) has emerged as the most powerful experimental strategy for comprehensive analysis of proteoforms5–8. The base experiment is top-down mass spectrometry (TDMS)9, which analyses intact proteins without digestion to provide a holistic view of the proteoforms. Importantly, unlike intact mass spectrometry10, a TDMS experiment requires both an accurate intact molecular mass measurement (top) and controlled fragmentation of the gas-phase molecule (down). Top-down sequencing was challenging until electrospray ionization (ESI) and matrix-assisted laser desorption/ionization (MALDI) could be sufficiently used for tandem mass spectrometry (MS/MS or MS2) measurements. Although MALDI-MS can fragment intact protein ions, the multiply charged ions generated by ESI are more effectively dissociated in tandem mass spectrometry to produce sequence-informative product ions11. A variation of TDMS, termed native TDMS (nTDMS)12,13, performs both ionization and backbone cleavage in a way that maintains higher order structure. The ability of nTDMS to yield sequence information directly from protein complexes is enhanced by using electron-based fragmentation methods, such as electron capture dissociation (ECD)14,15, and ultraviolet photodissociation (UVPD)16,17. Native mass spectrometry18 and nTDMS are now a viable complement to traditional structural biology tools and are starting to be applied more broadly in biopharmaceutical research19.
The alternative to TDP, bottom-up proteomics (BUP), involves extensive proteolysis to yield peptides that are typically <3 kDa. BUP is currently used more widely than TDP as peptides are easier to separate, ionize and fragment than proteins. There is also a greater technological maturity and more established informatics tools for BUP20. However, there is an intrinsic limitation of BUP owing to the peptide-to-protein inference problem, as only a limited number of peptides are detected per protein, with generally low protein sequence coverage. This leads to a loss in proteoform information and connectivity when mapping sequence variations and PTMs1,3,21,22. Another limitation of BUP is an inability to infer different combinations of modifications on various proteoforms. Capturing this combinatorial information is important to understand proteoform function and regulation (Fig. 1b). Consequently, BUP is not optimal for profiling the complete repertoire of proteoforms23.
By contrast, TDP forgoes protein digestion and analyses the intact protein directly to achieve unambiguous, proteoform-resolved molecular details. This enables accurate protein identification, PTM localization and quantification for different proteoforms. The top-down strategy (Fig. 2) starts by measuring the intact protein mass. As modifications change the molecular mass of the protein, TDP can inherently capture proteoform information. Subsequent fragmentation of intact proteins identifies the protein and all its modifications, as well as any correlations that exist between modifications24. Classically, the three basic pillars of TDP25 are front-end sample preparation; top-down mass spectral data acquisition of the intact mass and corresponding fragmentation; and informatics for proteoform identification, characterization and quantification (Fig. 2). In a typical TDP experiment, proteins are separated through either offline fractionation coupled with direct infusion mass spectrometry26 or online separation27. For example, online separation could use liquid chromatography (LC) or capillary electrophoresis (CE) with MS/MS detection27. This type of setup was used to map intact proteoforms with a 4D separation system and identified 1,043 gene products from human cells dispersed over 3,000 proteoforms28.
Fig. 2 |. The pillars of top-down proteomics.
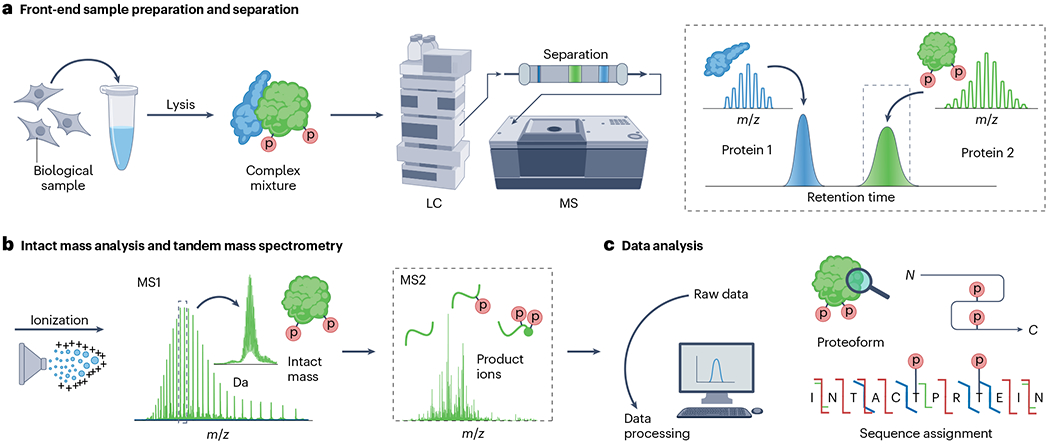
a, Front-end sample preparation including sample fractionation; in this example, a protein mixture is separated by liquid chromatography (LC). The resulting separated proteins are analysed by high-resolution mass spectrometry (MS) for intact mass measurement (the top portion) and then fragmented (the down portion) to obtain proteoform sequence-informative product ions. b, Data analysis and database searching are performed on the resulting tandem mass spectra for proteoform identification, characterization and quantification. The red p represents protein phosphorylation.
A final requirement in the TDP workflow is software to compare experimental TDP data with possible protein sequences. Without databases of sequenced genomes, BUP as it is currently used would not exist. The same is true for TDP. Multiple tools have been developed for large-scale TDP projects involving direct fragmentation of intact protein ions24,29,30. Current TDP platforms are largely the same as originally established. However, advances in sensitivity and efficiency for all TDP components – sample preparation, separation/fractionation, ionization, mass analysis, ion dissociation and bioinformatics – enable exceptional breadth and depth. An example of this was the identification of approximately 30,000 unique proteoforms expressed from human genes across 21 cell types and plasma from human blood and bone marrow31.
This Primer focuses on the methodology of TDP. Experimental approaches required for TDP are described, as well as key issues related to sample preparation, proteoform separation and identification and data acquisition and processing. Example applications of TDP are described to show current capabilities and highlight the challenges of extending the technology in the future.
Experimentation
Sample preparation and controls
Sample preparation is a critical step for TDP (Fig. 3a). Traditionally, protein extraction methods use Good’s buffers, which have high salt concentrations (>100 mM), protease and phosphatase inhibitors and surfactants, such as sodium dodecyl sulfate (SDS) or Triton X-100 for total protein solubilization32. These conventional reagents are often incompatible with TDP because they can interfere with protein ion detection and suppress the mass spectrometry signal. As a result, they must be removed for high-quality data. Incompatible salts and small molecules can be removed by ultracentrifugation filters or replaced using size exclusion chromatography (SEC) spin columns. The broader term buffer exchange is sometimes used to refer to solvent replacement. However, this is an inaccurate term for TDP workflows, which often require complete removal of buffer salts or other solution stabilizing agents, rather than a simple exchange. A protocol describing typical biological buffers, standardized sample preparation and performance benchmarks was developed from a best practices and benchmark study by the Consortium for TDP (CTDP)33. TDP performance can be evaluated using a standard intact protein mixture containing ubiquitin, myoglobin, trypsinogen and carbonic anhydrase, established by the National Resource for Translational and Developmental Proteomics. Care should be taken to minimize the introduction of artefactual proteoform changes during sample preparation. For example, protease and phosphatase inhibitors are commonly included in the extraction buffers to minimize in vitro protein degradation and dephosphorylation, respectively34. Temperature-sensitive protein modifications, such as oxidation, should always be considered during TDP experiments. Samples should be handled at low temperatures (~4 °C) to slow the rate of any modification processes35.
Fig. 3 |. Top-down proteomics sample preparation.
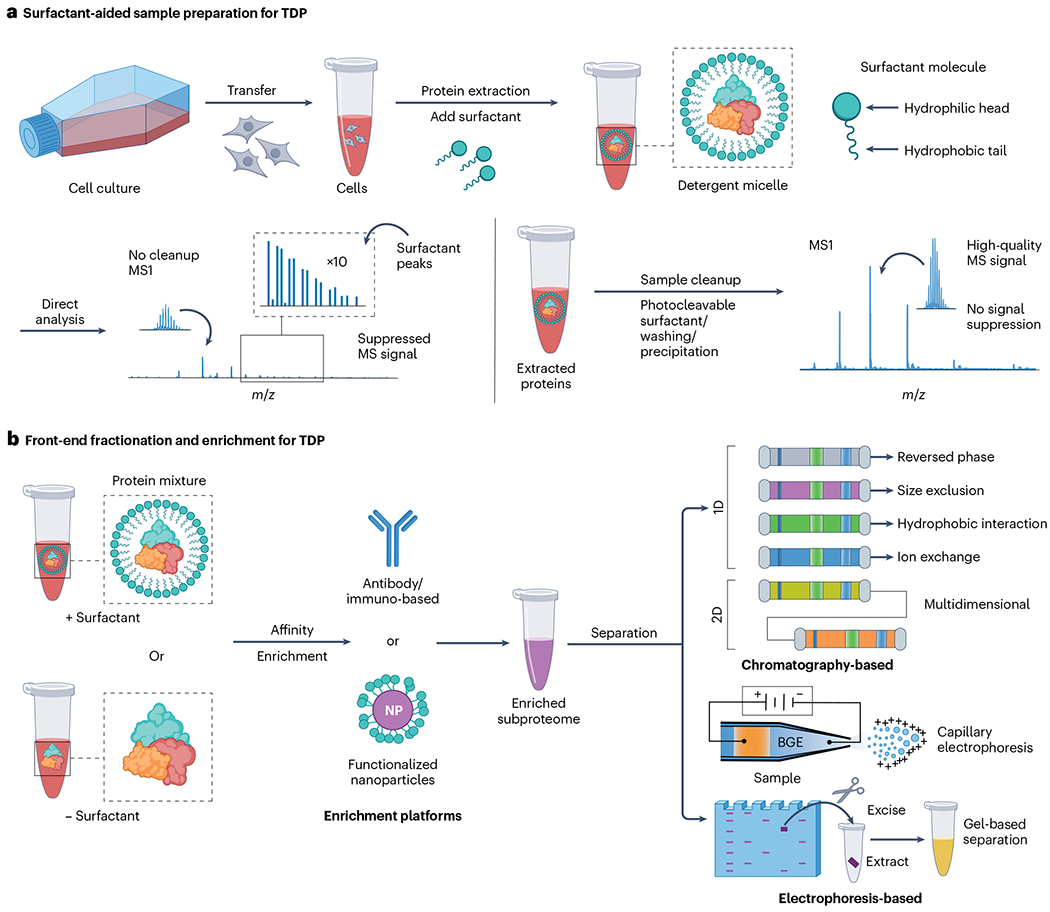
a, General surfactant-aided sample preparation methods for top-down proteomics (TDP). Surfactant-aided preparation typically proceeds by extracting proteins from a biological sample using a chaotropic buffer with a surfactant to efficiently solubilize proteins and yield a complex protein mixture. Without additional cleanup, top-down mass spectrometry (MS) signals suffer from immense signal suppression, leading to low-quality data. With proper sample cleanup using either wash methods, MS-compatible surfactants or protein precipitation methods, high-quality top-down MS data can be acquired. b, Illustration of front-end fractionation and enrichment strategies for TDP. Protein-containing samples are first extracted using a chaotropic buffer with or without (indicated by +/− in the illustration) surfactant. Affinity-based enrichment with antibodies or functionalized nanoparticles (NPs) is often used to enrich specific protein targets or protein families from a complex lysate to give an enriched subproteome. Front-end fractionation of the starting lysate and the enriched subproteome are performed using chromatographic methods – such as reversed-phase liquid chromatography, size exclusion chromatography, hydrophobic interaction chromatography, ion-exchange chromatography or multidimensional liquid chromatography – or electrophoresis-based methods, for instance, capillary electrophoresis or gel-based separation. BGE refers to the background electrolyte used in capillary electrophoresis.
Surfactants are often used for general biological sample preparation and can facilitate cell permeabilization and solubilization of hydrophobic membrane proteins36–38. However, surfactants are a particular challenge for downstream mass spectrometry analysis owing to signal suppression39. Protein precipitation methods, which usually involve a chloroform/methanol mixture or acetone, can remove surfactants and other mass spectrometry-incompatible contaminants40–42. However, protein precipitation methods can be time-consuming and may lead to protein loss, experimental variability or solubilization challenges41,43. Cleavable surfactants have been developed – such as Rapigest44, ProteaseMAX45 and MaSDeS46 – that are acid-labile and compatible with BUP after acid degradation. However, these acid-labile surfactants are not directly compatible with TDP. To address this, a photocleavable surfactant, 4-hexylphenylazosulfonat, was developed, referred to as Azo47. Azo can effectively solubilize proteins, including membrane proteins, with performance comparable to SDS and rapidly degrades on exposure to ultraviolet radiation. Photodegradation of Azo requires ultraviolet B irradiation (maximal absorbance ~305 nm), rather than the conventional ultraviolet C (254 nm), plus additives – such as isopropanol, l-methionine and tri(2-carboxyethyl) phosphine – to prevent protein precipitation and radical-induced oxidation47. Surfactant-aided TDP workflows require careful sample handling steps and future optimization will enhance the depth of coverage, especially for the membrane proteome48. For instance, a non-ionic, redox-cleavable surfactant, n-decyl-disulfide-β-d-maltoside, was developed as a mass spectrometry-compatible surfactant that mimics the properties of n-dodecyl-β-d-maltoside to facilitate protein solubilization, in particular for membrane proteins49.
Front-end fractionation and enrichment strategies (Fig. 3b and Table 1) can selectively isolate subproteomes to capture and enrich low-abundance proteins from intricate biological samples before mass spectrometry analysis50,51. Organelle fractionation is performed by differential centrifugation. This captures most subcellular components, including nuclear, cytosolic, mitochondrial and mixed microsomal – Golgi, endoplasmic reticulum, other vesicles and plasma membrane – fractions52. Proteins can be extracted from subcellular fractions for the downstream mass spectrometry-based proteomic analysis. For example, a TDP study of a mitochondrial fraction identified 347 mitochondrial proteins with comprehensive profiling of proteoforms specific to organelle targets53. An alternative approach is to use affinity-based enrichment methods, traditionally with antibodies for protein capture and quantification51,54,55. Antibody-based affinity purification has been favoured for targeted analysis of intact proteins and protein complexes56,57. However, it has major limitations, such as challenges in generating highly specific antibodies, limited availability of high-quality antibodies, batch-to-batch antibody variability, relatively low stability and high costs58–61. To address these challenges, surface-functionalized multivalent superparamagnetic nanoparticles were designed as a versatile affinity platform for highly specific capture and enrichment of low-abundance proteoforms. This approach is based on nanoparticles being functionalized with an appropriate affinity reagent62–65. For example, superparamagnetic nanoparticles functionalized with a multivalent ligand specific to phosphate groups have a high specificity for global capture of phosphoproteins62–64. Another example is an integrated nanoproteomics method that combines peptide-functionalized nanoparticles with TDP to enrich and analyse cardiac troponin I – a gold-standard biomarker for cardiac injury – directly from serum to uncover proteoform–pathophysiology relationships65,66. However, functionalized nanoparticles specific to TDP are not yet broadly commercially available. Engineered nanoparticles with tunable nanobiological interactions have been developed for deep plasma BUP; however, they have not yet been applied to TDP67,68.
Table 1 |.
Summary of various top-down proteomics-compatible front-end enrichment strategies
| Technique | Description | Useful for |
|---|---|---|
| Chromatography-based separation | ||
| Reversed-phase liquid chromatography (RPLC) | A separation method using a nonpolar stationary phase and polar mobile phase for biomolecule separation based on hydrophobic interactions | Separation of denatured intact proteins for offline sample fractionation or online separation before mass spectrometry. A high-resolution separation applicable to most top-down proteomics (TDP) samples |
| Size exclusion chromatography (SEC) | Chromatographic separation of proteins based on their apparent hydrodynamic size. Conventionally, protein molecular mass is used as an estimate or analogue for size | Separation of native and/or denatured proteins with different molecular masses. Also used to fractionate a complex protein mixture into specific bins based on a range of sizes. Low resolution compared with other methods |
| Hydrophobic interaction chromatography (HIC) | Based on reversible interactions between hydrophobic protein surface regions and weakly hydrophobic ligands in the stationary phase. A high salt buffer is used to separate proteins based on hydrophobicity. A decreasing salt concentration gradient is used to elute bound proteins from low to high hydrophobicity | Under suitable conditions, HIC can preserve native protein structures and separate aggregated protein species from lower oligomeric states. HIC is also commonly used for antibody purifications |
| Ion-exchange chromatography (IEX) | Uses a charged stationary phase for separation based on the protein net charge. Depending on the buffer and protein isoelectric point (pI), positively charged proteins are separated with a negatively charged stationary phase (cation exchange) at pH < pI, whereas negatively charged proteins are separated with a positively charged stationary phase (anion exchange) at pH > pI | Separation of native and/or denatured proteins and protein purification. Used for downstream processing of antibodies and separation of highly charged proteins or protein mixtures with abundant charged species. IEX is commonly used to purify histidine-tagged proteins |
| Multidimensional liquid chromatography | Interface of two or more columns to incorporate multiple separation modalities based on different retention mechanisms to increase separation dimensionality and enhance analyte separation | Separation of complex mixtures with distinct chemical retentivities or separation selectivities. Examples include RPLC × RPLC, IEX × RPLC, HIC × RPLC, hydrophilic interaction chromatography (HILIC) × RPLC and SEC × RPLC |
| Affinity-based enrichment | ||
| Antibody | A protein produced by the immune system capable of binding to specific antigens with high affinity | A reliable, low toxicity approach for enriching protein targets when high-quality antibodies are available and validated. Also used for native protein purification. Antibodies and their epitopes can be engineered to enhance target specificity but can have batch-to-batch reproducibility issues |
| Nanoparticles | Inorganic, organic or hybrid synthetic nanomaterials that can be functionalized for various biological applications | Used for highly specific and efficient enrichment when functionalized with specific affinity ligands. Can be modified with pan-selective ligands for broader enrichment specificity. Useful for native protein purification. Cost-effective, efficient and reproducible from batch-to-batch |
| Electrophoresis-based separation | ||
| Capillary electrophoresis | Involves separation of charged molecules in a narrow capillary tube under the influence of an electric field | High-sensitivity separation of protein mixtures from low starting sample amounts. Can suffer from low sample loading capacity compared with RPLC |
| Gel separation/extraction | Separation of proteins by polyacrylamide gel-based fractionation, typically based on protein molecular mass. Involves one or more modifications to the conventional sodium dodecyl sulfate–polyacrylamide gel electrophoresis (SDS–PAGE) approach | Simple and reproducible method for partitioning protein mixtures into discrete mass ranges by SDS–PAGE. Proteins separated on gel can be resolved for TDP by gel-eluted liquid fraction entrapment electrophoresis or passively eluting proteins from polyacrylamide gels as intact species for mass spectrometry |
Equipment
The top-down approach requires three major steps (Fig. 2b): ionization to produce gas-phase ions from the protein of interest that can be transported in the mass spectrometer; intact mass analysis of the ionized protein by MS1 (the top portion) and intact gas-phase fragmentation to generate sequence-informative product ions (the down portion)8 by MS2; and data processing, including database searching, for proteoform identification, characterization and quantification. As TDP is performed on protein mixtures, the workflow typically requires analyte separation. Direct infusion, which involves introducing the analyte solution directly to the mass spectrometer, can be used for TDP69. Although methods for TDP by MALDI have been explored70,71, TDP is conventionally performed with ESI9. Early TDP experiments relied on single-quadrupole and triple-quadrupole (Q and QqQ, respectively) mass spectrometers for intact protein analysis72,73. These systems have poor mass resolving power, making charge state determination difficult, and limited mass-to-charge (m/z) range resulting in lower applicability to large proteins. High mass resolving power is particularly important for TDP, as fragment ions produced from intact proteins can generate convoluted mass spectra, in which various ions with different charge states can partially overlap. Many modern mass spectrometry instruments can reliably achieve high resolving power, including Fourier transform mass spectrometry systems, such as ion cyclotron resonance (FTICR)74 and Orbitrap75 mass spectrometers, as well as time-of-flight (TOF) and quadrupole TOF (QTOF) instruments76.
Intact protein separations
The proteome complexity presents a substantial challenge for TDP, requiring separation of intact proteins before mass spectrometry analysis5. This challenge is particularly pronounced when dealing with larger proteins (≥30 kDa) because, as protein size increases, ion signals in ESI mass spectra rapidly decrease77. To address this issue, deep proteome profiling with TDP first separates intact proteins78. Early demonstrations used gel-electrophoresis-based fractionation techniques, such as gel-eluted liquid fraction entrapment electrophoresis79 or 2D gel electrophoresis80. One example, termed the integrative approach, involves front-end 2D gel electrophoresis separation of complex protein mixtures, followed by in-gel extraction and LC–MS/MS analysis81. Another example is the virtual 2D gel mass spectrometry platform, which combines high-resolution isoelectric focusing with immobilized pH gradient polyacrylamide gels to separate complex protein mixtures. These mixtures are then incubated with a MALDI matrix and analysed by MALDI MS directly from the matrix-embedded dry gels, referred to as xerogels82. A recent method – passively eluting proteins from polyacrylamide gels as intact species for mass spectrometry (PEPPI-MS) – was developed as a TDP-compatible front-end separation approach for size-based proteome fractionation83. Although PEPPI-MS is promising for enhancing proteoform coverage, further optimization is needed to improve protein recovery rates for large-scale proteomics analysis. Serial SEC was developed as an online or offline technique to separate smaller proteoforms from larger ones. Using serial SEC followed by reversed-phase LC (RPLC) enables detection of proteoforms up to 223 kDa on a QTOF mass spectrometer84,85.
Advances in chromatographic stationary phases, liquid chromatographs and new column chemistry have improved the resolution and efficiency of intact protein separations5,86,87. Compatibility of the mobile phase with ESI is crucial when developing new separation methods88. To stabilize the protein tertiary structure and optimize separation selectivity, techniques such as hydrophobic interaction chromatography (HIC)89 and ion-exchange chromatography (IEX)90 require high concentrations of buffer salt in the mobile phase. Conventional non-volatile buffers – such as sulfate, phosphate or citrate salts – are typically used in HIC and IEX89,91–93. Direct online coupling of HIC and IEX with TDMS was demonstrated, using the volatile buffer ammonium acetate for TDP analysis90,94.
Despite the rapid growth of new intact protein separation modalities, no single modality can fully resolve all species in a proteome of interest. Multidimensional liquid chromatography (MDLC) presents opportunities to increase resolution by combining multiple separation modalities for TDP95,96. Two-dimensional LC, coupling HIC and RPLC, can greatly enhance the range of separable proteins in an Escherichia coli cell lysate92. A 3D LC approach, coupling HIC–IEX–RPC – offline first-dimension HIC and second-dimension IEX separation, before third-dimension online RPLC-MS – showed a 14-fold improvement in protein identifications compared with 2D IEX–RPLC-MS93. However, offline MDLC methods are time-consuming and labourintensive. It is expected that MDLC coupled with automation will lead to exciting new approaches, such as active solvent modulation and stationary-phase-assisted modulation97,98.
Recent developments in CE–MS enable it to be used as both a denaturing and non-denaturing separation technique for TDP99–103. The orthogonality of separation selectivity to conventional LC–MS methods, low sample volume requirements and commercial systems make CE–MS an attractive technique for TDP104–106. Alongside the increasing array of liquid-phase separation methods, gas-phase ion mobilities can also be used to separate intact proteins107–109. Ion mobility spectroscopy (IMS) is based on the gas-phase transport properties of a molecule in the presence of an electric field and its rotationally averaged collision cross-sections (CCSs). The CCS is a unique physical property that captures information related to individual conformers in the population of gas-phase structures. CCS can be related to molecular conformation and structural dynamics110. IMS has expanded to include new techniques and devices. Drift tube ion mobility spectrometry involves ion separation under a uniform electric field that propagates through a buffer gas drift region. Trapped ion mobility spectrometry uses radially confining radiofrequency voltages and an axial electric field to counteract the drag force from a gas flow to trap and release ions according to their mobility. Field asymmetric ion mobility spectrometry (FAIMS) separates ions in a carrier gas by their behaviour in strong and weak electric fields under atmospheric pressure. Differential mobility spectrometry performs ion separation under atmospheric pressure with a similar operating principle to FAIMS, but using a different electrode geometry. Travelling wave ion mobility spectrometry uses an oscillating electric field to produce a set of voltage waves that pushes ions through a drift gas towards the mass analyser110. High-resolution IMS is promising for fast separation of proteoforms, with a high level of sequence homology. For example, travelling wave ion mobility spectrometry with pervasive charge solvation was integrated with TDMS to analyse chemically derivatized native-like protein ions with greatly improved TDMS sequencing111. Trapped ion mobility spectrometry was shown to be effective for characterizing complex glycoproteins by TDMS112,113, and FAIMS was shown to enhance TDP coverage in complex protein mixtures114–116.
Tandem mass spectrometry techniques
Tandem mass spectrometry (MS/MS) is a powerful analytical technique used to identify and characterize molecules. It usually involves two consecutive stages of mass spectrometry to elucidate the identity and structure of a molecule. In TDP, MS/MS typically involves analysing intact proteins by selecting a precursor protein ion, dissociating it into smaller fragment ions and analysing the fragment ions to derive the primary structure and modifications of a protein. Mass spectrometers used for TDP tend to be hybrid instruments, in which precursor ion selection (MS1) is followed by measurement of product ions generated by fragmentation of the precursor (MS2) (Fig. 4a). Such instruments could be tandem in space designs – such as hybrid QTOF and quadrupole Orbitrap platforms with two separate mass analysers – or tandem in time designs, such as ion traps that perform MS1, MS2 and higher MSn in the same mass analyser.
Fig. 4 |. Tandem mass spectrometry techniques for top-down proteomics.
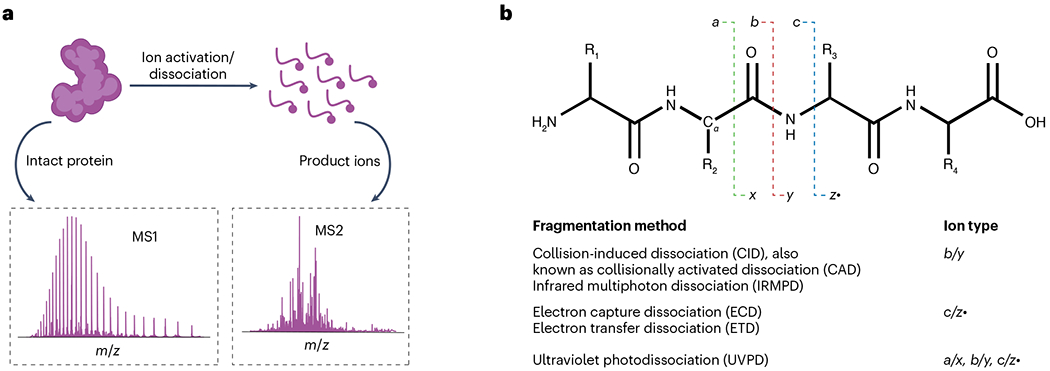
a, Illustration of the process of an intact protein undergoing ionization/dissociation events in a mass spectrometer to yield various fragment ions. The corresponding intact protein precursor ion spectrum (MS1) and product ion spectrum (MS2) are shown for the beginning and end stages of the process. b, Peptide backbone fragmentation scheme showing selected tandem mass spectrometric techniques. Fragment ion nomenclature is depicted with a, x, b, y, c, z· notation depending on the specific cleavage along the amino acid backbone. Various fragment ion types are shown for the common tandem mass spectrometry (MS/MS or MS2) methods used in top-down proteomics.
Various activation/dissociation methods are available to generate product ions (Fig. 4b). Most instruments can perform collision-induced dissociation (CID), also known as collisionally activated dissociation, to generate backbone b-/y-ions (Fig. 4b) through collisional activation from interactions with neutral gas molecules, such as N2 or argon. Infrared multiphoton dissociation involves the absorption of low-energy infrared photons to produce b-/y-ions and potentially generate secondary and higher order fragment ions upon the absorption of multiple photons to yield more extensive protein sequence information117,118. Historically, TDMS used CID to fragment protein ions9, either through a formal MS2 process from a precursor ion or through in-source fragmentation of all ions at the atmosphere–vacuum interface73. CID processes usually generate enough product ions for identification, but the depth of sequence coverage may not be sufficient for unequivocal proteoform identification of, for example, PTMs. Electron-based dissociation methods (ExD)119, such as ECD15 and electron-transfer dissociation (ETD)120, are often better than CID at generating high sequence coverage. ExD leads to c-/z·-products that can be used for confident proteoform characterization and PTM localization. More complex tandem mass spectra are generated by UVPD using 193 nm or 213 nm lasers121, with sequence coverage comparable to or higher than ExD methods. Tribrid platforms, combining a quadrupole mass filter, linear ion trap and Orbitrap, can perform proton transfer charge reduction (PTCR) to simplify product ion spectra122. PTCR reduces the product ion charge states, pushing product ions to higher m/z, owing to a lower z, and reducing overlap with other product ions at a similar m/z but different z values.
Data collection
Generally, TDP analyses multiple proteins that could coelute at similar chromatographic times, convoluting the mass spectrometry analysis. The number of MS2 spectra that can be collected depends on the peak width of the separation technique and the spectrometer duty cycle; the amount of time the mass spectrometer is actively acquiring data in a given instrument setting. Key considerations for data acquisition involve selecting appropriate high-resolution instrumentation and methods to provide suitable peak resolution, analytical separation, sensitivity and depth of coverage for tandem mass spectra. Such evaluation steps are essential to improve the downstream calculation of accurate intact masses and resolve proteoforms with unusual and combinatorial PTMs, or single amino acid substitutions not easily separated by chromatography. The goal is to obtain unit mass resolution across the entire observed mass range123 and isotopically resolve each protein molecular ion. The most common TDP data acquisition method is data-dependent acquisition124. In data-dependent acquisition, a full mass spectrometry scan is collected and several precursor ions, usually the most abundant, are selected for fragmentation53. Data-independent acquisition methods125, which involve fragmentation of a mass spectrometry scan without precursor ion isolation, are being rapidly developed and adopted in BUP workflows126 and offer exciting opportunities for TDP.
Results
Raw data interpretation and visualization
TDP data sets are rich in information but have a high level of complexity. As a result, analysis and interpretation can be a challenge for new-comers127. Accounting for the effects of isotopes and charge states on instrument signal to noise (S/N), in addition to the high dynamic range (108–1012) and broad mass range of the human proteome77,128, makes intact protein spectra complicated to analyse and detection of low-abundance proteins difficult (Fig. 5a). Unlike mass spectra of smaller biomolecules or peptides, in which the most abundant isotopologue typically corresponds to the monoisotopic mass – the sum of the atom masses based on the most abundant isotope for each element – proteins have complex isotopic envelopes, often without an observable monoisotopic peak (Fig. 5b). Spectral deconvolution is a critical step to simplify TDP data by converting a complex isotope and charge state distribution to a single monoisotopic mass129–135. For isotopically resolved spectra, collected with sufficient resolution for various possible isotopic peaks of a molecule to be observed, most tools rely on the Averagine model129 to deisotope and predict theoretical isotopic distributions. Predictions are then fit to experimental isotopic envelopes to extrapolate a monoisotopic mass. Mass spectra are acquired continuously across an LC gradient and precursor ions are often represented by multiple charge states. As a result, additional information from extracted ion current chromatograms and multiple charge state peaks can aid spectral deconvolution131,133,135. When spectra are not isotopically resolved, spectral deconvolution can use multiple charge state ions to derive the average neutral mass of a proteoform136.
Fig. 5 |. Fundamental concepts in protein analysis by top-down proteomics.

a, The effects of protein size on mass spectrometry signal to noise (S/N) and charge state distribution under electrospray ionization. A histogram of protein molecular masses for all known proteins in the human proteome is shown. The plot was created using 20,423 entries for Homo sapiens using the UniProt Knowledgebase released on 21 April 2023, and the bin size is 500 Da. Illustration of the decay in S/N as a function of increasing mass resulting from the increasing number of charge states observed for electrosprayed protein ions with the average protein mass (55 kDa) annotated. A typical top-down mass spectrum obtained for a 10 kDa protein under electrospray ionization with all charge states annotated. The most abundant charge state is given by z = 11+. b, Example of the differences in isotopologue distribution between a small (3.4 kDa) and large (45.9 kDa) protein. For sufficiently large protein ions, the monoisotopic mass is no longer observed and the difference between the most abundant and average mass decreases. The monoisotopic mass is the sum of the masses of the atoms in a molecule using the principal (most abundant) isotope for each element, also known as the exact mass. The nominal mass is the sum of masses of the closest integer value of the most abundant mass of an atom. The average mass is the sum of the masses of the atoms from their respective weighted averages. The average mass of a compound is sometimes referred to as the relative molecular mass, denoted by Mr. The most abundant mass is the mass of the highest abundance peak in the entire isotopic cluster.
The greater complexity of TDP spectra requires specialized interpretation and processing software to extract molecular information. Continuous efforts aim to develop standardized file formats for storing mass spectrometry data137–139. The most universal file format is mzML (latest version 1.1.1)138, an XML format supported by the Human Proteome Organization Proteomics Standards Initiative (HUPO-PSI). Several open-source software libraries can convert, read and write mass spectrometry file formats, including ProteoWizard140, JmzML141, mzJava142 and pymzML143. Many open-source visualization tools developed for BUP can be used for TDP, such as BatMass144 and OpenMS145, but there are also open-source tools developed explicitly for TDP data visualization, including MASH Explorer/MASH Native146,147 and TopMSV148. In addition, instrument manufacturers and third-party companies offer commercial tools to directly process vendor file formats or convert files into mzML or another open-source format149.
Data analysis
A TDP data analysis pipeline begins with top-down mass spectral pre-processing and deconvolution, which generates deconvolved mass spectra for proteoform spectrum matches (PrSMs). The next step involves searching the deconvolved mass spectra against a protein or proteoform sequence database to identify proteoforms with a false discovery rate (FDR) control and characterize PTMs. Finally, proteoform abundances are quantified and differentially abundant proteoforms between samples are identified. TDP workflows are often separated into two experiment types: targeted workflows, where an individual or set of proteins with a priori knowledge is used to inform measurement and analysis; or discovery workflows, where little-to-no information is known about the possible proteoforms and modification states.
There are several approaches for proteoform sequence database construction. As proteoforms from a biological sample often contain various alterations – such as gene mutations, alternative splicing events and PTMs2 – building a database that accurately reflects proteoforms in the sample is essential for high-sensitivity proteoform identification150. The most common approach is to directly use protein sequence databases from UniProt151, RefSeq152, GENCODE153 or related resources. However, these sources only contain reference sequences and do not include proteoforms with various alterations. PTM annotations in protein knowledgebases and variable PTMs have been used to build proteoform sequence databases154. Combining many PTMs or alteration sites leads to a combinatorial explosion of the search space, making it impractical to add all combinations to a database. To address this challenge, the number of PTM/alteration combinations can be constrained or all possible combinations of PTMs can be represented using graphs155. Alternatively, DNA or RNA-seq data can be used to build proteoform sequence databases with sample-specific gene mutations and alternative splicing events150.
Matching mass spectra and candidate proteoforms typically starts with a fast filtering method to reduce the number of candidates from thousands to tens156. After this, a slower matching method is used to determine a match score between the mass spectrum and candidate proteoform from the first step154. Many filtering methods have been developed for TDP spectral identification156. When matching reference sequences, the precursor mass from tandem mass spectrometry is matched to the molecular masses of proteoforms, or proteoform fragments, in the database. When variable PTMs are included, a multinotch search157 is used, which allows multiple precursor mass differences. When unexpected mass shifts are allowed, the most common approaches include sequence tags158, open search strategy159,160 and an unmodified protein fragment approach161. Proteoform candidates reported by filtering methods are aligned with the spectrum to identify proteoforms with variable PTMs or unexpected mass shifts162. Alignment algorithms for top-down mass spectra originated from BUP163 and many variations exist131,155,162,164. For example, the number of atoms replaces residue masses in MSPathFinder131, and the alignment between a mass spectrum and candidate proteoforms with variable PTMs is allowed in TopMG155.
Proteoform identification and characterization
Understanding the functional role of proteoforms requires identification and characterization3. Unlike BUP, which uses a limited number of peptides as a proxy for proteins based on partial sequence information, TDP analyses whole proteins. Consequently, TDP offers a comprehensive insight into the proteoform landscape, enabling proteoform identification, novel proteoform discovery and in-depth sequence characterization5,32,34,124. TDP has unique strengths, as it can characterize combinatorial PTMs alongside the isoforms encoded by different genes in a multigene family, which often have high sequence homology165,166. For example, sarcomere proteins have diverse isoforms and PTMs, such as N-terminal di-methylation, acetylation, phosphorylation and methylation. Proteoform variations from individual muscle cells can be investigated by TDP, enabling proteomics to be integrated with functional properties165. In a practical example, TDP was used to investigate the expression of ventricular isoform myosin light chain 2 (MLC2v), a critical cardiac regulatory protein167. MLC2v is considered the standard isoform marker of ventricular specification and is commonly used to assess human stem-cell-derived cardiomyocyte cultures. However, unlike previous genomic annotations for heart chamber specificity of MLC2, TDP revealed that MLC1v, but not MLC2v, exhibits ventricular-restricted expression. When multiple PTMs are present on a single protein molecule, TDP is the only technique that can resolve the complex proteoforms and combinatorial PTMs168. For example, histones are highly modified structural proteins associated with DNA. Histones have many PTMs – acetylation, methylation, phosphorylation and ubiquitylation – and are present as multiple isoforms169. TDP is a crucial tool to decipher histone proteoform complexity and quantitatively describe molecular stoichiometries, such as connecting combinatorial histone H4 – an essential regulator of all eukaryotic DNA-templated processes – PTMs with potential biological functions170,171. A recent example applied Nuc-MS as a top-down technique to characterize whole nucleosomes and unravel the histone code172. This approach can quantify histone variants and their PTMs with results highly concordant with chromatin immunoprecipitation sequencing.
Proteoform quantification
TDP can quantitatively analyse proteoform changes in response to changes in the environment, disease state and differential cellular development in biological pathways173. Similar to BUP, three distinct quantitative approaches have been developed for TDP (Fig. 6): label-free, in which proteoforms are quantified using proteoform intensity174,175; isotope labelling, in which proteoforms are quantified by differential isotope labelling176–178; and chemical labelling, in which proteoforms are quantified with a chemical reporter, typically at the MS2 level173. The advantages of label-free quantification are simplicity, high throughput and adaptability to most experiments and sample types179,180. Label-free quantification can be applied to any protein sample and facilitates analysis of highly complex samples. Additionally, label-free quantitation can be used with direct infusion or online separation techniques such as LC or CE181–183. Many studies have demonstrated the accuracy and reproducibility of the label-free approach175,180,184–187. For example, a label-free top-down LC–MS quantification method was developed to simultaneously quantify protein expression based on extracted ion chromatograms and PTMs derived from relative quantification in the mass spectra188. The results aligned well with western blot conclusions, demonstrating that TDP can offer an antibody-independent approach to quantify intact proteins and modified proteoforms188.
Fig. 6 |. Overview of top-down proteomics quantification methods.
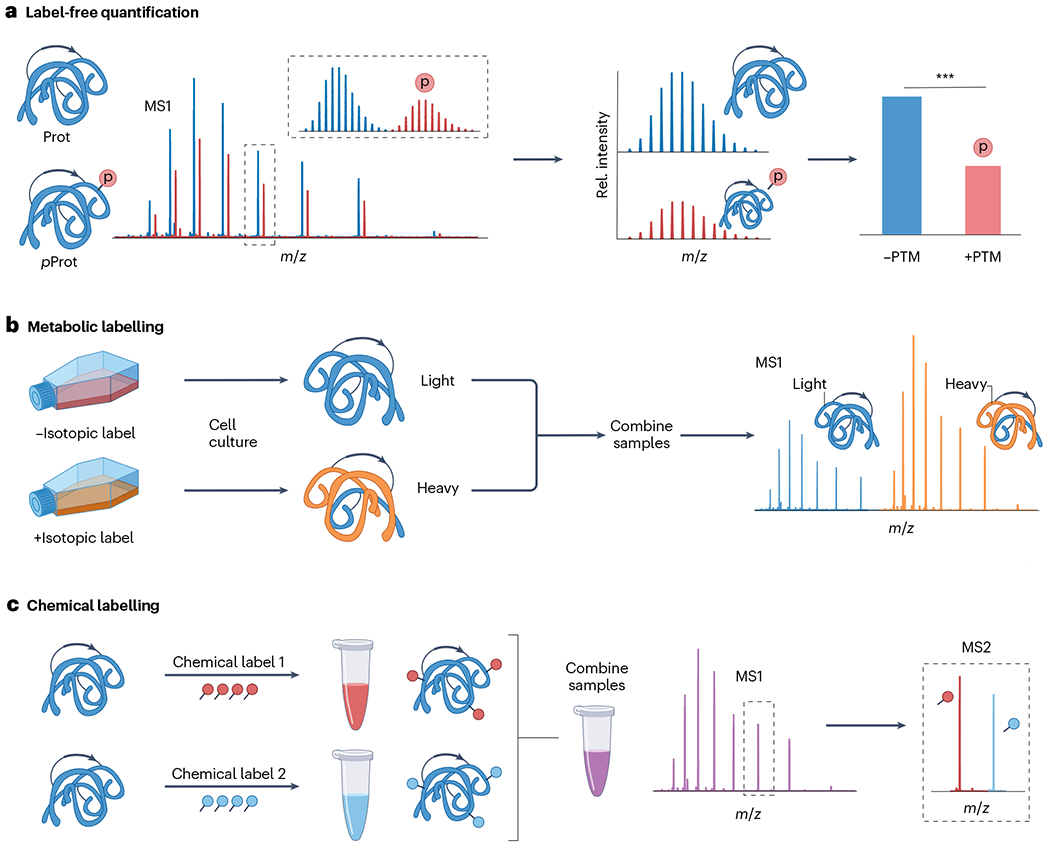
a, Label-free quantification, which relatively compares the mass spectral signal abundance of various proteoforms between individual liquid chromatography–mass spectrometry (MS) runs. b, Metabolic labelling, including isotopic labelling of proteins in vitro, for comparative MS1 quantification of proteoforms expressed by cells cultured under various conditions. c, Chemical labelling strategies, which involve covalently modifying proteins at specific amino acid residues, generally Lys residues, and the N-terminal domain. Typically, tandem mass tag labelling is used and quantification is performed at the MS2 level. The red p represents protein phosphorylation. PTM, post-translational modification.
Label-free quantification involves identifying mass features, calculating intensities and making relative comparisons. Online LC–MS/MS typically has a low duty cycle. Common practice is to generate proteoform libraries by combining all LC–MS/MS analyses or conducting additional experiments to maximize the identification of quantifiable proteoforms. The identification of mass features is performed by comparing to a proteoform library using mass measurement accuracy and LC retention time. In TDP with ESI, intact proteoforms will often contain multiple charge states77. As a result, combining the ion intensities of multiple charge states can enhance the accuracy of intact proteoform quantification175,180. This process can be accomplished through various deconvolution algorithms, including open-source – MS-Deconv+ (ref. 134), TopFD135, THRASH129, ProMex189, Xtract190, Mesh191, ICR-2LS192, Mascot193 and FLASHDeconv133 – and commercially available software. To minimize variation between runs, intensities are normalized based on the total ion current levels of each LC–MS run194. Quality control and sample blank runs are also included in TDP workflows to ensure that variations in the detected features are not due to the system. Label-free TDP has been widely applied to quantify proteins from several or single cells195–197.
Although label-free quantification is the most applied quantification method in TDP, isobaric chemical tag labelling is the gold standard for BUP, as it enables multiplexing for improved throughput and lower run-to-run variation. Previously, isobaric chemical tag labelling of intact proteins was limited to individually purified proteins and simple protein mixtures198–200, and application to complex protein mixtures, such as whole cell lysates, was challenging owing to protein aggregation and insufficient labelling. However, recent optimizations enable better labelling of complex protein lysates. For example, tandem mass tag labelling of intact complex protein mixtures can be achieved by enrichment of low-molecular-mass proteins (<30 kDa)201, optimization of chemical labelling parameters177 and optimization of CID and high-energy collisional dissociation fragmentation energies202.
Other labelling techniques – such as stable isotope labelling by amino acids (SILAC)203, isobaric and pseudoisobaric tags199,204,205 and NeuCode SILAC206 – have shown potential for quantitative TDP. For example, an intact-mass strategy with NeuCode SILAC was used to determine lysine count in the elucidation of proteoform families207,208. Isobaric chemical tag labelling enables relative quantification by measuring reporter ions that are fragmented during MS2. However, as mass feature identification is also performed at the MS2 level, the fragmentation energy required for quantification and identification often requires careful optimization.
Statistical analysis and error calculations
TDP software tools evaluate the similarity between a tandem mass spectrum and a candidate proteoform by assigning a numeric score to reflect the degree of matching, a measure of how well the fragment data match the identified protein sequence. Typically, a P value – the probability that an annotated PrSM between a mass spectrum and protein sequence from a randomized database is within a specified threshold – or E value – the expected number of PrSMs in a specified threshold between a mass spectrum and protein sequence from a randomized database – is provided. These values indicate the probability of randomly obtaining the observed number of matching fragment ions by chance, considering the total number of proteoforms interrogated for PrSMs209. Poison models154, generating function approach131,161 and Markov chain Monte Carlo210 methods have been used to compute E values of proteoform identifications. FDRs of identified PrSMs – the ratio of false positives to the number of total positive PrSM identifications – are usually estimated using the target-decoy approach, which determines the ratio of identified decoy hits from a shuffled decoy database to target hits from a target database211. A shuffled database is appended to the target database to estimate the Q value, an alternative to the P value that incorporates FDR control and represents the minimum FDR in which a result may be considered statistically significant, which are computed at the PrSM level, proteoform level and intact protein level212. For quantitative TDP analysis, one-way analysis of variance and Student’s t-tests (two-tailed) are commonly used for statistical analysis166,187,213. Multiple testing adjustment is usually performed using the Benajamini–Hochberg method166. If necessary, non-parametric Kruskal–Wallis one-way analysis of variance and Wilcoxon rank-sum test can be used for group comparisons214. For quantitative TDP of human clinical samples, a linear mixed effects model with random intercept can further characterize heterogeneity among human individuals185.
There are more proteoforms than corresponding genes4, making the search space of potential proteoforms vast. Automated proteoform identification solutions are prone to errors. They frequently mislocalize PTMs, report false cleavages and incorrectly calculate the precursor mass131,211. As a result, users often need to manually validate and refine software results. Modern TDP software solutions, both open source and commercial, are continuously developing rigorous and sophisticated statistical approaches to improve accuracy in the TDP analysis. Accurate proteoform matching involves spectral alignment215 with possible PTMs – TopPIC161, MSPathFinder131, TopMG155 and pTop216 – and statistical significance computed as a P value – for example, in MS-GF+, MS-Align+, TopPIC and MSPathFinder – E value and FDR217. Newer characterization methods, such as C-score and MIscore218,219, have integrated Bayesian approaches to improve proteoform identification and provide a more accurate scoring system. Additionally, there are several emerging TDP software packages for simpler statistical analysis workflows, such as TopPICR220 and Informed-Proteomics131. Visualization of deconvolved TDP data, peak lists and sequence coverage maps is essential for validation and refinement of the TDP analysis and can be achieved with open-source software, including ProSight, LcMsSpectator, TopMSV and MASH Explorer/MASH Native146–148,154,221,222. The identification of differentially expressed proteoforms in TDMS is similar to the identification of differentially expressed genes in the RNA-Seq data analysis. Consequently, many statistical methods developed in transcriptomics – based on Poisson, negative binomial, linear and non-parametric models – can be applied to TDMS, such as Limma, EdgeR and DESeq2 (ref. 223). Similarly, statistical methods developed for BUP, such as MsStats and MaxQuant, can be extended to identify differentially expressed proteoforms in TDP224,225.
Applications
Global proteoform discovery
Improved sample prefractionation methods and robust LC–MS/MS workflows have expanded the application of label-free TDP, enabling the global proteoform analysis of biological samples226. The first discovery-mode global TDP study that mapped intact proteoforms used a 4D separation system28. Recently, proteoform landscapes from five human tissues – lungs, heart, spleen, small intestine and kidneys – were comparatively mapped using a combination of capillary zone electrophoresis (CZE)-MS and RPLC-MS227. Over 11,000 proteoforms were identified, 64% of which were not previously reported227. In another example, the Blood Proteoform Atlas revealed approximately 30,000 unique proteoforms, offering a nuanced understanding of cellular differentiation and demonstrating the clinical potential of TDP31.
Advanced global proteoform platforms and instrumentation are increasingly able to discover and characterize proteoforms228, reinforcing the importance of proteoform-level knowledge4. CTDP has begun an effort analogous to the 2002 Human Genome Project, called the Human Proteoform Project & Atlas, which seeks to construct the first Human Proteoform Atlas3. The goal of this initiative is to map the entire human proteome, an effort that will require technical leaps in the discovery and characterization of proteoforms in health and disease. It is anticipated that the next generation of human proteomics will be structured around ~20,000 proteoform families1, each corresponding to a specific gene. Extensive proteoform repositories assembled for key model organisms and thoroughly characterized mammalian cell lines are expected to provide foundational knowledge of the global proteome. This will likely serve as an essential cornerstone in modern biology.
Biomedical applications
Mass spectrometry-based proteomics has become an indispensable technique for biomedical research (Fig. 7a), playing a crucial role in uncovering novel disease biomarkers and unravelling the mechanisms underlying human disease185,229,230. Large-scale, discovery-mode, global profiling of proteoforms has provided critical knowledge to map the overall proteoform landscape. However, hypothesis-driven, targeted TDP at the sub-proteome level can offer novel molecular insights to understand structure–function relationships and underlying disease mechanisms34,231,232. TDP has analysed many clinically relevant sample types, including serum, biofluids or biopsy tissue, to identify specific proteoform biomarkers233–235. This section illustrates four important human disease areas, showcasing instances in which proteoforms were recognized by TDP and associated with disease development.
Fig. 7 |. Biological applications for top-down proteomics.
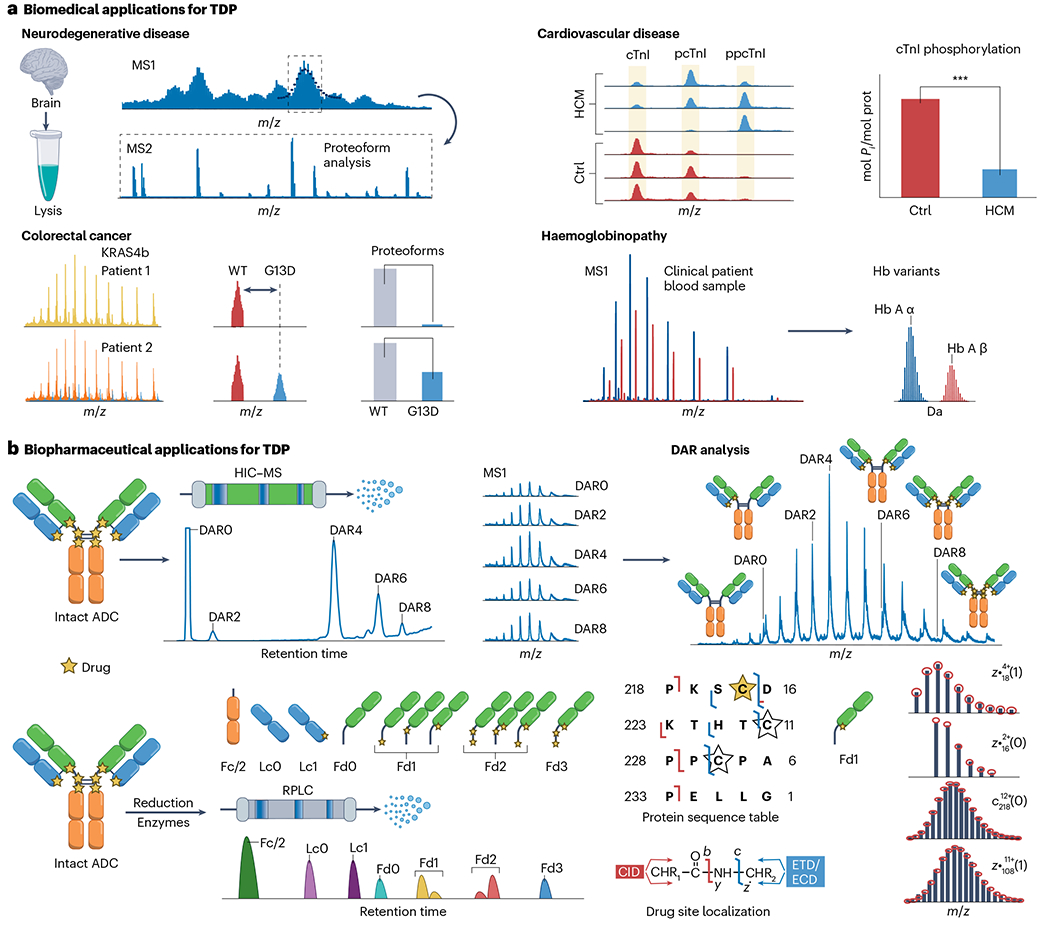
a, Schematic depiction of various human organ systems and representative examples of biomedical top-down proteomics (TDP) applications. Four major human disease applications are shown. Neurodegenerative disease involving TDP analysis of hypermodified brain proteins linked to Alzheimer disease. Cardiovascular disease showing the top-down label-free quantification of cardiac troponin I (cTnI) phosphorylation state, which can serve as a biomarker for major cardiac diseases, such as ischaemic cardiomyopathy or hypertrophic cardiomyopathy (HCM). In clinical applications of TDP, haemoglobinopathy involves the top-down mass spectrometry analysis of haemoglobin (Hb) variant characterization from various human clinical blood samples. Colorectal cancer showing the top-down mass spectrometry analysis of various KRAS4b proteoforms to inform disease state. The p and pp represent phosphorylation and bisphosphorylation, respectively. b, Illustration of major biopharmaceutical analysis of antibody–drug conjugates (ADCs). Here, a Cys-based ADC is shown. The top-down approach is ideal for determining the drug-to-antibody (DAR) ratio of ADCs by direct infusion analysis of intact ADCs. Site-specific localization of covalent drug attachment can be achieved through an online top-down liquid chromatography–mass spectrometry (LC–MS) approach. Disulfide reduction and enzymatic treatment can result in a total of seven separated subunits including Fc/2, Lc without drug (Lc0), Lc with 1 drug (Lc1), Fd without drug (Fd0) and Fd with 1–3 drugs (Fd1–3). Electron-transfer dissociation (ETD) and collision-induced dissociation (CID) tandem mass spectrometry characterization of reduced Fd1 isomer of brentuximab vedotin after IdeS digestion are shown, with a corresponding truncated protein sequence table as an example. The stars represent possible conjugation site, with Cys220 (yellow star) the confidently localized Fd1 drug-bound isomer that was identified. Theoretical ion distributions are indicated by the red dots. ECD, electron capture dissociation; HIC–MS, hydrophobic interaction chromatography–mass spectrometry; RPLC, reversed-phase liquid chromatography; WT, wild type.
Cancer.
Understanding cancer biology involves studying proteins and their PTMs, especially in signalling pathways governed by intracellular phosphorylation3. As TDP can detect the entire proteoform landscape, it has the potential to discern oncoproteoforms, particularly those arising from combinations of driver mutations, PTMs and RNA splice variants. This capability is exemplified in the context of rat sarcoma (RAS) biology, in which TDP has precisely distinguished PTMs in four isoforms derived from RAS family genes and established driver mutation/PTM crosstalk in human colorectal cells and tumours236. Gene mutations in the RAS family, which encode small GTPases, are responsible for more than 40% of all cancers, with a particularly high incidence exceeding 90% in pancreatic tumours. The complex RAS isoforms are derived from three genes, yielding four isoforms with a high sequence homology in the initial 165 residues. The PTMs of these isoforms can be precisely characterized by TDP after immunoprecipitation236. The proteoform-level study offers a thorough molecular definition and abundance comparison between wild-type and mutant RAS proteoforms, providing insights not accessible with conventional BUP. Large-scale global TDP has helped advance cancer research. For instance, a global TDP study identified more than 23,000 proteoforms from 2,332 proteins in colorectal cancer cells and revealed substantial proteoform-level differences between metastatic and non-metastatic cells237. The study was limited owing to the majority of identified proteoforms having a low-molecular mass (<20 kDa). More work is needed for global identification and quantification of larger proteoforms (>30 kDa).
Cardiovascular disease.
Cardiovascular diseases are the primary global cause of death and the affected population is projected to rise as demographics shift towards an ageing population238. Efforts have been made to use proteomics with cardiac biology and clinical diagnosis239,240. For instance, TDP analysed paired serum samples in the CARDIA study, revealing proteoform-specific association between apolipoproteins AI and AII with cardiometabolic indices241. Several TDP studies have associated changes in cardiac proteoforms with disease phenotypes, in both human clinical samples and animal models of heart diseases32,240. A quantitative TDP study identified phosphorylated proteoforms of cardiac troponin I (cTnI) as potential biomarkers for chronic heart failure, the first TDP study discovering biomarkers from tissues185. An enrichment strategy using peptide functionalized nanoparticles was integrated with TDP to capture cTnI directly from human serum. This unveiled molecular fingerprints of various cTnI proteoforms, underscoring their potential for disease diagnosis in serum at the proteoform level65. TDP has also identified actin proteoforms as potential cardiac disease markers242 and uncovered newly identified phosphorylation of a pivotal Z-disc protein, enigma homologue isoform 2, in a swine model of acute myocardial infarction229. Given the critical role of PTMs and alternative splicing during maturation of human pluripotent stem-cell-derived cardiomyocytes, identifying and quantifying proteoforms and splicing isoforms enables unambiguous assessment of the maturation stages166. TDP was used to analyse heart tissue samples from septal myectomy surgery in patients with hypertrophic cardiomyopathy, the most common heritable heart disease. The genetic cause of hypertrophic cardiomyopathy is linked to mutations in genes encoding sarcomeric protein214. The TDP study uncovered unexpected results and demonstrated the capacity of proteoforms to more accurately reflect the clinical manifestation of a patient. Most identified cardiovascular proteoforms are from the cardiac sarcomere and further efforts will be needed to expand coverage to the broader cardiac proteome.
Neurodegenerative diseases.
More than 47 million people globally are affected by dementia and this number is expected to reach 135 million by 2050 (ref. 243). Dysregulated PTMs can impact protein aggregation in neurodegenerative disease (Fig. 7a) and many PTMs are modulators of proteinopathy in neurodegenerative conditions. For instance, Alzheimer disease is impacted by phosphorylation of amyloid-β or tau and isoaspartate formation in amyloid-β; Parkinson disease is related to deacetylation, 4-hydroxy-2-neonal modification, O-GlcNAcylation or phosphorylation of α-synuclein; amyotrophic lateral sclerosis is influenced by acetylation or phosphorylation of transactive response DNA-binding protein-43 and SUMOylation of superoxide dismutase 1; and Huntington’s disease by phosphorylation of huntingtin244. Studies with superoxide dismutase 1 emphasize the importance of TDP to understand relationships among PTMs, sequence variants and protein complexes involved in proteinopathies245. This knowledge is vital to understand the mechanisms underlying neurogenerative diseases and help develop innovative diagnostic and therapeutic treatment methods109. However, the complexity of proteoforms in neurodegenerative diseases, such tau proteins in Alzheimer disease246, means that there is need for improved instrumentation to resolve large and highly modified proteins, and data analysis methods to resolve combinatorial PTMs. A proteoform imaging mass spectrometry method, which combines individual ion mass spectrometry for TDMS of brain cells, could help address these challenges247.
Infectious diseases.
Severe infectious disease outbreaks, such as the COVID-19 pandemic, can have a large impact on lives of people worldwide. Alongside pandemics, antimicrobial resistance is continuing to spread. Alternative strategies to better detect, characterize and treat infectious diseases are urgently needed. Assessing proteoforms is a promising approach. The cause of cerebrospinal meningitis, Neisseria meningitidis, was found to have a specific PilE proteoform that is tightly associated with crossing the epithelial barrier and accessing the bloodstream248. Highly glycosylated PilE proteoforms are linked to immune escape249. For Salmonella enterica subsp. enterica serovar Typhimurium, the most common foodborne pathogen, specific S-cysteinylated proteoforms were reported in response to infection-like conditions250. The large-scale analysis of bacterial proteoforms using TDP can also overcome the limitations of MALDI-TOF-MS, the method used in hospitals to rapidly identify bacterial pathogens and discriminate closely related bacteria251. In a more straightforward approach, liquid extraction surface analysis mass spectrometry can identify ESKAPE pathogens directly from live cultures252. For SARS-CoV-2, specific proteoforms of the nucleocapsid protein were found to bind viral RNA and exhibit significantly different interactions with IgM, IgG and IgA antibodies from convalescent plasma and could be candidates for immune-directed therapies253. For the same virus, specific O-glycosylated proteoforms of the spike protein were associated with the omicron variant, which could provide information about how the variant escapes immunological protection254.
Biopharmaceutical applications
Protein-based pharmaceuticals represent an increasingly large share of total drug sales, currently more than 50% of ongoing drug development pipelines and FDA approvals255. Biotherapeutics cover a broad spectrum of masses, ranging from 5.8 kDa for human insulin to approximately 150 kDa for monoclonal antibodies (mAbs) and antibody–drug conjugates (ADCs). Additionally, fusion proteins exceeding 150 kDa were created as innovative treatments for cancer, autoimmunity, inflammation and genetic disorders256. In both academic and industrial laboratories, TDP is increasingly used to analyse the structure of biotherapeutic mAbs and advanced modalities256–261 (Fig. 7b). Most ADCs currently available or in clinical trials use either Lys or Cys conjugation. Both conjugation methods lead to multiple positional isomers for a specific drug-to-antibody ratio species. These isomers play a crucial role in influencing the efficacy, stability and safety of the ADCs, making the drug-to-antibody ratio analysis highly important in quality control262. Importantly, TDP reduces the risk of introducing artefactual modifications by minimizing sample preparation and providing complementary structural information to conventional BUP263. Coupling with front-end separation approaches – such as HIC, RPLC, SEC or CE – is promising for ADC separation and drug conjugation site localization264–268. The original TDP approaches applied to intact ~150 kDa mAbs analysis were based on CID and provided limited total sequence coverage (~10%)269–271. A significant increase in the sequence coverage, up to 35%, was achieved by applying ETD to the intact murine and human IgG1 species272. This advance motivated new developments in the mAbs TDP analysis, followed by application of ETD on other mass spectrometry platforms273, and alternative MS/MS approaches256.
Methods to enhance sequence coverage use a middle-down mass spectrometry approach, using a limited digestion of intact biomolecules to simplify the analytical challenges of characterizing large proteins274,275. Compared with the intact mAbs analysis, middle-down approaches characterizing ~25 kDa antibody subunits – for example, Fd, Fc/2 and light chain – show substantially improved separation performance by RPLC, CE and CZE, yielding higher fragmentation efficiency and better product ion detection276–278. Various MS/MS methods coupled with ion activation, either before or after the electron transfer/capture or ion–ion reaction, can enhance protein sequence characterization256. Including assignment of internal fragments also enhances TDP-derived mAb sequence coverage, as demonstrated by the analysis of intact NIST mAb, in which a sequence coverage of >75% was reported279. Including internal product ions also helps provide information about PTMs, intrachain disulfide bond connectivity, N-glycosylation sites and chain pairing280. Although IgG1 is the most frequently studied mAb in TDP applications, several works describe the analysis of IgG2, IgA and the MDa molecular mass IgM species259. These results suggest that TDP may be useful for de novo sequencing of mAbs, such as IgA1s from milk, saliva or serum.
Currently, TDP requires multiple targeted experiments on selected biopharmaceuticals using a combination of fragmentation methods and experimental parameters. When performing large-scale, proteomics-grade TDP analysis on biopharmaceutical, constraints of time, sample quantity and protein structure can substantially reduce spectral data quality and limit the obtainable sequence coverage29. As a result, crucial information typically found at low abundance levels is not achievable in LC timescales. Developments to TDP methodologies, techniques, automation and data analysis are needed for broader adoption of TDP. In biopharmaceutical applications, examples in which TDP complements and exceeds the capabilities of the current gold standard – BUP, subunit and intact mass spectrometry – are needed for it to be used more widely.
Clinical TDP
Clinical TDP analysis at the proteoform level has been effectively implemented in many clinical laboratories, particularly to identify pathogens with MALDI-TOF-MS, which can rapidly detect proteoform profiles directly from an intact bacterial cell surface281. This has resulted in commercialization of specialized MALDI-TOF-MS technologies, such as the Bruker biotyper and VITEK mass spectrometer, to establish a public health reference laboratory for identifying microorganisms with high throughput, accuracy and low cost282. A large number of protein markers are tested in clinical laboratories, and proteoforms, which are influenced by pathophysiological conditions, are increasingly being recognized as holding important clinical diagnostic value283. In most cases, conventional clinical tests cannot resolve proteoforms as few clinical analytical platforms are compatible with molecular characterization of intact proteins. The promise of TDP in clinical diagnosis is shown by the identification of haemoglobin variants for haemoglobinopathy284 and the detection of monoclonal immunoglobulins for monoclonal gammopathy285. Specifically, TDP can accurately identify and characterize haemoglobin variants from clinical patient blood286, presenting advantages for diabetes diagnosis compared with conventional methods and next-generation gene sequencing284. TDMS was successfully applied to detect and characterize immunoglobulins (M-proteins) for plasma cell disorder diagnosis287. Additionally, TDMS can differentiate endogenous M-proteins from therapeutic mAbs in serum for accurate diagnosis, potentially replacing traditional methods of serum protein electrophoresis and immunofixation. The traditional techniques have limited resolution and cannot accurately monitor therapeutic response when the M-protein co-migrates with therapeutic mAbs288.
Proteoforms are important to understand disease and as prognostic biomarkers. This is illustrated in a report showing that monoclonal gammopathy of uncertain significance patients with glycosylated light chains has significantly increased risk of progressing to plasma cell dyscrasias in clinical pathologies289. As the role of proteoforms is better understood, the more TDP is expected to impact the clinical arena290. Although TDP technology is rapidly advancing in clinical settings, there is a limit to what can be achieved in clinical laboratories, even with advanced instrumentation. Efforts to improve TDP proteome depth and sensitivity will be needed to analyse low-abundance proteoforms and biomarkers from clinical samples. Automation and streamlining informatics are also required for TDP to be widely adopted in the clinic.
Reproducibility and data deposition
Reproducibility
Reproducibility of TDP data is critically important to ensure reliable, accurate proteoform annotations and for broader adoption of TDP in academia and industry. TDP is a relatively new field and, unlike the mature BUP approach, universally accepted experimental methods and data reporting standards have yet to be developed. Standardization efforts led by the CTDP push for inter-laboratory comparisons to better understand challenges and improve reproducibility29,33. Proteoforms are suspectable to variations in sample handling and instrumentation methodologies, making scientific rigour and sufficient data reporting practices important. Appropriately detailed descriptions of sample preparation, separation methods and instrumentation parameters need to be given for reliable proteoform and PTM reporting. This is especially critical when reporting PTMs that are easily artefactually produced by variations in experimental design or instrument settings, such as oxidation240, non-enzymatic glycation291 or labile PTMs, for instance, phosphorylation292, palmitoylation293 and glycosylation112,254. Standards for proteoform annotation and data reporting are continuously improving. Efforts to formally define a proteoform-level classification system212 develop a standardized lexicon for enhanced data reporting clarity12, and multi-software tool comparisons29 can define best practice in collection, reducibility and analysis.
Data deposition
All TDP data should be made publicly available. Many journals have implemented this requirement, but it will require a community effort to ensure proper data handling and reporting practices are enforced. As the TDP field is relatively new, there are few dedicated top-down data repositories. Instead, TDP data are often deposited in general proteomics repositories that are mainly formulated for BUP data sets: PRIDE (EMBL-EBI, Cambridge, UK)294, PeptideAtlas (ISB, Seattle, WA, USA)295, MassIVE (UCSD, San Diego, CA, USA)296, jPOST (various institutions, Japan)297, iProx (National Center for Protein Sciences, Beijing, China)298 and Panorama Public (University of Washington, Seattle, WA, USA)299. The Proteoform Repository at the CTDP represents a unique hub for scientists to browse deposited proteoforms and contribute TDP data sets300. Data repositories are essential for TDP data to comply with the FAIR data deposition standards301. New avenues and initiatives to platform TDP data sets and serve as central repositories will be extremely valuable to advance the accessibility and sharing of TDP data, which will in turn benefit the TDP field300.
Limitations and optimizations
TDP has grown rapidly owing to many new technologies and methods. Techniques are continuing to emerge, aiding analysis of complex protein mixtures, basic scientific research, new biomarker discovery and novel biological insights166,214,236,248,250,302–304. However, challenges remain5, including protein solubility, proteome complexity, data analysis, connecting and establishing proteoform-to-function relationships and analytical throughout5. Although solutions are being developed, this section highlights limitations to demonstrate the assumptions underpinning TDP workflows, with strategies suggested to overcome current limitations.
High sensitivity
High analytical sensitivity is needed to analyse proteoforms from sample-limited biological systems. However, achieving high sensitivity is a major challenge in TDP. Conventional TDP workflows require a relatively large amount of starting sample – micrograms of total protein or millions of cells – for high-quality data and sufficient analyte signals for MS/MS124. By contrast, the well-established BUP approach enables deep proteome coverage across many biological samples and can be performed with relatively low sample amounts (<200 ng)20,305,306. The need for relatively large protein quantities is a major barrier when applying TDP in sample-limited biological settings, such as clinical samples and single cells. To address this, a high-sensitivity TDP method was developed and used to identify proteoform variations in large proteins in individual muscle cells. This high-sensitivity approach enabled proteomics to be integrated with functional properties165. Initially, CE–MS showed potential for high-sensitivity TDP analysis of single cells using an on-capillary cell lysis approach307. The nanoPOTS – nanodroplet processing in one pot for trace samples196 – technology was originally developed for single-cell BUP and can be used for high-sensitivity TDP. Protein extraction can be enhanced with a combination of n-dodecyl-β-d-maltoside surfactant and urea308. This approach relies on specialized devices that are in the early stages of development. Despite this, high-sensitivity platforms have the potential to accelerate highly sensitive TDP applications, enabling routine single-cell TDP.
Large proteoform identification
High-molecular mass proteoforms are often under-represented in top-down data sets309. TDP has major limitations in the effective depth of proteome coverage owing to the large range of protein molecular masses within a proteome310 and difficulties in effectively separating intact proteins before mass spectrometry. This challenge is compounded by the high dynamic range of the proteome, the exponential decay S/N of large proteoforms owing to increasing charge states from ESI, greater contribution of heavy isotopes at higher precursor mass and detrimental presence of smaller, coeluting proteoforms during the large proteoform analysis. In general, larger proteoforms (>30 kDa) tend to generate larger MS/MS product ions (>10 kDa), exacerbating the already high instrumentation burden of TDP. To analyse larger ions, ultrahigh resolution platforms, such as FTICR mass spectrometers311, may be required. Size-based fractionation methods with SEC or gel-based techniques, for instance, the integrative proteomics approach or PEPPI-MS, before mass spectrometry could address the challenge of large ion analysis81,83–85. However, broad use of size-based fractionation is hindered by time-consuming sample processing and large sample requirements (typically >100 μg). Advanced sheath-flow and sheathless interfaces have enabled wider application of CZE in TDP312–316. Limited sample loading quantities constrain the total number of identifications attainable from the CZE analysis of protein mixtures314. Obtaining sufficient fragmentation for large proteoform identification is also a challenge, especially in the chromatographic timescale of an LC–MS/MS experiment. Currently, no single separation strategy or MS/MS configuration can comprehensively resolve the entire proteome. Increasingly sophisticated instrumentation, new method development and improved informatics tools will be needed to address this challenge.
Tandem mass spectrometry of proteins
Protein fragmentation typically yields protein products with an N or C terminus317,318. In general, protein fragmentation efficiency is higher towards either end of the sequence termini, whereas fragmentation coverage in the middle is limited319,320. This discrepancy is more evident in larger proteins and is believed to arise from residual higher-order protein structures (secondary and tertiary) that persist even under denaturing conditions, restricting accessibility25,320. Fragmentation depth in TDP is also constrained by the network of protein disulfide bonds256. For example, disulfide bond reduction before TDP facilitates protein unfolding and increases sequence coverage from regions previously shielded by disulfide bonds, such as the middle region321. Cleavage events from the middle region often result in large product ions with lower S/N and isotopic resolution, complicating identification and characterization320. Secondary gas-phase dissociation of large fragment ions can hinder fragment ion identification but, in certain cases, can also help uncover the restricted middle region319. Internal fragments, which result from at least two backbone cleavages and do not have N or C terminus, are being increasingly considered in top-down fragmentation322. As the molecular size of a protein increases, the total number of unique internal ions that can form increases markedly323. New methods and data analysis workflows that can accurately integrate internal fragmentation could enhance protein sequence characterization and proteoform annotation324. The recently developed TDP software, ClipsMS, can assign internal fragment masses to protein sequences, improving overall coverage depth325,326. However, limitations remain, such as duplicated fragment assignment from identically matching fragment masses, lower statistical confidence in matching smaller internal fragments, no neutral losses assignments and lack of annotation for more diverse fragment types, namely, c + 1, z + 1 and z· fragments. Internal fragmentation assignments and new protein dissociation technologies327 are likely to improve the understanding of top-down fragmentation mechanisms and lead to new data analysis pipelines that can handle multiple fragmentation types.
Localization of specific modification sites
The TDP approach is the most practical method for characterizing proteoforms. Unlike BUP, which benefits from primary sequence simplification using enzymes and other cleavage methods20, TDP lacks a straightforward and reliable way to resolve proteoform complexity. Experimental localization of PTMs and precise characterization of proteoform chemical composition are challenging212. Low-abundance proteoforms, such as those with phosphorylation, are often hindered by low sensitivity and limited retention of covalent phosphate linkages owing to labile PTMs328. Enrichment strategies can boost low stoichiometric or low abundance signals; however, addressing labile PTMs often requires optimization of the specific fragmentation method, for instance, by using a gentler electron-based method such as ETD or ECD329. Intact protein ions are less susceptible to cleavage of labile PTMs by CID, in contrast to peptides, potentially owing to protein ions retaining a degree of high-order structure in the gas phase25. Studies have shown that targeted TDMS by ECD and ETD can effectively elucidate the primary sequences of biologically relevant proteoforms, particularly those with labile PTMs330–333. A five-level proteoform classification system was proposed to clarify ambiguities in proteoform identification and compare results from different laboratories and techniques212. Beyond classification, localization of specific PTMs is also limited by the robustness of MS/MS spectra obtained for a given proteoform. It can be laborious, often requiring multiple fragmentation methods or internal fragment ion products, to achieve sufficient fragment ion complementarity for accurate PTM assignment, localization and sufficient protein sequence coverage279,334.
Throughput and ease of analysis
The relatively low throughput and high data complexity of TDP are major barriers for both new and experienced users32,127. With the exception of MALDI-TOF-based intact protein assays335, label-free discovery-based TDP has low measurement throughput, requiring time-consuming optimization of the whole workflow, particularly for sample preparation, separation and data analysis5. Detailed characterization of low-abundance membrane proteins336 and whole protein complexes337 is possible using a direct infusion approach. However, these direct infusion or injection methods require sophisticated hardware and robust analytical methods, limiting general applicability. Automated sample preparation338 and separation systems would enhance the throughput, enabling broader application to complex biological systems339,340. Currently, discovery-based TDP data processing includes deconvolution and database searches, which can take several hours to several days, depending on software performance and search parameters146,147. This underscores the need for continuous benchmarking to systematically monitor and compare informatics across laboratories29. Future developments in software and hardware are expected to enhance the throughput of TDP analyses. This will streamline experiments and alleviate computational burden associated with the data analysis. For example, by omitting the step of spectral deconvolution and directly matching expected features in experimental and simulated data, sensitivity and specificity of precursor and product ion analysis can be improved280. Continual developments in computational resources and programming capabilities will enable acquisition and processing of increasingly large data sizes (10–100 GB per single TDP experiment). This will enhance the achievable analytical performance to improve proteoform coverage depth and analysis ease.
Outlook
TDP is currently the only technology able to determine proteoform identities and quantify their abundances. The fundamental importance of proteoforms and their potential role as markers of cellular, environmental or biosystem health means that TDP technologies are expected to continue rapidly developing.
Two key areas to address are improving deep characterization of complex proteoform mixtures and the identification and characterization of larger proteoforms. An exciting development is single ion measurements, which can be implemented on existing commercial instruments and on specialized prototypes341–343. However, this approach is limited by the fundamental constraints of single-molecule methods when sampling complex proteomes that have a range of protein abundances344. Efficient proteoform separation is particularly critical but remains underdeveloped. It is often challenging to implement separation globally owing to the large diversity in proteoform physicochemical properties. Recent advances in integrative proteomics approaches, liquid chromatography stationary phases, implementation of CE modalities, development of IMS-based separations and integration into multidimensional approaches will continue to improve proteome-wide measurements5,345.
Opportunities are available by integrating top-down data flows with other data types, including genome and transcriptome sequences, BUP and glycomics3. Genome sequences are fundamental to proteomics, providing the gene models that underlie database construction and search algorithms used for proteomic identifications. Transcriptome information enables searches to focus on subsets of genes and RNA splice variants expressed in the tissues under study. Bottom-up data can further specify which proteins are present and the PTMs they contain. Protein glycoforms are among the most challenging112,346,347 but also the most functionally important proteoforms. There is a trade-off between constructing and searching against vast proteomic databases that contain all possible sequences and the cost of false identifications arising from an expanded search space. Integrating and using multiple data types to restrict the size of search databases while increasing their relevance to the sample is an emerging area for TDP optimization3.
One of the largest barriers for new TDP users is data analysis. The complex nature of MS1 and MS2 spectra makes them virtually impossible to decipher manually. Software is required to parse the data into a comprehensible result, but the relatively small size of the field has limited the development of these tools. Proteoform quantification is more difficult than peptide quantification owing to the presence of many charge states and isotopologues, which result in lower S/N values. Turn-key tools that are intuitive and easy to use are urgently needed. Statistical methods that give confidence metrics for proteoform identifications are not well developed. All proteomic analyses are statistical in nature, and metrics such as FDR and posterior error probability are essential to interpret results. Further development of these areas will provide a foundation for expanded applications of TDP into the clinical and biopharmaceutical arenas.
As technology improves, important new application areas are becoming accessible. Single-cell proteomics is in its infancy but is already producing important new insights165,196,348–350. Spatial biology351 is close to understanding the mechanisms responsible for tissue and cellular organization. As the primary effectors of function, proteoforms determine cellular identities. However, measuring proteins and proteoforms in single cells or with near-single-cell resolution is a major challenge. Current approaches typically rely on labels or antibodies, which are limited in availability and specificity59. They also require a priori knowledge of protein targets and are only able to provide a restricted view of what is present. Although BUP has been demonstrated for proteome-wide spatial profiling of tissue sections when coupled with laser capture microdissection352, the approach uses peptides as a proxy for proteins and cannot characterize proteoforms. Extending single-cell and spatial measurements to the proteoform analysis will become possible by combining advanced technologies, such as microfluidics, mass spectrometry imaging and single ion measurements165,247,308,353–355.
New proteomic platforms have emerged, adopting concepts pioneered in next-generation sequencing of nucleic acids356. Nanopore sequencing of proteoforms is being developed357, and several companies are exploring how to fabricate and interrogate complex protein and peptide arrays for target proteomes. Once a proteoform database is constructed for a system of interest, data produced by next-generation platforms can be searched against the database, transforming proteoform identification from a discovery process to a scoring process.
Although proteoforms offer unique insights into cellular processes, alone they cannot provide a biological interpretation. Integration with other omics measurements is necessary to link proteoforms to related measurable outputs — for example, transcripts and metabolites — and decipher the basic principles of biology. One example is the recently introduced nanoSPLITS (nanodroplet SPlitting for Linked-multimodal Investigations of Trace Samples) technology, which enables parallel transcriptomics and BUP from the same single cell358. With single-cell proteoform measurements rapidly emerging, technologies will expand to give an unprecedented view of transcripts, proteins and proteoforms in single cells. These exciting multiomics developments promise to bring a new era of biological prediction and control.
Acknowledgements
Y.G. acknowledges support from the NIH R01 HL096971, HL109810, GM117058 and GM125085. J A.L. was supported by the NIH under award R35GM145286 and the Department of Energy under award DE-FC02-02ER63421. L.M.S. was supported by the NIGMS under the award R35GM126914. J.N.A. was supported by ALSA 508452. J.C.-R. and Y.O.T. were supported by the European Horizon 2020 programme under award 829157, and J.C.-R. was also supported by the Institut Pasteur, the CNRS and EPIC-XS under award 823839. S.W. was supported by OCAST HR23-169, NIH NIAID R01AI141625 and NIH/NIAID2U19AI062629. S.W. was also supported by the University of Alabama startup grant. X.L. was supported by the NIH under awards R01GM118470, R01CA247863 and R01AI141625 and the NSF under award 2307573. L.P.-T. was supported by the NIH under the award UH3CA256959. The authors acknowledge K. Brown for helpful discussions on surfactant-aided proteomics and R. Luo for the assistance and helpful discussion on clinical top-down proteomics.
Glossary
- Bottom-up proteomics
A technique used to analyse peptide fragments from the proteolytic digestion of intact proteins by mass spectrometry, enabling sensitive and high-throughput identification of proteins.
- Convoluted mass spectra
Refers to the potential overlap of two or more peaks with similar mass-to-charge (m/z) ratios. This can lead to incomplete separation of two or more mass spectral peaks owing to resolution limits and complicated mass spectral identification.
- Data-dependent acquisition
Refers to the tandem mass spectrometry technique that involves specific selection of precursor ions before MS2 fragmentation. This technique commonly selects several of the most intense peaks observed in a single MS1 survey scan for fragmentation and only fragmenting a small subset of the total ions present.
- Data-independent acquisition
Refers to the tandem mass spectrometry technique that forgoes specific selection of precursor ions and instead fragments all ions present in an MS1 survey scan.
- Monoisotopic peak
The exact mass of a molecule, represented by the sum of the masses of the atoms in the molecule using the principal (most abundant) isotope for each element.
- Post-translational modifications
All covalent processing events and modifications to the amino acid sequence of a given protein occurring after protein biosynthesis.
- Proteoforms
A term used to describe all the different molecular forms of a protein product from a single gene. This includes changes from genetic variations, alternatively spliced RNA transcripts and post-translational modifications such as protein phosphorylation, glycosylation and protein truncations.
- Tandem mass spectrometry
A technique performed using one or more mass analysers, involving multiple consecutive stages of mass spectrometry analysis — typically two, MS/MS, also known as MS2 — to fragment selected precursor ions in the MS1 spectrum and generate product ions that can elucidate the structure and chemical composition of a molecule.
Footnotes
Competing interests
J.A.L., J.C.-R., J.N.A., L.P.-T., L.M.S. and Y.G. are currently board members of Consortium for Top-down Proteomics. Y.O.T. is an employee of Spectroswiss, a company that develops data acquisition systems and data processing software for mass spectrometry. X.L. has a project contract with Bioinformatics Solutions Inc., a company that develops data processing software for mass spectrometry. D.S.R. and Y.G. are named as inventors for the patent application US Patent App. 17/786,482. L.P.-T. is named as an inventor for the US Patent App. 17/954,834. Y.G. is named as an inventor for the US Patent App. 18/069,005; US Patent App. 17/978,793; US Patent App. 18/451,614; and US Patent 11,567,085. S.W. declares no competing interests.
Related links
National Resource for Translational and Developmental Proteomics: http://nrtdp.northwestern.edu/protocols/
Proteoform repository: http://repository.topdownproteomics.org/
References
- 1.Smith LM & Kelleher NL Proteoforms as the next proteomics currency. Science 359, 1106–1107 (2018). [DOI] [PMC free article] [PubMed] [Google Scholar]
- 2.Smith LM & Kelleher NL Proteoform: a single term describing protein complexity. Nat. Methods 10, 186–187 (2013). [DOI] [PMC free article] [PubMed] [Google Scholar]; This publication introduces and describes the concept and importance of proteoforms.
- 3.Smith LM et al. The human proteoform project: defining the human proteome. Sci. Adv 7, eabk0734 (2021). [DOI] [PMC free article] [PubMed] [Google Scholar]; The outline of an ambitious next-generation initiative to define the human proteome through a definitive set of reference proteoforms.
- 4.Aebersold R. et al. How many human proteoforms are there? Nat. Chem. Biol 14, 206–214 (2018). [DOI] [PMC free article] [PubMed] [Google Scholar]
- 5.Melby JA et al. Novel strategies to address the challenges in top-down proteomics. J. Am. Soc. Mass Spectrom 32, 1278–1294 (2021). [DOI] [PMC free article] [PubMed] [Google Scholar]; A comprehensive summary of the major technical challenges facing top-down proteomics.
- 6.Zhou M. et al. Higher-order structural characterisation of native proteins and complexes by top-down mass spectrometry. Chem. Sci 11, 12918 (2020). [DOI] [PMC free article] [PubMed] [Google Scholar]
- 7.Fornelli L. et al. Top-down proteomics: where we are, where we are going? J. Proteom 175, 3 (2018). [DOI] [PMC free article] [PubMed] [Google Scholar]
- 8.Toby TK, Fornelli L & Kelleher NL Progress in top-down proteomics and the analysis of proteoforms. Annu. Rev. Anal. Chem 9, 499–519 (2016). [DOI] [PMC free article] [PubMed] [Google Scholar]
- 9.Kelleher NL et al. Top down versus bottom up protein characterization by tandem high-resolution mass spectrometry. J. Am. Chem. Soc 121, 806–812 (1999). [Google Scholar]; To our knowledge, the first time that top-down and bottom-up mass spectrometry was coined and compared for protein characterization.
- 10.Tamara S, den Boer MA & Heck AJR High-resolution native mass spectrometry. Chem. Rev 122, 7269–7326 (2022). [DOI] [PMC free article] [PubMed] [Google Scholar]
- 11.Loo JA, Edmonds CG & Smith RD Primary sequence information from intact proteins by electrospray ionization tandem mass spectrometry. Science 248, 201–204 (1990). [DOI] [PubMed] [Google Scholar]; To our knowledge, the first report on the characterization of intact proteins by tandem mass spectrometry.
- 12.Lermyte F, Tsybin YO, O’Connor PB & Loo JA Top or middle? Up or down? A standard lexicon for protein top-down and allied mass spectrometry approaches. J. Am. Soc. Mass Spectrom 30, 1149–1157 (2019). [DOI] [PMC free article] [PubMed] [Google Scholar]
- 13.Li H, Nguyen HH, Ogorzalek Loo RR, Campuzano ID & Loo JA An integrated native mass spectrometry and top-down proteomics method that connects sequence to structure and function of macromolecular complexes. Nat. Chem 10, 139–148 (2018). [DOI] [PMC free article] [PubMed] [Google Scholar]; To our knowledge, the first demonstration of native top-down proteomics, integrating native mass spectrometry and top-down proteomics, to characterize large macromolecular complexes.
- 14.Xie Y, Zhang J, Yin S & Loo JA Top-down ESI-ECD-FT-ICR mass spectrometry localizes noncovalent protein–ligand binding sites. J. Am. Chem. Soc 128, 14432–14433 (2006). [DOI] [PubMed] [Google Scholar]
- 15.Zubarev RA, Kelleher NL & McLafferty FW Electron capture dissociation of multiply charged protein cations. a nonergodic process. J. Am. Chem. Soc 120, 3265–3266 (1998). [Google Scholar]
- 16.Sipe SN, Patrick JW, Laganowsky A & Brodbelt JS Enhanced characterization of membrane protein complexes by ultraviolet photodissociation mass spectrometry. Anal. Chem 92, 899–907 (2020). [DOI] [PMC free article] [PubMed] [Google Scholar]
- 17.Shaw JB et al. Complete protein characterization using top-down mass spectrometry and ultraviolet photodissociation. J. Am. Chem. Soc 135, 12646 (2013). [DOI] [PMC free article] [PubMed] [Google Scholar]; This publication showcases the use of ultraviolet photodissociation to improve primary sequence characterization and post-translational modification localization of intact proteins by top-down mass spectrometry.
- 18.Leney AC & Heck AJR Native mass spectrometry: what is in the name? J. Am. Soc. Mass Spectrom 28, 5–13 (2017). [DOI] [PubMed] [Google Scholar]
- 19.Skinner OS et al. Top-down characterization of endogenous protein complexes with native proteomics. Nat. Chem. Biol 14, 36–41 (2018). [DOI] [PMC free article] [PubMed] [Google Scholar]
- 20.Zhang Y, Fonslow BR, Shan B, Baek M-C & Yates JR III Protein analysis by shotgun/bottom-up proteomics. Chem. Rev 113, 2343–2394 (2013). [DOI] [PMC free article] [PubMed] [Google Scholar]
- 21.Chait BT Mass spectrometry: bottom-up or top-down? Science 314, 65–66 (2006). [DOI] [PubMed] [Google Scholar]
- 22.Doerr A. Top-down mass spectrometry. Nat. Methods 5, 24 (2008). [Google Scholar]
- 23.Plubell DL et al. Putting humpty dumpty back together again: what does protein quantification mean in bottom-up proteomics? J. Proteome Res 21, 891 (2022). [DOI] [PMC free article] [PubMed] [Google Scholar]
- 24.Meng FY et al. Informatics and multiplexing of intact protein identification in bacteria and the archaea. Nat. Biotechnol 19, 952–957 (2001). [DOI] [PubMed] [Google Scholar]; To our knowledge, the first report on the development of informatics for probability-based identification of proteins enabling top-down proteomics and first demonstration of identification of proteins from complex mixture.
- 25.Siuti N & Kelleher NL Decoding protein modifications using top-down mass spectrometry. Nat. Methods 4, 817–821 (2007). [DOI] [PMC free article] [PubMed] [Google Scholar]
- 26.Meng F. et al. Molecular-level description of proteins from Saccharomyces cerevisiae using quadrupole FT hybrid mass spectrometry for top down proteomics. Anal. Chem 76, 2852–2858 (2004). [DOI] [PubMed] [Google Scholar]
- 27.Parks BA et al. Top-down proteomics on a chromatographic time scale using linear ion trap Fourier transform hybrid mass spectrometers. Anal. Chem 79, 7984–7991 (2007). [DOI] [PMC free article] [PubMed] [Google Scholar]
- 28.Tran JC et al. Mapping intact protein isoforms in discovery mode using top-down proteomics. Nature 480, 254–258 (2011). [DOI] [PMC free article] [PubMed] [Google Scholar]
- 29.Tabb DL et al. Comparing top-down proteoform identification: deconvolution, PrSM overlap, and PTM detection. J. Proteome Res 22, 2199–2217 (2023). [DOI] [PMC free article] [PubMed] [Google Scholar]; This paper summarizes and compares the various top-down algorithms for proteoform deconvolution, identification and characterization.
- 30.Taylor GK et al. Web and database software for identification of intact proteins using ‘top down’ mass spectrometry. Anal. Chem 75, 4081–4086 (2003). [DOI] [PubMed] [Google Scholar]
- 31.Melani RD et al. The Blood Proteoform Atlas: a reference map of proteoforms in human hematopoietic cells. Science 375, 411–418 (2022). [DOI] [PMC free article] [PubMed] [Google Scholar]; A top-down proteomics atlas of 21 cell types in human blood revealing high cell-type specificity of proteoforms when compared with proteins.
- 32.Brown KA, Melby JA, Roberts DS & Ge Y Top-down proteomics: challenges, innovations, and applications in basic and clinical research. Expert Rev. Proteom 17, 719 (2020). [DOI] [PMC free article] [PubMed] [Google Scholar]
- 33.Donnelly DP et al. Best practices and benchmarks for intact protein analysis for top-down mass spectrometry. Nat. Methods 16, 587–594 (2019). [DOI] [PMC free article] [PubMed] [Google Scholar]; Overview of the current standards and benchmarks for top-down mass spectrometry and related sample preparation.
- 34.Gregorich ZR & Ge Y Top-down proteomics in health and disease: challenges and opportunities. Proteomics 14, 1195–1210 (2014). [DOI] [PMC free article] [PubMed] [Google Scholar]
- 35.Cai W. et al. Temperature-sensitive sarcomeric protein post-translational modifications revealed by top-down proteomics. J. Mol. Cell. Cardiol 122, 11–22 (2018). [DOI] [PMC free article] [PubMed] [Google Scholar]
- 36.Speers AE & Wu CC Proteomics of integral membrane proteins theory and application. Chem. Rev 107, 3687–3714 (2007). [DOI] [PubMed] [Google Scholar]
- 37.Catherman AD et al. Top down proteomics of human membrane proteins from enriched mitochondrial fractions. Anal. Chem 85, 1880–1888 (2013). [DOI] [PMC free article] [PubMed] [Google Scholar]
- 38.Skinner OS et al. Fragmentation of integral membrane proteins in the gas phase. Anal. Chem 86, 4627–4634 (2014). [DOI] [PMC free article] [PubMed] [Google Scholar]
- 39.Loo RR, Dales N & Andrews PC Surfactant effects on protein structure examined by electrospray ionization mass spectrometry. Protein Sci. 3, 1975–1983 (1994). [DOI] [PMC free article] [PubMed] [Google Scholar]
- 40.Wessel D & Flugge UI A method for the quantitative recovery of protein in dilute solution in the presence of detergents and lipids. Anal. Biochem 138, 141–143 (1984). [DOI] [PubMed] [Google Scholar]
- 41.Doucette AA, Vieira DB, Orton DJ & Wall MJ Resolubilization of precipitated intact membrane proteins with cold formic acid for analysis by mass spectrometry. J. Proteome Res 13, 6001–6012 (2014). [DOI] [PubMed] [Google Scholar]
- 42.Moore SM, Hess SM & Jorgenson JW Extraction, enrichment, solubilization, and digestion techniques for membrane proteomics. J. Proteome Res 15, 1243–1252 (2016). [DOI] [PMC free article] [PubMed] [Google Scholar]
- 43.Kachuk C & Doucette AA The benefits (and misfortunes) of SDS in top-down proteomics. J. Proteom 175, 75–86 (2018). [DOI] [PubMed] [Google Scholar]
- 44.Yu YQ, Gilar M, Lee PJ, Bouvier ES & Gebler JC Enzyme-friendly, mass spectrometry-compatible surfactant for in-solution enzymatic digestion of proteins. Anal. Chem 75, 6023–6028 (2003). [DOI] [PubMed] [Google Scholar]
- 45.Saveliev SV et al. Mass spectrometry compatible surfactant for optimized in-gel protein digestion. Anal. Chem 85, 907–914 (2013). [DOI] [PubMed] [Google Scholar]
- 46.Chang Y-H et al. New mass-spectrometry-compatible degradable surfactant for tissue proteomics. J. Proteome Res 14, 1587–1599 (2015). [DOI] [PMC free article] [PubMed] [Google Scholar]
- 47.Brown KA et al. A photocleavable surfactant for top-down proteomics. Nat. Methods 16, 417–420 (2019). [DOI] [PMC free article] [PubMed] [Google Scholar]; To our knowledge, the first report and method optimization of a photocleavable surfactant to enable top-down proteomics applications.
- 48.Habeck T & Lermyte F Seeing the complete picture: proteins in top-down mass spectrometry. Essays Biochem. 67, 283–300 (2023). [DOI] [PubMed] [Google Scholar]
- 49.Brown KA et al. Nonionic, cleavable surfactant for top-down proteomics. Anal. Chem 95, 1801–1804 (2023). [DOI] [PMC free article] [PubMed] [Google Scholar]
- 50.Rifai N, Gillette MA & Carr SA Protein biomarker discovery and validation: the long and uncertain path to clinical utility. Nat. Biotechnol 24, 971–983 (2006). [DOI] [PubMed] [Google Scholar]
- 51.Xie S, Moya C, Bilgin B, Jayaraman A & Walton SP Emerging affinity-based techniques in proteomics. Expert Rev. Proteom 6, 573–583 (2009). [DOI] [PMC free article] [PubMed] [Google Scholar]
- 52.Cox B & Emili A Tissue subcellular fractionation and protein extraction for use in mass-spectrometry-based proteomics. Nat. Protoc 1, 1872–1878 (2006). [DOI] [PubMed] [Google Scholar]
- 53.Catherman AD et al. Large-scale top-down proteomics of the human proteome: membrane proteins, mitochondria, and senescence. Mol. Cell. Proteom 12, 3465–3473 (2013). [DOI] [PMC free article] [PubMed] [Google Scholar]
- 54.Lollo B, Steele F & Gold L Beyond antibodies: new affinity reagents to unlock the proteome. Proteomics 14, 638 (2014). [DOI] [PubMed] [Google Scholar]
- 55.Uhlen M. et al. Tissue-based map of the human proteome. Science 347, 1260419 (2015). [DOI] [PubMed] [Google Scholar]
- 56.Gregorich ZR, Chang YH & Ge Y Proteomics in heart failure: top-down or bottom-up? Pflugers Arch. 466, 1199 (2014). [DOI] [PMC free article] [PubMed] [Google Scholar]
- 57.Bauer A & Kuster B Affinity purification-mass spectrometry. Eur. J. Biochem 270, 570 (2003). [DOI] [PubMed] [Google Scholar]
- 58.Gilda JE et al. Western blotting inaccuracies with unverified antibodies: need for a western blotting minimal reporting standard (WBMRS). PLoS ONE 10, e0135392 (2015). [DOI] [PMC free article] [PubMed] [Google Scholar]
- 59.Baker M. Reproducibility crisis: blame it on the antibodies. Nature 521, 274–276 (2015). [DOI] [PubMed] [Google Scholar]
- 60.Bradbury A & Plückthun A Reproducibility: standardize antibodies used in research. Nature 518, 27–29 (2015). [DOI] [PubMed] [Google Scholar]
- 61.Janes KA Fragile epitopes — antibody’s guess is as good as yours. Sci. Signal 13, eaaz8130 (2020). [DOI] [PMC free article] [PubMed] [Google Scholar]
- 62.Roberts DS et al. Reproducible large-scale synthesis of surface silanized nanoparticles as an enabling nanoproteomics platform: enrichment of the human heart phosphoproteome. Nano Res. 12, 1473–1481 (2019). [DOI] [PMC free article] [PubMed] [Google Scholar]
- 63.Chen B. et al. Coupling functionalized cobalt ferrite nanoparticle enrichment with online LC/MS/MS for top-down phosphoproteomics. Chem. Sci 8, 4306–4311 (2017). [DOI] [PMC free article] [PubMed] [Google Scholar]
- 64.Hwang L. et al. Specific enrichment of phosphoproteins using functionalized multivalent nanoparticles. J. Am. Chem. Soc 137, 2432–2435 (2015). [DOI] [PMC free article] [PubMed] [Google Scholar]
- 65.Tiambeng TN et al. Nanoproteomics enables proteoform-resolved analysis of low-abundance proteins in human serum. Nat. Commun 11, 3903 (2020). [DOI] [PMC free article] [PubMed] [Google Scholar]; To our knowledge, the first report on the high specificity and high sensitivity enrichment of low-abundance proteins from human serum by functionalized nanoparticles, enabling comprehensive top-down mass spectrometry analysis of the enriched proteoforms and their post-translational modifications.
- 66.Chapman EA et al. Structure and dynamics of endogenous cardiac troponin complex in human heart tissue captured by native nanoproteomics. Nat. Commun 14, 8400 (2023). [DOI] [PMC free article] [PubMed] [Google Scholar]
- 67.Ferdosi S. et al. Engineered nanoparticles enable deep proteomics studies at scale by leveraging tunable nano-bio interactions. Proc. Natl Acad. Sci. USA 119, 11 (2022). [DOI] [PMC free article] [PubMed] [Google Scholar]
- 68.Liu Y. et al. Nano–bio interactions in cancer: from therapeutics delivery to early detection. Acc. Chem. Res 54, 291–301 (2021). [DOI] [PubMed] [Google Scholar]
- 69.Li H, Wolff JJ, Van Orden SL & Loo JA Native top-down electrospray ionization-mass spectrometry of 158 kDa protein complex by high-resolution Fourier transform ion cyclotron resonance mass spectrometry. Anal. Chem 86, 317 (2014). [DOI] [PMC free article] [PubMed] [Google Scholar]
- 70.Brown RS & Lennon JJ Sequence-specific fragmentation of matrix-assisted laser-desorbed protein peptide ions. Anal. Chem 67, 3990–3999 (1995). [DOI] [PubMed] [Google Scholar]
- 71.Demirev PA, Feldman AB, Kowalski P & Lin JS Top-down proteomics for rapid identification of intact microorganisms. Anal. Chem 77, 7455–7461 (2005). [DOI] [PubMed] [Google Scholar]
- 72.Mann M, Hojrup P & Roepstorff P Use of mass-spectrometric molecular-weight information to identify proteins in sequence databases. Biol. Mass Spectrom 22, 338–345 (1993). [DOI] [PubMed] [Google Scholar]
- 73.Loo JA, Edmonds CG & Smith RD Tandem mass-spectrometry of very large molecules — serum-albumin sequence information from multiply charged ions formed by electrospray ionization. Anal. Chem 63, 2488–2499 (1991). [DOI] [PubMed] [Google Scholar]
- 74.Nikolaev EN, Boldin IA, Jertz R & Baykut G Initial experimental characterization of a new ultra-high resolution FTICR cell with dynamic harmonization. J. Am. Soc. Mass Spectrom 22, 1125–1133 (2011). [DOI] [PubMed] [Google Scholar]
- 75.Denisov E, Damoc E, Lange O & Makarov A Orbitrap mass spectrometry with resolving powers above 1,000,000. Int. J. Mass Spectrom 325–327, 80 (2012). [Google Scholar]
- 76.Schmit P-O et al. Towards a routine application of top-down approaches for label-free discovery workflows. J. Proteom 175, 12–26 (2018). [DOI] [PubMed] [Google Scholar]
- 77.Compton PD, Zamdborg L, Thomas PM & Kelleher NL On the scalability and requirements of whole protein mass spectrometry. Anal. Chem 83, 6868 (2011). [DOI] [PMC free article] [PubMed] [Google Scholar]
- 78.Doucette AA, Tran JC, Wall MJ & Fitzsimmons S Intact proteome fractionation strategies compatible with mass spectrometry. Expert Rev. Proteom 8, 787 (2011). [DOI] [PubMed] [Google Scholar]
- 79.Tran JC & Doucette AA Multiplexed size separation of intact proteins in solution phase for mass spectrometry. Anal. Chem 81, 6201 (2009). [DOI] [PubMed] [Google Scholar]
- 80.Oliveira BM, Coorssen JR & Martins-de-Souza D 2DE: the phoenix of proteomics. J. Proteom 104, 140–150 (2014). [DOI] [PubMed] [Google Scholar]
- 81.Carbonara K, Padula MP & Coorssen JR Quantitative assessment confirms deep proteome analysis by integrative top-down proteomics. Electrophoresis 44, 472–480 (2023). [DOI] [PubMed] [Google Scholar]
- 82.Lohnes K et al. Combining high-throughput MALDI-TOF mass spectrometry and isoelectric focusing gel electrophoresis for virtual 2D gel-based proteomics. Methods 104, 163–169 (2016). [DOI] [PMC free article] [PubMed] [Google Scholar]
- 83.Takemori A et al. PEPPI-MS: polyacrylamide-gel-based prefractionation for analysis of intact proteoforms and protein complexes by mass spectrometry. J. Proteome Res 19, 3779 (2020). [DOI] [PMC free article] [PubMed] [Google Scholar]
- 84.Cai W et al. Top-down proteomics of large proteins up to 223 kDa enabled by serial size exclusion chromatography strategy. Anal. Chem 89, 5467 (2017). [DOI] [PMC free article] [PubMed] [Google Scholar]
- 85.Tucholski T et al. A top-down proteomics platform coupling serial size exclusion chromatography and Fourier transform ion cyclotron resonance mass spectrometry. Anal. Chem 91, 3835–3844 (2019). [DOI] [PMC free article] [PubMed] [Google Scholar]
- 86.Wang Y & Olesik SV Enhanced-fluidity liquid chromatography-mass spectrometry for intact protein separation and characterization. Anal. Chem 91, 935 (2019). [DOI] [PubMed] [Google Scholar]
- 87.Liang Y et al. Bridged hybrid monolithic column coupled to high-resolution mass spectrometry for top-down proteomics. Anal. Chem 91, 1743 (2019). [DOI] [PMC free article] [PubMed] [Google Scholar]
- 88.García MC The effect of the mobile phase additives on sensitivity in the analysis of peptides and proteins by high-performance liquid chromatography-electrospray mass spectrometry. J. Chromatogr. B: Anal. Technol. Biomed. Life Sci 825, 111 (2005). [DOI] [PubMed] [Google Scholar]
- 89.Alpert AJ High-performance hydrophobic-interaction chromatography of proteins on a series of poly(alkyl aspart-amide)-silicas. J. Chromatogr. A 359, 85 (1986). [Google Scholar]
- 90.Muneeruddin K, Nazzaro M & Kaltashov IA Characterization of intact protein conjugates and biopharmaceuticals using ion-exchange chromatography with online detection by native electrospray ionization mass spectrometry and top-down tandem mass spectrometry. Anal. Chem 87, 10138 (2015). [DOI] [PubMed] [Google Scholar]
- 91.Queiroz JA, Tomaz CT & Cabral JMS Hydrophobic interaction chromatography of proteins. J. Biotechnol 87, 143 (2001). [DOI] [PubMed] [Google Scholar]
- 92.Xiu L, Valeja SG, Alpert AJ, Jin S & Ge Y Effective protein separation by coupling hydrophobic interaction and reverse phase chromatography for top-down proteomics. Anal. Chem 86, 7899 (2014). [DOI] [PMC free article] [PubMed] [Google Scholar]
- 93.Valeja SG et al. Three dimensional liquid chromatography coupling ion exchange chromatography/hydrophobic interaction chromatography/reverse phase chromatography for effective protein separation in top-down proteomics. Anal. Chem 87, 5363–5371 (2015). [DOI] [PMC free article] [PubMed] [Google Scholar]
- 94.Chen B et al. Online hydrophobic interaction chromatography–mass spectrometry for top-down proteomics. Anal. Chem 88, 1885 (2016). [DOI] [PMC free article] [PubMed] [Google Scholar]
- 95.Stoll DR & Carr PW Multi-dimensional Liquid Chromatography: Principles, Practice, and Applications (CRC Press, 2022). [Google Scholar]
- 96.Mondello L et al. Comprehensive two-dimensional liquid chromatography. Nat. Rev. Methods Primers 3, 86 (2023). [Google Scholar]
- 97.Sorensen MJ, Miller KE, Jorgenson JW, & Kennedy RT, Two-dimensional liquid chromatography-mass spectrometry for lipidomics using off-line coupling of hydrophilic interaction liquid chromatography with 50 cm long reversed phase capillary columns. J. Chromatogr. A 1687, 463707 (2023). [DOI] [PubMed] [Google Scholar]
- 98.Henley WH et al. High resolution separations of charge variants and disulfide isomers of monoclonal antibodies and antibody drug conjugates using ultra-high voltage capillary electrophoresis with high electric field strength. J. Chromatogr. A 1523, 72–79 (2017). [DOI] [PubMed] [Google Scholar]
- 99.Mehaffey MR, Xia Q & Brodbelt JS Uniting native capillary electrophoresis and multistage ultraviolet photodissociation mass spectrometry for online separation and characterization of Escherichia coli ribosomal proteins and protein complexes. Anal. Chem 92, 15202 (2020). [DOI] [PMC free article] [PubMed] [Google Scholar]
- 100.Shen X et al. Native proteomics in discovery mode using size-exclusion chromatography–capillary zone electrophoresis–tandem mass spectrometry. Anal. Chem 90, 10095 (2018). [DOI] [PMC free article] [PubMed] [Google Scholar]
- 101.Jooß K, McGee JP, Melani RD & Kelleher NL Standard procedures for native CZE-MS of proteins and protein complexes up to 800 kDa. Electrophoresis 42, 1050 (2021). [DOI] [PMC free article] [PubMed] [Google Scholar]
- 102.Chen D et al. Recent advances (2019–2021) of capillary electrophoresis–mass spectrometry for multilevel proteomics. Mass Spectr. Rev 42, 617–642 (2023). [DOI] [PMC free article] [PubMed] [Google Scholar]; Comprehensive overview of the history, applications and recent advances of capillary electrophoresis-based mass spectrometry.
- 103.Gomes FP & Yates JR III Recent trends of capillary electrophoresis-mass spectrometry in proteomics research. Mass Spectr. Rev 38, 445–460 (2019). [DOI] [PMC free article] [PubMed] [Google Scholar]
- 104.Stolz A et al. Recent advances in capillary electrophoresis-mass spectrometry: instrumentation, methodology and applications. Electrophoresis 40, 79 (2019). [DOI] [PubMed] [Google Scholar]
- 105.Fussl F, Trappe A, Carillo S, Jakes C & Bones J Comparative elucidation of cetuximab heterogeneity on the intact protein level by cation exchange chromatography and capillary electrophoresis coupled to mass spectrometry. Anal. Chem 92, 5431 (2020). [DOI] [PubMed] [Google Scholar]
- 106.Mack S et al. A novel microchip-based imaged CIEF-MS system for comprehensive characterization and identification of biopharmaceutical charge variants. Electrophoresis 40, 3084 (2019). [DOI] [PMC free article] [PubMed] [Google Scholar]
- 107.Baker ES et al. Enhancing bottom-up and top-down proteomic measurements with ion mobility separations. Proteomics 15, 2766 (2015). [DOI] [PMC free article] [PubMed] [Google Scholar]
- 108.Zinnel NF, Pai PJ & Russell DH Ion mobility-mass spectrometry (IM-MS) for top-down proteomics: increased dynamic range affords increased sequence coverage. Anal. Chem 84, 3390 (2012). [DOI] [PubMed] [Google Scholar]
- 109.Nshanian M et al. Native top-down mass spectrometry and ion mobility spectrometry of the interaction of tau protein with a molecular tweezer assembly modulator. J. Am. Soc. Mass Spectrom 30, 16 (2019). [DOI] [PMC free article] [PubMed] [Google Scholar]
- 110.Dodds JN & Baker ES Ion mobility spectrometry: fundamental concepts, instrumentation, applications, and the road ahead. J. Am. Soc. Mass Spectrom 30, 2185–2195 (2019). [DOI] [PMC free article] [PubMed] [Google Scholar]
- 111.Polasky DA et al. Pervasive charge solvation permeates native-like protein ions and dramatically influences top-down sequencing data. J. Am. Chem. Soc 142, 6750–6760 (2020). [DOI] [PubMed] [Google Scholar]
- 112.Roberts DS et al. Structural O-glycoform heterogeneity of the SARS-CoV-2 spike protein receptor-binding domain revealed by top-down mass spectrometry. J. Am.Chem. Soc 143, 12014 (2021). [DOI] [PMC free article] [PubMed] [Google Scholar]
- 113.Liu FC, Cropley TC, Ridgeway ME, Park MA & Bleiholder C Structural analysis of the glycoprotein complex avidin by tandem-trapped ion mobility spectrometry-mass spectrometry (tandem-TIMS/MS). Anal. Chem 92, 4459–4467 (2020). [DOI] [PMC free article] [PubMed] [Google Scholar]
- 114.Gerbasi VR et al. Deeper protein identification using field asymmetric ion mobility spectrometry in top-down proteomics. Anal. Chem 93, 6323–6328 (2021). [DOI] [PMC free article] [PubMed] [Google Scholar]
- 115.Fulcher JM et al. Enhancing top-down proteomics of brain tissue with FAIMS. J. Proteome Res 20, 2780–2795 (2021). [DOI] [PMC free article] [PubMed] [Google Scholar]
- 116.Xu T, Wang Q, Wang Q & Sun L Coupling high-field asymmetric waveform ion mobility spectrometry with capillary zone electrophoresis-tandem mass spectrometry for top-down proteomics. Anal. Chem 95, 9497–9504 (2023). [DOI] [PMC free article] [PubMed] [Google Scholar]
- 117.Macias LA, Santos IC & Brodbelt JS Ion activation methods for peptides and proteins. Anal. Chem 92, 227–251 (2020). [DOI] [PMC free article] [PubMed] [Google Scholar]
- 118.Little DP, Speir JP, Senko MW, O’Connor PB & McLafferty FW Infrared multiphoton dissociation of large multiply charged ions for biomolecule sequencing. Anal. Chem 66, 2809–2815 (1994). [DOI] [PubMed] [Google Scholar]
- 119.Lermyte F, Valkenborg D, Loo JA & Sobott F Radical solutions: principles and application of electron-based dissociation in mass spectrometry-based analysis of protein structure. Mass Spectrom. Rev 37, 750–771 (2018). [DOI] [PMC free article] [PubMed] [Google Scholar]
- 120.Syka JE, Coon JJ, Schroeder MJ, Shabanowitz J & Hunt DF Peptide and protein sequence analysis by electron transfer dissociation mass spectrometry. Proc. Natl Acad. Sci. USA 101, 9528 (2004). [DOI] [PMC free article] [PubMed] [Google Scholar]
- 121.Cleland TP et al. High-throughput analysis of intact human proteins using UVPD and HCD on an Orbitrap mass spectrometer. J. Proteome Res 16, 2072–2079 (2017). [DOI] [PMC free article] [PubMed] [Google Scholar]
- 122.Foreman DJ & McLuckey SA Recent developments in gas-phase ion/ion reactions for analytical mass spectrometry. Anal. Chem 92, 252–266 (2020). [DOI] [PMC free article] [PubMed] [Google Scholar]
- 123.Lai Y-H & Wang Y-S Advances in high-resolution mass spectrometry techniques for analysis of high mass-to-charge ions. Mass Spectrom. Rev 42, 2426–2445 (2023). [DOI] [PubMed] [Google Scholar]
- 124.Chen B, Brown KA, Lin Z & Ge Y Top-down proteomics: ready for prime time? Anal. Chem 90, 110–127 (2018). [DOI] [PMC free article] [PubMed] [Google Scholar]
- 125.Gillet LC et al. Targeted data extraction of the MS/MS spectra generated by data-independent acquisition: a new concept for consistent and accurate proteome analysis. Mol. Cell. Proteom 11, 17 (2012). [DOI] [PMC free article] [PubMed] [Google Scholar]
- 126.Meier F et al. diaPASEF: parallel accumulation–serial fragmentation combined with data-independent acquisition. Nat. Methods 17, 1229–1236 (2020). [DOI] [PubMed] [Google Scholar]
- 127.Guner H et al. MASH suite: a user-friendly and versatile software interface for high-resolution mass spectrometry data interpretation and visualization. J. Am. Soc. Mass Spectrom 25, 464 (2014). [DOI] [PMC free article] [PubMed] [Google Scholar]
- 128.Anderson NL & Anderson NG The human plasma proteome: history, character, and diagnostic prospects. Mol. Cell. Proteom 1, 845 (2002). [DOI] [PubMed] [Google Scholar]
- 129.Horn DM, Zubarev RA & McLafferty FW Automated reduction and interpretation of high resolution electrospray mass spectra of large molecules. J. Am. Soc. Mass Spectrom 11, 320–332 (2000). [DOI] [PubMed] [Google Scholar]
- 130.Liu X et al. Deconvolution and database search of complex tandem mass spectra of intact proteins: a combinatorial approach. Mol. Cell. Proteom 9, 2772–2782 (2010). [DOI] [PMC free article] [PubMed] [Google Scholar]
- 131.Park J et al. Informed-proteomics: open-source software package for top-down proteomics. Nat. Methods 14, 909 (2017). [DOI] [PMC free article] [PubMed] [Google Scholar]
- 132.Yuan ZF et al. pParse: a method for accurate determination of monoisotopic peaks in high-resolution mass spectra. Proteomics 12, 226–235 (2012). [DOI] [PubMed] [Google Scholar]
- 133.Jeong K et al. FLASHDeconv: ultrafast, high-quality feature deconvolution for top-down proteomics. Cell Syst. 10, 213 (2020). [DOI] [PubMed] [Google Scholar]
- 134.Kou Q, Wu S & Liu XW A new scoring function for top-down spectral deconvolution. BMC Genomics 15, 1140 (2014). [DOI] [PMC free article] [PubMed] [Google Scholar]
- 135.Basharat AR, Zang Y, Sun L & Liu X TopFD: a proteoform feature detection tool for top-down proteomics. Anal. Chem 95, 8189–8196 (2023). [DOI] [PMC free article] [PubMed] [Google Scholar]
- 136.Marty MT et al. Bayesian deconvolution of mass and ion mobility spectra: from binary interactions to polydisperse ensembles. Anal. Chem 87, 4370–4376 (2015). [DOI] [PMC free article] [PubMed] [Google Scholar]
- 137.Pedrioli PG et al. A common open representation of mass spectrometry data and its application to proteomics research. Nat. Biotechnol 22, 1459–1466 (2004). [DOI] [PubMed] [Google Scholar]
- 138.Martens L et al. mzML — a community standard for mass spectrometry data. Mol. Cell. Proteom 10, R110 000133 (2011). [DOI] [PMC free article] [PubMed] [Google Scholar]
- 139.Wilhelm M, Kirchner M, Steen JAJ & Steen H mz5: space- and time-efficient storage of mass spectrometry data sets. Mol. Cell. Proteom 11, O111 011379 (2012). [DOI] [PMC free article] [PubMed] [Google Scholar]
- 140.Kessner D, Chambers M, Burke R, Agus D & Mallick P ProteoWizard: open source software for rapid proteomics tools development. Bioinformatics 24, 2534–2536 (2008). [DOI] [PMC free article] [PubMed] [Google Scholar]
- 141.Cote RG, Reisinger F & Martens L jmzML, an open-source Java API for mzML, the PSI standard for MS data. Proteomics 10, 1332–1335 (2010). [DOI] [PubMed] [Google Scholar]
- 142.Horlacher O et al. MzJava: an open source library for mass spectrometry data processing. J. Proteom 129, 63–70 (2015). [DOI] [PubMed] [Google Scholar]
- 143.Kosters M et al. pymzML v2.0: introducing a highly compressed and seekable gzip format. Bioinformatics 34, 2513–2514 (2018). [DOI] [PubMed] [Google Scholar]
- 144.Avtonomov DM, Raskind A & Nesvizhskii AI BatMass: a Java software platform for LC-MS data visualization in proteomics and metabolomics. J. Proteome Res 15, 2500–2509 (2016). [DOI] [PMC free article] [PubMed] [Google Scholar]
- 145.Röst HL et al. OpenMS: a flexible open-source software platform for mass spectrometry data analysis. Nat. Methods 13, 741 (2016). [DOI] [PubMed] [Google Scholar]
- 146.Wu Z et al. MASH explorer: a universal software environment for top-down proteomics. J. Proteome Res 19, 3867–3876 (2020). [DOI] [PMC free article] [PubMed] [Google Scholar]
- 147.Larson EJ et al. MASH Native: a unified solution for native top-down proteomics data processing. Bioinformatics 39, btad359 (2023). [DOI] [PMC free article] [PubMed] [Google Scholar]
- 148.Choi IK, Jiang T, Kankara SR, Wu S & Liu X TopMSV: a web-based tool for top-down mass spectrometry data visualization. J. Am. Soc. Mass Spectrom 32, 1312–1318 (2021). [DOI] [PMC free article] [PubMed] [Google Scholar]
- 149.Nagornov KO, Kozhinov AN, Gasilova N, Menin L & Tsybin YO Transient-mediated simulations of FTMS isotopic distributions and mass spectra to guide experiment design and data analysis. J. Am. Soc. Mass Spectrom 31, 1927–1942 (2020). [DOI] [PubMed] [Google Scholar]
- 150.Chen W & Liu X Proteoform identification by combining RNA-seq and top-down mass spectrometry. J. Proteome Res 20, 261–269 (2021). [DOI] [PMC free article] [PubMed] [Google Scholar]
- 151.UniProt C UniProt: a worldwide hub of protein knowledge. Nucleic acids Res. 47, D506–D515 (2019). [DOI] [PMC free article] [PubMed] [Google Scholar]
- 152.O’Leary NA et al. Reference sequence (RefSeq) database at NCBI: current status, taxonomic expansion, and functional annotation. Nucleic Acids Res. 44, D733–D745 (2016). [DOI] [PMC free article] [PubMed] [Google Scholar]
- 153.Frankish A et al. GENCODE reference annotation for the human and mouse genomes. Nucleic Acids Res. 47, D766–D773 (2019). [DOI] [PMC free article] [PubMed] [Google Scholar]
- 154.Zamdborg L et al. ProSight PTM 2.0: improved protein identification and characterization for top down mass spectrometry. Nucleic Acids Res. 35, W701 (2007). [DOI] [PMC free article] [PubMed] [Google Scholar]
- 155.Kou Q et al. A mass graph-based approach for the identification of modified proteoforms using top-down tandem mass spectra. Bioinformatics 33, 1309–1316 (2017). [DOI] [PMC free article] [PubMed] [Google Scholar]
- 156.Kou Q, Wu S & Liu X Systematic evaluation of protein sequence filtering algorithms for proteoform identification using top-down mass spectrometry. Proteomics 10.1002/pmic.201700306 (2018). [DOI] [PMC free article] [PubMed] [Google Scholar]
- 157.Solntsev SK, Shortreed MR, Frey BL & Smith LM Enhanced global post-translational modification discovery with MetaMorpheus. J. Proteome Res 17, 1844–1851 (2018). [DOI] [PubMed] [Google Scholar]
- 158.Mann M & Wilm M Error-tolerant identification of peptides in sequence databases by peptide sequence tags. Anal. Chem 66, 4390–4399 (1994). [DOI] [PubMed] [Google Scholar]
- 159.Liu X, Mammana A & Bafna V Speeding up tandem mass spectral identification using indexes. Bioinformatics 28, 1692–1697 (2012). [DOI] [PMC free article] [PubMed] [Google Scholar]
- 160.Kong AT, Leprevost FV, Avtonomov DM, Mellacheruvu D & Nesvizhskii AI MSFragger: ultrafast and comprehensive peptide identification in mass spectrometry-based proteomics. Nat. Methods 14, 513–520 (2017). [DOI] [PMC free article] [PubMed] [Google Scholar]
- 161.Kou Q, Xun L & Liu X TopPIC: a software tool for top-down mass spectrometry-based proteoform identification and characterization. Bioinformatics 32, 3495–3497 (2016). [DOI] [PMC free article] [PubMed] [Google Scholar]
- 162.Frank AM, Pesavento JJ, Mizzen CA, Kelleher NL & Pevzner PA Interpreting top-down mass spectra using spectral alignment. Anal. Chem 80, 2499–2505 (2008). [DOI] [PubMed] [Google Scholar]
- 163.Pevzner PA, Dancik V & Tang CL Mutation-tolerant protein identification by mass spectrometry. J. Comput. Biol 7, 777–787 (2000). [DOI] [PubMed] [Google Scholar]
- 164.Liu X et al. Identification of ultramodified proteins using top-down tandem mass spectra. J. Proteome Res 12, 5830–5838 (2013). [DOI] [PMC free article] [PubMed] [Google Scholar]
- 165.Melby JA et al. High sensitivity top-down proteomics captures single muscle cell heterogeneity in large proteoforms. Proc. Natl Acad. Sci. USA 120, e2222081120 (2023). [DOI] [PMC free article] [PubMed] [Google Scholar]; This article demonstrates that high-sensitivity top-down proteomics effectively captures the diverse proteoforms and heterogeneity of single muscle cells, providing insights into cellular complexity at the protein level.
- 166.Cai W et al. An unbiased proteomics method to assess the maturation of human pluripotent stem cell-derived cardiomyocytes. Circ. Res 125, 936–953 (2019). [DOI] [PMC free article] [PubMed] [Google Scholar]
- 167.Bayne EF et al. Top-down proteomics of myosin light chain isoforms define chamber-specific expression in the human heart. J. Mol. Cell. Cardiol 181, 89–97 (2023). [DOI] [PMC free article] [PubMed] [Google Scholar]
- 168.Brodbelt JS Deciphering combinatorial post-translational modifications by top-down mass spectrometry. Curr. Opin. Chem. Biol 70, 102180 (2022). [DOI] [PMC free article] [PubMed] [Google Scholar]; This publication reviews the current state-of-the-art mass spectrometry techniques used to chracterize complex proteoforms, including combinatorial post-translational modifications, by top-down mass spectrometry.
- 169.Yuan Z-F, Arnaudo AM & Garcia BA Mass spectrometric analysis of histone proteoforms. Annu. Rev. Anal. Chem 7, 113–128 (2014). [DOI] [PMC free article] [PubMed] [Google Scholar]
- 170.Jeanne Dit Fouque K et al. Top-’double-down’ mass spectrometry of histone H4 proteoforms: tandem ultraviolet-photon and mobility/mass-selected electron capture dissociations. Anal. Chem 94, 15377–15385 (2022). [DOI] [PMC free article] [PubMed] [Google Scholar]
- 171.Holt MV, Wang T & Young NL High-throughput quantitative top-down proteomics: histone H4. J. Am. Soc. Mass Spectrom 30, 2548–2560 (2019). [DOI] [PubMed] [Google Scholar]
- 172.Schachner LF et al. Decoding the protein composition of whole nucleosomes with Nuc-MS. Nat. Methods 18, 303 (2021). [DOI] [PMC free article] [PubMed] [Google Scholar]
- 173.Cupp-Sutton KA & Wu S High-throughput quantitative top-down proteomics. Mol. Omics 16, 91–99 (2020). [DOI] [PMC free article] [PubMed] [Google Scholar]; This publication reviews recent strategies in the quantitative analysis of complex protein mixtures and compares various methods for quantitative top-down proteomics.
- 174.Neilson KA et al. Less label, more free: approaches in label-free quantitative mass spectrometry. Proteomics 11, 535–553 (2011). [DOI] [PubMed] [Google Scholar]
- 175.Ntai I et al. Applying label-free quantitation to top down proteomics. Anal. Chem 86, 4961–4968 (2014). [DOI] [PMC free article] [PubMed] [Google Scholar]
- 176.Winkels K, Koudelka T & Tholey A Quantitative top-down proteomics by isobaric labeling with thiol-directed tandem mass tags. J. Proteome Res 20, 4495–4506 (2021). [DOI] [PubMed] [Google Scholar]
- 177.Guo Y, Yu D, Cupp-Sutton KA, Liu X & Wu S Optimization of protein-level tandem mass tag (TMT) labeling conditions in complex samples with top-down proteomics. Anal. Chim. Acta 1221, 340037 (2022). [DOI] [PMC free article] [PubMed] [Google Scholar]
- 178.Rauniyar N & Yates JR III Isobaric labeling-based relative quantification in shotgun proteomics. J. Proteome Res 13, 5293–5309 (2014). [DOI] [PMC free article] [PubMed] [Google Scholar]
- 179.Mazur MT et al. Quantitative analysis of intact apolipoproteins in human HDL by top-down differential mass spectrometry. Proc. Natl Acad. Sci. USA 107, 7728–7733 (2010). [DOI] [PMC free article] [PubMed] [Google Scholar]
- 180.Wu S et al. Quantitative analysis of human salivary gland-derived intact proteome using top-down mass spectrometry. Proteomics 14, 1211–1222 (2014). [DOI] [PubMed] [Google Scholar]
- 181.Shen B et al. Capillary electrophoresis mass spectrometry for scalable single-cell proteomics. Front. Chem 10, 863979 (2022). [DOI] [PMC free article] [PubMed] [Google Scholar]
- 182.Lombard-Banek C, Moody SA, Manzini MC & Nemes P Microsampling capillary electrophoresis mass spectrometry enables single-cell proteomics in complex tissues developing cell clones in live Xenopus laevis and zebrafish embryos. Anal. Chem 91, 4797–4805 (2019). [DOI] [PMC free article] [PubMed] [Google Scholar]
- 183.Choi SB, Polter AM & Nemes P Patch-clamp proteomics of single neurons in tissue using electrophysiology and subcellular capillary electrophoresis mass spectrometry. Anal. Chem 94, 1637–1644 (2022). [DOI] [PubMed] [Google Scholar]
- 184.Wang T, Holt MV & Young NL The histone H4 proteoform dynamics in response to SUV4-20 inhibition reveals single molecule mechanisms of inhibitor resistance. Epigenet. Chromatin 11, 29 (2018). [DOI] [PMC free article] [PubMed] [Google Scholar]
- 185.Zhang J et al. Top-down quantitative proteomics identified phosphorylation of cardiac troponin I as a candidate biomarker for chronic heart failure. J. Proteome Res 10, 4054–4065 (2011). [DOI] [PMC free article] [PubMed] [Google Scholar]
- 186.DiMaggio PA Jr, Young NL, Baliban RC, Garcia BA. & Floudas CA. A mixed integer linear optimization framework for the identification and quantification of targeted post-translational modifications of highly modified proteins using multiplexed electron transfer dissociation tandem mass spectrometry. Mol. Cell. Proteom 8, 2527–2543 (2009). [DOI] [PMC free article] [PubMed] [Google Scholar]
- 187.Chapman EA et al. Defining the sarcomeric proteoform landscape in ischemic cardiomyopathy by top-down proteomics. J. Proteome Res 22, 931–941 (2023). [DOI] [PMC free article] [PubMed] [Google Scholar]
- 188.Lin Z et al. Simultaneous quantification of protein expression and modifications by top-down targeted proteomics: a case of the sarcomeric subproteome. Mol. Cell. Proteom 18, 594–605 (2019). [DOI] [PMC free article] [PubMed] [Google Scholar]
- 189.Hummel J et al. ProMEX: a mass spectral reference database for proteins and protein phosphorylation sites. BMC Bioinformatics 8, 216 (2007). [DOI] [PMC free article] [PubMed] [Google Scholar]
- 190.DeHart CJ, Fellers RT, Fornelli L, Kelleher NL & Thomas PM in Protein Bioinformatics: From Protein Modifications and Networks to Proteomics (eds Wu CH, Arighi CN. & Ross KE.) 381–394 (Springer New York, 2017). [Google Scholar]
- 191.Lu L, Scalf M, Shortreed MR & Smith LM Mesh fragmentation improves dissociation efficiency in top-down proteomics. J. Am. Soc. Mass Spectrom 32, 1319–1325 (2021). [DOI] [PMC free article] [PubMed] [Google Scholar]
- 192.Lee S-W et al. Direct mass spectrometric analysis of intact proteins of the yeast large ribosomal subunit using capillary LC/FTICR. Proc. Natl Acad. Sci. USA 99, 5942–5947 (2002). [DOI] [PMC free article] [PubMed] [Google Scholar]
- 193.Perkins DN, Pappin DJC, Creasy DM & Cottrell JS Probability-based protein identification by searching sequence databases using mass spectrometry data. Electrophoresis 20, 3551–3567 (1999). [DOI] [PubMed] [Google Scholar]
- 194.Deininger S-O et al. Normalization in MALDI-TOF imaging datasets of proteins: practical considerations. Anal. Bioanal. Chem 401, 167–181 (2011). [DOI] [PMC free article] [PubMed] [Google Scholar]
- 195.Zhu Y et al. Proteomic analysis of single mammalian cells enabled by microfluidic nanodroplet sample preparation and ultrasensitive NanoLC-MS. Angew. Chem. Int. Ed 57, 12370–12374 (2018). [DOI] [PMC free article] [PubMed] [Google Scholar]
- 196.Zhu Y et al. Nanodroplet processing platform for deep and quantitative proteome profiling of 10–100 mammalian cells. Nat. Commun 9, 882 (2018). [DOI] [PMC free article] [PubMed] [Google Scholar]
- 197.Cong Y et al. Ultrasensitive single-cell proteomics workflow identifies >1000 protein groups per mammalian cell. Chem. Sci 12, 1001–1006 (2021). [DOI] [PMC free article] [PubMed] [Google Scholar]
- 198.Sinclair J & Timms JF Quantitative profiling of serum samples using TMT protein labelling, fractionation and LC–MS/MS. Methods 54, 361–369 (2011). [DOI] [PubMed] [Google Scholar]
- 199.Wiese S, Reidegeld KA, Meyer HE & Warscheid B Protein labeling by iTRAQ: a new tool for quantitative mass spectrometry in proteome research. Proteomics 7, 340–350 (2007). [DOI] [PubMed] [Google Scholar]
- 200.Prudova A, auf dem Keller U, Butler GS & Overall CM Multiplex N-terminome analysis of MMP-2 and MMP-9 substrate degradomes by iTRAQ-TAILS quantitative proteomics. Mol. Cell. Proteom 9, 894–911 (2010). [DOI] [PMC free article] [PubMed] [Google Scholar]
- 201.Yu D et al. Quantitative top-down proteomics in complex samples using protein-level tandem mass tag labeling. J. Am. Soc. Mass Spectrom 32, 1336–1344 (2021). [DOI] [PMC free article] [PubMed] [Google Scholar]
- 202.Guo Y et al. Optimization of higher-energy collisional dissociation fragmentation energy for intact protein-level tandem mass tag labeling. J. Proteome Res 22, 1406–1418 (2023). [DOI] [PMC free article] [PubMed] [Google Scholar]
- 203.Collier TS, Sarkar P, Rao B & Muddiman DC Quantitative top-down proteomics of SILAC labeled human embryonic stem cells. J. Am. Soc. Mass Spectrom 21, 879–889 (2010). [DOI] [PubMed] [Google Scholar]
- 204.Hung CW & Tholey A Tandem mass tag protein labeling for top-down identification and quantification. Anal. Chem 84, 161–170 (2012). [DOI] [PubMed] [Google Scholar]
- 205.Fang HQ et al. Intact protein quantitation using pseudoisobaric dimethyl labeling. Anal. Chem 88, 7198–7205 (2016). [DOI] [PubMed] [Google Scholar]
- 206.Rhoads TW et al. Neutron-encoded mass signatures for quantitative top-down proteomics. Anal. Chem 86, 2314–2319 (2014). [DOI] [PMC free article] [PubMed] [Google Scholar]
- 207.Shortreed MR et al. Elucidating proteoform families from proteoform intact-mass and lysine-count measurements. J. Proteome Res 15, 1213–1221 (2016). [DOI] [PMC free article] [PubMed] [Google Scholar]
- 208.Dai Y et al. Elucidating Escherichia coli proteoform families using intact-mass proteomics and a global PTM discovery database. J. Proteome Res 16, 4156–4165 (2017). [DOI] [PMC free article] [PubMed] [Google Scholar]
- 209.Nesvizhskii AI, Vitek O & Aebersold R Analysis and validation of proteomic data generated by tandem mass spectrometry. Nat. Methods 4, 787–797 (2007). [DOI] [PubMed] [Google Scholar]
- 210.Kou Q et al. A Markov chain Monte Carlo method for estimating the statistical significance of proteoform identifications by top-down mass spectrometry. J. Proteome Res 18, 878–889 (2018). [DOI] [PMC free article] [PubMed] [Google Scholar]
- 211.Elias JE & Gygi SP Target-decoy search strategy for increased confidence in large-scale protein identifications by mass spectrometry. Nat. Methods 4, 207–214 (2007). [DOI] [PubMed] [Google Scholar]
- 212.Smith LM et al. A five-level classification system for proteoform identifications. Nat. Methods 16, 939–940 (2019). [DOI] [PMC free article] [PubMed] [Google Scholar]
- 213.Gregorich ZR et al. Top-down targeted proteomics reveals decrease in myosin regulatory light-chain phosphorylation that contributes to sarcopenic muscle dysfunction. J. Proteome Res 15, 2706 (2016). [DOI] [PMC free article] [PubMed] [Google Scholar]
- 214.Tucholski T et al. Distinct hypertrophic cardiomyopathy genotypes result in convergent sarcomeric proteoform profiles revealed by top-down proteomics. Proc. Natl Acad. Sci. USA 117, 24691 (2020). [DOI] [PMC free article] [PubMed] [Google Scholar]; This publication uses top-down proteomics to reveal a common pattern of altered sarcomeric proteoforms across hypertrophic cardiomyopathy patient tissues that are independent of disease-causing mutations and suggests that proteoforms can better reflect disease phenotypes than individual gene mutation.
- 215.Savitski MM, Wilhelm M, Hahne H, Kuster B & Bantscheff M A scalable approach for protein false discovery rate estimation in large proteomic data sets. Mol. Cell. Proteom 14, 2394–2404 (2015). [DOI] [PMC free article] [PubMed] [Google Scholar]
- 216.Sun RX et al. PTop 1.0: a high-accuracy and high-efficiency search engine for intact protein identification. Anal. Chem 88, 3082 (2016). [DOI] [PubMed] [Google Scholar]
- 217.Liu X et al. Protein identification using top-down spectra. Mol. Cell. Proteom 11, M111 008524 (2012). [DOI] [PMC free article] [PubMed] [Google Scholar]
- 218.LeDuc RD et al. The C-score: a Bayesian framework to sharply improve proteoform scoring in high-throughput top down proteomics. J. Proteome Res 13, 3231–3240 (2014). [DOI] [PMC free article] [PubMed] [Google Scholar]
- 219.Kou Q et al. Characterization of proteoforms with unknown post-translational modifications using the MIScore. J. Proteome Res 15, 2422–2432 (2016). [DOI] [PMC free article] [PubMed] [Google Scholar]
- 220.Martin EA, Fulcher JM, Zhou M, Monroe ME & Petyuk VA TopPICR: a companion R package for top-down proteomics data analysis. J. Proteome Res 22, 399–409 (2023). [DOI] [PMC free article] [PubMed] [Google Scholar]
- 221.LeDuc RD et al. ProSight PTM: an integrated environment for protein identification and characterization by top-down mass spectrometry. Nucleic Acids Res. 32, W340 (2004). [DOI] [PMC free article] [PubMed] [Google Scholar]
- 222.Fellers RT et al. ProSight lite: graphical software to analyze top-down mass spectrometry data. Proteomics 15, 1235 (2015). [DOI] [PMC free article] [PubMed] [Google Scholar]
- 223.Das S, Rai A, Merchant ML, Cave MC & Rai SN A comprehensive survey of statistical approaches for differential expression analysis in single-cell RNA sequencing studies. Genes 12, 1947 (2021). [DOI] [PMC free article] [PubMed] [Google Scholar]
- 224.Kohler D et al. MSstats version 4.0: statistical analyses of quantitative mass spectrometry-based proteomic experiments with chromatography-based quantification at scale. J. Proteome Res 22, 1466–1482 (2023). [DOI] [PMC free article] [PubMed] [Google Scholar]
- 225.Cox J & Mann M MaxQuant enables high peptide identification rates, individualized p.p.b.-range mass accuracies and proteome-wide protein quantification. Nat. Biotechnol 26, 1367–1372 (2008). [DOI] [PubMed] [Google Scholar]
- 226.Durbin KR et al. Quantitation and identification of thousands of human proteoforms below 30 kDa. J. Proteome Res 15, 976–982 (2016). [DOI] [PMC free article] [PubMed] [Google Scholar]
- 227.Drown BS et al. Mapping the proteoform landscape of five human tissues. J. Proteome Res 21, 1299–1310 (2022). [DOI] [PMC free article] [PubMed] [Google Scholar]
- 228.Kafader JO et al. Multiplexed mass spectrometry of individual ions improves measurement of proteoforms and their complexes. Nat. Methods 17, 391–394 (2020). [DOI] [PMC free article] [PubMed] [Google Scholar]
- 229.Peng Y. et al. Top-down proteomics reveals concerted reductions in myofilament and z-disc protein phosphorylation after acute myocardial infarction. Mol. Cell. Proteom 13, 2752–2764 (2014). [DOI] [PMC free article] [PubMed] [Google Scholar]
- 230.de Tombe PP & Solaro RJ Integration of cardiac myofilament activity and regulation with pathways signaling hypertrophy and failure. Ann. Biomed. Eng 28, 991–1001 (2000). [DOI] [PubMed] [Google Scholar]
- 231.Bystrom C. et al. Clinical utility of insulin-like growth factor 1 and 2; determination by high resolution mass spectrometry. PLoS ONE 7, e43457 (2012). [DOI] [PMC free article] [PubMed] [Google Scholar]
- 232.Kellie JF et al. Quantitative measurement of intact alpha-synuclein proteoforms from post-mortem control and Parkinson’s disease brain tissue by intact protein mass spectrometry. Sci. Rep 4, 43457 (2014). [DOI] [PMC free article] [PubMed] [Google Scholar]
- 233.Azad NS et al. Proteomics in clinical trials and practice. Mol. Cell. Proteom 5, 1819 (2006). [DOI] [PubMed] [Google Scholar]
- 234.Petricoin EF et al. Use of proteomic patterns in serum to identify ovarian cancer. Lancet 359, 572–577 (2002). [DOI] [PubMed] [Google Scholar]
- 235.Toby TK et al. A comprehensive pipeline for translational top-down proteomics from a single blood draw. Nat. Protoc 14, 119–152 (2019). [DOI] [PMC free article] [PubMed] [Google Scholar]
- 236.Ntai I. et al. Precise characterization of KRAS4b proteoforms in human colorectal cells and tumors reveals mutation/modification cross-talk. Proc. Natl Acad. Sci. USA 115, 4140–4145 (2018). [DOI] [PMC free article] [PubMed] [Google Scholar]; This publication describes a top-down proteomics assay for detecting and quantifying KRAS proteoforms and reveals the importance of measuring post-translational modifications on mutant-specific proteoforms to understand how individual KRAS proteoforms are linked to disease stage and chance of survival.
- 237.McCool EN et al. Deep top-down proteomics revealed significant proteoform-level differences between metastatic and nonmetastatic colorectal cancer cells. Sci. Adv 8, eabq6348 (2022). [DOI] [PMC free article] [PubMed] [Google Scholar]
- 238.Vaduganathan M, Mensah George A, Turco Justine V, Fuster V & Roth Gregory A The global burden of cardiovascular diseases and risk. J. Am. Coll. Cardiol 80, 2361–2371 (2022). [DOI] [PubMed] [Google Scholar]
- 239.Lam MPY, Ping P & Murphy E Proteomics research in cardiovascular medicine and biomarker discovery. J. Am. Coll. Cardiol 68, 2819–2830 (2016). [DOI] [PMC free article] [PubMed] [Google Scholar]
- 240.Cai WX, Tucholski TM, Gregorich ZR & Ge Y Top-down proteomics: technology advancements and applications to heart diseases. Expert Rev. Proteom 13, 717–730 (2016). [DOI] [PMC free article] [PubMed] [Google Scholar]
- 241.Wilkins JT et al. Spectrum of apolipoprotein AI and apolipoprotein AII proteoforms and their associations with indices of cardiometabolic health: the CARDIA study. J. Am. Heart Assoc 10, e019890 (2021). [DOI] [PMC free article] [PubMed] [Google Scholar]
- 242.Chen Y-C et al. Effective top-down LC/MS+ method for assessing actin isoforms as a potential cardiac disease marker. Anal. Chem 87, 8399–8406 (2015). [DOI] [PMC free article] [PubMed] [Google Scholar]
- 243.Shrivastava SR, Shrivastava PS & Ramasamy J Dementia in middle- and low-income nations: a public health priority. J. Res. Med. Sci 21, 5 (2016). [DOI] [PMC free article] [PubMed] [Google Scholar]
- 244.Schaffert L-N & Carter WG Do post-translational modifications influence protein aggregation in neurodegenerative diseases: a systematic review. Brain Sci. 10, 232 (2020). [DOI] [PMC free article] [PubMed] [Google Scholar]
- 245.Schmitt ND & Agar JN Parsing disease-relevant protein modifications from epiphenomena: perspective on the structural basis of SOD1-mediated ALS. J. Mass Spectrom 52, 480–491 (2017). [DOI] [PMC free article] [PubMed] [Google Scholar]
- 246.Wesseling H. et al. Tau PTM profiles identify patient heterogeneity and stages of Alzheimer’s disease. Cell 183, 1699–1713.e13 (2020). [DOI] [PMC free article] [PubMed] [Google Scholar]
- 247.Su P. et al. Single cell analysis of proteoforms. J. Proteome Res 10.1021/acs.jproteome.4c00075 (2024). [DOI] [PMC free article] [PubMed] [Google Scholar]
- 248.Chamot-Rooke J. et al. Posttranslational modification of pili upon cell contact triggers N. meningitidis dissemination. Science 331, 778–782 (2011). [DOI] [PubMed] [Google Scholar]
- 249.Gault J. et al. Neisseria meningitidis type IV Pili composed of sequence invariable pilins are masked by multisite glycosylation. PLoS Pathog. 11, e1005162 (2015). [DOI] [PMC free article] [PubMed] [Google Scholar]
- 250.Ansong C. et al. Top-down proteomics reveals a unique protein S-thiolation switch in Salmonella typhimurium in response to infection-like conditions. Proc. Natl Acad. Sci. USA 110, 10153–10158 (2013). [DOI] [PMC free article] [PubMed] [Google Scholar]
- 251.Dupre M. et al. Optimization of a top-down proteomics platform for closely related pathogenic bacterial discrimination. J. Proteome Res 20, 202–211 (2021). [DOI] [PubMed] [Google Scholar]
- 252.Havlikova J, May RC, Styles IB & Cooper HJ Liquid extraction surface analysis mass spectrometry of ESKAPE pathogens. J. Am. Soc. Mass Spectrom 32, 1345–1351 (2021). [DOI] [PMC free article] [PubMed] [Google Scholar]
- 253.Lutomski CA, El-Baba TJ, Bolla JR & Robinson CV Multiple roles of SARS-CoV-2 N protein facilitated by proteoform-specific interactions with RNA, host proteins, and convalescent antibodies. JACS Au 1, 1147–1157 (2021). [DOI] [PMC free article] [PubMed] [Google Scholar]
- 254.Roberts DS et al. Distinct core glycan and O-glycoform utilization of SARS-CoV-2 Omicron variant spike protein RBD revealed by top-down mass spectrometry. Chem. Sci 13, 10944–10949 (2022). [DOI] [PMC free article] [PubMed] [Google Scholar]
- 255.Walsh G & Walsh E Biopharmaceutical benchmarks 2022. Nat. Biotechnol 40, 1722–1760 (2022). [DOI] [PMC free article] [PubMed] [Google Scholar]
- 256.Srzentić K. et al. Interlaboratory study for characterizing monoclonal antibodies by top-down and middle-down mass spectrometry. J. Am. Soc. Mass Spectrom 31, 1783–1802 (2020). [DOI] [PMC free article] [PubMed] [Google Scholar]; Multilaboratory assessment of the current state of top-down mass spectrometry and middle-down mass spectrometry for characterizing monoclonal antibodies, including their post-translational modifications.
- 257.Campuzano IDG & Sandoval W Denaturing and native mass spectrometric analytics for biotherapeutic drug discovery research: historical, current, and future personal perspectives. J. Am. Soc. Mass Spectrom 32, 1861–1885 (2021). [DOI] [PubMed] [Google Scholar]
- 258.Fornelli L. et al. Structural analysis of monoclonal antibodies with top-down and middle-down electron transfer dissociation mass spectrometry: the first decade. Chimia 76, 114 (2022). [DOI] [PubMed] [Google Scholar]
- 259.Kline JT, Melani RD & Fornelli L Mass spectrometry characterization of antibodies at the intact and subunit levels: from targeted to large-scale analysis. Int. J. Mass Spectrom 492, 117117 (2023). [DOI] [PMC free article] [PubMed] [Google Scholar]
- 260.You J & Park H-M Progress in top-down LC–MS analysis of antibodies: review. Biotechnol. Bioprocess. Eng 28, 226–233 (2023). [Google Scholar]
- 261.Castel J, Delaux S, Hernandez-Alba O & Cianférani S Recent advances in structural mass spectrometry methods in the context of biosimilarity assessment: from sequence heterogeneities to higher order structures. J. Pharm. Biomed. Anal 236, 115696 (2023). [DOI] [PubMed] [Google Scholar]
- 262.Strop P. et al. Location matters: site of conjugation modulates stability and pharmacokinetics of antibody drug conjugates. Chem. Biol 20, 161–167 (2013). [DOI] [PubMed] [Google Scholar]
- 263.Yandrofski K. et al. Interlaboratory studies using the NISTmAb to advance biopharmaceutical structural analytics. Front. Mol. Biosci 9, 876780 (2022). [DOI] [PMC free article] [PubMed] [Google Scholar]
- 264.Chen B. et al. Middle-down multi-attribute analysis of antibody-drug conjugates with electron transfer dissociation. Anal. Chem 91, 11661–11669 (2019). [DOI] [PMC free article] [PubMed] [Google Scholar]
- 265.Chen B. et al. Online hydrophobic interaction chromatography-mass spectrometry for the analysis of intact monoclonal antibodies. Anal. Chem 90, 7135–7138 (2018). [DOI] [PMC free article] [PubMed] [Google Scholar]
- 266.Larson EJ et al. Rapid analysis of reduced antibody drug conjugate by online LC–MS/MS with Fourier transform ion cyclotron resonance mass spectrometry. Anal. Chem 92, 15096–15103 (2020). [DOI] [PMC free article] [PubMed] [Google Scholar]
- 267.Xu T. et al. Interrogating heterogeneity of cysteine-engineered antibody-drug conjugates and antibody-oligonucleotide conjugates by capillary zone electrophoresis–mass spectrometry. mAbs 15, 2229102 (2023). [DOI] [PMC free article] [PubMed] [Google Scholar]
- 268.Xu T, Han L & Sun L Automated capillary isoelectric focusing-mass spectrometry with ultrahigh resolution for characterizing microheterogeneity and isoelectric points of intact protein complexes. Anal. Chem 94, 9674–9682 (2022). [DOI] [PubMed] [Google Scholar]
- 269.Feng R & Konishi Y Collisionally-activated dissociation of multiply charged 150-kDa antibody ions. Anal. Chem 65, 645–649 (1993). [Google Scholar]
- 270.Zhang Z & Shah B Characterization of variable regions of monoclonal antibodies by top-down mass spectrometry. Anal. Chem 79, 5723–5729 (2007). [DOI] [PubMed] [Google Scholar]
- 271.Bondarenko PV, Second TP, Zabrouskov V, Makarov AA & Zhang Z Mass Measurement and top-down HPLC/MS analysis of intact monoclonal antibodies on a hybrid linear quadrupole ion trap–Orbitrap mass spectrometer. J. Am. Soc. Mass Spectrom 20, 1415–1424 (2009). [DOI] [PubMed] [Google Scholar]
- 272.Tsybin YO et al. Structural analysis of intact monoclonal antibodies by electron transfer dissociation mass spectrometry. Anal. Chem 83, 8919–8927 (2011). [DOI] [PubMed] [Google Scholar]
- 273.Fornelli L. et al. Analysis of intact monoclonal antibody IgG1 by electron transfer dissociation Orbitrap FTMS. Moi. Cell. Proteom 11, 1758–1767 (2012). [DOI] [PMC free article] [PubMed] [Google Scholar]
- 274.Melani RD et al. Direct measurement of light and heavy antibody chains using ion mobility and middle-down mass spectrometry. mAbs 11, 1351–1357 (2019). [DOI] [PMC free article] [PubMed] [Google Scholar]
- 275.Fornelli L, Ayoub D, Aizikov K, Beck A & Tsybin YO Middle-down analysis of monoclonal antibodies with electron transfer dissociation Orbitrap Fourier transform mass spectrometry. Anal. Chem 86, 3005–3012 (2014). [DOI] [PubMed] [Google Scholar]
- 276.Belov AM et al. Complementary middle-down and intact monoclonal antibody proteoform characterization by capillary zone electrophoresis–mass spectrometry. Electrophoresis 39, 2069–2082 (2018). [DOI] [PMC free article] [PubMed] [Google Scholar]
- 277.Römer J, Stolz A, Kiessig S, Moritz B & Neusüß C Online top-down mass spectrometric identification of CE(SDS)-separated antibody fragments by two-dimensional capillary electrophoresis. J. Pharm. Biomed. Anal 201, 114089 (2021). [DOI] [PubMed] [Google Scholar]
- 278.Nagy C, Andrási M, Hamidli N, Gyémánt G & Gáspár A Top-down proteomic analysis of monoclonal antibodies by capillary zone electrophoresis–mass spectrometry. J. Chromatogr. Open 2, 100024 (2022). [Google Scholar]
- 279.Wei B. et al. Added value of internal fragments for top-down mass spectrometry of intact monoclonal antibodies and antibody–drug conjugates. Anal. Chem 95, 9347–9356 (2023). [DOI] [PMC free article] [PubMed] [Google Scholar]
- 280.Srzentić K. et al. Multiplexed middle-down mass spectrometry as a method for revealing light and heavy chain connectivity in a monoclonal antibody. Anal. Chem 90, 12527–12535 (2018). [DOI] [PubMed] [Google Scholar]
- 281.Nassif X. A revolution in the identification of pathogens in clinical laboratories. Clin. Infect. Dis 49, 552–553 (2009). [DOI] [PubMed] [Google Scholar]
- 282.Lévesque S. et al. A side by side comparison of Bruker biotyper and VITEK MS: utility of MALDI-TOF MS technology for microorganism identification in a public health reference laboratory. PLoS ONE 10, e0144878 (2015). [DOI] [PMC free article] [PubMed] [Google Scholar]
- 283.Forgrave LM, Wang M, Yang D & DeMarco ML Proteoforms and their expanding role in laboratory medicine. Prac. Lab. Med 28, e00260 (2022). [DOI] [PMC free article] [PubMed] [Google Scholar]
- 284.Luo RY et al. Neutral-coating capillary electrophoresis coupled with high-resolution mass spectrometry for top-down identification of hemoglobin variants. Clin. Chem 69, 56–67 (2023). [DOI] [PubMed] [Google Scholar]
- 285.Barnidge DR et al. Using mass spectrometry to monitor monoclonal immunoglobulins in patients with a monoclonal gammopathy. J. Proteome Res 13, 1419–1427 (2014). [DOI] [PubMed] [Google Scholar]
- 286.Light-Wahl KJ et al. Collisionally activated dissociation and tandem mass spectrometry of intact hemoglobin β-chain variant proteins with electrospray ionization. Biol. Mass Spectrom 22, 112–120 (1993). [DOI] [PubMed] [Google Scholar]
- 287.Barnidge DR, Dispenzieri A, Merlini G, Katzmann JA & Murray DL Monitoring free light chains in serum using mass spectrometry. Clin. Chem. Lab. Med 54, 1073–1083 (2016). [DOI] [PubMed] [Google Scholar]
- 288.Mills JR et al. A universal solution for eliminating false positives in myeloma due to therapeutic monoclonal antibody interference. Blood 132, 670–672 (2018). [DOI] [PubMed] [Google Scholar]
- 289.Dispenzieri A. et al. N-glycosylation of monoclonal light chains on routine MASS-FIX testing is a risk factor for MGUS progression. Leukemia 34, 2749–2753 (2020). [DOI] [PMC free article] [PubMed] [Google Scholar]
- 290.He L. et al. Top-down proteomics — a near-future technique for clinical diagnosis? Ann. Transl. Med 8, 136 (2020). [DOI] [PMC free article] [PubMed] [Google Scholar]
- 291.Priego Capote F & Sanchez J-C Strategies for proteomic analysis of non-enzymatically glycated proteins. Mass Spectrom. Rev 28, 135–146 (2009). [DOI] [PubMed] [Google Scholar]
- 292.Tiambeng TN et al. in Methods in Enzymology Vol. 626 (ed. Garcia BA) 347–374 (Academic Press, 2019).31606082 [Google Scholar]
- 293.Ji Y. et al. Direct detection of S-palmitoylation by mass spectrometry. Anal. Chem 85, 11952–11959 (2013). [DOI] [PMC free article] [PubMed] [Google Scholar]
- 294.Perez-Riverol Y. et al. The PRIDE database resources in 2022: a hub for mass spectrometry-based proteomics evidences. Nucleic Acids Res. 50, D543–D552 (2022). [DOI] [PMC free article] [PubMed] [Google Scholar]
- 295.Desiere F. et al. The PeptideAtlas project. Nucleic Acids Res. 34, D655–D658 (2006). [DOI] [PMC free article] [PubMed] [Google Scholar]
- 296.Wang MX et al. Assembling the community-scale discoverable human proteome. Cell Syst. 7, 412 (2018). [DOI] [PMC free article] [PubMed] [Google Scholar]
- 297.Moriya Y. et al. The jPOST environment: an integrated proteomics data repository and database. Nucleic Acids Res. 47, D1218–D1224 (2019). [DOI] [PMC free article] [PubMed] [Google Scholar]
- 298.Ma J. et al. iProX: an integrated proteome resource. Nucleic Acids Res. 47, D1211–D1217 (2019). [DOI] [PMC free article] [PubMed] [Google Scholar]
- 299.Sharma V. et al. Panorama public: a public repository for quantitative data sets processed in skyline*. Mol. Cell. Proteom 17, 1239–1244 (2018). [DOI] [PMC free article] [PubMed] [Google Scholar]
- 300.Hollas MAR et al. The Human Proteoform Atlas: a FAIR community resource for experimentally derived proteoforms. Nucleic Acids Res. 50, D526–D533 (2022). [DOI] [PMC free article] [PubMed] [Google Scholar]
- 301.Wilkinson MD et al. The FAIR guiding principles for scientific data management and stewardship. Sci. Data 3, 160018 (2016). [DOI] [PMC free article] [PubMed] [Google Scholar]
- 302.Bourgoin-Voillard S, Leymarie N & Costello CE Top-down tandem mass spectrometry on RNase A and B using a Qh/FT-ICR hybrid mass spectrometer. Proteomics 14, 1174–1184 (2014). [DOI] [PMC free article] [PubMed] [Google Scholar]
- 303.He L. et al. Diagnosis of hemoglobinopathy and β-thalassemia by 21 T Fourier transform ion cyclotron resonance mass spectrometry and tandem mass spectrometry of hemoglobin from blood. Clin. Chem 65, 986 (2019). [DOI] [PubMed] [Google Scholar]
- 304.Melby JA et al. Functionally integrated top-down proteomics for standardized assessment of human induced pluripotent stem cell-derived engineered cardiac tissues. J. Proteome Res 20, 1424–1433 (2021). [DOI] [PMC free article] [PubMed] [Google Scholar]
- 305.Aebersold R & Mann M Mass-spectrometric exploration of proteome structure and function. Nature 537, 347 (2016). [DOI] [PubMed] [Google Scholar]
- 306.Aballo TJ et al. Ultrafast and reproducible proteomics from small amounts of heart tissue enabled by Azo and timsTOF pro. J. Proteome Res 20, 4203–4211 (2021). [DOI] [PMC free article] [PubMed] [Google Scholar]
- 307.Johnson KR, Gao Y, Greguš M & Ivanov AR On-capillary cell lysis enables top-down proteomic analysis of single mammalian cells by CE-MS/MS. Anal. Chem 94, 14358–14367 (2022). [DOI] [PMC free article] [PubMed] [Google Scholar]
- 308.Zhou M. et al. Sensitive top-down proteomics analysis of a low number of mammalian cells using a nanodroplet sample processing platform. Anal. Chem 92, 7087–7095 (2020). [DOI] [PubMed] [Google Scholar]
- 309.Schaffer LV, Tucholski T, Shortreed MR, Ge Y & Smith LM Intact-mass analysis facilitating the identification of large human heart proteoforms. Anal. Chem 91, 10937–10942 (2019). [DOI] [PMC free article] [PubMed] [Google Scholar]
- 310.Picotti P, Bodenmiller B, Mueller LN, Domon B & Aebersold R Full dynamic range proteome analysis of S. cerevisiae by targeted proteomics. Cell 138, 795 (2009). [DOI] [PMC free article] [PubMed] [Google Scholar]
- 311.Ge Y, Rybakova IN, Xu Q & Moss RL Top-down high-resolution mass spectrometry of cardiac myosin binding protein C revealed that truncation alters protein phosphorylation state. Proc. Natl Acad. Sci. USA 106, 12658–12663 (2009). [DOI] [PMC free article] [PubMed] [Google Scholar]
- 312.Sun L, Knierman MD, Zhu G & Dovichi NJ Fast top-down intact protein characterization with capillary zone electrophoresis–electrospray ionization tandem mass spectrometry. Anal. Chem 85, 5989–5995 (2013). [DOI] [PMC free article] [PubMed] [Google Scholar]
- 313.Haselberg R, de Jong GJ & Somsen GW Low-flow sheathless capillary electrophoresis-mass spectrometry for sensitive glycoform profiling of intact pharmaceutical proteins. Anal. Chem 85, 2289–2296 (2013). [DOI] [PubMed] [Google Scholar]
- 314.Zhao Y, Sun L, Champion MM, Knierman MD & Dovichi NJ Capillary zone electrophoresis–electrospray ionization–tandem mass spectrometry for top-down characterization of the Mycobacterium marinum secretome. Anal. Chem 86, 4873–4878 (2014). [DOI] [PMC free article] [PubMed] [Google Scholar]
- 315.Han XM et al. In-line separation by capillary electrophoresis prior to analysis by top-down mass spectrometry enables sensitive characterization of protein complexes. J. Proteome Res 13, 6078–6086 (2014). [DOI] [PMC free article] [PubMed] [Google Scholar]
- 316.Bush DR, Zang L, Belov AM, Ivanov AR & Karger BL High resolution CZE-MS quantitative characterization of intact biopharmaceutical proteins: proteoforms of interferon-beta1. Anal. Chem 88, 1138–1146 (2016). [DOI] [PubMed] [Google Scholar]
- 317.Durbin KR, Skinner OS, Fellers RT & Kelleher NL Analyzing internal fragmentation of electrosprayed ubiquitin ions during beam-type collisional dissociation. J. Am. Soc. Mass Spectrom 26, 782–787 (2015). [DOI] [PMC free article] [PubMed] [Google Scholar]
- 318.Ballard KD & Gaskell SJ Sequential mass spectrometry applied to the study of the formation of ‘internal’ fragment ions of protonated peptides. Int. J. Mass Spectrom. Ion Process 111, 173 (1991). [Google Scholar]
- 319.Dunham SD, Sanders JD, Holden DD & Brodbelt JS Improving the center section sequence coverage of large proteins using stepped-fragment ion protection ultraviolet photodissociation. J. Am. Soc. Mass Spectrom 33, 446–456 (2022). [DOI] [PubMed] [Google Scholar]
- 320.Po A & Eyers CE Top-down proteomics and the challenges of true proteoform characterization. J. Proteome Res 22, 3663–3675 (2023). [DOI] [PMC free article] [PubMed] [Google Scholar]
- 321.Fornelli L et al. Top-down analysis of 30–80 kDa proteins by electron transfer dissociation time-of-flight mass spectrometry. Anal. Bioanal. Chem 405, 8505–8514 (2013). [DOI] [PubMed] [Google Scholar]
- 322.Cobb JS, Easterling ML & Agar JN Structural characterization of intact proteins is enhanced by prevalent fragmentation pathways rarely observed for peptides. J. Am. Soc. Mass Spectrom 21, 949–959 (2010). [DOI] [PMC free article] [PubMed] [Google Scholar]
- 323.Lyon YA, Riggs D, Fornelli L, Compton PD & Julian RR The ups and downs of repeated cleavage and internal fragment production in top-down proteomics. J. Am. Soc. Mass Spectrom 29, 150–157 (2018). [DOI] [PMC free article] [PubMed] [Google Scholar]
- 324.Schmitt ND, Berger JM, Conway JB & Agar JN Increasing top-down mass spectrometry sequence coverage by an order of magnitude through optimized internal fragment generation and assignment. Anal. Chem 93, 6355–6362 (2021). [DOI] [PubMed] [Google Scholar]
- 325.Wei B. et al. Top-down mass spectrometry and assigning internal fragments for determining disulfide bond positions in proteins. Analyst 148, 26–37 (2023). [DOI] [PMC free article] [PubMed] [Google Scholar]
- 326.Lantz C. et al. ClipsMS: an algorithm for analyzing internal fragments resulting from top-down mass spectrometry. J. Proteome Res 20, 1928–1935 (2021). [DOI] [PMC free article] [PubMed] [Google Scholar]
- 327.Smyrnakis A. et al. Characterization of an Omnitrap–Orbitrap platform equipped with infrared multiphoton dissociation, ultraviolet photodissociation, and electron capture dissociation for the analysis of peptides and proteins. Anal. Chem 95, 12039–12046 (2023). [DOI] [PMC free article] [PubMed] [Google Scholar]
- 328.Wu Z. et al. Comprehensive characterization of the recombinant catalytic subunit of cAMP-dependent protein kinase by top-down mass spectrometry. J. Am. Soc. Mass Spectrom 30, 2561–2570 (2019). [DOI] [PMC free article] [PubMed] [Google Scholar]
- 329.Zubarev RA et al. Electron capture dissociation for structural characterization of multiply charged protein cations. Anal. Chem 72, 563–573 (2000). [DOI] [PubMed] [Google Scholar]
- 330.Gregorich ZR et al. Comprehensive assessment of chamber-specific and transmural heterogeneity in myofilament protein phosphorylation by top-down mass spectrometry. J. Mol. Cell. Cardiol 87, 102–112 (2015). [DOI] [PMC free article] [PubMed] [Google Scholar]
- 331.Jin YT et al. Comprehensive analysis of tropomyosin isoforms in skeletal muscles by top-down proteomics. J. Muscle Res. Cell Motil 37, 41–52 (2016). [DOI] [PMC free article] [PubMed] [Google Scholar]
- 332.Yu DY, Peng Y, Ayaz-Guner S, Gregorich ZR & Ge Y Comprehensive characterization of AMP-activated protein kinase catalytic domain by top-down mass spectrometry. J. Am. Soc. Mass Spectrom 27, 220–232 (2016). [DOI] [PMC free article] [PubMed] [Google Scholar]
- 333.Pan JX, Zhang SP & Borchers CH Protein species-specific characterization of conformational change induced by multisite phosphorylation. J. Proteom 134, 138–143 (2016). [DOI] [PubMed] [Google Scholar]
- 334.Zenaidee MA et al. Internal fragments generated from different top-down mass spectrometry fragmentation methods extend protein sequence coverage. J. Am. Soc. Mass Spectrom 32, 1752 (2021). [DOI] [PMC free article] [PubMed] [Google Scholar]
- 335.Nedelkov D, Niederkofler EE, Oran PE, Peterman S & Nelson RW Top-down mass spectrometric immunoassay for human insulin and its therapeutic analogs. J. Proteom 175, 27 (2018). [DOI] [PubMed] [Google Scholar]
- 336.Rogers HT et al. Comprehensive characterization of endogenous phospholamban proteoforms enabled by photocleavable surfactant and top-down proteomics. Anal. Chem 95, 13091–13100 (2023). [DOI] [PMC free article] [PubMed] [Google Scholar]
- 337.Vimer S. et al. Comparative structural analysis of 20s proteasome ortholog protein complexes by native mass spectrometry. ACS Cent. Sci 6, 573–588 (2020). [DOI] [PMC free article] [PubMed] [Google Scholar]
- 338.Rosenberger FA et al. Spatial single-cell mass spectrometry defines zonation of the hepatocyte proteome. Nat. Methods 20, 1530–1536 (2023). [DOI] [PMC free article] [PubMed] [Google Scholar]
- 339.Brunner A-D et al. Ultra-high sensitivity mass spectrometry quantifies single-cell proteome changes upon perturbation. Mol. Syst. Biol 18, e10798 (2022). [DOI] [PMC free article] [PubMed] [Google Scholar]
- 340.Niu L. et al. Noninvasive proteomic biomarkers for alcohol-related liver disease. Nat. Med 28, 1277–1287 (2022). [DOI] [PMC free article] [PubMed] [Google Scholar]
- 341.Desligniere E, Rolland A, Ebberink E, Yin V & Heck AJR Orbitrap-based mass and charge analysis of single molecules. Acc. Chem. Res 56, 1458–1468 (2023). [DOI] [PMC free article] [PubMed] [Google Scholar]
- 342.Jarrold MF Applications of charge detection mass spectrometry in molecular biology and biotechnology. Chem. Rev 122, 7415–7441 (2022). [DOI] [PMC free article] [PubMed] [Google Scholar]
- 343.Alfaro JA et al. The emerging landscape of single-molecule protein sequencing technologies. Nat. Methods 18, 604–617 (2021). [DOI] [PMC free article] [PubMed] [Google Scholar]
- 344.MacCoss MJ et al. Sampling the proteome by emerging single-molecule and mass spectrometry methods. Nat. Methods 20, 339–346 (2023). [DOI] [PMC free article] [PubMed] [Google Scholar]
- 345.Carbonara K, Andonovski M & Coorssen JR Proteomes 9, 38 (2021). [DOI] [PMC free article] [PubMed] [Google Scholar]
- 346.Bagdonaite I. et al. Glycoproteomics. Nat. Rev. Methods Primers 2, 48 (2022). [Google Scholar]
- 347.Lu L, Riley NM, Shortreed MR, Bertozzi CR & Smith LM O-pair search with MetaMorpheus for O-glycopeptide characterization. Nat. Methods 17, 1133–1138 (2020). [DOI] [PMC free article] [PubMed] [Google Scholar]
- 348.Onjiko RM, Moody SA & Nemes P Single-cell mass spectrometry reveals small molecules that affect cell fates in the 16-cell embryo. Proc. Natl Acad. Sci. USA 112, 6545–6550 (2015). [DOI] [PMC free article] [PubMed] [Google Scholar]
- 349.Petelski AA et al. Multiplexed single-cell proteomics using SCoPE2. Nat. Protoc 16, 5398–5425 (2021). [DOI] [PMC free article] [PubMed] [Google Scholar]
- 350.Woo J. et al. High-throughput and high-efficiency sample preparation for single-cell proteomics using a nested nanowell chip. Nat. Commun 12, 6246 (2021). [DOI] [PMC free article] [PubMed] [Google Scholar]
- 351.Hickey JW et al. Spatial mapping of protein composition and tissue organization:a primer for multiplexed antibody-based imaging. Nat. Methods 19, 284–295 (2022). [DOI] [PMC free article] [PubMed] [Google Scholar]
- 352.Mund A. et al. Deep visual proteomics defines single-cell identity and heterogeneity. Nat. Biotechnol 40, 1231–1240 (2022). [DOI] [PMC free article] [PubMed] [Google Scholar]
- 353.Yang M. et al. Proteoform-selective imaging of tissues using mass spectrometry. Angew. Chem. Int. Ed 61, e202200721 (2022). [DOI] [PMC free article] [PubMed] [Google Scholar]
- 354.Su P. et al. Highly multiplexed, label-free proteoform imaging of tissues by individual ion mass spectrometry. Sci. Adv 8, eabp9929 (2022). [DOI] [PMC free article] [PubMed] [Google Scholar]
- 355.Liao YC et al. Spatially resolved top-down proteomics of tissue sections based on a microfluidic nanodroplet sample preparation platform. Mol. Cell. Proteom 22, 100491 (2023). [DOI] [PMC free article] [PubMed] [Google Scholar]
- 356.Restrepo-Perez L, Joo C & Dekker C Paving the way to single-molecule protein sequencing. Nat. Nanotechnol 13, 786–796 (2018). [DOI] [PubMed] [Google Scholar]
- 357.Martin-Baniandres P. et al. Enzyme-less nanopore detection of post-translational modifications within long polypeptides. Nat. Nanotechnol 18, 1–6 (2023). [DOI] [PMC free article] [PubMed] [Google Scholar]
- 358.Fulcher JM et al. Parallel measurement of transcriptomes and proteomes from same single cells using nanodroplet splitting. Preprint at bioRxiv 10.1101/2022.05.17.492137 (2022). [DOI] [Google Scholar]