

Abstract
INTRODUCTION
Altered immune signatures are emerging as a central theme in neurodegenerative disease, yet little is known about immune responses in early‐onset Alzheimer's disease (EOAD).
METHODS
We examined single‐cell RNA‐sequencing (scRNA‐seq) data from peripheral blood mononuclear cells (PBMCs) and droplet digital polymerase chain reaction (ddPCR) data from CD4 T cells from participants with EOAD and clinically normal controls.
RESULTS
We analyzed PBMCs from 16 individuals by scRNA‐seq and discovered increased interferon signaling‐associated gene (ISAG) expression and striking expansion of antiviral‐like ISAGhi T cells in EOAD. Isolating CD4 T cells from 19 individuals, including four cases analyzed by scRNA‐seq, we confirmed increased expression of ISAGhi marker genes. Publicly available cerebrospinal fluid leukocyte scRNA‐seq data from late‐onset mild cognitive impairment and AD also revealed increased expression of interferon‐response genes.
DISCUSSION
Antiviral‐like ISAGhi T cells are expanded in EOAD. Additional research into these cells and the role of heightened peripheral IFN signaling in neurodegeneration is warranted.
Highlights
Interferon‐responsive T cells expanded in early‐onset Alzheimer's disease (AD).
Increased interferon‐associated gene expression present in early‐ and late‐onset AD.
Peripheral immune changes in T and NK cells driven by females with early‐onset AD.
Keywords: Alzheimer's disease, CD4 T cells, cerebrospinal fluid, droplet digital PCR, early‐onset Alzheimer's disease, interferon, interferon signaling‐associated gene, peripheral blood mononuclear cells, single‐cell RNA‐sequencing, T cells, tauopathy
1. BACKGROUND
Approximately 5%–10% of the ∼7 million Americans living with Alzheimer's disease (AD) 1 experience symptom onset prior to age 65. 2 In this early‐onset form of AD (EOAD), affected individuals are more likely to experience an aggressive clinical course, have an atypical clinical syndrome, encounter delays in diagnosis, and experience unique social disruptions due to their relatively young age. 2 The vast majority (≥90%) of EOAD cases are not inherited in an autosomal‐dominant manner, and for these individuals, we understand relatively little about the genetic and other biological factors underpinning disease risk.
Recent reports using single‐cell RNA‐sequencing (scRNA‐seq) have highlighted changes in peripheral blood and cerebrospinal fluid (CSF) leukocyte populations in AD, 3 Lewy body dementia, 4 familial tauopathy, 5 and during aging. 6 To our knowledge, however, a global, unbiased scRNA‐seq analysis of peripheral blood mononuclear cells (PBMCs) in EOAD has not been reported. Using scRNA‐seq, we now find evidence for marked expansion of a small population of recently characterized CD4 T cells expressing very high levels of interferon (IFN) signaling‐associated genes (ISAGhi T cells) in EOAD. Remarkably, a CD4 T‐cell subtype that appears to be highly similar to ISAGhi T cells–with a similar antiviral gene expression signature–is potently expanded in the CSF in the context of viral encephalitis, 7 suggesting that EOAD‐expanded ISAGhi T cells have antiviral properties. Adding to the weight of evidence for augmented peripheral IFN signaling in EOAD, we also observe an expansion of a rare natural killer (NK) cell population previously associated with heightened IFN signaling. 8
Beyond changes in cell‐type abundance, we report global upregulation of IFN‐signaling genes across additional lymphoid and myeloid PBMC types in EOAD. In addition, by analyzing a publicly available scRNA‐seq dataset of CSF leukocytes derived primarily from individuals with mild cognitive impairment (MCI) and late‐onset AD (LOAD), 3 we find striking upregulation of the same IFN‐signaling pathways in CD4 T cells in late‐onset disease. These findings suggest at least partially conserved IFN responses between EOAD and LOAD. Collectively, our findings indicate that dysregulation of IFN‐related genes extends from the peripheral blood and CSF to the brain in AD and suggest a novel role for a population of unusual, antiviral‐like T cells in EOAD.
2. METHODS
2.1. Overview
After obtaining informed consent, PBMCs from study participants (Table 1) at the University of California, San Francisco Memory and Aging Center (MAC) were analyzed by scRNA‐seq essentially as described. 5 Raw sequencing reads were aligned to GRCh38‐2020‐A and feature‐barcode matrices were generated using Cell Ranger (v7.1.0) with intronic reads excluded. Cluster proportions were determined for individual samples by dividing the number of cells in a given cluster by the total number of cells in clusters representing all PBMCs, all T cells, or all CD4 T cells (after quality control) for each individual. Statistical differences in cell‐type abundances by diagnosis were assessed via linear modeling, controlling for age and sex. Additional details, including bioinformatic and experimental methods, are described in the Supplementary Methods document and Supplementary Tables [Link], [Link], [Link].
TABLE 1.
Demographic and experimental information for samples used in scRNA‐seq and ddPCR studies
| scRNA‐seq | ddPCR | |||
|---|---|---|---|---|
| Discovery study | Validation study | |||
| Parameter | Controls | Cases | Controls | Cases |
| n | 8 | 8 | 10 | 9 |
| n per batch (Batch A, Batch B) | 4, 4 | 4, 4 | 5, 5 | 4, 5 |
| PBMCs analyzed, n | 91,955 | 90,398 | N/A | N/A |
| CD4 T‐cell RIN, mean (SD) | N/A | N/A | 9.5 (0.5) | 9.5 (0.3) |
| Sex, n female (%) | 4 (50) | 4 (50) | 7 (70) | 6 (67) |
| Age, mean (SD) | 44.6 (7.4) | 59.9 (3.1) | 56.9 (5.0) | 58.6 (2.7) |
| Race, n non‐Hispanic White (%) | 8 (100) | 8 (100) | 10 (100) | 9 (100) a |
| APOE ε4 status, n with 0/1/2 alleles | 5/3/0 | 2/5/1 | 8/2/0 | 3/5/1 |
| Clinical syndrome (n) | clinically normal (8) | AD (6), frontal AD (2) | clinically normal (10) | AD (9) |
| Global CDR, mean (SD) | 0.0 (0.0) | 1.1 (0.4) | 0.1 (0.2) b | 0.9 (0.2) |
Abbreviations: AD, Alzheimer's disease; APOE, apolipoprotein E; CDR, Clinical Dementia Rating scale; ddPCR, droplet digital polymerase chain reaction; PBMC, peripheral blood mononuclear cell; RIN, RNA integrity number; scRNA‐seq, single‐cell RNA‐sequencing; SD, standard deviation.
One case in the ddPCR validation study self‐identified as White with unknown Hispanic/Latino ethnicity.
All clinically normal control participants except one in the ddPCR study had a Global CDR score of 0; the remaining control had a Global CDR score of 0.5 and was considered clinically normal by neurological and neuropsychological testing.
RESEARCH IN CONTEXT
Systematic review: We reviewed the literature using PubMed and Google Scholar, identifying peer‐reviewed publications as well as selected preprints and meeting abstracts for citation. Given the relatively recent description of interferon (IFN) signaling‐associated gene (ISAG)hi T cells, we also included for citation relevant research describing their role in non‐neurodegenerative conditions.
Interpretation: Our findings indicate a role for a recently characterized cell type with an antiviral‐like gene expression signature in sporadic, early‐onset Alzheimer's disease (EOAD). Analysis of publicly available data from mild cognitive impairment and late‐onset AD suggests a related response involving heightened IFN‐related gene expression in late‐onset disease.
Future directions: Our work suggests a role for peripheral, antiviral‐like ISAGhi T cells in EOAD and a conserved role for heightened IFN‐signaling across AD. Recent work suggesting that ISAGhi T cells have pathogenic properties motivates future studies examining the function of this rare cell type in neurodegenerative disease.
2.2. Clinical assessment
Study participants underwent a multistep screening prior to an in‐person clinical assessment at the MAC that included a neurologic exam, detailed cognitive assessment, medical history, and family history for neurodegenerative disease. 9 Study partners were interviewed about the participant's functional abilities. A multidisciplinary team consisting of a neurologist, a neuropsychologist, and a nurse reviewed all participant clinical information and established diagnoses for cases according to consensus criteria for AD 10 , 11 , 12 or frontal AD. 13 All EOAD cases were diagnosed with probable AD and had at least one positive biomarker consistent with AD. In particular, 10/13 cases had evidence of amyloid and tau positivity (obtained via positron emission tomography [PET] imaging and/or assessment of CSF amyloid‐β42 and phospho‐tau181 levels) in addition to neurodegeneration (via structural magnetic resonance imaging [MRI]; A+/T+/[N]+), while 3/13 cases had evidence of neurodegeneration ([N]+) but did not have PET or CSF data available (Supplementary Table S4). The mean (SD) age of first abnormal diagnosis for all participants with EOAD was 58.5 (3.0) and the range was 54‐62. All control participants had a normal neurologic exam, and all controls except one in the ddPCR study had a global Clinical Dementia Rating (CDR) 14 scale score of 0; the remaining control participant, who was diagnosed as clinically normal, had a CDR score of 0.5 due to subjective memory complaint. This participant also reported depressive symptoms. Sensitivity analysis of the ddPCR data after exclusion of this individual indicated that the results remained similar or unchanged. All participants screened negative for disease‐causing pathogenic variants in established genes for AD and frontotemporal lobar degeneration, which also causes early‐onset dementia.
3. RESULTS
3.1. Identification of an expanded T‐cell subtype in EOAD
After QC filtering, clustering of ∼182,000 PBMCs generated 17 primary clusters consisting of all expected PBMC types (see Supplementary Methods). Comparison of relative cluster abundance in EOAD cases versus controls revealed a single cluster (cluster 15) that was robustly expanded in EOAD (P = 0.005; after false discovery rate [FDR] correction, PFDR = 0.079; Figure 1A and B). Expression of marker genes indicates that cluster 15 is a subtype of CD4 T‐cell (Supplementary Figure S1A). Quantification of cluster 15 abundance relative to either all PBMCs, all T cells, or all CD4 T cells revealed significant expansion in EOAD that was driven primarily by females (Figure 1B and C). To determine what type of CD4 T‐cell cluster 15 represents, we subsetted all T cells and reclustered them separately from all other cell types. Reclustering revealed this cell type in sub‐cluster 11, which expresses uniquely high levels of IFN‐signaling genes MX1 and IFI6 relative to all other T cells (Figure 1D). As expected, sub‐cluster 11 was also significantly expanded in EOAD relative to controls (Figure 1D).
FIGURE 1.
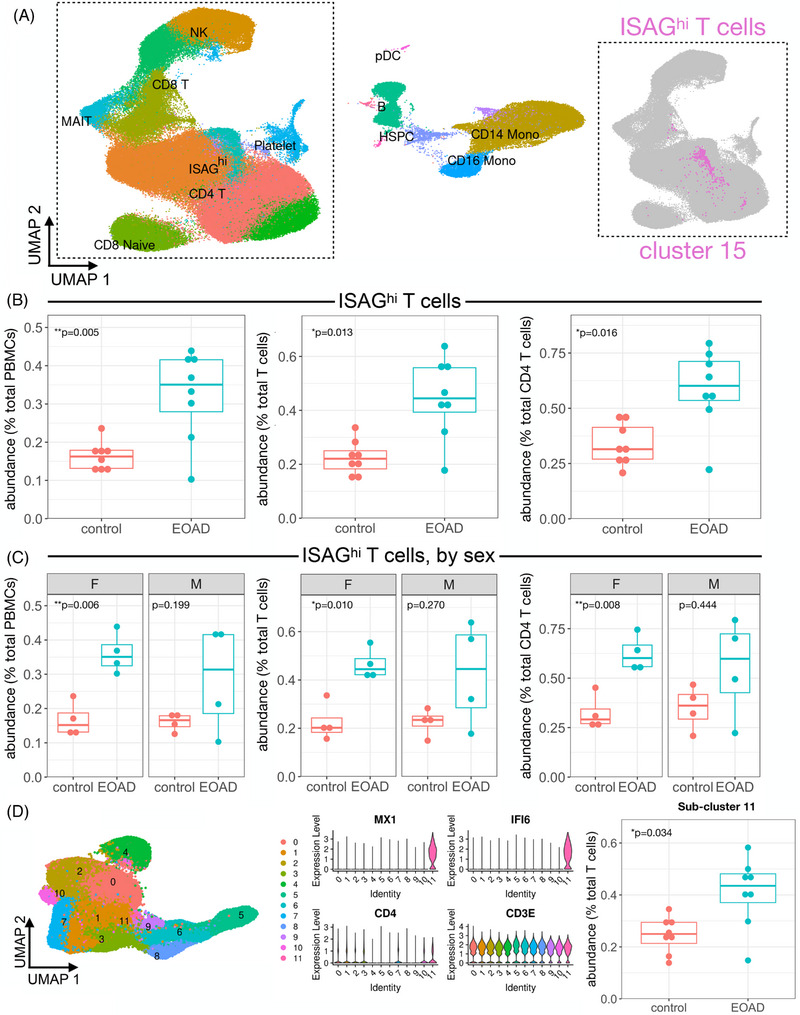
Expansion of ISAGhi T cells in EOAD characterized by scRNA‐seq. (A) Uniform manifold approximation and projection (UMAP) plot of ∼182,000 PBMCs from EOAD cases and cognitively normal controls, colored by cluster identity. Major cell types are labeled within the plot. The inset (right) shows the primary T‐cell grouping displayed in gray, with the ISAGhi T‐cell cluster shown in magenta. (B) ISAGhi T‐cell abundance is quantified relative to all PBMCs (left; P = 0.005; PFDR = 0.079), all T cells (middle, P = 0.013), and all CD4 T cells (right; P = 0.016). (C) Stratifying by sex, ISAGhi T‐cell relative abundance is significantly increased in EOAD only in females, expressed as a percentage of PBMCs (left, P = 0.006), T cells (middle, P = 0.01), and CD4 T cells (right, P = 0.008). (D) Reclustering of all T cells (left) generates a T‐cell subcluster (11) representing ISAGhi T cells, which express high levels of marker genes MX1 and IFI6, in addition to T‐cell markers CD4 and CD3E (middle). Quantification of the ISAGhi subcluster relative to all T cells again indicates a significant increase in EOAD cases (right, P = 0.034)
3.2. Characterization of the expanded cell type as ISAGhi T cells
What is the precise identity of this subset of CD4 T cells? Recent literature using scRNA‐seq to analyze human leukocyte populations has revealed two poorly understood cell types: ISAGhi T cells, detected in peripheral blood, 15 and antiviral CD4 T cells, detected in CSF. 7 Antiviral CD4 T cells were so named due to their marker gene expression and robust expansion in the CSF in the context of viral encephalitis. 7 Comparison of all marker genes for our sub‐cluster 11 to the top 200 marker genes for CSF antiviral CD4 T cells revealed highly statistically significant overlap (P = 6.5 × 10⁻¹⁴; Supplementary Table S5). 16 Moreover, all of the 12 most‐significant marker genes originally reported for ISAGhi T cells 15 are also top marker genes of our sub‐cluster 11 and of antiviral CD4 T cells. Therefore, from here on, we refer to the EOAD‐expanded CD4 T cells as ISAGhi T cells.
3.3. Analysis of ISAGhi T‐cell abundance in additional samples and datasets
ISAGhi T‐cell abundance was consistent across scRNA‐seq batches (Supplementary Figure S1B) and was not driven by APOE ε4 status (Supplementary Figure S1C). Moreover, although our control samples came from participants with a younger mean age (Table 1), there was no relationship between age and ISAGhi T‐cell abundance (Supplementary Figure S1D). To increase the sample size of our scRNA‐seq dataset, we included seven additional control PBMC samples previously characterized by scRNA‐seq. 5 We found that the expansion of ISAGhi T cells relative to PBMCs and all T cells remained significant after addition of these independent controls, despite a single outlier control sample with very high levels of ISAGhi T cells (Supplementary Figure S2). We recently reported a reduction in peripheral non‐classical monocytes in familial tauopathy. 5 Comparing the familial tauopathy and EOAD datasets, we found that non‐classical monocytes are not reduced in EOAD, and ISAGhi T cells are not expanded in familial tauopathy (Supplementary Figure S3; Supplementary Table S6), suggesting distinct peripheral immune responses in sporadic EOAD and primary familial tauopathy.
3.4. Expansion of proliferating NK cells in EOAD
Previous single‐cell analyses have revealed additional PBMC types temporally associated with heightened type I IFN signaling. In particular, a rare NK cell subpopulation that expresses markers of proliferation has been shown to significantly expand after vaccination with an experimental HIV vaccine. 8 This expansion coincides with heightened type I IFN signaling in myeloid cells, 8 which we also observe in EOAD (see below). After mapping the EOAD PBMC dataset onto a large, well‐characterized multimodal PBMC CITE‐seq dataset, 8 we identified the proliferating NK cell cluster and, remarkably, observed significant expansion of this rare subpopulation in EOAD, specifically in female cases (Supplementary Figure S4A). In addition, differential expression analysis confirmed significant enrichment for gene ontology (GO) and Reactome terms related to IFN signaling and antiviral response within the primary NK cell cluster in EOAD (Supplementary Figure S4B). These findings provide additional corroborative evidence, via a population of innate lymphoid cells, that EOAD is characterized by heightened peripheral IFN signaling. In contrast, similar analysis of the familial tauopathy dataset revealed no significant changes in proliferating NK cells (data not shown), a finding that is again consistent with divergent peripheral immune responses in EOAD and familial tauopathy.
3.5. Differential expression analysis of PBMC subsets in EOAD
Differential expression analysis revealed a high number of differentially expressed genes (DEGs) in classical and non‐classical monocytes in EOAD, relative to controls (Supplementary Figure S5A, Supplementary Table S7). Remarkably, we found that, on average, ∼19% of the significantly upregulated genes across all clusters (excluding those with fewer than 10 upregulated DEGs) were also ISAGhi T‐cell marker genes (i.e., IFN response genes; Supplementary Figure S5A). GO analysis of the genes upregulated in CD4 T‐cell clusters and myeloid cell clusters revealed significant enrichment for terms such as “IFN α/β signaling” and “response to virus” (Supplementary Figure S5B and C). In EOAD, we, therefore, observe both expansion of a CD4 T‐cell subpopulation expressing very high levels of genes associated with IFN signaling and concomitant upregulation of many of the same genes across additional lymphoid and myeloid cell types.
3.6. Validation of upregulated ISAGhi T‐cell marker genes via ddPCR
To validate our primary scRNA‐seq findings, we magnetically isolated CD4 T cells from an additional cohort of EOAD cases and control participants. A droplet digital (dd) PCR‐based validation assay indicated highly efficient isolation of CD4 T cells (Supplementary Figure S6). Reasoning that increased expression of specific ISAGhi T‐cell marker genes from isolated CD4 T cells would be consistent with an expansion of ISAGhi T cells as well as ISAG upregulation, we performed ddPCR for ISAGhi marker genes MX1 and IFI6 (Figure 2A). Cases and controls in the ddPCR cohort had similar average ages (Table 1; see also Supplementary Methods document), excluding age as an explanatory factor. Strikingly, ddPCR confirmed increased MX1 and IFI6 expression in CD4 T cells from EOAD cases (Figure 2B). Increased MX1 was observed across two independent ddPCR batches and was driven by females (Figure 2C).
FIGURE 2.
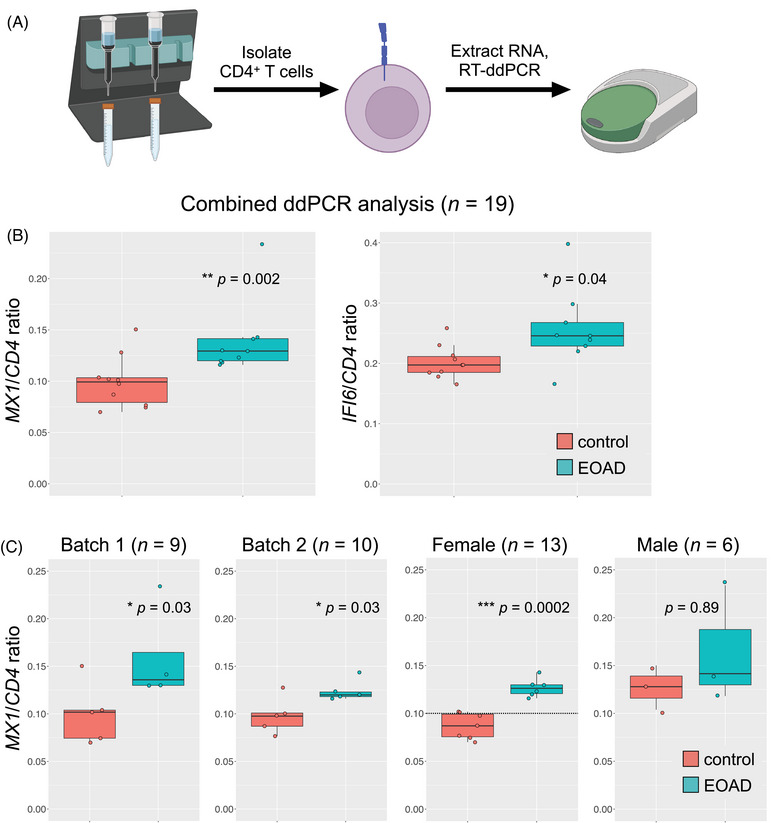
ISAGhi T‐cell marker gene expression is increased in CD4 T cells in EOAD. (A) CD4 T cells were magnetically isolated from PBMCs and RNA was extracted; gene expression was determined by RT‐ddPCR. (B) Expression of MX1 and IFI6 was significantly increased in CD4 T cells from EOAD cases relative to cognitively normal controls (P = 0.002 and P = 0.04, respectively). (C) MX1 expression was significantly increased in two independent RT‐ddPCR batches (P = 0.03, both batches). The increase in MX1 expression observed in EOAD was driven by females (P = 0.0002). CD4 was used as a reference gene
3.7. Secondary analysis of CSF leukocytes in late‐onset MCI/AD
Secondary analysis of a well‐known CSF leukocyte dataset 3 revealed that ISAGhi‐like T cells, although detected, were not expanded in the CSF in late‐onset MCI/AD (Figure 3A through C). Strikingly, however, differential expression analysis revealed robust upregulation of MX1 within CSF ISAGhi‐like T cells in MCI/AD (Figure 3D). Moreover, functional enrichment analysis of the genes upregulated in MCI/AD (relative to healthy controls) across all CSF CD4 T cells revealed highly significant enrichment for terms such as “IFN α/β signaling” and “response to virus” (Figure 3E). In addition, analysis of upregulated DEGs from individual CSF clusters revealed similar enrichment for IFN‐signaling terms across multiple CD4 T‐cell clusters as well as two innate immune clusters (Figure 3F). Collectively, these results suggest that, although expansion of ISAGhi T cells may be specific to EOAD, upregulation of the same IFN‐signaling pathways in CSF CD4 T cells is conserved in late‐onset MCI/AD.
FIGURE 3.
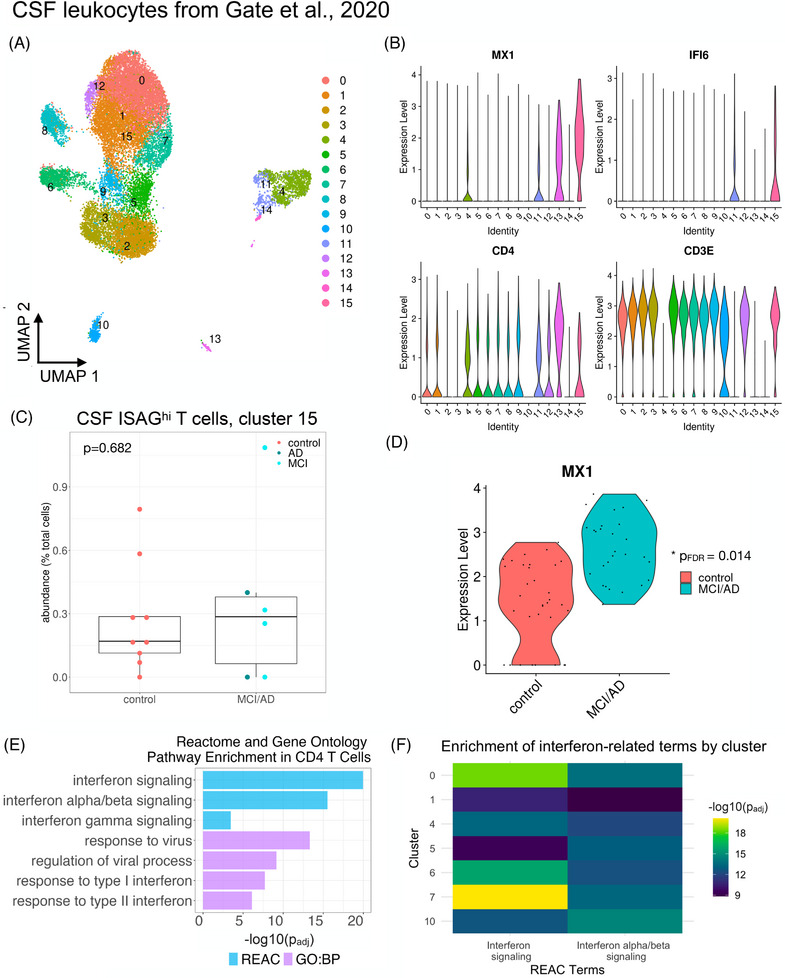
Heightened IFN response signatures in CSF T cells in MCI and AD. Publicly available data from Gate et al. 3 were downloaded from GEO (GSE134577) and analyzed as described. (A) A UMAP plot shows the distribution of CSF immune cells. (B) Violin plots show that CSF cluster 15 harbors ISAGhi‐like cells expressing high levels of MX1 and IFI6 along with CD4 and CD3E. (C) Quantification of CSF cluster 15 reveals lack of expansion in late‐onset MCI/AD (P = 0.682). (D) MX1 expression is significantly increased (PFDR = 0.014) in CSF ISAGhi‐like T cells in MCI/AD relative to healthy controls. (E) Functional enrichment analysis of the genes upregulated (PFDR < 0.05 and log2 fold‐change > 0.1) across all CSF CD4 T‐cell clusters (0, 1, 5, 6, 7, 8, 9, 12, and 15) reveals significant enrichment of IFN and antiviral response pathways in MCI/AD. GO biological process (BP) and reactome databases were used. (F) Analysis of significantly upregulated genes from individual CSF immune cell clusters revealed significant enrichment for IFN signaling in individual CSF CD4 T‐cell clusters (0, 1, 5, 6, and 7) as well as monocyte and NK cell clusters (4 and 10, respectively)
3.8. Dysregulation of IFN‐signaling genes in a mouse model of AD
To assess the relevance of heightened type I IFN signaling in the brain, we asked whether ISAGhi T‐cell marker genes are dysregulated in the hippocampus and cortex in the APPswe x PSEN1.M146V (TASTPM) mouse model 17 of familial EOAD. In the TASTPM model, we observed marked upregulation of many ISAGhi marker genes, particularly in the hippocampus (Supplementary Figure S7A and B). These results confirm the relevance of dysregulated type I IFN signaling in the brain in a model of EOAD‐like amyloidosis.
4. DISCUSSION
In this study, we found evidence for a unique peripheral immune signature in EOAD. Our findings complement and expand upon existing evidence of diverse T‐cell signatures in other forms of AD, 3 , 18 additional neurodegenerative diseases, 4 and during aging. 6 Our study is limited by the relatively small sample sizes that are characteristic of scRNA‐seq experiments. Future studies in diverse EOAD cohorts from additional recruitment sites will be needed to confirm the broad relevance of our findings to EOAD. Indeed, direct comparative analysis—rather than comparison across datasets—of larger cohorts consisting of cases with EOAD and LOAD will be needed to confidently determine the extent of concordance of IFN‐driven T‐cell responses in peripheral blood and CSF in these distinct manifestations of AD. Given that our findings appear to be driven by females, the study of larger datasets with more female participants will be particularly important in this regard.
Our findings build upon prior research that has found increasing evidence for heightened T‐cell infiltration into the brain in AD 3 , 19 and AD models. 19 , 20 In addition, recent work in AD, primary tauopathy, and related model systems have implicated dysregulated IFN‐signaling pathways in microglia 19 , 21 , 22 , 23 , 24 , 25 , 26 and brain barrier tissue, 27 indicating that IFN signaling is implicated not only in peripheral and CSF immune cells—as shown here—but also at the blood–CSF barrier and in brain‐resident myeloid cells. Intriguingly, augmented microglial interferon responses in combined APOE ε4 and/or TREM2 R47H tauopathy models have been reported specifically in female mice 23 , 28 ; these findings may be related to the female‐driven expansion of ISAGhi T cells and type I IFN‐associated, proliferating NK cells reported here in EOAD. More broadly, sex‐specific IFN responses in the context of neurodegenerative disease may be related to the observation that type I IFN responses are generally stronger in females than males. 29 Given that > 60% of Americans with AD are women, 30 there is an urgent need to elucidate the biological mechanisms—including augmented central and peripheral IFN responses—that may contribute to sex‐specific vulnerability in the context of neurodegeneration.
Collectively, our novel findings, coupled with this prior body of work, suggest the importance of heightened IFN signaling in PBMCs, CSF immune cells, brain border tissue, and brain parenchyma, which may be mediated by distinct cellular populations in each compartment. Excitingly, a recent preprint has uncovered enrichment of brain‐resident, IFN‐responsive CD8 T cells in the 5xFAD model of familial EOAD, 31 a striking convergence with our findings involving human ISAGhi T cells in EOAD. Future work should focus on identifying the functional and compartment‐specific roles of IFN‐responsive cells in neurodegenerative disease.
CONFLICT OF INTEREST STATEMENT
J.S.Y. serves on the scientific advisory board for the Epstein Family Alzheimer's Research Collaboration. G.D.R. has received consulting fees from Alector, Eli Lilly, Genentech, Roche, and Merck. He receives fees for serving on a DSMB for Johnson & Johnson. B.L.M. serves as medical advisor for the French Foundation; serves as scientific advisor for the Larry L. Hillblom Foundation, the Association for Frontotemporal Degeneration, the NIHR Cambridge Biomedical Research Centre and its subunit, the Biomedical Research Unit in Dementia, and the Buck Institute for Research on Aging; serves as external advisor for the University of Washington ADRC, Stanford University ADRC, Arizona Alzheimer's Disease Center, and Massachusetts ADRC; and serves on the external advisory committee for the University of Southern California P01 Urban Air Pollution and Alzheimer's Disease: Risk, Heterogeneity and Mechanisms. D.W.S., C.W.S., T.P.J., L.W.B., A.P.O., and E.G.G. have nothing to disclose. Author disclosures are available in the supporting information.
CONSENT STATEMENT
All participants or their surrogates provided written informed consent prior to study participation; all aspects of the studies described here were approved by the UCSF institutional review board.
Supporting information
Supporting Information
Supporting Information
Supporting Information
Supporting Information
Supporting Information
Supporting Information
Supporting Information
Supporting Information
Supporting Information
Supporting Information
Supporting Information
Supporting Information
Supporting Information
Supporting Information
Supporting Information
Supporting Information
ACKNOWLEDGMENTS
The cartoon in Figure 2 was created using BioRender.com. J.S.Y. receives funding from NIH/NIA R01AG062588, R01AG057234, P30AG062422, P01AG019724, and U19AG079774; NIH/NINDS U54NS123985; NIH/NIDA 75N95022C00031; the Rainwater Charitable Foundation; the Bluefield Project to Cure Frontotemporal Dementia; the Alzheimer's Association; the Global Brain Health Institute; the French Foundation; and the Mary Oakley Foundation. C.W.S. is supported in part by the NIH Intramural Center for Alzheimer's and Related Dementias (CARD), project NIH/NIA ZIAAG000534. G.D.R. receives research funding from Avid Radiopharmaceuticals, GE Healthcare, Life Molecular Imaging, and Genentech. The content of this publication is solely the responsibility of the authors and does not necessarily represent the official views of the National Institutes of Health.
Sirkis DW, Warly Solsberg C, Johnson TP, et al. Expansion of highly interferon‐responsive T cells in early‐onset Alzheimer's disease. Alzheimer's Dement. 2024;20:5062–5070. 10.1002/alz.13892
Daniel W. Sirkis and Caroline Warly Solsberg are equal contributors.
REFERENCES
- 1. 2023 Alzheimer's disease facts and figures. Alzheimers Dement. 2023;19:1598‐1695. [DOI] [PubMed] [Google Scholar]
- 2. Sirkis DW, Bonham LW, Johnson TP, La Joie R, Yokoyama JS. Dissecting the clinical heterogeneity of early‐onset Alzheimer's disease. Mol Psychiatry. 2022;27:2674‐2688. [DOI] [PMC free article] [PubMed] [Google Scholar]
- 3. Gate D, Saligrama N, Leventhal O, et al. Clonally expanded CD8 T cells patrol the cerebrospinal fluid in Alzheimer's disease. Nature. 2020;577:399‐404. [DOI] [PMC free article] [PubMed] [Google Scholar]
- 4. Gate D, Tapp E, Leventhal O, et al. CD4 T cells contribute to neurodegeneration in Lewy body dementia. Science. 2021;374:868‐874. [DOI] [PMC free article] [PubMed] [Google Scholar]
- 5. Sirkis DW, Warly Solsberg C, Johnson TP, et al. Single‐cell RNA‐seq reveals alterations in peripheral CX3CR1 and nonclassical monocytes in familial tauopathy. Genome Med. 2023;15:53. [DOI] [PMC free article] [PubMed] [Google Scholar]
- 6. Piehl N, van Olst L, Ramakrishnan A, et al. Cerebrospinal fluid immune dysregulation during healthy brain aging and cognitive impairment. Cell. 2022;185:5028‐5039. e13. [DOI] [PMC free article] [PubMed] [Google Scholar]
- 7. Heming M, Li X, Räuber S, et al. Neurological manifestations of COVID‐19 feature T cell exhaustion and dedifferentiated monocytes in cerebrospinal fluid. Immunity. 2021;54:164‐175. e6. [DOI] [PMC free article] [PubMed] [Google Scholar]
- 8. Hao Y, Hao S, Andersen‐Nissen E, et al. Integrated analysis of multimodal single‐cell data. Cell. 2021;184:3573‐3587. e29. [DOI] [PMC free article] [PubMed] [Google Scholar]
- 9. Miller ZA, Mandelli ML, Rankin KP, et al. Handedness and language learning disability differentially distribute in progressive aphasia variants. Brain. 2013;136:3461‐3473. [DOI] [PMC free article] [PubMed] [Google Scholar]
- 10. McKhann G, Drachman D, Folstein M, Katzman R, Price D, Stadlan EM. Clinical diagnosis of Alzheimer's disease: report of the NINCDS‐ADRDA Work Group under the auspices of Department of Health and Human Services Task Force on Alzheimer's Disease. Neurology. 1984;34:939‐944. [DOI] [PubMed] [Google Scholar]
- 11. McKhann GM, Knopman DS, Chertkow H, et al. The diagnosis of dementia due to Alzheimer's disease: recommendations from the National Institute on Aging‐Alzheimer's Association workgroups on diagnostic guidelines for Alzheimer's disease. Alzheimers Dement. 2011;7:263‐269. [DOI] [PMC free article] [PubMed] [Google Scholar]
- 12. Jack CR Jr, Bennett DA, Blennow K, et al. NIA‐AA Research Framework: toward a biological definition of Alzheimer's disease. Alzheimers Dement. 2018;14:535‐562. [DOI] [PMC free article] [PubMed] [Google Scholar]
- 13. Ossenkoppele R, Pijnenburg YAL, Perry DC, et al. The behavioural/dysexecutive variant of Alzheimer's disease: clinical, neuroimaging and pathological features. Brain. 2015;138:2732‐2749. [DOI] [PMC free article] [PubMed] [Google Scholar]
- 14. Morris JC. The clinical dementia rating (CDR): current version and scoring rules. Neurology. 1993;43:2412‐2414. [DOI] [PubMed] [Google Scholar]
- 15. Wang X, Shen X, Chen S, et al. Reinvestigation of classic T Cell subsets and identification of novel cell subpopulations by single‐cell RNA sequencing. J Immunol. 2022;208:396‐406. [DOI] [PubMed] [Google Scholar]
- 16. Amand J, Fehlmann T, Backes C, Keller A. DynaVenn: web‐based computation of the most significant overlap between ordered sets. BMC Bioinformatics. 2019;20:743. [DOI] [PMC free article] [PubMed] [Google Scholar]
- 17. Matarin M, Salih DA, Yasvoina M, et al. A genome‐wide gene‐expression analysis and database in transgenic mice during development of amyloid or tau pathology. Cell Rep. 2015;10:633‐644. [DOI] [PubMed] [Google Scholar]
- 18. Chen Y, Colonna M. Spontaneous and induced adaptive immune responses in Alzheimer's disease: new insights into old observations. Curr Opin Immunol. 2022;77:102233. [DOI] [PubMed] [Google Scholar]
- 19. Chen X, Firulyova M, Manis M, et al. Microglia‐mediated T cell infiltration drives neurodegeneration in tauopathy. Nature. 2023;615:668‐677. [DOI] [PMC free article] [PubMed] [Google Scholar]
- 20. Lee S‐H, Rezzonico MG, Friedman BA, et al. TREM2‐independent oligodendrocyte, astrocyte, and T cell responses to tau and amyloid pathology in mouse models of Alzheimer disease. Cell Rep. 2021;37:110158. [DOI] [PubMed] [Google Scholar]
- 21. Roy ER, Wang B, Wan Y‐W, et al. Type I interferon response drives neuroinflammation and synapse loss in Alzheimer disease. J Clin Invest. 2020;130:1912‐1930. [DOI] [PMC free article] [PubMed] [Google Scholar]
- 22. Rexach JE, Polioudakis D, Yin A, et al. Tau pathology drives dementia risk‐associated gene networks toward chronic inflammatory states and immunosuppression. Cell Rep. 2020;33:108398. [DOI] [PMC free article] [PubMed] [Google Scholar]
- 23. Sayed FA, Kodama L, Fan L, et al. AD‐linked R47H‐ mutation induces disease‐enhancing microglial states via AKT hyperactivation. Sci Transl Med. 2021;13:eabe3947. [DOI] [PMC free article] [PubMed] [Google Scholar]
- 24. Wang C, Fan L, Khawaja RR, et al. Microglial NF‐κB drives tau spreading and toxicity in a mouse model of tauopathy. Nat Commun. 2022;13:1969. [DOI] [PMC free article] [PubMed] [Google Scholar]
- 25. Udeochu JC, Amin S, Huang Y, et al. Tau activation of microglial cGAS‐IFN reduces MEF2C‐mediated cognitive resilience. Nat Neurosci. 2023;26:737‐750. [DOI] [PMC free article] [PubMed] [Google Scholar]
- 26. Prater KE, Green KJ, Mamde S, et al. Human microglia show unique transcriptional changes in Alzheimer's disease. Nat Aging. 2023;3:894‐907. [DOI] [PMC free article] [PubMed] [Google Scholar]
- 27. Mesquita SD, Ferreira AC, Gao F, et al. The choroid plexus transcriptome reveals changes in type I and II interferon responses in a mouse model of Alzheimer's disease. Brain Behav Immun. 2015;49:280‐292. [DOI] [PubMed] [Google Scholar]
- 28. Carling GK, Fan L, Foxe NR, et al. Alzheimer's disease‐linked risk alleles elevate microglial cGAS‐associated senescence and neurodegeneration in a tauopathy model. BioRxiv. 2024. doi: 10.1101/2024.01.24.577107 [DOI] [Google Scholar]
- 29. Pujantell M, Altfeld M. Consequences of sex differences in Type I IFN responses for the regulation of antiviral immunity. Front Immunol. 2022;13:986840. [DOI] [PMC free article] [PubMed] [Google Scholar]
- 30. Rajan KB, Weuve J, Barnes LL, McAninch EA, Wilson RS, Evans DA. Population estimate of people with clinical Alzheimer's disease and mild cognitive impairment in the United States (2020‐2060). Alzheimers Dement. 2021;17:1966‐1975. [DOI] [PMC free article] [PubMed] [Google Scholar]
- 31. Fernando N, Gopalakrishnan J, Behensky A, et al. Single‐cell multiomic analysis reveals the involvement of Type I interferon‐responsive CD8+ T cells in amyloid beta‐associated memory loss. BioRxiv. 2023. doi: 10.1101/2023.03.18.533293 [DOI] [Google Scholar]
Associated Data
This section collects any data citations, data availability statements, or supplementary materials included in this article.
Supplementary Materials
Supporting Information
Supporting Information
Supporting Information
Supporting Information
Supporting Information
Supporting Information
Supporting Information
Supporting Information
Supporting Information
Supporting Information
Supporting Information
Supporting Information
Supporting Information
Supporting Information
Supporting Information
Supporting Information