

Abstract
CTLA4, a negative regulator typically expressed on the surface of T lymphocytes, is targeted by immunotherapy in patients with an ever-expanding spectrum of cancers. Characterizing the expression of CTLA4 in the pituitary gland could provide additional rationale for using immune checkpoint inhibitors in pituitary adenoma patients who do not respond to conventional treatments. We assessed the expression of CTLA4 mRNA and protein in a panel of 157 human pituitary glands, 45 collected at autopsy and 112 at surgery. These specimens included 50 normal glands and 107 adenomas: 41 non-secreting, 25 PRL-, 24 ACTH-, 11 GH-, 2 TSH-, 1 FSH-secreting, and 3 atypical. Specimens were stained for CTLA4 and adenohypophyseal hormones using RNAscope in situ hybridization, immunohistochemistry, and RNAscope Multiplex Fluorescent Assay. CTLA4 mRNA was detectable in most normal pituitary glands (48 of 50, 96%) but varied in expression, with a histological score (H-score) ranging from 0.6 to 20. The variation did not depend upon the patient’s gender and age and was not significantly by the archival storage time. CTLA4 expression was higher (p= 0.022) in pituitary adenomas than normal glands, with the greatest levels seen in PRL- and GH-secreting adenomas (p= 0.009 and 0.023 versus normal, respectively). Eight of 25 (32%) prolactinomas and 3 of 11 (27%) GH-adenomas had an H-score greater than 20, while no differences were seen for the other types. These novel data highlight the expression of an immune checkpoint such as CTLA4 on pituitary endocrine cells, a finding that could be exploited for therapeutical applications.
INTRODUCTION
Pituitary adenomas, sometimes referred to in the pathological arenas as Pituitary NeuroEndocrine Tumors (PitNETs) (Asa, et al. 2022), comprise approximately 15% of all primary brain tumors, ranking third in the list of most common of intracranial tumors after non-malignant meningioma (36%) and glioblastoma (15%) (Ostrom, et al. 2014). Many adenomas are “functional” because release the hormone normally produced by the corresponding endocrine cell type but in pathological quantities that cause a clinical syndrome, as it is seen for Cushing disease arising from the hypersecretion of adrenocorticotropic hormone (ACTH) or acromegaly from the hypersecretion of growth hormone (GH) (Asa, et al. 2022). Other adenomas do not produce increased hormone levels, so called “non-functional”, but impinge upon nearby structures such as dura mater, optic chiasm, oculomotor nerves, internal carotid artery, and non-tumorous pituitary endocrine cells, causing symptoms from mass effect like headache, decreased vision, diplopia, and hypopituitarism (Clayton, et al. 2011; Dekkers, et al. 2008).
Most pituitary tumors are benign, slow-growing (Dekkers, et al. 2008), and treated with a combination of drugs, surgery, and/or radiation therapy. Occasionally, they exhibit an aggressive behavior and recur even after multiple courses of therapy (Heaney 2014). Pathologically, they feature a strong expression of p53 and Ki67, and genetically harbor mutations in the TP53 and ATRX genes (Burman, et al. 2023). For these tumors, conventional treatment typically fails and does not ensure a protracted control of the disease. Transsphenoidal surgery, for example, is associated with a recurrence rate comprised between 7% and 12% at 10 years (Chen, et al. 2012). Radiotherapy often leads to hypopituitarism or it is not an option in some patients due to the proximity of the tumor mass to the optic nerves (Sheehan, et al. 2011). Pharmacological therapy can have in the long-term side effects that outweigh the benefits (Colao, et al. 2012; Frohman and Bonert 2007; Vroonen, et al. 2012). Overall, limited treatment options are available for aggressive and recurring pituitary tumors. Recent years have, thus, seen a growing interest in testing new drugs, such as the monoclonal antibodies that block immune checkpoints classically expressed on T lymphocytes like Cytotoxic T Lymphocyte-associated protein 4 (CTLA4) and Programmed cell Death protein 1 (PD1). These antibodies, first approved by the FDA in March 2011 for the treatment of advanced melanoma, are now used in an ever-expanding spectrum of cancer types and have become first-line treatment for metastatic melanoma, non-small-cell lung cancer, and renal cell carcinoma (Hellmann, et al. 2019; Hodi, et al. 2010; Motzer, et al. 2018). More recently, they have also been shown to improve event-free survival and pathological responses when used before surgery in patients with early-stage, non-small-cell lung cancer (Wakelee, et al. 2023).
In 2014 we reported that CTLA4, a molecule then known to be expressed only on effector T cells after they become activated and on regulatory T cells constitutively, was also expressed on pituitary endocrine cells (Iwama, et al. 2014). The expression, demonstrated at the mRNA and protein levels in both human and murine pituitary glands, was mainly found in a subset of prolactin (PRL)-secreting cells. Pituitary CTLA4 expression was then confirmed in 2016 in the first autopsy case of a lung cancer patient who had died after administration of a CTLA4 blocking antibody (Caturegli, et al. 2016). These findings paved the way for testing the use of CTLA4 and PD1 blockade as a treatment of aggressive pituitary tumors, with the first patient published in 2018 (Lin, et al. 2018). It was a 35-year-old woman with an aggressive ACTH-secreting adenoma that had initially responded to temozolomide and capecitabine but then metastasized to the liver. Administration of ipilimumab (a CTLA4 blocking monoclonal) and nivolumab (a PD1 blocking monoclonal) reduced the size of the liver metastasis by 92% and that of the intracranial lesion by 59%, with marked reduction of circulating ACTH levels. In 2020, blockade of the PD1/PD-L1 pathway was shown to be efficacious in a mouse model of Cushing disease (Kemeny, et al. 2020). These results have prompted the initiation of clinical trials to evaluate the efficacy of the combination of Ipilimumab (Yervoy, Bristol-Myers Squibb) and Nivolumab (Opdivo, Ono Pharmaceutical Co., Ltd.) in the treatment of aggressive PitNETs (NCT04042753, NCT02834013, Clinicaltrials.gov).
Although pituitary expression of CTLA4 has been published in individual case reports or small case series, it remains overall poorly characterized. Goal of this study was to determine CTLA4 expression in a large cohort of normal pituitaries and pituitary adenomas.
MATERIAL AND METHODS
Studies on human pituitary glands.
Sample collection and preparation.
A total of 157 deidentified, human pituitary specimens, 71 females and 86 males, were collected between July 2015 and June 2021 from either the surgical pathology archive of the Johns Hopkins Hospital (No. = 112) or the rapid autopsy program (No. = 45). Archival, formalin-fixed, paraffin-embedded (FFPE) blocks were selected by querying the surgical pathology database for the word “pituitary”, then excluding consult and non-relevant cases. Of the total 688 sellar surgeries performed in this 6-year interval, pathological examination showed adenoma in 330 of them (48%). Based on block availability, we were able to obtain from the archive 112 specimens, composed of 25 prolactin (PRL)-secreting, 24 adrenocorticotropic hormone (ACTH)-secreting, 11 growth hormone (GH)-secreting, 2 thyroid-stimulating hormone (TSH)-secreting, 1 follicle-stimulating hormone (FSH)-secreting, 3 atypical, 41 non-secreting (null cell) tumors, and 5 normal pituitaries. Autopsy whole pituitary glands were collected within 24 hours of death from the rapid autopsy donor program, run by the Department of Pathology. Glands were fixed in 10% neutral buffered formalin and then embedded in paraffin. Paraffin blocks were then cut at 5 μm thickness, and sections mounted onto SuperFrost Plus slides (Fisher Scientific, Waltham, MA, United States). All pituitary specimens were de-identified and analyzed blindly under IRB protocol number 04–07-12–05e.
RNAscope in situ hybridization (ISH).
CTLA4 transcript levels were detected using RNAscope 2.5 HD red detection kit (Advanced Cell Diagnostics, Hayward, CA, United States) according to the manufacturer’s protocol. Briefly, 5 μm FFPE pituitary sections were baked at 60 °C for 1 hour, deparaffinized, and boiled for target retrieval at 95–100 °C for 15 minutes. Sections were then incubated at 40 °C for 15 minutes with Protease plus (Advanced Cell Diagnostics, Hayward, CA), and hybridized at 40 °C for 2 hours with a CTLA4 probe in the HybEZ Hybridization System (both from Advanced Cell Diagnostics). Following a series of washes, binding of the CTLA4 probe to the pituitary sections was detected using a chromogenic substrate, which produced a precipitate visible as red dots when sections were observed by bright-field microscopy at 20X magnification. Nuclei were counterstained with Gill’s hematoxylin using standard procedures. The positive control was a proprietary probe for Hs-PPIB (Hs-peptidylprolyl isomerase B), while the negative control probe was obtained from pB of Bacillus subtilis (Advanced Cell Diagnostics) (Supplementary Figure 1). Microscope images were then analyzed using HALO (IndicaLabs, United States), a software that examines the number of dots expressed by each cell, classifies cells into five bins (from 0 to 4) according to the expression level, calculates the percentage of cells within each bin, and then generates a quantitative parameter named H-score (or Histo-score) using the following equation:
In the subset of 50 normal pituitary glands, the CTLA4 H-score followed a normal distribution when transformed to its square root, with a mean of 6.8, a lower limit (mean – 2 SD) of 0.6, and an upper limit (mean + 2 SD) of 20. We considered H-score values greater than 20 indicative of CTLA4 overexpression, while values smaller than 0.6 indicative of no expression.
Immunohistochemistry (IHC).
Slides prepared from FFPE blocks were deparaffinized in xylene, rehydrated using graded ethanol washes, and then boiled for 15 min in a commercial, antigen retrieval, citrate-buffer (H-3300, Vector Laboratories; Newark, CA, United States). Slides were then incubated at room temperature for 1 hour in a humidity chamber with a mouse monoclonal antibody directed against human CTLA4 (clone 14D3; eBioscience, San Diego, CA, United States). Following washes in Tris-buffered saline (supplemented with 0.1% Tween 20), binding of the CTLA4 antibody was detected using a secondary antibody directed against mouse IgG and conjugated polymeric horseradish peroxidase (PowerVision Poly-HRP, PV6114, Leica Biosystems Vista, CA) and the appropriate ACE substrate (3-amino-9-ethylcarbazole, ImmPACT AEC, SK-4205, Vector Laboratories). Slides were then immersed briefly in hematoxylin for counterstaining, cover-slipped, and analyzed under bright-field microscopy at 20X magnification.
RNAScope Multiplex Fluorescent assay.
RNAScope hybridization was carried out according to the manufacturer’s instructions, using RNAscope Multiplex Fluorescent assay (Advanced Cell Diagnostics) for FFPE sections. FFPE sections, 5 μm thick, were baked at 60 °C for 1 hour, deparaffinized, and then boiled with target retrieval at 95–100 ºC for 15 minutes. Sections were then digested at 40 °C for 15 minutes with protease IV (Advanced Cell Diagnostics) and hybridized for 2 hours at 40 °C with a combination of probes to detect human CTLA4, PRL, and TSHβ. Probe Hs-TSHβ in channel C1, Hs-PRL in channel C2, and Hs-CTLA4 in channel C3 (all from Advanced Cell Diagnostics). Following the recommended amplification steps, sections were counterstained with DAPI and mounted with Prolong Gold mounting medium (P36930, Thermo Fisher Scientific). Control sections were run under the same conditions using probes for housekeeping genes POLR2A in channel C1, PPIB in channel C2, and UBC in channel C3 (Advanced Cell Diagnostics) (Supplementary Figure 2). Images were acquired using confocal microscope Zeiss LSM780.
IHC/ISH dual staining.
For simultaneous detection of mRNAs and proteins, RNAscope ISH and IHC staining were performed consecutively on the same slide. CTLA4 mRNA levels were detected using RNAscope 2.5 HD Red detection kit, as described above. After completing the RNAscope assay, sections were washed in Tris-buffered saline (supplemented with 0.1% Tween 20) twice for 2 min each. IHC staining for human PRL and TSH was then conducted as indicated in the protocol above. Primary antibodies against PRL (MA5–11998, Thermo Fischer Scientific, Waltham, MA, United States) and TSH (ab64378, Abcam, Boston, MA, United States) were used. Staining quantitation was performed under bright-field microscopy at 20X magnification.
Studies on rodent cell lines.
Cell cultures.
Five rodent pituitary cell lines were used: TαT1, LβT2, AtT-20 (catalog number CCL-89), GH3 (CCL-82.1), and MMQ (CRL-10609). The first two lines were a kind gift from Dr. Pamela L. Mellon; the last three lines were purchased from ATCC (Manassas, VA).
LβT2, a mouse gonadotroph cell line expressing FSHβ (Graham, et al. 1999) and LHβ (Turgeon, et al. 1996), was grown in Dulbecco’s modified Eagle medium (DMEM) (Life Technologies, Grand Island, NY, United States) containing 10% fetal bovine serum, 4.5 mg/ml glucose, 100 U/ml penicillin, and 0.1 mg/ml streptomycin (Sigma-Aldrich, St. Louis, MO, United States).
TαT1, a mouse line expressing TSHβ (Yusta, et al. 1998), was seeded on Matrigel-coated plates (Collaborative Research, Bedford, MA) to facilitate adhesion. Matrigel was diluted 30-fold with DMEM before coating the plates and allowed to dry before plating cells. Then, cells were grown in DMEM containing 10% FBS, 4.5 mg/ml glucose, 100 U/ml penicillin, and 0.1 mg/ml streptomycin (Sigma-Aldrich).
AtT-20, a mouse cell line expressing ACTH, GH3 a rat line expressing GH, and MMQ a rat cell line expressing PRL, were grown in ATCC-formulated F-12K Medium (30–2004, ATCC), supplemented with 2.5% fetal bovine serum, 15% horse serum, and 100 U/ml penicillin, and 0.1 mg/ml streptomycin (Sigma-Aldrich). All the cells were maintained at 37oC in an environment of 5% CO2.
RNA extraction, reverse transcription, and PCR amplification of CTLA4.
Cells were grown to confluence, harvested, and processed with RNeasy Mini Kit (Qiagen, Germantown, MA, United States) to extract total RNA. Total RNA (1 μg) was then reverse transcribed into complementary DNA and PCR amplified using QuantiTect Reverse Transcription Kit (Qiagen). Conditions for PCR were the following: initial denaturation at 95 °C for 3 min, followed by a set of 40 cycles each composed of 95 °C for 15 seconds, 60 °C for 60 seconds, and 72 °C for 20 seconds. Primers for mouse and rat CTLA4, anterior pituitary hormones, and the housekeeping gene glyceraldehyde 3-phosphate dehydrogenase (GAPDH) are listed in Supplementary Table 1. PCR products were visualized on a 2% polyacrylamide gel.
Statistical analysis.
Central tendency values were expressed as mean or median, while variation around them as standard deviation or interquartile range. The relationship between H-score (the main outcome) and pituitary histopathology, patient gender, patient age (in years), and archival storage time (in months) of the paraffin blocks were analyzed using a multiple linear regression model. Differences were considered significant when p values were smaller than 0.05. All analyses were performed using Stata software release 18 (Stata Corp., College Station, TX, United States).
RESULTS
CTLA4 expression varies among normal human pituitary glands.
CTLA4 mRNA was expressed in most normal human pituitary glands (48 of 50, 96%), but the expression varied significantly, ranging from a minimum H-score of 0.17 to a maximum of 18.7 (Figure 1A). The mean and median H-score were 7.6 and 6.5, respectively, with a standard deviation of 4.7 and an interquartile range of 7.5. The percentage of endocrine pituitary cells expressing CTLA4 mRNA was on average 7.2%, with a median, interquartile range, minimum, and maximum of 6.4%, 7%, 0.16%, and 18% (Figure 1B). A representative example of a low CTLA4 expressing pituitary gland is show in Figure 1C, while an example of a high CTLA4 expressing gland can be seen in Figure 1D.
Figure 1. CTLA4 is expressed by hormone-secreting cells of the normal human anterior pituitary gland.
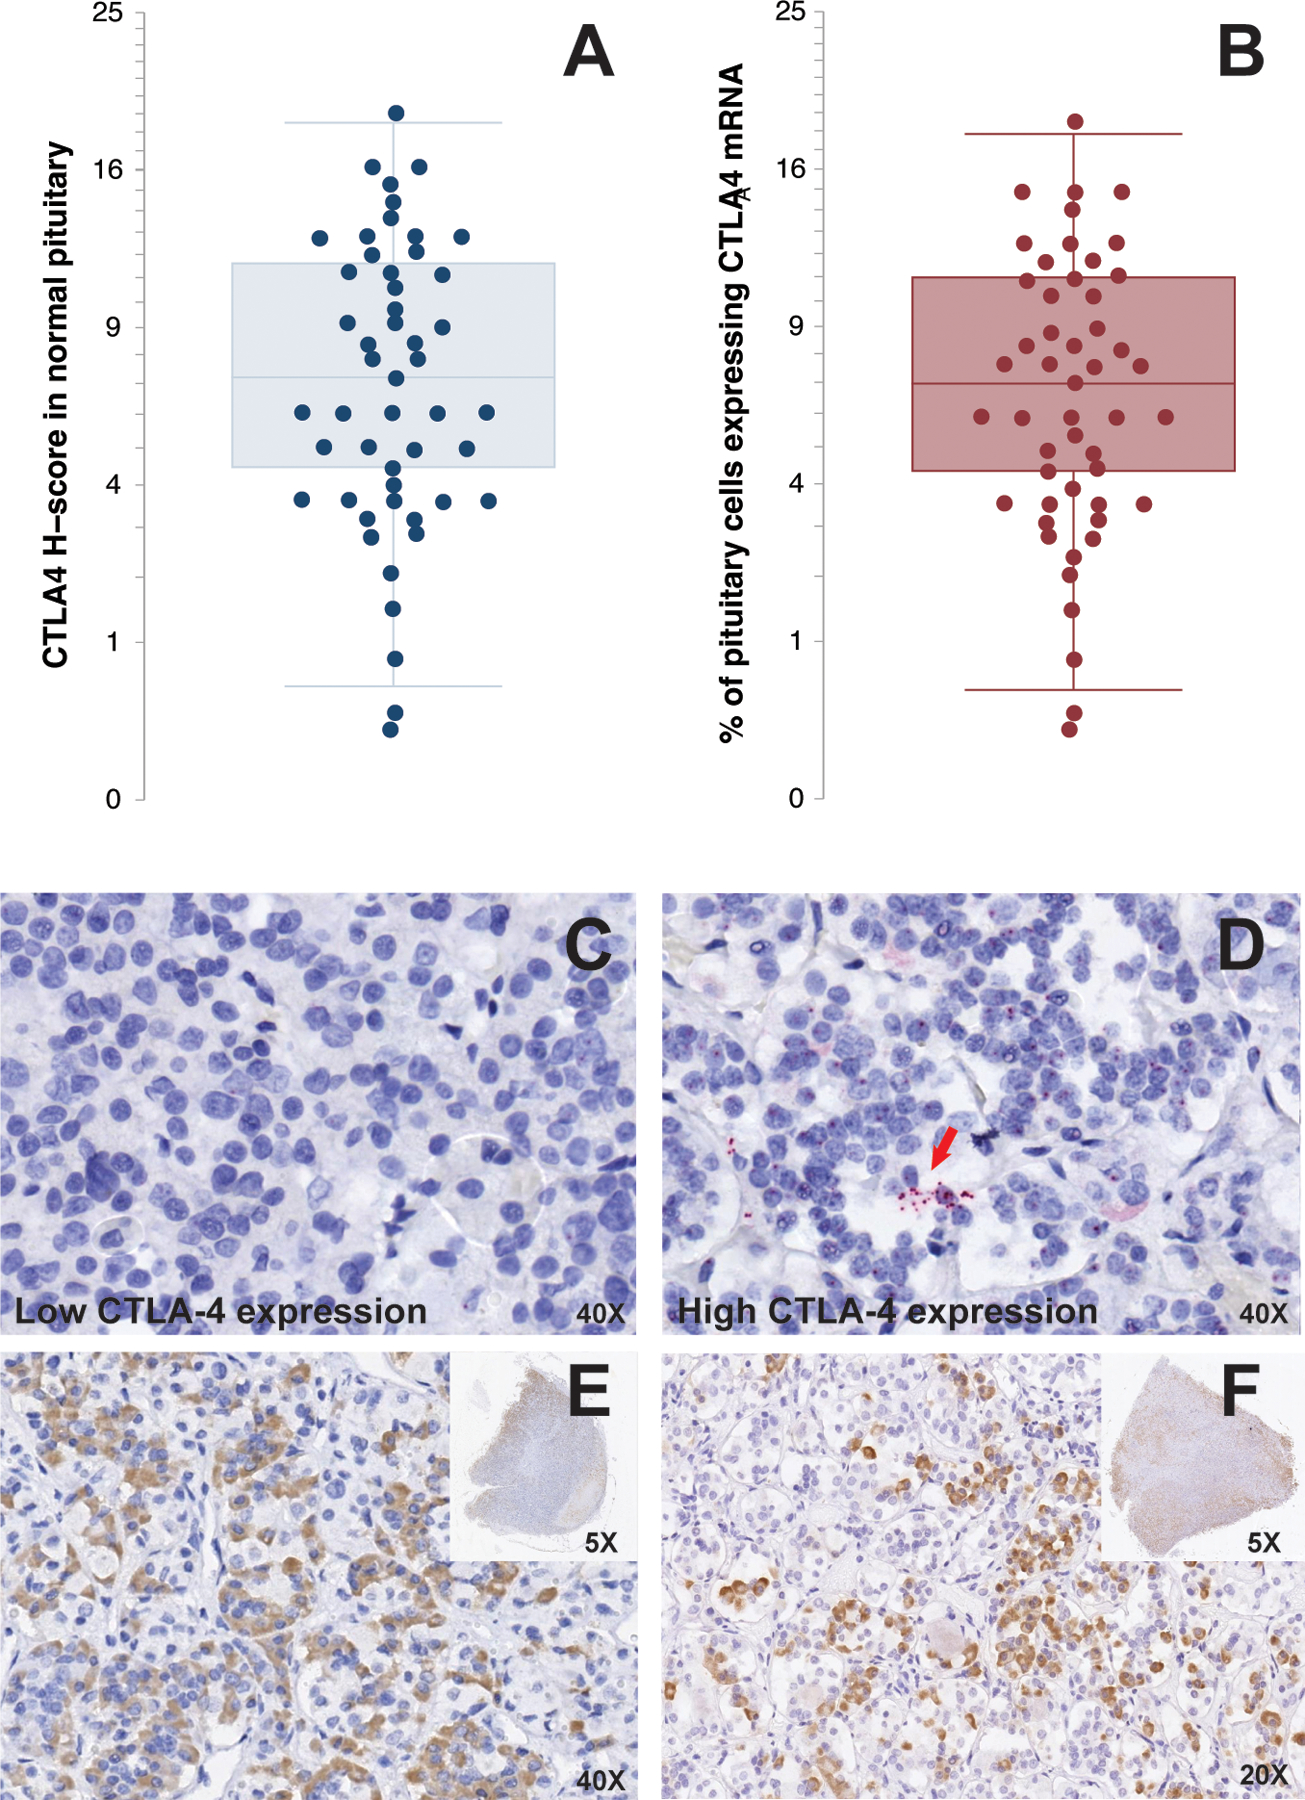
Quantification of CTLA4 mRNA expression by RNAscope in 50 normal pituitary specimens by H-score (A) and percentage of positive cells (B). Representative RNAscope staining for CTLA4 in a low expressing (C) and high expressing (D) pituitary gland. The red arrow in D indicates a cluster of CTLA4 mRNA transcripts. Each red dot represents one CTLA4 mRNA copy. Immunohistochemical staining of two normal pituitary glands for CTLA4 shows focal expression with differences in staining intensity (E and F) and involved areas (E and F, inset).
The variability in CTLA4 mRNA expression was reflected at the protein level. CTLA4 protein expression, in fact, was scattered throughout the adenohypophysis with different intensities (Figure 1E and 1F) and involvement (insets in Figures 1E and 1F).
Pituitary CTLA4 mRNA expression is not influenced by patient gender, age, or archival time of the FFPE block.
CTLA4 mRNA expression was not affected by gender: the mean (± SD) H-score 11.3 (± 11.9) in the 71 females and 10 (± 11.3) in the 86 males (p= 0.503, Figure 2A). Similarly, CTLA4 expression remained stationary over the ages: for every year increase in age, in fact, the H-score changed of −0.004, with a 95% confidence interval from −0.1 to 0.1, thus a not significant change (Figure 2B, p= 0.994). The archival time of surgical pathology blocks ranged from a minimum of 30 to a maximum of 75 months a non-statistically significant difference. CTLA4 mRNA expression remained detectable even in blocks that had been in archival storage for a long time (Figure 2C, p= 0.743). A multiple linear regression model assessing the relationships between H-score (the outcome) and gender, age, and storage time yielded similar results to those obtained from the individual simple regression models.
Figure 2. CTLA4 expression in normal pituitary is not influenced by patient gender, age, and archival storage time.
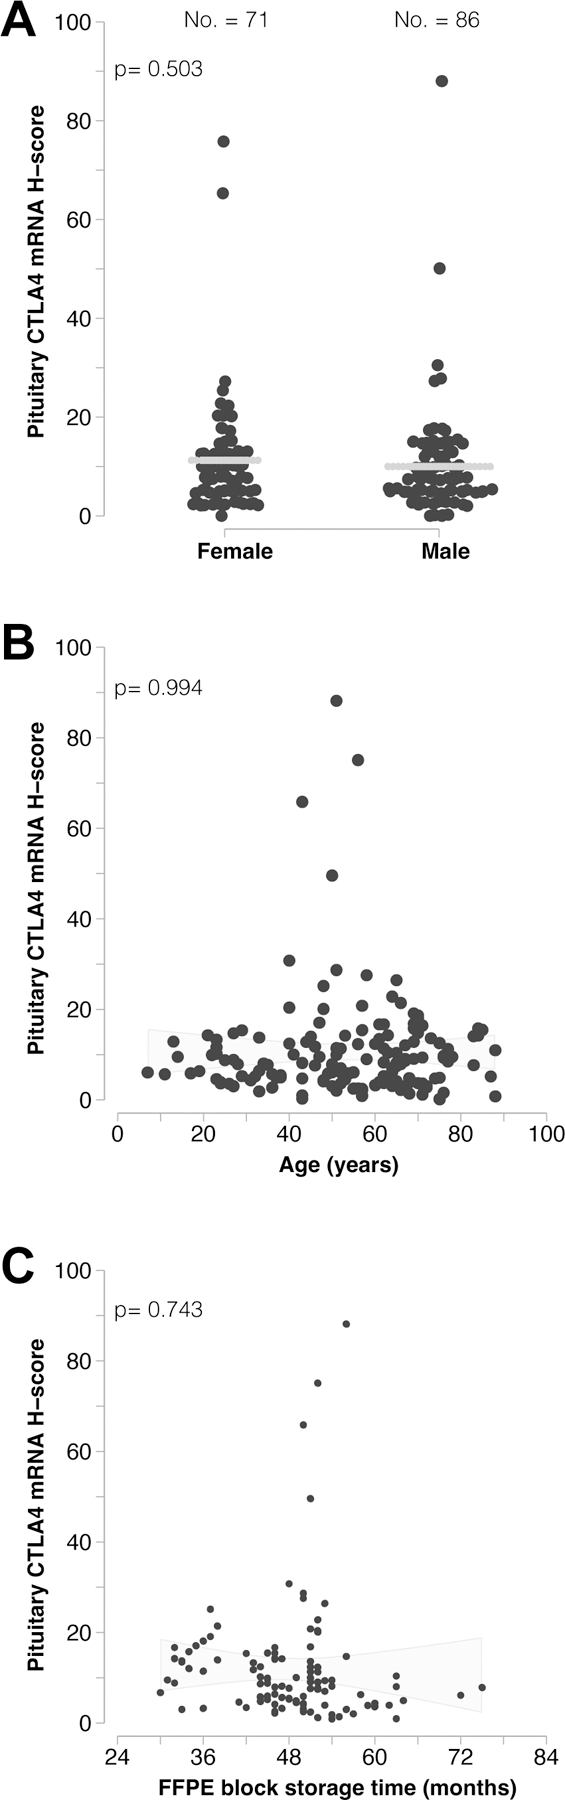
(A) CTLA4 mRNA expression does not differ between females and males, and (B) does not significantly vary with age. (C) Storage time of the archival blocks also does not significantly impact the detection of CTLA4 transcripts.
CTLA4 mRNA expression is highest in PRL-secreting and GH-secreting adenomas.
The expression of CTLA4 mRNA was highest in prolactinomas and GH-secreting adenomas, with average H-scores of 18 (± 21) and 17 (± 20), respectively (Figure 3A). These expression levels were significantly higher than those found in normal pituitary (7 ± 5, p= 0.009 for prolactinomas and 0.023 for GH-omas). CLTA4 expression in prolactinomas was also significantly higher than that seen in ACTH-secreting (p=0.012) adenomas non-secreting adenomas (p= 0.004, Figure 3A). There was no significant difference between PRL- and GH-secreting adenomas, although CTLA4 expression tended to be more prevalent and intense in prolactinoma: 8 of 25 (32%) prolactinomas and 3 of 11 (27%) GH-secreting adenomas had an H-score greater than 20, a score that was not seen in the other adenoma types or in normal pituitary glands (Figure 3A, dotted line). High CTLA4 expressing prolactinomas featured multiple clusters of CTLA4 transcripts occupying nucleus and cytosol (Figure 3B, arrows).
Figure 3. CTLA4 expression in a large panel of pituitary adenomas.
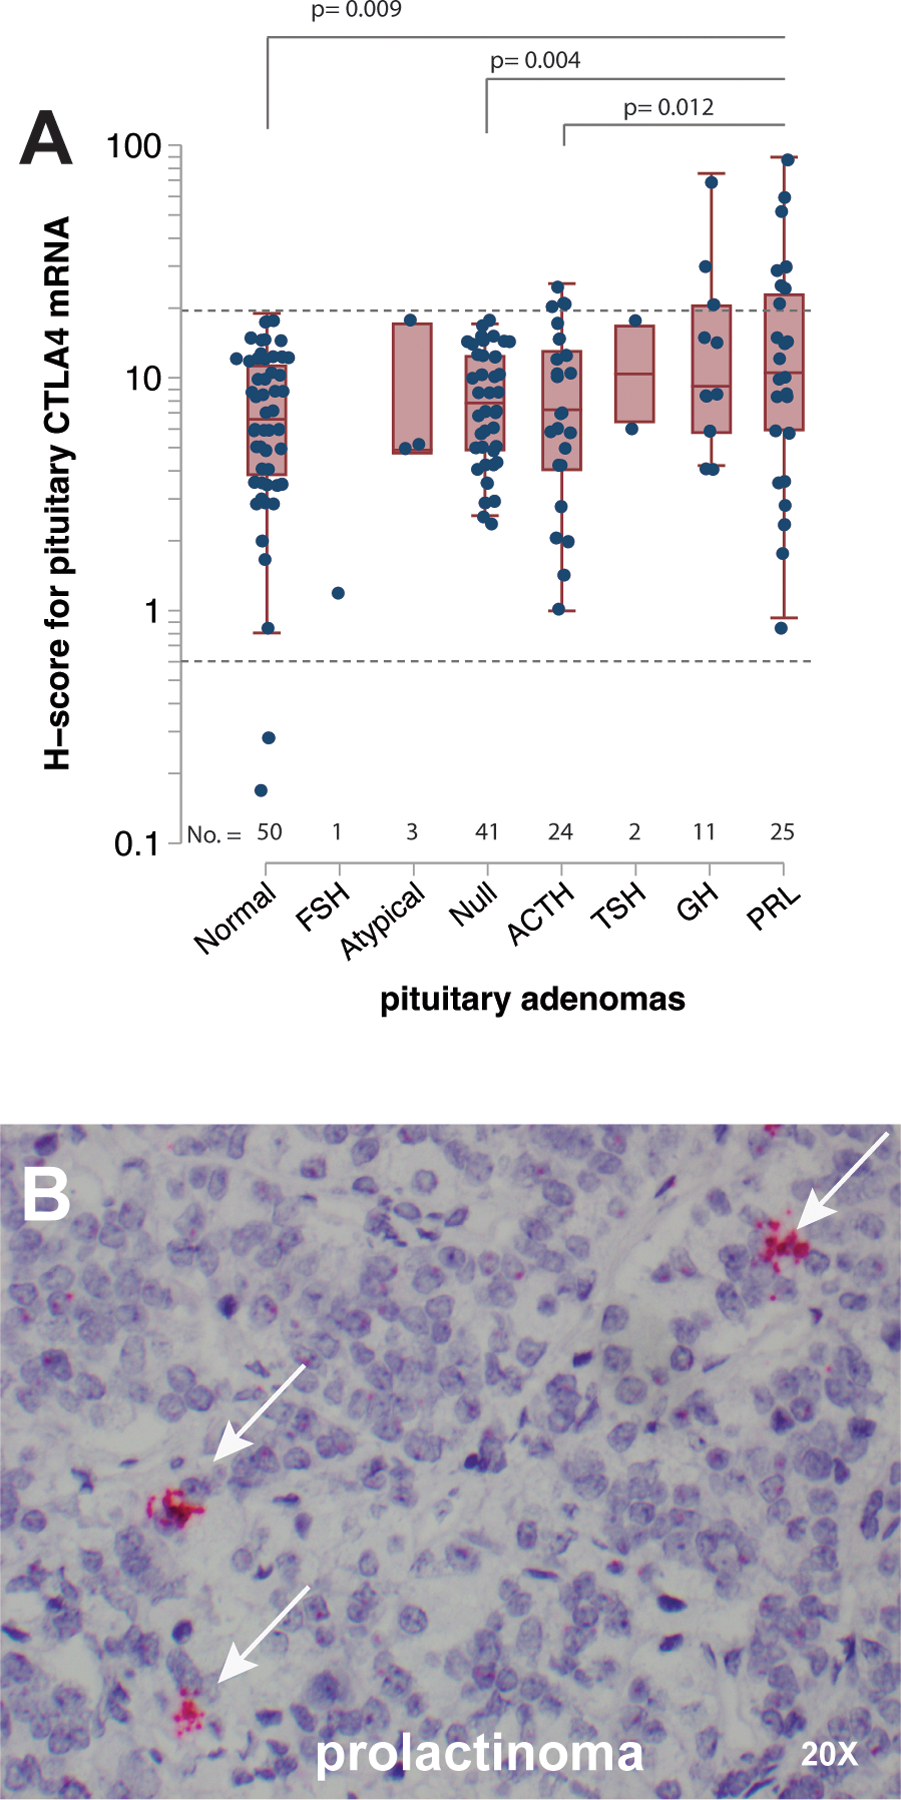
(A) Quantification of CTLA4 mRNA expression by RNAscope in 107 pituitary adenomas, consisting of 25 PRL-, 11 GH-, 2 TSH-, 24 ACTH-, and 1 FSH-secreting, as well as 41 non-secreting and 3 atypical specimens. The expression of CTLA4 in 50 normal pituitary samples (5 from surgical pathology and 45 from rapid autopsy) is also shown for comparison. The dotted horizontal line indicates a H-score value of 25. (B) Representative image of a PRL-secreting adenoma expresses high levels of CTLA4 mRNA. The white arrows indicate clusters of CTLA-mRNA transcripts. Each red dot represents a single copy of CTLA4 transcript. Original magnification times 20.
To confirm the expression of CTLA4 in pituitary hormone-secreting cells, we then used RNAscope Multiplex Fluorescent assay, which allows the simultaneous detection of mRNA and protein in the same cell type. We used pituitary specimens from a normal gland, prolactinoma, and TSH-secreting adenoma as a representation of the CTLA4 expression spectrum. RNAscope Multiplex Fluorescent assay was capable of visualizing the expression of CTLA4 (red color), PRL (white), and TSH (green). A normal pituitary gland featured the expression of CTLA and PRL mRNA (Figure 4A) in the same cell type, while CTLA4 and TSH mRNA did not colocalize (Figure 4B). However, we were able to confirm the co-expression of CTLA4 with PRL and TSH at protein level by the dual ISH/IHC technique: CTLA4 mRNA (red dots) were revealed by ISH in normal pituitary endocrine cells that also express PRL protein (brown staining, Figure 3C) and TSH protein (brown staining, Figure 4D). In a PRL-secreting tumor, the intense and diffuse brown staining from PRL protein was seen together with the red dots from CTLA4 mRNA (Figure 4E). In a TSH-secreting adenoma, the intense staining for CTLA4 mRNA represented by multiple clusters of red dots stands out among the weak and diffuse staining of TSH protein (Figure 4F).
Figure 4. CTLA4 mRNA and protein is expressed in PRL-secreting cells in normal pituitary and prolactinoma.
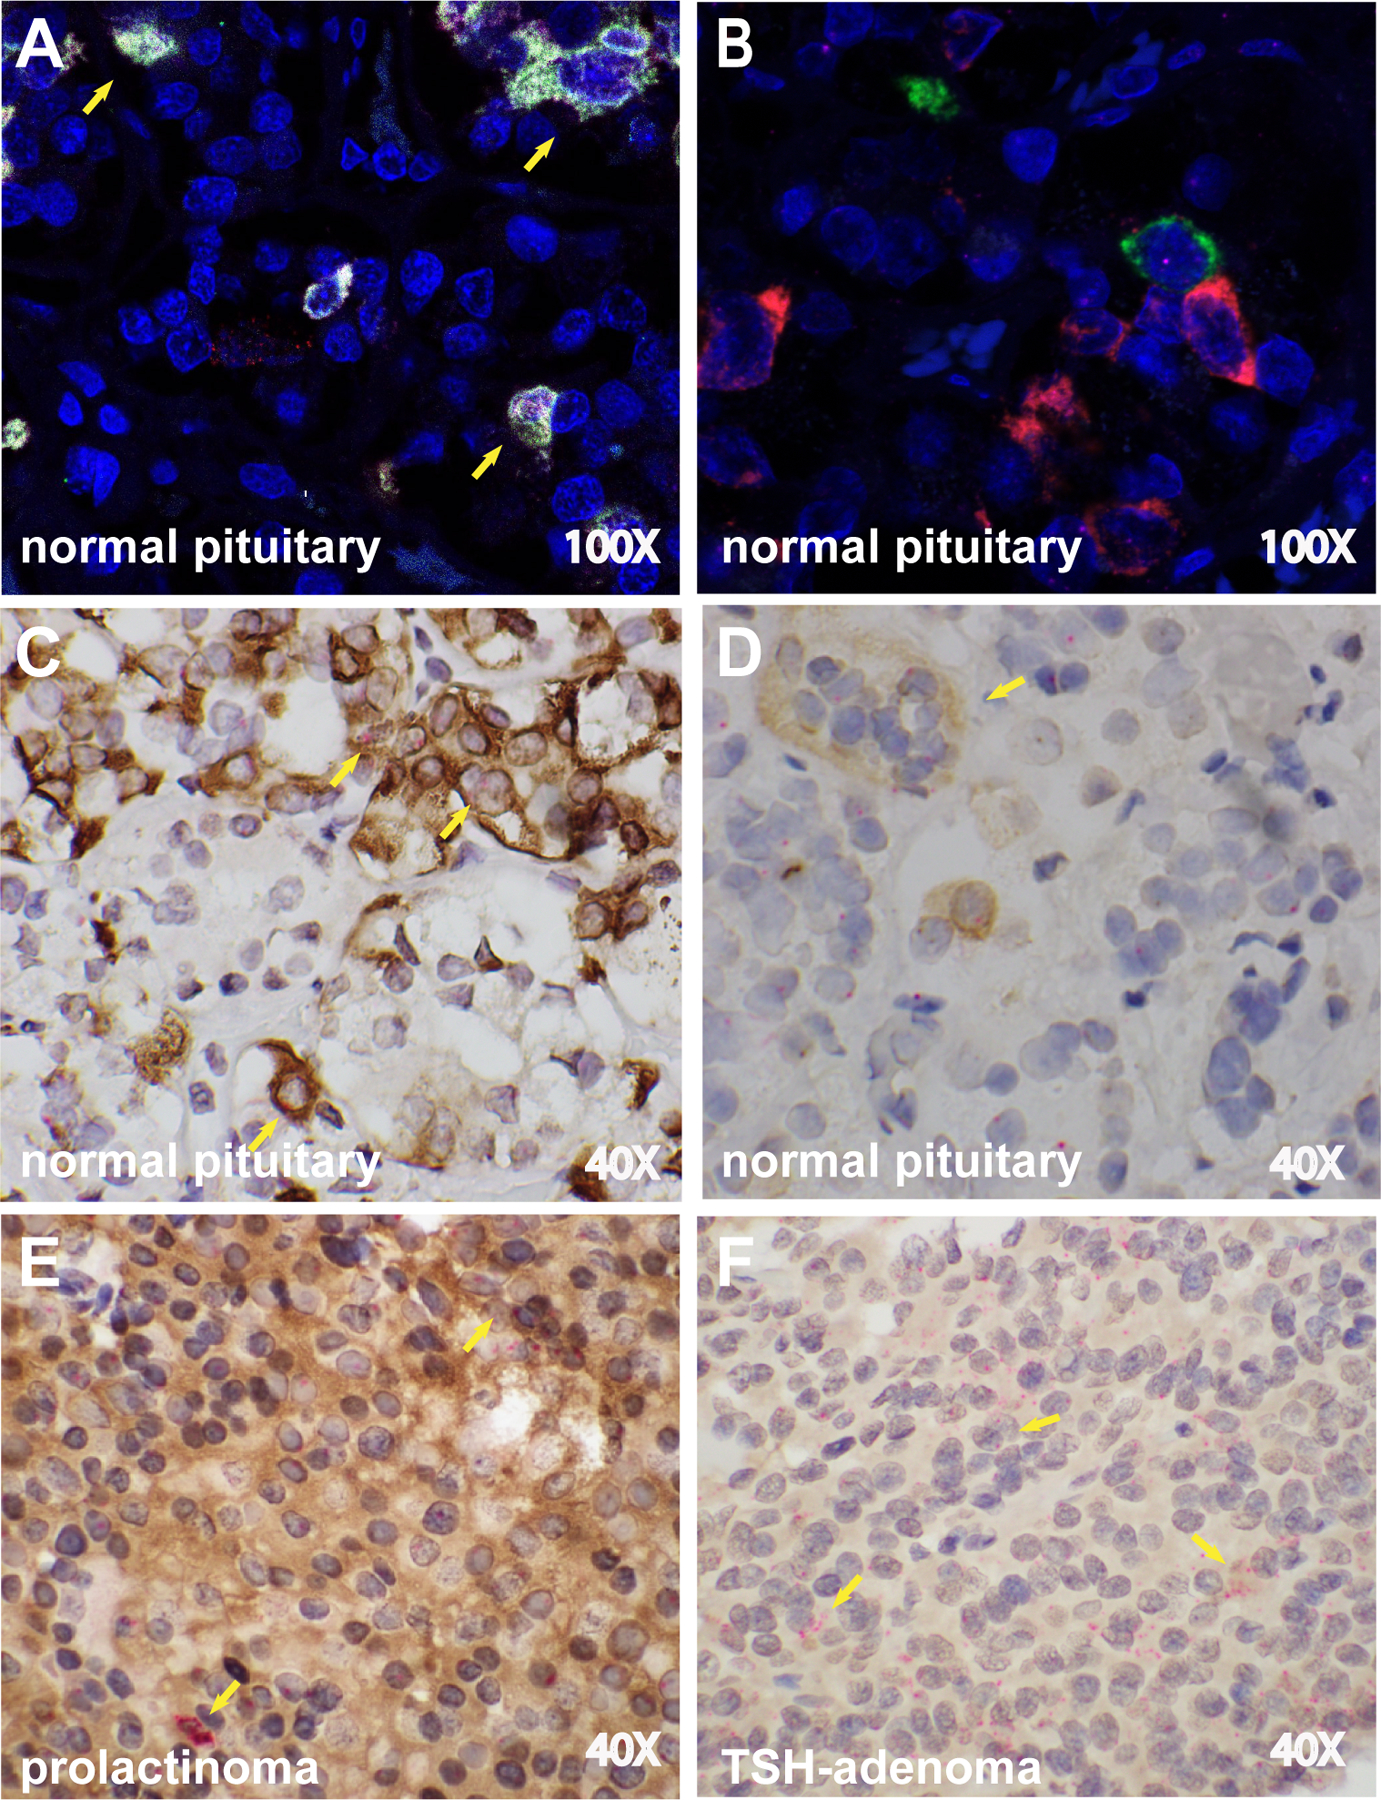
(A) RNAscope Multiplex Fluorescent assay on a normal pituitary gland shows the simultaneous expression of PRL mRNA (white dots) and CTLA4 mRNA (red dots), as indicated by the yellow arrows, while (B) no colocalization is seen for TSH and CTLA4 mRNA. (C) Dual ISH/IHC for CTLA4 mRNA (red dots) and PRL protein (brown staining) in a normal pituitary. The co-expression of CTLA4 mRNA and PRL protein can be seen in multiple cells (yellow arrows). (D) Dual ISH/IHC for CTLA4 mRNA (red dots) and TSH protein (brown staining) in a normal pituitary. A cluster of TSH-secreting cells expressing CTLA4 is shown (yellow arrow). CTLA4 mRNA is also visible in other cells that do not secrete TSH. (E) Dual ISH/IHC for CTLA4 mRNA and PRL protein in a PRL-secreting tumor. Diffuse brown staining for PRL and multiple clusters of CTLA4 mRNA copies (yellow arrows). (F) Dual ISH/IHC for CTLA4 mRNA and TSH protein in a TSH-secreting tumor. Diffuse brown staining for TSH and multiple clusters of CTLA4 mRNA copies (yellow arrows). Original magnification times 100 (A and B) or 40 (C-F).
CTLA4 mRNA is detected in rodent pituitary cell lines expressing PRL, ACTH, and gonadotropins.
We used rodent pituitary cell lines to assess the expression of CTLA4 mRNA, giving the rarity and difficulties in obtaining human cell lines. CTLA4 was detected in PRL-expressing MMQ (Figure 5A), FSH- and LH-expressing LβT2 (Figure 5B), and ACTH-expressing ATT20 cells (Figure 5C), but not in TSH-expressing TαT1 (Figure 5D) or GH-expressing GH3 cells (Figure 5E), confirming in part what was found in human pituitary specimens.
Figure 5. CTLA4 mRNA expression in five rodent pituitary cell lines.
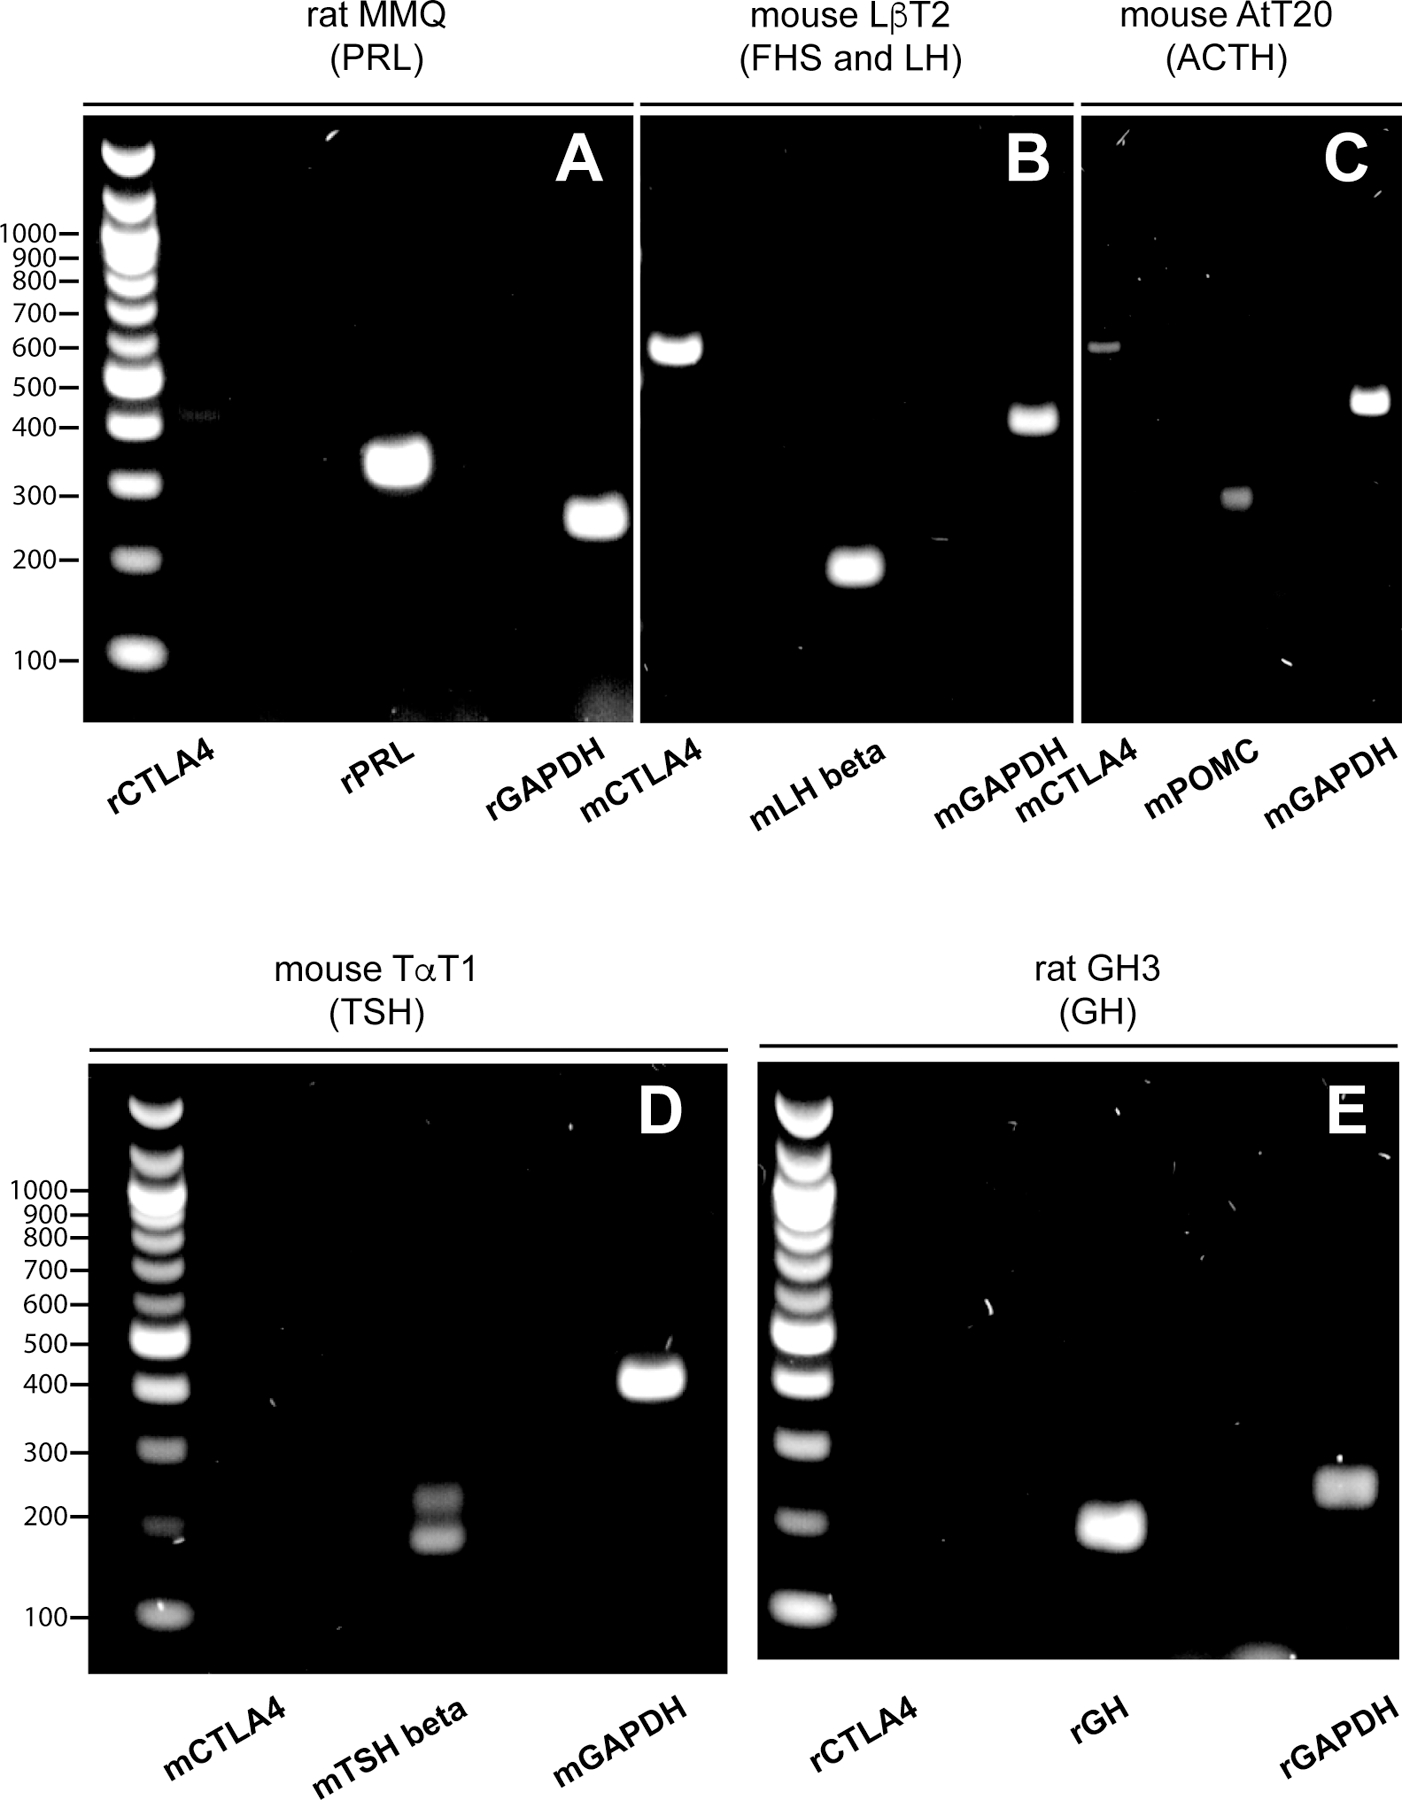
CTLA4 mRNA (597 bp) is detected in lactotroph MMQ (A), gonadotroph LβT2 (B), and corticotroph AtT20 cells (C), but not in thyrotroph TaT1 (D) or somatotroph GH3 cells (E). The transcript for the housekeeping gene glyceraldehyde 3-phosphate dehydrogenase (GAPDH, 397 bp) was used as internal control for the PCR amplification. (B) PCR products were electrophoresed on 2% polyacrylamide gels.
DISCUSSION
Pituitary tumors occasionally do not respond to conventional therapy, impacting the overall survival and quality of life of the affected patients. New therapeutic alternatives are, thus, being investigated, with particular emphasis given to monoclonal antibodies that inhibit pivotal immune checkpoints, such as CTLA4 and PD1. These two molecules are members of the immunoglobulin superfamily that were originally discovered and studied in the immunology arena. They are classically expressed on T lymphocytes upon activation and function as inhibitors of T cell activities and signaling. The idea of “inhibiting the inhibitors” as a way to unleash the patient’s own immune system led to the development of immune checkpoint inhibitors as a new way to treat cancer. But CTLA4 and PD1 are also expressed in a variety of other cell types. An analysis of the GTEx Portal database (https://gtexportal.org) (Supplementary Table 2) showed that, as expected, spleen is the organ expressing the greatest number of CTLA4 and PD1 mRNA transcripts per million (median of 5.8 and 11.9, respectively), followed by small intestine ( 4.9 and 4.1) and lungs (4.4 and 3.2). The latter two locations are known to be rich in mucosal associated lymphoid tissues, suggesting that the CTLA4 and PD1 signals could derive from the lymphocytes normally present in intestine and lungs. Nevertheless, other organs not known for lymphoid content, such as testicles, thyroid, and pituitary, do contain transcripts for these “immune” molecules (Supplementary Table 2). Placental fibroblasts have also been reported to express CTLA4 mRNA and protein (Kaufman, et al. 1999). And we (Iwama, et al. 2014) and others (Mei, et al. 2016; Sato, et al. 2019) have reported CTLA4 and PD1 in the pituitary gland.
The basic rationales for using immune checkpoint inhibitors as treatment for cancer are that blockade of CTLA4 broadens the diversity of the T cell receptor repertoire in CD4 T cells residing in peripheral lymphoid organs (Chen, et al. 2009; Robert, et al. 2014), while blockade of the PD1 pathway reinvigorates exhausted CD8 T cells residing at the tumor site (Im, et al. 2016). But the “ectopic” expression of CTLA4 and/or PD1 in non-lymphoid cells, however, could provide an additional rationale for using immune checkpoint inhibitors for the treatment of aggressive pituitary adenomas. In fact, the injected antibodies could bind to CTLA4 and/or PD1 not only when expressed on T lymphocytes but also when expressed on other cell types, such as the PRL- or GH-secreting cells of the pituitary gland. This antigen-antibody binding can then initiate an immune response that destroys the cells expressing CLTA4 and/or PD1 via classical type 2 and type 4 immune reactions [summarized in Figure 6 in (Caturegli, et al. 2016)]. Type 2 reactions are mediated by antibodies that bind to cell surface or cell-associated antigens via their Fab arms. Using their Fc fragment, antibodies can then recruit complement components from the bloodstream, initiating a cascade that ultimately damages the target organ (complement dependent cytotoxicity). Via their Fc fragment, antibodies can also recruit phagocytes that express the Fc receptors, such as macrophages (antibody dependent cellular phagocytosis). Type 4 reactions are instead mediated by T cells. T cells are recruited to the target organ by a variety of stimuli (from the presence of an allergen as in contact dermatitis to the appearance of non-self HLA molecules, as in graft rejections), and then damage the target either directly (cytotoxic T lymphocytes) or by activating other cells, such as macrophages or eosinophils), or releasing pro-inflammatory molecules, such as IL-17) (Park, et al. 2022). Although the binding of therapeutic CLTA4 blocking antibodies to the cognate CTLA antigen is mainly known to cause steric hindrance (Ramagopal, et al. 2017), it could also lead to the generation of new antigenic epitopes and thus the initiation of type 2 hypersensitivity reactions.
This study characterizes the expression of CTLA4 mRNA and protein in a large human sample of normal pituitary glands and pituitary adenoma using a variety of histological techniques that also allows colocalization between CTLA4 and anterior pituitary cell types. In both categories, normal and adenomas, this expression varied significantly independent of sex, as it can be seen in the GTEx Portal database. Here, using a cohort of 272 normal human pituitary glands collected from post-mortem donors, CTLA4 transcripts ranged from a minimum of 0.6 copies per million to 6.5, with a mean of 0.63 and median of 0.34 (Supplementary Table 2 and Supplementary Figure 3), with no significant difference between males and females. A possible explanation for this variability relates the very own cellular fate of CTLA4, a molecule that, at least in effector T cells, is not expressed constitutively. CTLA4 is instead found in intracellular vesicles located close to the microtubule organizing center (Alegre, et al. 1996), which then translocate to the cell surface, peaking at day 2–3 after activation (Egen and Allison 2002). CTLA4 translocation is a finely orchestrated process. Engagement of the T cell receptor and the stimulatory molecule CD28 with antigen-presenting cells induces the translocation of a small pool of CTLA4 molecules to the uropd, a projection of the plasma membrane that forms the T-cell side of the immunological synapse (Egen and Allison 2002). When on the T cell surface, CTLA4 dimerizes and outcompetes CD28 for the binding to B7 since CTLA4 has much higher affinity and avidity for B7 than CD28 (Wei, et al. 2018). The CTLA4-B7 binding induces a panel of inhibitory signals that reduce T cell activation, proliferation, and cytokine production (Valk, et al. 2008). There is no information about the cellular biology of CTLA4 in pituitary endocrine cells, thus we do not whether it mimics some of the aspects described in mouse T cells or not. Nevertheless, antibodies can recognize targets located inside an intact cell, such the nuclear Ro52 antigen in the heart cells of babies with neonatal lupus (Izmirly, et al. 2017), or the mitochondrial cytochrome P450 2D6 antigen in the liver cells of patients with type 1 autoimmune hepatitis (Manns, et al. 1991). It is therefore possible that therapeutic CTLA4 antibodies bind to CLTA4, independently of its location on the cell surface or the cytosol.
All five, terminally differentiated, pituitary cell types (GH-, PRL-, TSH-, ACTH-, and gonadotropin-secreting) expressed CTLA4 to varying degrees, both in normal and adenomatous glands. The expression, however, was strongest in PRL- and GH-secreting adenomas. Together with TSH, these 3 adenohypophyseal cells derive from a common gene lineage expressing the transcription factor POU class 1 homeobox 1 (formerly known as Pit1) (Cohen and Radovick 2002). These findings suggest a unique role of CTLA4 in PRL-, GH-, and TSH-secreting cells that remains to be uncovered. Analysis of mouse pituitary cell lines replicated the variation observed with human materials: in the lines derived from two rats with pituitary tumor, CTL4 mRNA was detected in tumor 7315a expressing prolactin (US Patent 5,510,260), but not in tumor MtT/W5 expressing GH (Tashjian, et al. 1968). Similarly, in the two lines derived from targeted oncogenesis in mice (Mellon, et al. 1991), CTLA4 was detected in the gonadotropin-expressing LβT2, but not the TSH-expressing TαT1, emphasizing the importance of assessing pituitary CLTA4 expression on a patient by patient.
The study was performed largely on archival pathological specimens. In a detailed RNAScope study of tissue microarray prostatectomy specimens, Baena-Del Valle and colleagues showed that the hybridization signal for 7 genes (TP63, ERG, PTEN, PCA3, MYC, AR exon 1, and 5.8 S rRNA) markedly decreased in blocks older than 5 years, with changes often appearing after one year (Baena-Del Valle, et al. 2017). We did not observe a significant decrease with storage time, perhaps related to the use of standard (individual) tissue sections or to intrinsic properties of CTLA4 mRNA stability. It has been, in fact, that polymorphisms in the 3’ untranslated region of the CTLA4 gene strongly influence mRNA stability and translational efficiency (Malquori, et al. 2008; Ueda, et al. 2003).
Strengths of the study included the large sample size, the usage of diversified techniques for detecting CTLA4 at both the RNA and protein levels, and the inclusion of in vitro studies based on mouse and rat pituitary cell lines. Limitations were the retrospective and observational nature, which does not allow gathering mechanistic insights, the reliance on archival blocks, and the lack of clinical and endocrinological correlations.
In summary, using a large panel of human pituitary specimens, we report that CTLA4 expression is increased in a discrete proportion of PRL- and GH-secreting adenomas. Testing such adenomas for CTLA4 expression, as it is routinely done for PD-L1 in non-small-cell lung cancer and other tumors, can personalize the selection of immune checkpoint inhibitors in patients with aggressive pituitary adenoma.
Supplementary Material
Supplementary Figure 1. CTLA4 RNA in situ hybridization with RNAscope controls. (A) Positive control probe: housekeeping gene Hs-PPIB (Hs-peptidylprolyl isomerase B). (B) Negative control probe: pB of Bacillus subtilis (Advanced Cell Diagnostics). Nuclei are counterstained with hematoxylin. Original magnification times 20.
Supplementary Figure 2. RNAscope Multiplex Fluorescent assay positive control. Housekeeping genes POLR2A in channel C1 (yellow), PPIB in channel C2 (green), and UBC in channel C3 (red) (Advanced Cell Diagnostics). Nuclei are counterstained with DAPI. Original magnification times 20.
Supplementary Figure 3. mRNA expression of CTLA4, PD1, and PD-L1 derived from the GTEx Portal database.
Funding sources:
this work was supported by National Institutes of Health Grant R01 CA194042 to PC. ES was supported in part by the Virginia O’Leary & John C. Wilson Autoimmune Disease Research Fellowship.
Footnotes
DECLARATION of INTEREST
The authors declare that there is no conflict of interest that could be perceived as prejudicing the impartiality of the research reported.
REFERENCES
- Alegre ML, Noel PJ, Eisfelder BJ, Chuang E, Clark MR, Reiner SL & Thompson CB 1996. Regulation of surface and intracellular expression of CTLA4 on mouse T cells. J Immunol 157 4762–4770. [PubMed] [Google Scholar]
- Asa SL, Mete O, Perry A & Osamura RY 2022. Overview of the 2022 WHO Classification of Pituitary Tumors. Endocr Pathol 33 6–26. [DOI] [PubMed] [Google Scholar]
- Baena-Del Valle JA, Zheng Q, Hicks JL, Fedor H, Trock BJ, Morrissey C, Corey E, Cornish TC, Sfanos KS & De Marzo AM 2017. Rapid Loss of RNA Detection by In Situ Hybridization in Stored Tissue Blocks and Preservation by Cold Storage of Unstained Slides. Am J Clin Pathol 148 398–415. [DOI] [PMC free article] [PubMed] [Google Scholar]
- Burman P, Casar-Borota O, Perez-Rivas LG & Dekkers OM 2023. Aggressive Pituitary Tumors and Pituitary Carcinomas: From Pathology to Treatment. J Clin Endocrinol Metab 108 1585–1601. [DOI] [PMC free article] [PubMed] [Google Scholar]
- Caturegli P, Di Dalmazi G, Lombardi M, Grosso F, Larman HB, Larman T, Taverna G, Cosottini M & Lupi I 2016. Hypophysitis Secondary to Cytotoxic T-Lymphocyte-Associated Protein 4 Blockade: Insights into Pathogenesis from an Autopsy Series. Am J Pathol 186 3225–3235. [DOI] [PMC free article] [PubMed] [Google Scholar]
- Chen H, Liakou CI, Kamat A, Pettaway C, Ward JF, Tang DN, Sun J, Jungbluth AA, Troncoso P, Logothetis C, et al. 2009. Anti-CTLA-4 therapy results in higher CD4+ICOShi T cell frequency and IFN-gamma levels in both nonmalignant and malignant prostate tissues. Proc Natl Acad Sci U S A 106 2729–2734. [DOI] [PMC free article] [PubMed] [Google Scholar]
- Chen Y, Wang CD, Su ZP, Chen YX, Cai L, Zhuge QC & Wu ZB 2012. Natural history of postoperative nonfunctioning pituitary adenomas: a systematic review and meta-analysis. Neuroendocrinology 96 333–342. [DOI] [PubMed] [Google Scholar]
- Clayton RN, Raskauskiene D, Reulen RC & Jones PW 2011. Mortality and morbidity in Cushing’s disease over 50 years in Stoke-on-Trent, UK: audit and meta-analysis of literature. J Clin Endocrinol Metab 96 632–642. [DOI] [PubMed] [Google Scholar]
- Cohen LE & Radovick S 2002. Molecular basis of combined pituitary hormone deficiencies. Endocr Rev 23 431–442. [DOI] [PubMed] [Google Scholar]
- Colao A, Petersenn S, Newell-Price J, Findling JW, Gu F, Maldonado M, Schoenherr U, Mills D, Salgado LR & Biller BM 2012. A 12-month phase 3 study of pasireotide in Cushing’s disease. N Engl J Med 366 914–924. [DOI] [PubMed] [Google Scholar]
- Dekkers OM, Biermasz NR, Pereira AM, Romijn JA & Vandenbroucke JP 2008. Mortality in acromegaly: a metaanalysis. J Clin Endocrinol Metab 93 61–67. [DOI] [PubMed] [Google Scholar]
- Egen JG & Allison JP 2002. Cytotoxic T lymphocyte antigen-4 accumulation in the immunological synapse is regulated by TCR signal strength. Immunity 16 23–35. [DOI] [PubMed] [Google Scholar]
- Frohman LA & Bonert V 2007. Pituitary tumor enlargement in two patients with acromegaly during pegvisomant therapy. Pituitary 10 283–289. [DOI] [PubMed] [Google Scholar]
- Graham KE, Nusser KD & Low MJ 1999. LbetaT2 gonadotroph cells secrete follicle stimulating hormone (FSH) in response to active A. J Endocrinol 162 R1–5. [DOI] [PubMed] [Google Scholar]
- Heaney A 2014. Management of aggressive pituitary adenomas and pituitary carcinomas. J Neurooncol 117 459–468. [DOI] [PubMed] [Google Scholar]
- Hellmann MD, Paz-Ares L, Bernabe Caro R, Zurawski B, Kim SW, Carcereny Costa E, Park K, Alexandru A, Lupinacci L, de la Mora Jimenez E, et al. 2019. Nivolumab plus Ipilimumab in Advanced Non-Small-Cell Lung Cancer. N Engl J Med 381 2020–2031. [DOI] [PubMed] [Google Scholar]
- Hodi FS, O’Day SJ, McDermott DF, Weber RW, Sosman JA, Haanen JB, Gonzalez R, Robert C, Schadendorf D, Hassel JC, et al. 2010. Improved survival with ipilimumab in patients with metastatic melanoma. N Engl J Med 363 711–723. [DOI] [PMC free article] [PubMed] [Google Scholar]
- Im SJ, Hashimoto M, Gerner MY, Lee J, Kissick HT, Burger MC, Shan Q, Hale JS, Lee J, Nasti TH, et al. 2016. Defining CD8+ T cells that provide the proliferative burst after PD-1 therapy. Nature 537 417–421. [DOI] [PMC free article] [PubMed] [Google Scholar]
- Iwama S, De Remigis A, Callahan MK, Slovin SF, Wolchok JD & Caturegli P 2014. Pituitary expression of CTLA-4 mediates hypophysitis secondary to administration of CTLA-4 blocking antibody. Sci Transl Med 6 230ra245. [DOI] [PubMed] [Google Scholar]
- Izmirly P, Saxena A & Buyon JP 2017. Progress in the pathogenesis and treatment of cardiac manifestations of neonatal lupus. Curr Opin Rheumatol 29 467–472. [DOI] [PMC free article] [PubMed] [Google Scholar]
- Kaufman KA, Bowen JA, Tsai AF, Bluestone JA, Hunt JS & Ober C 1999. The CTLA-4 gene is expressed in placental fibroblasts. Mol Hum Reprod 5 84–87. [DOI] [PubMed] [Google Scholar]
- Kemeny HR, Elsamadicy AA, Farber SH, Champion CD, Lorrey SJ, Chongsathidkiet P, Woroniecka KI, Cui X, Shen SH, Rhodin KE, et al. 2020. Targeting PD-L1 Initiates Effective Antitumor Immunity in a Murine Model of Cushing Disease. Clin Cancer Res 26 1141–1151. [DOI] [PMC free article] [PubMed] [Google Scholar]
- Lin AL, Jonsson P, Tabar V, Yang TJ, Cuaron J, Beal K, Cohen M, Postow M, Rosenblum M, Shia J, et al. 2018. Marked Response of a Hypermutated ACTH-Secreting Pituitary Carcinoma to Ipilimumab and Nivolumab. J Clin Endocrinol Metab 103 3925–3930. [DOI] [PMC free article] [PubMed] [Google Scholar]
- Malquori L, Carsetti L & Ruberti G 2008. The 3’ UTR of the human CTLA4 mRNA can regulate mRNA stability and translational efficiency. Biochim Biophys Acta 1779 60–65. [DOI] [PubMed] [Google Scholar]
- Manns MP, Griffin KJ, Sullivan KF & Johnson EF 1991. LKM-1 autoantibodies recognize a short linear sequence in P450IID6, a cytochrome P-450 monooxygenase. J Clin Invest 88 1370–1378. [DOI] [PMC free article] [PubMed] [Google Scholar]
- Mei Y, Bi WL, Greenwald NF, Du Z, Agar NY, Kaiser UB, Woodmansee WW, Reardon DA, Freeman GJ, Fecci PE, et al. 2016. Increased expression of programmed death ligand 1 (PD-L1) in human pituitary tumors. Oncotarget 7 76565–76576. [DOI] [PMC free article] [PubMed] [Google Scholar]
- Mellon PL, Windle JJ & Weiner RI 1991. Immortalization of neuroendocrine cells by targeted oncogenesis. Recent Prog Horm Res 47 69–93; discussion 93–66. [DOI] [PubMed] [Google Scholar]
- Motzer RJ, Tannir NM, McDermott DF, Arén Frontera O, Melichar B, Choueiri TK, Plimack ER, Barthélémy P, Porta C, George S, et al. 2018. Nivolumab plus Ipilimumab versus Sunitinib in Advanced Renal-Cell Carcinoma. N Engl J Med 378 1277–1290. [DOI] [PMC free article] [PubMed] [Google Scholar]
- Ostrom QT, Gittleman H, Liao P, Rouse C, Chen Y, Dowling J, Wolinsky Y, Kruchko C & Barnholtz-Sloan J 2014. CBTRUS statistical report: primary brain and central nervous system tumors diagnosed in the United States in 2007–2011. Neuro Oncol 16 Suppl 4 iv1–63. [DOI] [PMC free article] [PubMed] [Google Scholar]
- Park BC, Stone CA, Jr., Dewan AK& Johnson DB 2022. Hypersensitivity Reactions and Immune-Related Adverse Events to Immune Checkpoint Inhibitors: Approaches, Mechanisms, and Models. Immunol Allergy Clin North Am 42 285–305. [DOI] [PubMed] [Google Scholar]
- Ramagopal UA, Liu W, Garrett-Thomson SC, Bonanno JB, Yan Q, Srinivasan M, Wong SC, Bell A, Mankikar S, Rangan VS, et al. 2017. Structural basis for cancer immunotherapy by the first-in-class checkpoint inhibitor ipilimumab. Proc Natl Acad Sci U S A 114 E4223–e4232. [DOI] [PMC free article] [PubMed] [Google Scholar]
- Robert L, Tsoi J, Wang X, Emerson R, Homet B, Chodon T, Mok S, Huang RR, Cochran AJ, Comin-Anduix B, et al. 2014. CTLA4 blockade broadens the peripheral T-cell receptor repertoire. Clin Cancer Res 20 2424–2432. [DOI] [PMC free article] [PubMed] [Google Scholar]
- Sato M, Tamura R, Tamura H, Mase T, Kosugi K, Morimoto Y, Yoshida K & Toda M 2019. Analysis of Tumor Angiogenesis and Immune Microenvironment in Non-Functional Pituitary Endocrine Tumors. J Clin Med 8. [DOI] [PMC free article] [PubMed] [Google Scholar]
- Sheehan JP, Pouratian N, Steiner L, Laws ER & Vance ML 2011. Gamma Knife surgery for pituitary adenomas: factors related to radiological and endocrine outcomes. J Neurosurg 114 303–309. [DOI] [PubMed] [Google Scholar]
- Tashjian AH, Jr., Yasumura Y, Levine L, Sato GH & Parker ML 1968. Establishment of clonal strains of rat pituitary tumor cells that secrete growth hormone. Endocrinology 82 342–352. [DOI] [PubMed] [Google Scholar]
- Turgeon JL, Kimura Y, Waring DW & Mellon PL 1996. Steroid and pulsatile gonadotropin-releasing hormone (GnRH) regulation of luteinizing hormone and GnRH receptor in a novel gonadotrope cell line. Mol Endocrinol 10 439–450. [DOI] [PubMed] [Google Scholar]
- Ueda H, Howson JM, Esposito L, Heward J, Snook H, Chamberlain G, Rainbow DB, Hunter KM, Smith AN, Di Genova G, et al. 2003. Association of the T-cell regulatory gene CTLA4 with susceptibility to autoimmune disease. Nature 423 506–511. [DOI] [PubMed] [Google Scholar]
- Valk E, Rudd CE & Schneider H 2008. CTLA-4 trafficking and surface expression. Trends Immunol 29 272–279. [DOI] [PMC free article] [PubMed] [Google Scholar]
- Vroonen L, Jaffrain-Rea ML, Petrossians P, Tamagno G, Chanson P, Vilar L, Borson-Chazot F, Naves LA, Brue T, Gatta B, et al. 2012. Prolactinomas resistant to standard doses of cabergoline: a multicenter study of 92 patients. Eur J Endocrinol 167 651–662. [DOI] [PubMed] [Google Scholar]
- Wakelee H, Liberman M, Kato T, Tsuboi M, Lee SH, Gao S, Chen KN, Dooms C, Majem M, Eigendorff E, et al. 2023. Perioperative Pembrolizumab for Early-Stage Non-Small-Cell Lung Cancer. N Engl J Med [DOI] [PMC free article] [PubMed] [Google Scholar]
- Wei SC, Duffy CR & Allison JP 2018. Fundamental Mechanisms of Immune Checkpoint Blockade Therapy. Cancer Discov 8 1069–1086. [DOI] [PubMed] [Google Scholar]
- Yusta B, Alarid ET, Gordon DF, Ridgway EC & Mellon PL 1998. The thyrotropin beta-subunit gene is repressed by thyroid hormone in a novel thyrotrope cell line, mouse T alphaT1 cells. Endocrinology 139 4476–4482. [DOI] [PubMed] [Google Scholar]
Associated Data
This section collects any data citations, data availability statements, or supplementary materials included in this article.
Supplementary Materials
Supplementary Figure 1. CTLA4 RNA in situ hybridization with RNAscope controls. (A) Positive control probe: housekeeping gene Hs-PPIB (Hs-peptidylprolyl isomerase B). (B) Negative control probe: pB of Bacillus subtilis (Advanced Cell Diagnostics). Nuclei are counterstained with hematoxylin. Original magnification times 20.
Supplementary Figure 2. RNAscope Multiplex Fluorescent assay positive control. Housekeeping genes POLR2A in channel C1 (yellow), PPIB in channel C2 (green), and UBC in channel C3 (red) (Advanced Cell Diagnostics). Nuclei are counterstained with DAPI. Original magnification times 20.
Supplementary Figure 3. mRNA expression of CTLA4, PD1, and PD-L1 derived from the GTEx Portal database.