

Abstract
Background
Diabetes is a leading cause of end‐stage kidney disease (ESKD) mainly due to development and progression of diabetic kidney disease (DKD). In absence of definitive treatments of DKD, small studies showed that vitamin B may help in delaying progression of DKD by inhibiting vascular inflammation and endothelial cell damage. Hence, it could be beneficial as a treatment option for DKD.
Objectives
To assess the benefits and harms of vitamin B and its derivatives in patients with DKD.
Search methods
We searched the Cochrane Renal Group's Specialised Register to 29 October 2012 through contact with the Trials' Search Co‐ordinator using search terms relevant to this review.
Selection criteria
We included randomised controlled trials comparing vitamin B or its derivatives, or both with placebo, no treatment or active treatment in patients with DKD. We excluded studies comparing vitamin B or its derivatives, or both among patients with pre‐existing ESKD.
Data collection and analysis
Two authors independently assessed study eligibility, risk of bias and extracted data. Results were reported as risk ratio (RR) or risk differences (RD) with 95% confidence intervals (CI) for dichotomous outcomes and mean difference (MD) with 95% CI for continuous outcomes. Statistical analyses were performed using the random‐effects model.
Main results
Nine studies compared 1354 participants randomised to either vitamin B or its derivatives with placebo or active control were identified. A total of 1102 participants were randomised to single vitamin B derivatives, placebo or active control in eight studies, and 252 participants randomised to multiple vitamin B derivatives or placebo. Monotherapy included different dose of pyridoxamine (four studies), benfotiamine (1), folic acid (1), thiamine (1), and vitamin B12 (1) while combination therapy included folic acid, vitamin B6, and vitamin B12 in one study. Treatment duration ranged from two to 36 months. Selection bias was unclear in three studies and low in the remaining six studies. Two studies reported blinding of patient, caregiver and observer and were at low risk of performance and detection bias, two studies were at high risk bias, and five studies were unclear. Attrition bias was high in one study, unclear in one study and low in seven studies. Reporting bias was high in one study, unclear in one study, and low in the remaining seven studies. Four studies funded by pharmaceutical companies were judged to be at high risk bias, three were at low risk of bias, and two were unclear.
Only a single study reported a reduction in albuminuria with thiamine compared to placebo, while second study reported reduction in glomerular filtration rate (GFR) following use of combination therapy. No significant difference in the risk of all‐cause mortality with pyridoxamine or combination therapy was reported. None of the vitamin B derivatives used either alone or in combination improved kidney function: increased in creatinine clearance, improved the GFR; neither were effective in controlling blood pressure significantly compared to placebo or active control. One study reported a significant median reduction in urinary albumin excretion with thiamine treatment compared to placebo. No significant difference was found between vitamin B combination therapy and control group for serious adverse events, or one or more adverse event per patient. Vitamin B therapy was reported to well‐tolerated with mild side effects in studies with treatment duration of more than six months. Studies of less than six months duration did not explicitly report adverse events; they reported that the drugs were well‐tolerated without any serious drug related adverse events. None of the included studies reported cardiovascular death, progression from macroalbuminuria to ESKD, progression from microalbuminuria to macroalbuminuria, regression from microalbuminuria to normoalbuminuria, doubling of SCr, and quality of life. We were not able to perform subgroup or sensitivity analyses or assess publication bias due to insufficient data.
Authors' conclusions
There is an absence of evidence to recommend the use of vitamin B therapy alone or combination for delaying progression of DKD. Thiamine was found to be beneficial for reduction in albuminuria in a single study; however, there was lack of any improvement in kidney function or blood pressure following the use of vitamin B preparations used alone or in combination. These findings require further confirmation given the limitations of the small number and poor quality of the available studies.
Keywords: Humans, Albuminuria, Albuminuria/drug therapy, Diabetic Nephropathies, Diabetic Nephropathies/drug therapy, Folic Acid, Folic Acid/therapeutic use, Pyridoxamine, Pyridoxamine/therapeutic use, Randomized Controlled Trials as Topic, Selection Bias, Thiamine, Thiamine/analogs & derivatives, Thiamine/therapeutic use, Vitamin B 12, Vitamin B 12/therapeutic use, Vitamin B 6, Vitamin B 6/therapeutic use, Vitamin B Complex, Vitamin B Complex/adverse effects, Vitamin B Complex/therapeutic use, Vitamins, Vitamins/adverse effects, Vitamins/therapeutic use
Plain language summary
Vitamin B and its derivatives for diabetic kidney disease
Diabetic kidney disease (DKD) is a disorder which results in excessive protein, mainly albumin, loss in urine. DKD is a major cause of kidney failure and cardiovascular disease in patients with diabetes. Although vitamin B is commonly used in DKD, its effects are unclear. This review included nine studies with a total of 1354 participants. One study reported improvement in urinary albumin levels following use of thiamine. None of the other studies reported improvement in kidney function or reduction in urinary albumin excretion after two to 36 months monotherapy with vitamin B therapy. Vitamin B therapy was reported to well‐tolerated with mild side effects in studies with treatment duration of more than six months. Studies of less than six months duration did not explicitly report adverse events; they reported that the drugs were well‐tolerated without any serious drug related adverse events. All these findings require confirmation in larger studies before they can be accepted as definite.
Background
Description of the condition
Diabetic kidney disease (DKD) ‐ also known as diabetic nephropathy ‐ is a common complication that occurs in patients with both type 1 and type 2 diabetes mellitus (DM) (Marshall 2004; Mogensen 1995; Valk 2011). DKD is characterised by persistent positive albumin excretion in urine. The early stage of microalbuminuria is often referred as incipient nephropathy (urinary albumin excretion (UAE) > 30 mg/24 h) and can progress to macroalbuminuria (UAE > 300 mg/24 h) (overt kidney disease) in the absence of other kidney disease. Glomerular filtration rate (GFR) impairment and end‐stage kidney disease (ESKD) are markers of late stage DKD. Patients with DKD types 1 and 2 share similar prognostic patterns (Mogensen 1995; Mogensen 1999). DKD occurs in approximately 20% to 50% of patients with types 1 and 2 diabetes within 20 to 25 years of diabetes onset (Bloomgarden 2008; Dronavalli 2008; Gross 2005; Marshall 2004; Ritz 1999). Progression from microalbuminuria to macroalbuminuria occurs in 40% to 60% of patients with types 1 and 2 DM over 5 to 10 years of period (Bloomgarden 2008). Between 20% and 40% of patients with DKD progress to ESKD, and there is a high risk of death from associated coronary artery disease and other cardiovascular causes with DKD (Dinneen 1997; Gall 1993). The risk of cardiovascular disease increases progressively as albuminuria levels escalate and GFR decreases (Adler 2003; Miettinen 1996; Valmadrid 2000). Cardiovascular disease is a major cause of death in patients with ESKD (Levin 2003) and therefore imposes a substantial burden in terms of morbidity, and mortality. DKD management strategies should be directed towards limiting progression to ESKD and reducing mortality.
Risk factors associated with development of DKD include sustained hyperglycaemia and hypertension (Adler 2000; Fioretto 1998; Gall 1997; MCSG 1999; Ravid 1998; Stratton 2000); glomerular hyperfiltration (Caramori 1999; Dahlquist 2001; Silveiro 1998); smoking (Hovind 2003; Sawicki 1994); dyslipidaemia (Appel 2003; Chaturvedi 2001; Gall 1997; Ravid 1998); proteinuria levels (Ruggenenti 1998; Remuzzi 1997); and dietary factors, such as the amount and source of protein (Mollsten 2001; Pecis 1994; Toeller 1997) and fat (Riley 1998) in the diet as putative risk factors. Multidimensional management is therefore required for DKD to control risk factors and inhibit pathogenic pathways. Despite availability of effective therapies that can reduce progression of DKD, such as angiotensin‐converting enzyme inhibitors (ACEis), angiotensin receptor blockers (ARBs), prostaglandin E1, and aldosterone antagonists, many patients with DKD develop ESKD (Bolignano 2014; Wang 2010). Around 40% of the estimated 21 million patients with diabetes in the United States develop advanced DKD despite optimum treatment (Palmer 2008). More and newer interventions are required to limit the impact of DKD.
Description of the intervention
The B vitamins are a group of eight water‐soluble vitamins that play important roles in cell metabolism. Vitamin B complex contains all eight components: vitamin B1 (thiamine), vitamin B2 (riboflavin), vitamin B3 (niacin or niacinamide), vitamin B5 (pantothenic acid), vitamin B6 (pyridoxine, pyridoxal, or pyridoxamine, or pyridoxine hydrochloride), vitamin B7 (biotin), vitamin B9 (folic acid) and vitamin B12. Vitamin B12 has several congeners: cyanocobalamin, hydroxocobalamin, methylcobalamin, and 5’‐deoxyadenosylcobalamin. Each vitamin B complex component has an individual structure and performs unique function in the human body. Vitamins B1, B2, B3, and biotin participate in different aspects of energy production; vitamin B6 is essential for amino acid metabolism, and vitamin B12 and folic acid facilitate steps required for cell division. Thiamine is required for normal functioning of the heart, muscles, and nerves, and its intake is beneficial in the treatment of certain metabolic disorders (Malecka 2006; Thornalley 2005). Benfotiamine is a derivative of thiamine monophosphate which is better absorbed after oral administration than the water‐soluble thiamine salts resulting in higher levels of the active compound in blood and tissues (Schreeb 1997; Wu 2006). Requirements for components of the vitamin B complex vary considerably ‐ from 3 μg/d for vitamin B12 to 18 mg/d for vitamin B3 in adult males.
How the intervention might work
Hyperglycaemia is a major risk factor for DKD. It leads a cascade of biochemical reactions that are ultimately responsible for DKD. High cytosolic glucose concentration leads to metabolic dysfunction by over expression of glucose transporter‐1 (GLUT1) in renal mesangial cells. These involve activation of the protein kinase C (PKC) (Ayo 1991) hexosamine pathway, and polyol pathways (Chung 2003); accumulation of triose phosphates (Tilton 1992); metabolic pseudo hypoxia; mitochondrial dysfunction, oxidative stress (Nishikawa 2000; Yim 2001) and accumulation of advanced glycation end (AGE) products (Brownlee 2001; Du 2000; Heilig 1995). AGE products accumulate in the kidneys which are centrally involved in AGE product clearance (Forbes 2003). There is a strong correlation between AGE product accumulation and the presence and severity of DKD (Monnier 1999). High sugar level in cells disrupts normal cellular glucose metabolism resulting in accumulation of super reactive glucose‐metabolic intermediates such as triose phosphates. Excess triose phosphates attack surrounding proteins, lipids and DNA resulting in formation of oxo aldehydes that creates AGE product damage (Brownlee 2001; Thornalley 2005). Accumulation of triose phosphates arising from high cytosolic glucose concentrations trigger biochemical dysfunction in renal cells that ultimately leads to development of DKD (Babaei‐Jadidi 2003; Nishikawa 2000; Tilton 1992). Preventing triose phosphate accumulation in hyperglycaemia can suppress these pathways and prevent DKD development.
Thiamine has been associated with reducing serum and tissue accumulation of AGE products and investigated for its utility in DKD prevention (Thornalley 2005). Thiamine pyrophosphate (TPP), an active form of thiamine, has been shown to prevent AGE product formation by inhibiting conversion of Amadori products to AGE products (Booth 1996; Goh 2008). TPP normalises triose phosphates by activating the reductive pentose phosphate pathway (Babaei‐Jadidi 2003). TPP activates an enzyme (transketolase) that shunts excess triose phosphates into a safe alternative pentose phosphate metabolic pathway which prevents formation of AGE products and high sugar‐induced metabolic cellular stress (Goh 2008; Hatfield 2005; Huijberts 2008). This action stimulates conversion of GA3P and fructose‐6‐phosphate (F6P) to ribose‐5‐phosphate (R5P) (Babaei‐Jadidi 2003). In pre‐clinical experimental models, high‐dose thiamine and benfotiamine corrected delayed replication; activation of PKC; increased hexosamine and AGE product concentrations; and oxidative stress in capillary and aortal endothelial cells (Bergfeld 2001; La Selva 1996). Benfotiamine blocks three major biochemical pathways that are involved in chronic hyperglycaemia‐induced vascular damage: the hexosamine pathway, AGE formation pathway and diacylglycerol–PKC pathway (Hammes 2003). Benfotiamine has been reported to prevent progression of diabetic complications by increasing tissue levels of thiamine diphosphate and subsequently enhancing transketolase activity (Hammes 2003; Volvert 2008). Supplementation with benfotiamine in patients with DKD has been reported to be responsible for decreased incidence of albuminuria/proteinuria, AGE product accumulation and oxidative stress in renal cells (Bakker 1997; Karachalias 2003; Thornalley 2007). Overall, these actions decrease inflammatory and fibrotic responses to inhibit DKD progression (Bakker 1997; Karachalias 2003; Thornalley 2007). Apart from thiamine, experimental studies have confirmed that pyridoxamine is also a potent inhibitor of AGE product accumulation, and effective in reducing kidney injury in diabetes (Alderson 2003).
Why it is important to do this review
Evaluating the efficacy of vitamin B and its derivatives, alone or in combinations, for inhibiting progression of DKD and reducing mortality may provide additional options to current treatment pathways for patients with DKD. There is a substantial body of published clinical studies, and many ongoing investigations, in the intervention of interest. Currently, there are no health technology assessment reviews or systematic reviews assessing vitamin B or its derivatives, or both for DKD. The scope of the current review is to identify and aggregate good quality evidence on vitamin B or its derivatives, or both for DKD with the major focus on core clinical and patient‐related outcomes ‐ as these aspects are important contributors to the strength of recommendations for all therapies and also the use of vitamin B preparations in DKD.
Objectives
We assessed the benefits and harms of vitamin B and its derivatives in patients with DKD.
Methods
Criteria for considering studies for this review
Types of studies
All randomised controlled trials (RCTs) and quasi‐RCTs (RCTs in which allocation to treatment was obtained by alternation, use of alternate medical records, date of birth or other predictable methods) evaluating benefits and harms of vitamin B or its derivatives, or both in the patients with DKD.
Types of participants
Inclusion criteria
We included studies conducted in patients with type 1 and type 2 DKD. To consistently capture changes in classification and diagnostic criteria for DM over time, we included studies that assigned standard criteria that were valid at study outset (e.g. ADA 1999; ADA 2008; ADA 2010; Alberti 1998; WHO 1980; WHO 1985). Ideally, diagnostic criteria should have been described. Further, diagnostic criteria for DKD should be mentioned clearly and should adhere to diagnosis provided by the American Diabetes Association (ADA) (ADA 1999; ADA 2008; ADA 2010; KDOQI 2007) and other standard guideline. If necessary, we used authors' definition of DM and DKD. We planned to investigate diagnostic criteria used for diabetes and DKD in sensitivity analysis.
Exclusion criteria
We excluded studies in patients with kidney injury due to diseases other than diabetes, and types of diabetes other than type 1 or type 2 diabetes (i.e. gestational diabetes) or patients with final stage DKD or ESKD (GFR < 10 mL/min or requirement for renal replacement therapy).
Types of interventions
Vitamin B, its derivative preparations, or both versus placebo
Vitamin B, its derivative preparations, or both plus other drugs versus other drugs (ACEIs, ARBs, calcium channel blockers (CCBs))
Vitamin B, its derivative preparations, or both versus other drugs (ACEIs, ARBs, CCBs).
Types of outcome measures
Primary outcomes
All‐cause mortality
Cardiovascular mortality.
Secondary outcomes
Progression from macroalbuminuria to ESKD
Progression from microalbuminuria to macroalbuminuria
Regression from microalbuminuria to normoalbuminuria
Kidney function measures (creatinine clearance (CrCl), GFR, doubling of serum creatinine (SCr), SCr, proteinuria, dialysis)
Blood pressure (systolic (SBP); diastolic (DBP))
Quality of life
Adverse events.
Timing of outcome measurement
We assessed outcomes in the short‐term (≥ 12 weeks to < 18 weeks), medium‐term (≥ 18 weeks to < 52 weeks) and long‐term (≥ 52 weeks). Data from long term extension studies of RCTs was considered only if participants were maintained the same sequence allocation as in the initial feeder study.
Search methods for identification of studies
Electronic searches
We searched the Cochrane Renal Group's Specialised Register (to 29 October 2012) through contact with the Trials' Search Co‐ordinator using search terms relevant to this review. The Cochrane Renal Group’s Specialised Register contains studies identified from the following sources.
Quarterly searches of the Cochrane Central Register of Controlled Trials CENTRAL
Weekly searches of MEDLINE OVID SP
Handsearching of renal‐related journals and the proceedings of major renal conferences
Searching of the current year of EMBASE OVID SP
Weekly current awareness alerts for selected renal journals
Searches of the International Clinical Trials Register (ICTRP) Search Portal and ClinicalTrials.gov.
Studies contained in the Specialised Register are identified through search strategies for CENTRAL, MEDLINE, and EMBASE based on the scope of the Cochrane Renal Group. Details of these strategies as well as a list of handsearched journals, conference proceedings and current awareness alerts are available in the Specialised Register section of information about the Cochrane Renal Group.
See Appendix 1 for search terms used in strategies for this review.
Searching other resources
Reference lists of clinical practice guidelines, review articles and relevant studies.
Letters seeking information about unpublished or incomplete studies to investigators known to be involved in previous studies.
Data collection and analysis
Selection of studies
The search strategy as described was used to obtain titles and abstracts of studies with relevance to the review. The titles and abstracts were screened independently by two authors who discarded studies that were not applicable; however, studies and reviews that may include relevant data or information on studies were retained initially. The same two authors independently assessed retrieved abstracts, and if necessary the full text of these studies to determine if they satisfy the inclusion criteria. Interrater agreement for selection of potentially relevant studies was measured using the kappa statistic (Cohen 1960). Disagreements were resolved by consensus between authors. A third author arbitrated if consensus could not be achieved. An adapted PRISMA flowchart illustrated the study selection process (Liberati 2009).
Data extraction and management
Data extraction was carried out independently by two authors using standard data extraction forms. Studies reported in non‐English language journals were to be translated before assessment. Where more than one publication of one study existed, reports be grouped together and the publication with the most complete data was used in the analyses. When relevant outcomes were only published in earlier versions these data were used. Any discrepancies between published versions were to be highlighted.
Assessment of risk of bias in included studies
The following items were independently assessed by two authors using the risk of bias assessment tool (Higgins 2011) (see Appendix 2).
Was there adequate sequence generation (selection bias)?
Was allocation adequately concealed (selection bias)?
-
Was knowledge of the allocated interventions adequately prevented during the study (detection bias)?
Participants and personnel
Outcome assessors
Were incomplete outcome data adequately addressed (attrition bias)?
Are reports of the study free of suggestion of selective outcome reporting (reporting bias)?
Was the study apparently free of other problems that could put it at a risk of bias?
Measures of treatment effect
Results were expressed as risk ratio (RR) with 95% confidence intervals (CI) for dichotomous outcomes, such as death. Mean differences (MD) was calculated where continuous scales of measurement were used to assess the effects of treatment (blood pressure, CrCl, UAE, SCr, quality of life), or the standardised mean difference (SMD) if different scales were used. Time‐to‐event outcomes (such as time to development of macrovascular disease or ESKD) were to be expressed as hazard ratios (HR) with 95% CI. Adverse effects were tabulated and assessed with descriptive techniques, as they are likely to be different for the various agents used. Where possible, the RR with 95% CI was calculated for each adverse effect, either compared to no treatment or to another agent.
Unit of analysis issues
We took into account the level at which randomisation occurred, such as cross‐over studies, cluster‐randomised studies and multiple observations for the same outcome (Higgins 2011).
Dealing with missing data
We obtained relevant missing data from some of included the study authors upon sending e‐mail to them. We investigated attrition rates (drop‐outs, loss to follow‐up and withdrawals) and critically appraise missing data issues and imputation methods (such as last‐observation‐carried‐forward) (Higgins 2011).
Assessment of heterogeneity
Heterogeneity was analysed using a Chi² test on N‐1 degrees of freedom, with an alpha of 0.05 used for statistical significance and with the I² test (Higgins 2003). I² values of 25%, 50% and 75% correspond to low, medium and high levels of heterogeneity, respectively.
Assessment of reporting biases
There were insufficient studies to assess potential existence of study bias using funnel plot.
Data synthesis
Data were pooled using the random‐effects model but the fixed‐effect model was also used to ensure robustness of the model chosen and susceptibility to outliers.
Subgroup analysis and investigation of heterogeneity
Subgroup analysis was conducted to explore possible sources of heterogeneity, such as participants, interventions and study quality. Heterogeneity among participants may be related to age and renal pathology. Heterogeneity in treatments may be related to prior agents used and dose and duration of therapy. We planned to perform subgroup analyses as one of the primary outcome parameters demonstrated statistically significant differences between intervention groups.
Due to insufficient studies, we were not able to conduct subgroup analysis as planned for primary outcomes based on the following criteria.
Ethnicity of participants
Microalbuminuria or macroalbuminuria
Participants with or without hypertension, dyslipidaemia, or abnormal blood glucose
Treatment duration (< 6 months or ≥ 6 months)
Different combinations of vitamin B derivatives
Dose
Use of ACEi or ARB or both
Use of other antihypertensive treatments.
Sensitivity analysis
Due to insufficient studies, we were not able to perform sensitivity analysis as planned to explore the influence of the following factors on effect size.
Repeating the analysis excluding unpublished studies
Repeating the analysis taking into account risk of bias, as specified
Repeating the analysis excluding very long or large studies to establish how much they dominate the results
Repeating the analysis excluding studies to filter: diagnostic criteria, language of publication, source of funding (industry versus other), and country.
Results
Description of studies
Results of the search
See Characteristics of included studies and Characteristics of excluded studies for full details of the studies.
We identified a total of 91 records (60 studies) after running the search strategy in Cochrane Renal Group's Specialised Register through contact with the Trials' Search Co‐ordinator. The search resulted in a unique list of references in which studies with multiple publications were linked through a common identifier.
We excluded a total of 50 studies (76 articles) based on titles or abstracts which were not relevant to our review. We included nine studies (14 records) for this review (Figure 1). There was a complete agreement in study selection process between the two authors.
1.
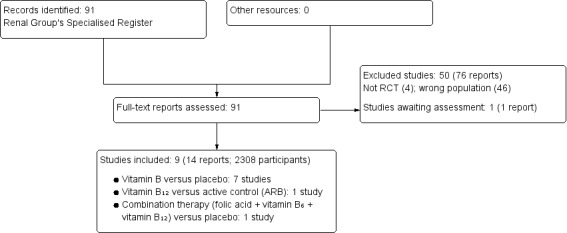
Study flow diagram.
One study, listed in ClinicalTrials.gov, is awaiting assessment (Characteristics of studies awaiting classification). This study evaluated the effects of folic acid in patients with DKD. We found neither a full publication nor any conference abstracts for this study. We were unable to get any data upon contacting the authors, we will incorporate this study as and when results are publicly available.
Included studies
We included nine studies enrolling 1354 participants (Agha 2009; Alkhalaf 2010; DIVINe Study 2010; Lewis 2012; PYR‐205 Study 2007; PYR‐206 Study 2007; PYR‐207 Study 2007; Rabbani 2009; Wotherspoon 2008). All were published in English and all were parallel group designs.
Number of study centres, countries, locations and settings
Four studies were carried out in a single centre at a diabetic outpatient clinic; two in Pakistan (Agha 2009; Rabbani 2009), one in the Netherlands (Alkhalaf 2010), and one in UK (Wotherspoon 2008). Five were multicentre studies. DIVINe Study 2010 was carried out at five different university medical centres in Canada. Four studies (Lewis 2012; PYR‐205 Study 2007; PYR‐206 Study 2007; PYR‐207 Study 2007) were international studies carried out in Australia, Canada, Belgium, Israel, South Africa, UK, and USA.
Duration of intervention
Duration of intervention varied from two months (Wotherspoon 2008), three months (Alkhalaf 2010; Rabbani 2009), six months (Agha 2009; PYR‐205 Study 2007; PYR‐206 Study 2007; PYR‐207 Study 2007); 12 months (Lewis 2012), and 36 months (DIVINe Study 2010).
Participants
Nine studies compared 1354 participants randomised to either vitamin B and its derivatives or placebo or active control. A total of 1102 participants were randomised to single vitamin B derivatives, placebo or active control in eight studies, and 252 participants randomised to multiple vitamin B derivatives or placebo.
Inclusion criteria
All the studies included patients with DKD, however, the diagnostic criteria and severity of DKD varied across the studies. Three studies (Agha 2009; Alkhalaf 2010; Rabbani 2009) included patients with initial stages of DKD. Alkhalaf 2010 included patients with UAE ranging from 15 to 300 mg/24 h or equivalent albumin:creatinine ratio (ACR) (males: 1.25 to 25 mg/mmol; females: 1.75 to 35 mg/mmol) in two of three samples despite ACEIs or ARBs, or both in unchanged dose for at least three months. Rabbani 2009 and Agha 2009 defined microalbuminuria as UAE 30 to 299 mg/24 h urine. Five studies (DIVINe Study 2010; Lewis 2012; PYR‐205 Study 2007; PYR‐206 Study 2007; PYR‐207 Study 2007) included advanced stages of DKD. Four studies (DIVINe Study 2010; PYR‐205 Study 2007; PYR‐206 Study 2007; PYR‐207 Study 2007) defined DKD as clinical or histological diagnosis of DKD, and UAE at least of 300 mg/d or urinary protein level of at least 500 mg/24 h; Lewis 2012 defined DKD as a SCR of 1.3 to 3.3 mg/dL (women) or 1.5 to 3.5 mg/dL (men), and 24 hour urine ACR ratio > 1200 mg/g while receiving an ACEis or ARBs at the maximum Food and Drug Administration recommended dosage for more than three months. Two studies included participants as per levels of their SCr ≤ 2.0 mg/dL (PYR‐205 Study 2007; PYR‐206 Study 2007) and 2.1 to 3.5 mg/dL in PYR‐207 Study 2007. Wotherspoon 2008 defined DKD as an ACR > 2.5 mg/mmol in men and > 3.5 mg/mmol in women in a minimum of two of three early morning urine samples taken on separate days over a period of three months.
Three studies (Agha 2009; Alkhalaf 2010; Lewis 2012) mentioned inclusion of only type 2 diabetes patients, four studies (DIVINe Study 2010; PYR‐205 Study 2007; PYR‐206 Study 2007; PYR‐207 Study 2007) included both type 1 and type 2 diabetes patients, and Wotherspoon 2008 included only patients with type 1 diabetes.
Exclusion criteria
Exclusion criteria among the included studies consisted of followings: significant diseases such as advance stage of kidney disease like ESKD; patients on dialysis or imminently expected to require dialysis; kidney insufficiency; kidney impairment by causes other than diabetes; other known kidney disease that may impact on progression rate such as renal artery stenosis or glomerular kidney disease such as membranous nephropathy; liver or kidney disorders; pregnant or lactating women; women of childbearing potential unwilling to practice a form of birth control for the duration of the study, in all of the included studies. Two studies (Alkhalaf 2010; DIVINe Study 2010) also excluded patients with cancer and another two studies (Alkhalaf 2010; Rabbani 2009) excluded patients with hypersensitivity to thiamine.
Co‐morbidities and co‐medications
Five studies (Alkhalaf 2010; Lewis 2012; PYR‐205 Study 2007; PYR‐206 Study 2007; PYR‐207 Study 2007) included patients with stable doses of ACEi or ARB or both in an unchanged dose for at least three months with DKD. In addition, DIVINe Study 2010 mentioned the use of antihypertensives, antiplatelets, antihyperglycaemic drugs in baseline as co‐medications. Rabbani 2009 also mentioned use of insulin, hypoglycaemic agents (sulphonylureas, metformin, thiazolidinedione), antihypertensive drugs, cholesterol lowering drugs among the participants.
Interventions and comparisons
Eight studies (Agha 2009; Alkhalaf 2010; Lewis 2012; Rabbani 2009; PYR‐205 Study 2007; PYR‐206 Study 2007; PYR‐207 Study 2007; Wotherspoon 2008) compared monotherapy of vitamin B preparations with placebo or active control. All interventions and controls were given orally.
Benfotiamine: 900 mg/d (300 mg three times/d) versus placebo (once daily) (Alkhalaf 2010)
Folic acid: 5 mg (once daily) versus placebo (Wotherspoon 2008)
Pyridoxamine: 100 mg/d (50 mg twice daily) versus placebo (PYR‐206 Study 2007).
Pyridoxamine: 300 mg/d, (150 mg twice daily) versus placebo (Lewis 2012)
Pyridoxamine: 500 mg/d (250 mg twice daily) versus placebo in two clinical studies (PYR‐205 Study 2007; PYR‐207 Study 2007)
Pyridoxamine: 600 mg/d (300 mg twice daily) versus placebo (twice daily) (Lewis 2012)
Thiamine: 300 mg/d, (three 100 mg capsules of thiamine) versus placebo (once daily) (Rabbani 2009)
Vitamin B12: 500 µg/d (once daily) versus losartan 50 mg/d (once daily) (Agha 2009)
One study compared oral combined vitamin B therapy with placebo
Vitamin B tablets containing 2.5 mg of folic acid, 25 mg of vitamin B6, and 1 mg vitamin B12 (once daily) versus matching placebo (DIVINe Study 2010)
None of the studies disclosed the contents of the placebo.
Reported outcomes
Three studies (Agha 2009; Alkhalaf 2010; Rabbani 2009) measured change from baseline in UAE as a primary outcome while DIVINe Study 2010 considered it under secondary outcomes. Change from baseline in SCr was a primary outcome in four studies (Lewis 2012; PYR‐205 Study 2007; PYR‐206 Study 2007; PYR‐207 Study 2007). In addition, Alkhalaf 2010 also measured Kidney Injury Molecule‐1 as a primary outcome. Secondary outcomes in Alkhalaf 2010 were change in urinary excretion of B2 microglobulin, macrophage inhibiting factors, and other AGE products. DIVINe Study 2010 assessed kidney outcomes such as CrCl and progression to dialysis; vascular events such as stroke and death, and decline in cognitive function. Rabbani 2009 measured plasma cholesterol profile as a secondary outcome. None of the studies reported quality of life or cost as outcomes. Wotherspoon 2008 assessed plasma homocysteine, forearm blood flow, total antioxidant status, and whole blood glutathione.
Baseline characteristics
All the studies reported basic demographic, biochemical and clinical parameters compared at baseline. The number of patients ranged from 40 to 361 patients. Six studies (Alkhalaf 2010; DIVINe Study 2010; Lewis 2012; PYR‐205 Study 2007; PYR‐206 Study 2007; PYR‐207 Study 2007) had higher proportion of male participants compared to female, while Agha 2009 and Rabbani 2009 had roughly equal proportions of male and female participants. DIVINe Study 2010 included the patients with median duration of microalbuminuria of two years (interquartile range (IQR) = 3 years), while Lewis 2012 included the patients with mean duration of DKD of approximately five years. DIVINe Study 2010 had the highest UAE (maximum median 900 (IQR = 150) mg/24 h) in control group. Three studies (Agha 2009; Alkhalaf 2010; Rabbani 2009) included significantly higher proportion of patients with microalbuminuria.
Excluded studies
We excluded a total of 45 RCTs that did not assess the intervention in the population of our interest for the review. These studies included participants with established ESKD. Four studies were not randomised, and one study (Spoelstra 2004) was excluded as it assessed the effects of folic acid in patients with diabetes not having DKD.
Risk of bias in included studies
2.
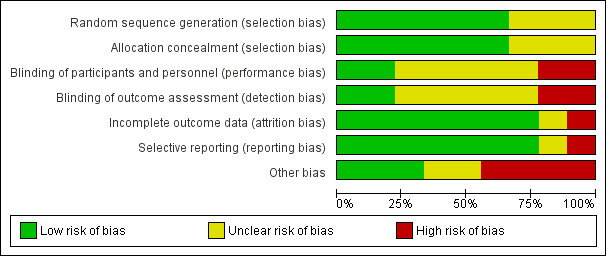
Risk of bias graph: review authors' judgements about each risk of bias item presented as percentages across all included studies.
3.
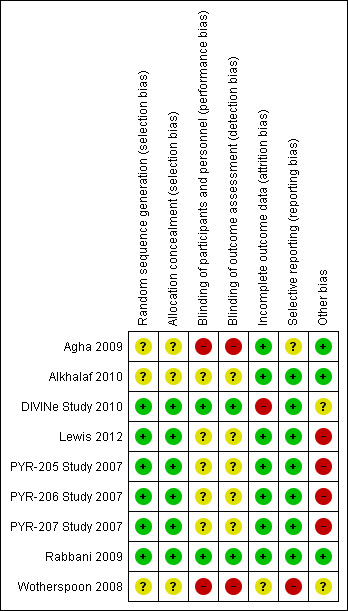
Risk of bias summary: review authors' judgements about each risk of bias item for each included study.
Interrater agreement for the key quality indicators such as randomisation, concealment of allocation and blinding was complete with no full publication needing to be discussed with a third author.
Allocation
Six studies (DIVINe Study 2010; Lewis 2012; Rabbani 2009; PYR‐205 Study 2007; PYR‐206 Study 2007; PYR‐207 Study 2007) were at low risk of selection bias related to random sequence generation and allocation concealment as participant allocation was conducted remotely or used sealed opaque envelopes. Three studies (Agha 2009; Alkhalaf 2010; Wotherspoon 2008) were unclear with respect to the risk of selection bias related to sequence generation and allocation, as the methods used were not clearly described.
Blinding
Agha 2009 was single blind study with high risk of detection or performance bias while other included studies were double blind studies. DIVINe Study 2010, Lewis 2012; and Rabbani 2009 were at low risk for performance bias provided the blinding condition at patient, caregiver and observer level with blinding of serum vitamin level in follow‐up. DIVINe Study 2010 was at low risk of performance and detection bias while five studies (Alkhalaf 2010; PYR‐205 Study 2007; PYR‐206 Study 2007; PYR‐207 Study 2007; Wotherspoon 2008) were judged as having unclear risk for performance bias and detection bias related to blinding, as the method used was not clearly described and did not report checking of blinding conditions. It was not confirmed whether any precaution was taken for blinding lab data of vitamin status (thiamine level) in the follow‐up and endpoint evaluation in those published clinical study reports.
Incomplete outcome data
DIVINe Study 2010 had a high risk of attrition bias. For clinical outcomes such as mortality, intention‐to‐treat analysis with 94% of randomised participant was utilised. A total of 87%, 81%, 68% and 47% of randomised participants were available for assessing biochemical outcomes at the end of 12, 18, 24 and 36 months respectively. DIVINe Study 2010 used multiple imputation techniques for missing variables. There was insufficient information available for Wotherspoon 2008 (unclear risk of bias) and all other studies were judged to be at low risk of bias.
Selective reporting
Seven studies had low risk of reporting bias based on comparison of reported outcomes in the protocol and final publication. The protocols were not available for two studies (Agha 2009; Wotherspoon 2008).
Publication and small study bias
No clear interpretation of the funnel plot was possible because of relatively small number of included studies.
Other potential sources of bias
Four studies funded by pharmaceutical companies were judged to be at high risk bias, three were at low risk of bias, and two were unclear.
Effects of interventions
We presented summary of results for reported outcomes of the available studies. Wotherspoon 2008 did not assess any of the outcomes prespecified in review.
Vitamin B versus placebo
Seven studies (Agha 2009; Alkhalaf 2010; Lewis 2012; PYR‐205 Study 2007; PYR‐206 Study 2007; PYR‐207 Study 2007; Rabbani 2009) compared monotherapy versus placebo or active treatment. Three studies (PYR‐205 Study 2007; PYR‐206 Study 2007; PYR‐207 Study 2007) presented the results of those studies in a single publication with combining data from two phase studies and a separate abstract for one study. The authors combined the data from individual studies to increase the sample size.
Primary outcomes
All‐cause mortality
Five studies reported all‐cause mortality (DIVINe Study 2010; Lewis 2012; PYR‐205 Study 2007; PYR‐206 Study 2007; PYR‐207 Study 2007)
Four studies (Lewis 2012; PYR‐205 Study 2007; PYR‐206 Study 2007; PYR‐207 Study 2007) reported all‐cause mortality with different doses of pyridoxamine monotherapy. There was no significant difference in risk of mortality with use of any dose or duration of pyridoxamine compared to placebo (Analysis 1.1) (100 mg/d for 6 months (1 study, 128 participants): RR 2.91, 95% CI 012 to 70.10; 300 mg/d for 12 months (1 study, 202 participants): RR 2.60, 95% CI 0.522 to 13.10; 500 mg/d for 5 months (1 study, 84 participants): RR 3.38, 95% CI 0.18 to 63.2; 600 mg/d for 12 months (1 study, 208 participants): RR 0.49, 95% CI 0.05 to 5.33).
1.1. Analysis.
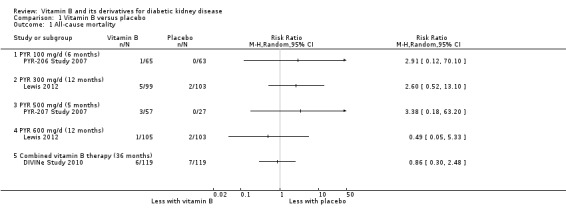
Comparison 1 Vitamin B versus placebo, Outcome 1 All‐cause mortality.
DIVINe Study 2010 reported no significant difference in all‐cause mortality with the use of combined therapy versus placebo for three years (1 study; 238 participants: RR 0.86, 95% CI 0.30 to 2.48).
Cardiovascular mortality
No study reported cardiovascular mortality.
Secondary outcomes
Creatinine clearance
Six studies (Alkhalaf 2010; DIVINe Study 2010; Lewis 2012; PYR‐205 Study 2007; PYR‐206 Study 2007; PYR‐207 Study 2007) measured CrCl, however data were only available from Alkhalaf 2010.
Alkhalaf 2010 reported no significant difference in CrCl at the end of three months between benfotiamine and placebo (Analysis 1.2 (1 study, 82 participants): MD 2.00 mL/min, 95% CI ‐21.78 to 25.78).
1.2. Analysis.
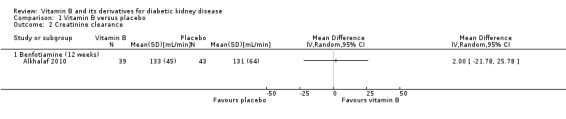
Comparison 1 Vitamin B versus placebo, Outcome 2 Creatinine clearance.
Four studies (Lewis 2012; PYR‐205 Study 2007; PYR‐206 Study 2007; PYR‐207 Study 2007) reported no significant effects of pyridoxamine on improving CrCl compared to placebo.
DIVINe Study 2010 reported no significant difference in CrCl with combined vitamin B therapy compared to placebo.
Serum creatinine
Seven studies measured SCr (Alkhalaf 2010; DIVINe Study 2010; Lewis 2012; PYR‐205 Study 2007; PYR‐206 Study 2007; PYR‐207 Study 2007; Rabbani 2009), however DIVINe Study 2010 and Rabbani 2009 did not report their results.
Alkhalaf 2010 reported no difference in SCr following three months of benfotiamine compared to placebo (Analysis 1.3.1 (82 participants): MD 1.00 µmol/L, 95% CI ‐7.88 to 9.88). Lewis 2012 reported no significant change in SCr with either 300 mg/d (Analysis 1.3.2 (150 participants): MD 5.33 µmol/L, 95% CI ‐6.02 to 16.68) or 600 mg (Analysis 1.3.3 (157 participants): MD 0.02 µmol/L, 95% CI ‐11.05 to 11.09) pyridoxamine for 12 months. PYR‐205 Study 2007, PYR‐206 Study 2007 and PYR‐207 Study 2007 did not find any significant change in the SCr in the pooled estimate from all their studies (Analysis 1.3.4 (212 participants): MD ‐8.84 µmol/L, 95% CI ‐20.21 to 2.53).
1.3. Analysis.
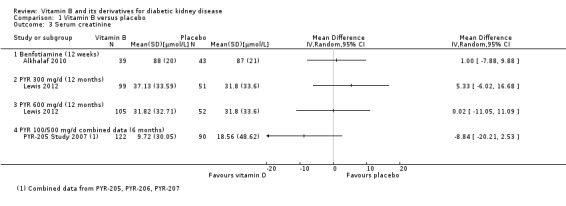
Comparison 1 Vitamin B versus placebo, Outcome 3 Serum creatinine.
Proteinuria
Five studies (DIVINe Study 2010; Lewis 2012; PYR‐205 Study 2007; PYR‐206 Study 2007; PYR‐207 Study 2007) measured proteinuria, however, only two studies provided data (DIVINe Study 2010; Lewis 2012).
DIVINe Study 2010 reported no significant difference in the level of proteinuria after three years of combined vitamin B therapy compared to placebo (Analysis 1.4.1 (118 participants): MD: 0.05 g/24 h, 95% CI ‐0.39 to 0.49). Lewis 2012 reported no significant difference in proteinuria with pyridoxamine 300 mg/d (Analysis 1.4.2 (202 participants): MD ‐0.00 g/24 h, 95% CI ‐0.04 to 0.05); however there was a significant decrease in proteinuria in the 600 mg/d pyridoxamine group compared to placebo (Analysis 1.4.3 (208 participants): MD: ‐0.30 g/dL, 95% CI ‐0.34 to 0.25).
1.4. Analysis.
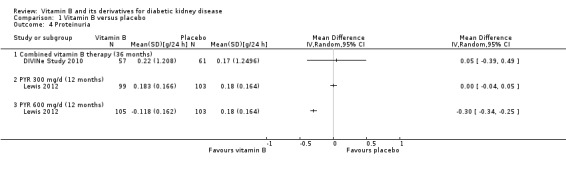
Comparison 1 Vitamin B versus placebo, Outcome 4 Proteinuria.
Urinary albumin excretion
Seven studies (Alkhalaf 2010; DIVINe Study 2010; Lewis 2012; PYR‐205 Study 2007; PYR‐206 Study 2007; PYR‐207 Study 2007; Rabbani 2009) measured UAE. None of the studies reported the data that could be meta‐analysed.
Rabbani 2009 reported a significant median reduction in UAE with thiamine treatment compared to placebo. The remaining studies did not find a significant reduction in UAE with either pyridoxamine, benfotiamine, or combined vitamin B therapy.
Glomerular filtration rate
Seven studies measured GFR (Alkhalaf 2010; DIVINe Study 2010; Lewis 2012; PYR‐205 Study 2007; PYR‐206 Study 2007; PYR‐207 Study 2007; Rabbani 2009), however Alkhalaf 2010, PYR‐205 Study 2007, PYR‐206 Study 2007 and PYR‐207 Study 2007 did not report their results.
DIVINe Study 2010 reported a significant reduction in GFR with combined vitamin B therapy compared to placebo (Analysis 1.5.1: MD ‐5.80 mL/min/1.73 m², 95% CI ‐10.51 to ‐1.10). Lewis 2012 reported no significant change in GFR with pyridoxamine (MD 0.36 mL/min/1.73 m², 95% CI ‐5.25 to 5.97), and Rabbani 2009 found no significant change in GFR with thiamine (MD 0.31 mL/min, 95% CI ‐4.51 to 5.13) when compared to placebo.
1.5. Analysis.
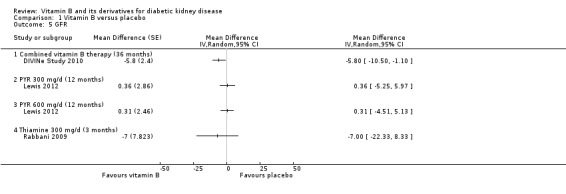
Comparison 1 Vitamin B versus placebo, Outcome 5 GFR.
Number of patients required dialysis
DIVINe Study 2010 reported no significant change in the risk of dialysis requirement with combined vitamin B therapy (Analysis 1.6 (238 participants): RR 1.00, 95% CI 0.43 to 2.31) compared to placebo.
1.6. Analysis.
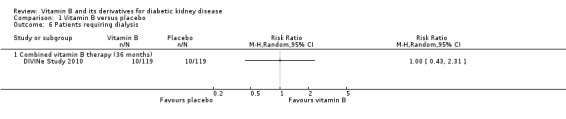
Comparison 1 Vitamin B versus placebo, Outcome 6 Patients requiring dialysis.
Blood pressure
Six studies (Alkhalaf 2010; DIVINe Study 2010; PYR‐205 Study 2007; PYR‐206 Study 2007; PYR‐207 Study 2007; Rabbani 2009) measured blood pressure as an outcome, however data were not presented for three studies (PYR‐205 Study 2007; PYR‐206 Study 2007; PYR‐207 Study 2007).
Alkhalaf 2010 reported no significant difference SBP after 12 weeks of treatment with benfotiamine (Analysis 1.7.1 (82 participants): MD 3.00 mm Hg, 95% CI ‐4.37 to 10.37). DIVINe Study 2010 reported no significant change in the SBP with combined vitamin B therapy for 36 months (Analysis 1.7.2 (118 participants): MD 2.30 mm Hg, 95% CI ‐3.70 to 8.30) compared to placebo. Rabbani 2009 reported no change in SBP with thiamine given for 12 weeks (Analysis 1.7.3 (40 participants): MD 3.00 mm Hg, 95% CI ‐8.50 to 14.50) compared to placebo.
1.7. Analysis.
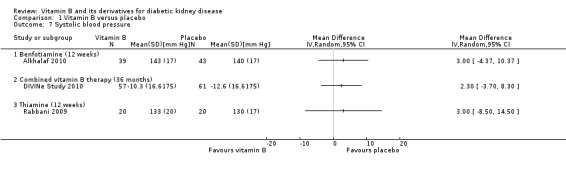
Comparison 1 Vitamin B versus placebo, Outcome 7 Systolic blood pressure.
Alkhalaf 2010 reported no significant change in DBP after 12 weeks of treatment with benfotiamine (Analysis 1.8.1 (82 participants): MD: 0.00, 95% CI ‐4.11 to 4.11). DIVINe Study 2010 reported no significant change in the DBP with combined vitamin B therapy for 36 months (Analysis 1.8 (118 participants): MD 1.50, 95% CI ‐1.60 to 4.60) compared to placebo. Rabbani 2009 reported no change in DBP with thiamine for 12 weeks (Analysis 1.8.3 (40 participants): MD 1.00, 95% CI ‐4.28 to 6.28).
1.8. Analysis.
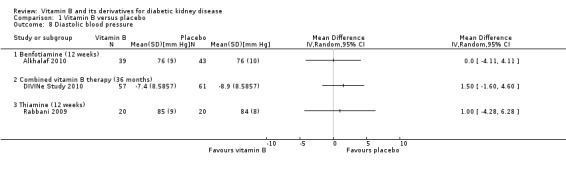
Comparison 1 Vitamin B versus placebo, Outcome 8 Diastolic blood pressure.
Adverse events
Studies of less than six months duration did not explicitly report adverse events. They all reported that the drugs were well‐tolerated without any serious drug related adverse events.
Five studies (DIVINe Study 2010; Lewis 2012; PYR‐205 Study 2007; PYR‐206 Study 2007; PYR‐207 Study 2007) reported the adverse event profile in detail. DIVINe Study 2010 reported a total of 1060 adverse events (535 in the placebo group and 525 in the B vitamin group); these included many transient minor complaints, such as dizziness, nausea, or headache. Lewis 2012 reported 49 (46.7%) severe adverse events in the placebo group, 41 (39.4%) occurred in the pyridoxamine 150 group, and 42 (40%) occurred in the pyridoxamine 300 mg group. Data for two separate studies of pyridoxamine 500 mg/d and placebo were combined and compared by the authors (PYR‐205 Study 2007; PYR‐207 Study 2007); we combined the 300 mg/d and 600 mg/d data from Lewis 2012. No study reported significant differences in adverse events or in any serious or severe adverse events between vitamin B treatments and placebo (Analysis 1.9).
1.9. Analysis.
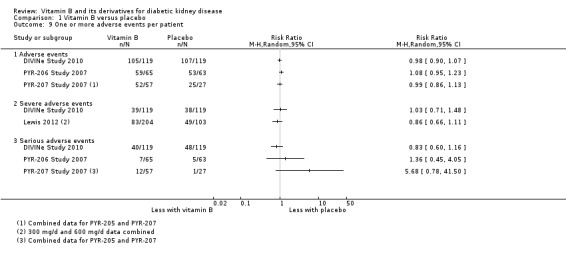
Comparison 1 Vitamin B versus placebo, Outcome 9 One or more adverse events per patient.
Vitamin B versus other substances
Agha 2009 compared Vitamin B12 (mecobalamin) versus losartan (ARB; active control).
Primary outcomes
All‐cause mortality and cardiovascular morality were not reported.
Secondary outcomes
Serum creatinine
Agha 2009 reported no significant difference in SCr levels between the vitamin B12 and losartan groups (Analysis 2.1 (261 participants): MD 0.00 mg/dL, 95% CI ‐0.09 to 0.09).
2.1. Analysis.
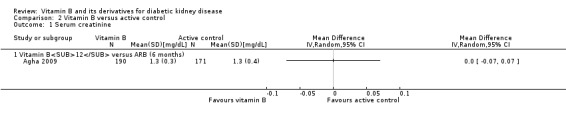
Comparison 2 Vitamin B versus active control, Outcome 1 Serum creatinine.
Urinary albumin excretion
Agha 2009 reported no significant difference in UAE levels between the vitamin B12 and losartan groups (Analysis 2.2 (261 participants): MD 56.40 mg/dL, 95% CI 52.61 to 60.19).
2.2. Analysis.
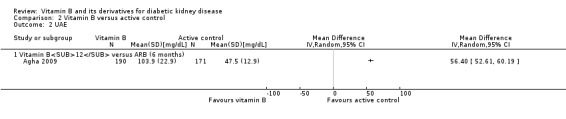
Comparison 2 Vitamin B versus active control, Outcome 2 UAE.
Blood pressure
Agha 2009 reported a significant increase in SBP in the vitamin B12 group (Analysis 2.3 (261 participants): MD 3.00 mm Hg, 95% CI 0.63 to 5.37).
2.3. Analysis.
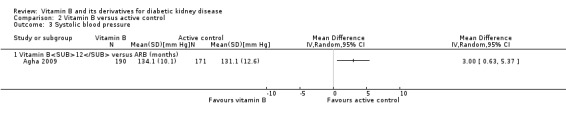
Comparison 2 Vitamin B versus active control, Outcome 3 Systolic blood pressure.
Agha 2009 reported a significant increase in DBP in the vitamin B12 group (Analysis 2.4 (261 participants): MD 2.70 mm Hg, 95% CI 0.29 to 5.11).
2.4. Analysis.
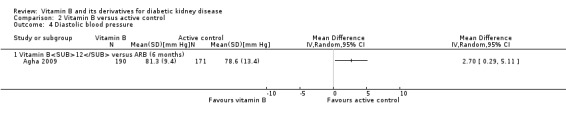
Comparison 2 Vitamin B versus active control, Outcome 4 Diastolic blood pressure.
Other outcomes
None of the included studies reported the following outcomes: progression from macroalbuminuria to ESKD, progression from microalbuminuria to macroalbuminuria, regression from microalbuminuria to normoalbuminuria, doubling of SCr, and quality of life. We were not able to perform subgroup or sensitivity analyses or assess publication bias due to insufficient data.
Discussion
Summary of main results
The review aimed to assess the effects of vitamin B therapy on various clinical and biochemical outcomes in patients with DKD. Nine studies (2560 participants) meet our inclusion criteria. Eight studies (Agha 2009; Alkhalaf 2010; Lewis 2012; PYR‐205 Study 2007; PYR‐206 Study 2007; PYR‐207 Study 2007; Rabbani 2009) assessed vitamin B or its derivatives versus placebo in patients with DKD (benfotiamine (300 mg/d), thiamine (300 mg/d), vitamin B12 (500 mg/d), pyridoxamine (100 mg/d, 300 mg/d, 600 mg/d), folic acid (5 mg/d)); one study (Agha 2009) compared vitamin B with an active control (vitamin B12 versus losartan); and one study (DIVINe Study 2010) compared combined vitamin B therapy (folic acid: 2.5 mg; vitamin B6: 25 mg; vitamin B12: 1 mg) with placebo. Treatment duration ranged from two to 36 months.
We found that there was no difference in the risk of all‐cause of mortality with pyridoxamine at doses of 100 mg/d, 300 mg/d, 500 mg/d, or 600 mg/d dose for five to 12 months of treatment compared to placebo (PYR‐205 Study 2007; PYR‐206 Study 2007; PYR‐207 Study 2007). None of the derivatives improved kidney functions such as increase in CrCl or GFR. Only one study reported improvement in UAE with thiamine (Rabbani 2009). None of the included studies reported outcomes such cardiovascular mortality, progression from macroalbuminuria to ESKD, progression from microalbuminuria to macroalbuminuria, regression from microalbuminuria to normoalbuminuria, number of patients requiring dialysis, quality of life parameters and cost.
DIVINe Study 2010 reported no significant difference in the risk of mortality with combined vitamin B therapy; conversely, the authors reported an increase in risk of MI, stroke, revascularization, and all‐cause mortality, in the B vitamin group after adjusting for baseline risk factors including peripheral vascular disease. Further, DIVINe Study 2010 reported a reduction in GFR following the use of vitamin B therapy. The combined vitamin B therapy neither significantly increased CrCl nor decreased the level of UAE. In addition, there were no additional benefits in reducing the risk of dialysis requirement with the combined vitamin B therapy. There was no significant difference between combined vitamin B group and placebo for adverse events. DIVINe Study 2010 did not report outcomes such as progression from macroalbuminuria to ESKD, progression from microalbuminuria to macroalbuminuria, regression from microalbuminuria to normoalbuminuria, CrCl, doubling of SCr, SCr, SBP, DBP, quality of life, and cost.
Overall completeness and applicability of evidence
The number of patients per study ranged from 16 to 361 and the age range was 40 to 75 years. We found different populations across studies, i.e. studies performed in Asian settings included higher proportion of patients with microalbuminuria while two studies only enrolled patients with macroalbuminuria. There was a significant difference in baseline SBP, DBP, and cholesterol levels among the studies. These risk factors were different among studies for diabetic complications however they did not differ within studies. The definition of microalbuminuria varied across studies. We were unable to perform the sensitivity analysis for diagnosis or severity of DKD due to the limited number of studies identified. Despite this limitation, results across the studies were consistent for any of the clinical or biochemical outcomes. We did not find any data on outcome measurements such as time to ESKD, and only limited data on all‐cause mortality. The reason may be such outcomes are difficult to implement on a practical basis. However, the considering slow disease progression of DKD, it would be difficult to extrapolate results of short duration changes on long‐term clinical outcomes. A systematic review found that increase in GFR and reduction in albuminuria were associated with lower mortality in advance kidney disease (Berhane 2011). We found that only one study with thiamine improved the albuminuria level compared to placebo. The remaining eight studies showed no improvement in GFR and albuminuria.
In the included studies, one of the major sources which would vary the actual amount of vitamin B intake is the dietary sources of vitamin B. Vitamin B can be obtained through various dietary sources, fortified foods etc. Majority of the studies did not ask the participants to change their diet habits in both of the group in individual studies. There is a high likelihood that the dietary source of vitamin B would be different among studies as dietary food habits across the countries vary widely. Asian, American, Canadian and European people have different food habits. In addition, food fortification programme has been implemented in the US and Canada. Hence, the participants for these countries may have higher level of vitamins.
Ethnicity/race is an important determinant of folate status under conditions of strictly controlled dietary folate intake (Perry 2004). Due to limited number of the studies, we were not able to perform subgroup analysis for a priori ethnicity subgroup. Other source of vitamin B and racial variation should be taken into consideration while designing future studies. One of the way to handle this confounding issue is to baseline monitoring of these vitamin B derivatives. In addition, urinary excretion of thiamine > 0.20 µmol/24 h indicates adequate dietary thiamine for adults (Finglas 1993). So, the level of such markers of adequate dietary thiamine sufficiency could serve as control parameter for dietary intake. The level of this vitamin at baseline would be an important criterion to consider for inclusion.
Quality of the evidence
Minimising the risk of bias is of major importance for a good quality systematic review. In this review, we therefore restricted the meta‐analysis to RCTs, ideally with proper randomisation, allocation concealment, blinding and freedom from selective reporting. However, not all the studies fulfilled this criteria. Three studies (Agha 2009; Alkhalaf 2010; Wotherspoon 2008) did not clearly report the methods used for sequence generation and allocation (selection bias) and were judge to have unclear risk of bias. The remaining six studies were at low risk of selection bias (DIVINe Study 2010; Lewis 2012; PYR‐205 Study 2007; PYR‐206 Study 2007; PYR‐207 Study 2007; Rabbani 2009). Two studies (DIVINe Study 2010; Rabbani 2009) reported blinding of patient, caregiver and observer and were at low risk of performance and detection bias. Two studies were at high risk of performance and detection bias (Agha 2009; Wotherspoon 2008) and the other five studies had unclear risk of performance bias and detection bias (Alkhalaf 2010; Lewis 2012; PYR‐205 Study 2007; PYR‐206 Study 2007; PYR‐207 Study 2007). Attrition bias was high in one study (DIVINe Study 2010), unclear in one study (Wotherspoon 2008) and low in seven studies (Agha 2009; Alkhalaf 2010; Lewis 2012; PYR‐205 Study 2007; PYR‐206 Study 2007; PYR‐207 Study 2007; Rabbani 2009). Reporting bias was high in one study (Wotherspoon 2008), unclear in one study (Agha 2009) and low in the remaining seven studies (Alkhalaf 2010; DIVINe Study 2010; Lewis 2012; PYR‐205 Study 2007; PYR‐206 Study 2007; PYR‐207 Study 2007; Rabbani 2009). Four studies funded by pharmaceutical companies were judged to be at high risk bias (Lewis 2012; PYR‐205 Study 2007; PYR‐206 Study 2007; PYR‐207 Study 2007), three were at low risk of bias (Agha 2009; Alkhalaf 2010; Rabbani 2009), and two were unclear (DIVINe Study 2010; Wotherspoon 2008).
Potential biases in the review process
We found many large scale studies performed in diabetic patients especially the HOPE‐2 Study 2006, and there may be a significant proportion of patients with DKD. However, we had to exclude those studies to remove misclassification bias in the review. It has been demonstrated from observational studies that blood pressure control or blood glucose control also prevents or reverses microalbuminuria (ADVANCE 2008). None of the clinical studies addressed the issues of these underlying confounders.
Agreements and disagreements with other studies or reviews
As far as we could ascertain, this is the first systematic review investigating vitamin B therapy for DKD.
Authors' conclusions
Implications for practice.
Currently, there is an absence of evidence to recommend the use of vitamin B therapy alone or combination for delaying the progression of DKD. Thiamine was found to be beneficial in reduction in albuminuria in a single study; there was however a lack of any improvement in kidney functions, and blood pressure following the use of vitamin B preparations alone or in combination. These findings require further confirmation given the limitations of small number and poor quality of the available studies.
Implications for research.
There is a lack of evidence of short‐term or long‐term benefits of vitamin B compared to placebo or losartan on clinical and biochemical outcomes. There were several limitations of available evidence: small number of studies with poor design; the duration of treatment and the period of observation were too short in some of the studies to detect therapeutic changes; and confounding bias with the use of dietary or fortified sources of vitamin B. In addition, the doses of vitamin B were higher than the recommended daily allowance in all included studies (recommended daily allowance: thiamine (1 mg/d), folate (400 μg/d), vitamin B12 (2.4 μg/d)). It is not known whether the adequate dose for treatment approximates or is higher than the recommended daily allowance for specific types of vitamin B. Experimental studies showed that a high dose of vitamin B therapy may delay the progression of kidney impairment. Hence, there is a need for selection of optimum dosage regimens of different vitamin B preparation for delaying progression of kidney impairment in patients. In future, high quality RCTs are needed to establish efficacy and safety profile of vitamin B therapy especially treatment used in addition to the first line treatment. Studies should specify the rationale for selecting a particular vitamin B derivative and dose combinations for different stages of DKD.
What's new
| Date | Event | Description |
|---|---|---|
| 21 January 2015 | Amended | Minor amendment to study references |
Acknowledgements
We would like to thank Prof. George Kelly, Director of Meta‐analytical Group, School of Public Health, West Virginia University for his invaluable suggestions for the review. We would also like to thank the Cochrane Renal Group and members of the Editorial Board for their help in developing this review. We are also grateful to the referees for their time and suggestions.
Appendices
Appendix 1. Electronic search strategies
| Database | Search terms |
| CENTRAL |
|
| MEDLINE (OVID) |
|
| EMBASE (OVID) |
|
Appendix 2. Risk of bias assessment tool
| Potential source of bias | Assessment criteria |
|
Random sequence generation Selection bias (biased allocation to interventions) due to inadequate generation of a randomised sequence |
Low risk of bias: Random number table; computer random number generator; coin tossing; shuffling cards or envelopes; throwing dice; drawing of lots; minimization (minimization may be implemented without a random element, and this is considered to be equivalent to being random). |
| High risk of bias: Sequence generated by odd or even date of birth; date (or day) of admission; sequence generated by hospital or clinic record number; allocation by judgement of the clinician; by preference of the participant; based on the results of a laboratory test or a series of tests; by availability of the intervention. | |
| Unclear: Insufficient information about the sequence generation process to permit judgement. | |
|
Allocation concealment Selection bias (biased allocation to interventions) due to inadequate concealment of allocations prior to assignment |
Low risk of bias: Randomisation method described that would not allow investigator/participant to know or influence intervention group before eligible participant entered in the study (e.g. central allocation, including telephone, web‐based, and pharmacy‐controlled, randomisation; sequentially numbered drug containers of identical appearance; sequentially numbered, opaque, sealed envelopes). |
| High risk of bias: Using an open random allocation schedule (e.g. a list of random numbers); assignment envelopes were used without appropriate safeguards (e.g. if envelopes were unsealed or non‐opaque or not sequentially numbered); alternation or rotation; date of birth; case record number; any other explicitly unconcealed procedure. | |
| Unclear: Randomisation stated but no information on method used is available. | |
|
Blinding of participants and personnel Performance bias due to knowledge of the allocated interventions by participants and personnel during the study |
Low risk of bias: No blinding or incomplete blinding, but the review authors judge that the outcome is not likely to be influenced by lack of blinding; blinding of participants and key study personnel ensured, and unlikely that the blinding could have been broken. |
| High risk of bias: No blinding or incomplete blinding, and the outcome is likely to be influenced by lack of blinding; blinding of key study participants and personnel attempted, but likely that the blinding could have been broken, and the outcome is likely to be influenced by lack of blinding. | |
| Unclear: Insufficient information to permit judgement | |
|
Blinding of outcome assessment Detection bias due to knowledge of the allocated interventions by outcome assessors. |
Low risk of bias: No blinding of outcome assessment, but the review authors judge that the outcome measurement is not likely to be influenced by lack of blinding; blinding of outcome assessment ensured, and unlikely that the blinding could have been broken. |
| High risk of bias: No blinding of outcome assessment, and the outcome measurement is likely to be influenced by lack of blinding; blinding of outcome assessment, but likely that the blinding could have been broken, and the outcome measurement is likely to be influenced by lack of blinding. | |
| Unclear: Insufficient information to permit judgement | |
|
Incomplete outcome data Attrition bias due to amount, nature or handling of incomplete outcome data. |
Low risk of bias: No missing outcome data; reasons for missing outcome data unlikely to be related to true outcome (for survival data, censoring unlikely to be introducing bias); missing outcome data balanced in numbers across intervention groups, with similar reasons for missing data across groups; for dichotomous outcome data, the proportion of missing outcomes compared with observed event risk not enough to have a clinically relevant impact on the intervention effect estimate; for continuous outcome data, plausible effect size (difference in means or standardized difference in means) among missing outcomes not enough to have a clinically relevant impact on observed effect size; missing data have been imputed using appropriate methods. |
| High risk of bias: Reason for missing outcome data likely to be related to true outcome, with either imbalance in numbers or reasons for missing data across intervention groups; for dichotomous outcome data, the proportion of missing outcomes compared with observed event risk enough to induce clinically relevant bias in intervention effect estimate; for continuous outcome data, plausible effect size (difference in means or standardized difference in means) among missing outcomes enough to induce clinically relevant bias in observed effect size; ‘as‐treated’ analysis done with substantial departure of the intervention received from that assigned at randomisation; potentially inappropriate application of simple imputation. | |
| Unclear: Insufficient information to permit judgement | |
|
Selective reporting Reporting bias due to selective outcome reporting |
Low risk of bias: The study protocol is available and all of the study’s pre‐specified (primary and secondary) outcomes that are of interest in the review have been reported in the pre‐specified way; the study protocol is not available but it is clear that the published reports include all expected outcomes, including those that were pre‐specified (convincing text of this nature may be uncommon). |
| High risk of bias: Not all of the study’s pre‐specified primary outcomes have been reported; one or more primary outcomes is reported using measurements, analysis methods or subsets of the data (e.g. subscales) that were not pre‐specified; one or more reported primary outcomes were not pre‐specified (unless clear justification for their reporting is provided, such as an unexpected adverse effect); one or more outcomes of interest in the review are reported incompletely so that they cannot be entered in a meta‐analysis; the study report fails to include results for a key outcome that would be expected to have been reported for such a study. | |
| Unclear: Insufficient information to permit judgement | |
|
Other bias Bias due to problems not covered elsewhere in the table |
Low risk of bias: The study appears to be free of other sources of bias. |
| High risk of bias: Had a potential source of bias related to the specific study design used; stopped early due to some data‐dependent process (including a formal‐stopping rule); had extreme baseline imbalance; has been claimed to have been fraudulent; had some other problem. | |
| Unclear: Insufficient information to assess whether an important risk of bias exists; insufficient rationale or evidence that an identified problem will introduce bias. |
Data and analyses
Comparison 1. Vitamin B versus placebo.
| Outcome or subgroup title | No. of studies | No. of participants | Statistical method | Effect size |
|---|---|---|---|---|
| 1 All‐cause mortality | 4 | Risk Ratio (M‐H, Random, 95% CI) | Totals not selected | |
| 1.1 PYR 100 mg/d (6 months) | 1 | Risk Ratio (M‐H, Random, 95% CI) | 0.0 [0.0, 0.0] | |
| 1.2 PYR 300 mg/d (12 months) | 1 | Risk Ratio (M‐H, Random, 95% CI) | 0.0 [0.0, 0.0] | |
| 1.3 PYR 500 mg/d (5 months) | 1 | Risk Ratio (M‐H, Random, 95% CI) | 0.0 [0.0, 0.0] | |
| 1.4 PYR 600 mg/d (12 months) | 1 | Risk Ratio (M‐H, Random, 95% CI) | 0.0 [0.0, 0.0] | |
| 1.5 Combined vitamin B therapy (36 months) | 1 | Risk Ratio (M‐H, Random, 95% CI) | 0.0 [0.0, 0.0] | |
| 2 Creatinine clearance | 1 | Mean Difference (IV, Random, 95% CI) | Totals not selected | |
| 2.1 Benfotiamine (12 weeks) | 1 | Mean Difference (IV, Random, 95% CI) | 0.0 [0.0, 0.0] | |
| 3 Serum creatinine | 3 | Mean Difference (IV, Random, 95% CI) | Totals not selected | |
| 3.1 Benfotiamine (12 weeks) | 1 | Mean Difference (IV, Random, 95% CI) | 0.0 [0.0, 0.0] | |
| 3.2 PYR 300 mg/d (12 months) | 1 | Mean Difference (IV, Random, 95% CI) | 0.0 [0.0, 0.0] | |
| 3.3 PYR 600 mg/d (12 months) | 1 | Mean Difference (IV, Random, 95% CI) | 0.0 [0.0, 0.0] | |
| 3.4 PYR 100/500 mg/d combined data (6 months) | 1 | Mean Difference (IV, Random, 95% CI) | 0.0 [0.0, 0.0] | |
| 4 Proteinuria | 2 | Mean Difference (IV, Random, 95% CI) | Totals not selected | |
| 4.1 Combined vitamin B therapy (36 months) | 1 | Mean Difference (IV, Random, 95% CI) | 0.0 [0.0, 0.0] | |
| 4.2 PYR 300 mg/d (12 months) | 1 | Mean Difference (IV, Random, 95% CI) | 0.0 [0.0, 0.0] | |
| 4.3 PYR 600 mg/d (12 months) | 1 | Mean Difference (IV, Random, 95% CI) | 0.0 [0.0, 0.0] | |
| 5 GFR | 3 | Mean Difference (Random, 95% CI) | Totals not selected | |
| 5.1 Combined vitamin B therapy (36 months) | 1 | Mean Difference (Random, 95% CI) | 0.0 [0.0, 0.0] | |
| 5.2 PYR 300 mg/d (12 months) | 1 | Mean Difference (Random, 95% CI) | 0.0 [0.0, 0.0] | |
| 5.3 PYR 600 mg/d (12 months) | 1 | Mean Difference (Random, 95% CI) | 0.0 [0.0, 0.0] | |
| 5.4 Thiamine 300 mg/d (3 months) | 1 | Mean Difference (Random, 95% CI) | 0.0 [0.0, 0.0] | |
| 6 Patients requiring dialysis | 1 | Risk Ratio (M‐H, Random, 95% CI) | Totals not selected | |
| 6.1 Combined vitamin B therapy (36 months) | 1 | Risk Ratio (M‐H, Random, 95% CI) | 0.0 [0.0, 0.0] | |
| 7 Systolic blood pressure | 3 | Mean Difference (IV, Random, 95% CI) | Totals not selected | |
| 7.1 Benfotiamine (12 weeks) | 1 | Mean Difference (IV, Random, 95% CI) | 0.0 [0.0, 0.0] | |
| 7.2 Combined vitamin B therapy (36 months) | 1 | Mean Difference (IV, Random, 95% CI) | 0.0 [0.0, 0.0] | |
| 7.3 Thiamine (12 weeks) | 1 | Mean Difference (IV, Random, 95% CI) | 0.0 [0.0, 0.0] | |
| 8 Diastolic blood pressure | 3 | Mean Difference (IV, Random, 95% CI) | Totals not selected | |
| 8.1 Benfotiamine (12 weeks) | 1 | Mean Difference (IV, Random, 95% CI) | 0.0 [0.0, 0.0] | |
| 8.2 Combined vitamin B therapy (36 months) | 1 | Mean Difference (IV, Random, 95% CI) | 0.0 [0.0, 0.0] | |
| 8.3 Thiamine (12 weeks) | 1 | Mean Difference (IV, Random, 95% CI) | 0.0 [0.0, 0.0] | |
| 9 One or more adverse events per patient | 4 | Risk Ratio (M‐H, Random, 95% CI) | Totals not selected | |
| 9.1 Adverse events | 3 | Risk Ratio (M‐H, Random, 95% CI) | 0.0 [0.0, 0.0] | |
| 9.2 Severe adverse events | 2 | Risk Ratio (M‐H, Random, 95% CI) | 0.0 [0.0, 0.0] | |
| 9.3 Serious adverse events | 3 | Risk Ratio (M‐H, Random, 95% CI) | 0.0 [0.0, 0.0] | |
| 10 Urinary albumin excretion [mg/24 h] | Other data | No numeric data | ||
| 11 Serum creatinine [mg/dL] | Other data | No numeric data | ||
| 12 Creatinine clearance [mL/min] | Other data | No numeric data |
1.10. Analysis.
Comparison 1 Vitamin B versus placebo, Outcome 10 Urinary albumin excretion [mg/24 h].
| Urinary albumin excretion [mg/24 h] | |||||
|---|---|---|---|---|---|
| Study |
Thiamine Baseline; median (minimum–maximum) |
Placebo Baseline; median (minimum–maximum) |
Thiamine End‐point; median (minimum‐maximum) |
Placebo End‐point; median (minimum‐maximum) |
p‐value; change from baseline |
| Rabbani 2009 | 43.7 (33.0–120.9) | 43.7 (33.0–120.9) | 30.1 (12.0–38.2) | 35.5 (6.4–82.0) | p < 0.01 |
1.11. Analysis.
Comparison 1 Vitamin B versus placebo, Outcome 11 Serum creatinine [mg/dL].
| Serum creatinine [mg/dL] | |||||
|---|---|---|---|---|---|
| Study |
Pyridoxamine 100 mg Baseline; mean (SD) |
Placebo Baseline; mean (SD) |
Pyridoxamine 100 mg End‐point; rate of rise/y |
Placebo End‐point; rate of rise/y |
p‐value |
| PYR‐206 Study 2007 | 1.27 (0.35) | 1.33 (0.37) | 0.178 | 0.223 | |
1.12. Analysis.
Comparison 1 Vitamin B versus placebo, Outcome 12 Creatinine clearance [mL/min].
| Creatinine clearance [mL/min] | |||||
|---|---|---|---|---|---|
| Study |
Pyridoxamine 100 mg Baseline; mean (SD) |
Placebo Baseline; mean (SD) |
Pyridoxamine 100 mg End‐point; rate of decrease/y |
Placebo End‐point; rate of decrease/yr |
p‐value |
| PYR‐206 Study 2007 | 99.9 (47) | 104.2 (60) | 17 | 31 | p < 0.0001 |
Comparison 2. Vitamin B versus active control.
| Outcome or subgroup title | No. of studies | No. of participants | Statistical method | Effect size |
|---|---|---|---|---|
| 1 Serum creatinine | 1 | Mean Difference (IV, Random, 95% CI) | Totals not selected | |
| 1.1 Vitamin B12 versus ARB (6 months) | 1 | Mean Difference (IV, Random, 95% CI) | 0.0 [0.0, 0.0] | |
| 2 UAE | 1 | Mean Difference (IV, Random, 95% CI) | Totals not selected | |
| 2.1 Vitamin B12 versus ARB (6 months) | 1 | Mean Difference (IV, Random, 95% CI) | 0.0 [0.0, 0.0] | |
| 3 Systolic blood pressure | 1 | Mean Difference (IV, Random, 95% CI) | Totals not selected | |
| 3.1 Vitamin B12 versus ARB (months) | 1 | Mean Difference (IV, Random, 95% CI) | 0.0 [0.0, 0.0] | |
| 4 Diastolic blood pressure | 1 | Mean Difference (IV, Random, 95% CI) | Totals not selected | |
| 4.1 Vitamin B12 versus ARB (6 months) | 1 | Mean Difference (IV, Random, 95% CI) | 0.0 [0.0, 0.0] |
Characteristics of studies
Characteristics of included studies [ordered by study ID]
Agha 2009.
| Methods |
|
|
| Participants |
|
|
| Interventions | Treatment group
Control group
Co‐interventions
|
|
| Outcomes |
|
|
| Notes |
|
|
| Risk of bias | ||
| Bias | Authors' judgement | Support for judgement |
| Random sequence generation (selection bias) | Unclear risk | Study did not mention in detail about random sequence generation rather mention only word "randomly"; however under the heading "Limitations" the authors state "Our study was a single centre, non‐randomized study..." |
| Allocation concealment (selection bias) | Unclear risk | Did not mention the method for allocation concealment |
| Blinding of participants and personnel (performance bias) All outcomes | High risk | Single blinding was used |
| Blinding of outcome assessment (detection bias) All outcomes | High risk | They did not mention details about the blinding of either patients or outcome assessor |
| Incomplete outcome data (attrition bias) All outcomes | Low risk | Yes, per protocol analysis was used |
| Selective reporting (reporting bias) | Unclear risk | Sufficient data was not available to assess the reporting bias from the publication. No prior protocol was available |
| Other bias | Low risk | Study was free from other sources of bias |
Alkhalaf 2010.
| Methods |
|
|
| Participants |
|
|
| Interventions | Treatment group
Control group
Co‐interventions: NS |
|
| Outcomes | Primary outcome
Secondary outcomes
|
|
| Notes |
|
|
| Risk of bias | ||
| Bias | Authors' judgement | Support for judgement |
| Random sequence generation (selection bias) | Unclear risk | Not reported |
| Allocation concealment (selection bias) | Unclear risk | Not reported |
| Blinding of participants and personnel (performance bias) All outcomes | Unclear risk | Investigator, subjects and caregiver were blinded (Protocol). Only title suggests the study was double blind, it was not mentioned in the methodology of the final publication |
| Blinding of outcome assessment (detection bias) All outcomes | Unclear risk | Not reported |
| Incomplete outcome data (attrition bias) All outcomes | Low risk | The proportion of missing outcomes compared with observed event risk not enough to have a clinically relevant impact on the intervention effect estimate |
| Selective reporting (reporting bias) | Low risk | All the outcomes stated in the protocol were reported |
| Other bias | Low risk | It was free from other sources of bias |
DIVINe Study 2010.
| Methods |
|
|
| Participants |
|
|
| Interventions | Treatment group
Control group
|
|
| Outcomes |
|
|
| Notes |
|
|
| Risk of bias | ||
| Bias | Authors' judgement | Support for judgement |
| Random sequence generation (selection bias) | Low risk | "A computer‐generated randomisation list was generated by the trial biostatistician (M.E.) using permuted block sizes of 2 and 4, and was stratified by centre, sex, and baseline Cockcroft‐Gault formula creatinine clearance (50 vs 50 mL/min/1.73 m²; to convert to mL/s/m², multiply by 0.0167)" |
| Allocation concealment (selection bias) | Low risk | "B vitamins and matching placebos were bottled with participant numbers by pharmacy staff. As trial participants were given the next appropriately labelled bottle, all participants, research coordinators, and treating physicians remained blinded to the treatment assignment throughout the trial." |
| Blinding of participants and personnel (performance bias) All outcomes | Low risk | "All participants, research coordinators, and treating physicians remained blinded to the treatment assignment throughout the trial." |
| Blinding of outcome assessment (detection bias) All outcomes | Low risk | "Central laboratory reports were made available to attending physicians, and blinding was maintained by deleting the values for plasma total homocysteine, serum folate, and serum B12." |
| Incomplete outcome data (attrition bias) All outcomes | High risk | Data were analysed using a modified intention‐to‐treat approach, defined as participants who met all the inclusion criteria and none of the exclusion criteria, ingested their first tablet of medication, and had 1 or more post‐randomisation GFR efficacy measures. Multiple imputation techniques were used. However, participants for the comparison at the end of 36 months were less for biochemical outcomes |
| Selective reporting (reporting bias) | Low risk | All the outcomes stated in the protocol were reported |
| Other bias | Unclear risk | Funding source not stated; free from other sources of bias |
Lewis 2012.
| Methods |
|
|
| Participants |
|
|
| Interventions | Treatment group 1
Treatment group 2
Control group
Co‐medications
|
|
| Outcomes |
|
|
| Notes |
|
|
| Risk of bias | ||
| Bias | Authors' judgement | Support for judgement |
| Random sequence generation (selection bias) | Low risk | "Patients who met the serum creatinine and protein‐to‐creatinine ratio inclusion criteria initially or after the run‐in period were randomly assigned to Pyridorin, 150mg twice daily; Pyridorin, 300 mg twice daily; or placebo twice daily at a 1:1:1 ratio using an interactive voice response system" |
| Allocation concealment (selection bias) | Low risk | Interactive voice response system was used to allow the allocation concealment |
| Blinding of participants and personnel (performance bias) All outcomes | Unclear risk | Only the abstract of the study states it was double blind |
| Blinding of outcome assessment (detection bias) All outcomes | Unclear risk | It was unclear from the method about blinding of investigators or participants |
| Incomplete outcome data (attrition bias) All outcomes | Low risk | "Our primary end point was the determination of the change in serum creatinine concentration in the intent‐to‐treat population studied" |
| Selective reporting (reporting bias) | Low risk | Selective reporting was not present as outcomes stated in the protocol were reported in the final manuscript |
| Other bias | High risk | This study was funded by Nephrogenex Inc. The authors of the study received salaries from research grants from NephroGenex |
PYR‐205 Study 2007.
| Methods |
|
|
| Participants |
|
|
| Interventions | Treatment group
Control group
Co‐medications
|
|
| Outcomes | Efficacy outcomes
Safety outcomes
|
|
| Notes |
|
|
| Risk of bias | ||
| Bias | Authors' judgement | Support for judgement |
| Random sequence generation (selection bias) | Low risk | "Patients who met the entry criteria were randomised by a central randomizations schedule for each study." |
| Allocation concealment (selection bias) | Low risk | "PYR‐205/207, randomizations was 2:1 by a central randomizations schedule" |
| Blinding of participants and personnel (performance bias) All outcomes | Unclear risk | Not stated who were blinded to the study drug |
| Blinding of outcome assessment (detection bias) All outcomes | Unclear risk | Not reported |
| Incomplete outcome data (attrition bias) All outcomes | Low risk | "The prospectively defined intent‐to‐treat (ITT) population for final data analysis included all enrolled patients who received at least one dose of the double‐blinded study drug." |
| Selective reporting (reporting bias) | Low risk | All the outcome stated in protocol were reported |
| Other bias | High risk | Financial support for this study was provided by BioStratum Inc |
PYR‐206 Study 2007.
| Methods |
|
|
| Participants |
|
|
| Interventions | Treatment group
Control group
Co‐medications
|
|
| Outcomes | Efficacy outcomes
Safety outcomes
|
|
| Notes |
|
|
| Risk of bias | ||
| Bias | Authors' judgement | Support for judgement |
| Random sequence generation (selection bias) | Low risk | "Patients who met the entry criteria were randomised by a central randomizations schedule for each study." |
| Allocation concealment (selection bias) | Low risk | "In PYR‐206, patients were randomised 1:1 and in PYR‐205/207, randomizations was 2:1. and used computer generated randomisation" |
| Blinding of participants and personnel (performance bias) All outcomes | Unclear risk | Not stated who were blinded to the study drug |
| Blinding of outcome assessment (detection bias) All outcomes | Unclear risk | Not reported |
| Incomplete outcome data (attrition bias) All outcomes | Low risk | "The prospectively defined intent‐to‐treat (ITT) population for final data analysis included all enrolled patients who received at least one dose of the double‐blinded study drug." |
| Selective reporting (reporting bias) | Low risk | All the outcomes mentioned in the protocol were reported in the outcomes. |
| Other bias | High risk | Financial support for this study was provided by BioStratum Inc. |
PYR‐207 Study 2007.
| Methods |
|
|
| Participants |
|
|
| Interventions | Treatment group
Control group
Co‐interventions
|
|
| Outcomes | Efficacy outcomes
Safety outcomes
|
|
| Notes |
|
|
| Risk of bias | ||
| Bias | Authors' judgement | Support for judgement |
| Random sequence generation (selection bias) | Low risk | "Patients who met the entry criteria were randomised by a central randomizations schedule for each study." |
| Allocation concealment (selection bias) | Low risk | "In PYR‐206, patients were randomised 1:1 and in PYR‐205/207, randomizations was 2:1." PYR‐205 used central randomisation, which would be the case in PYR‐205/207. |
| Blinding of participants and personnel (performance bias) All outcomes | Unclear risk | Not stated who were blinded to the study drug |
| Blinding of outcome assessment (detection bias) All outcomes | Unclear risk | Not reported |
| Incomplete outcome data (attrition bias) All outcomes | Low risk | "The prospectively defined intent‐to‐treat (ITT) population for final data analysis included all enrolled patients who received at least one dose of the double‐blinded study drug." |
| Selective reporting (reporting bias) | Low risk | All the outcomes stated in protocol were reported |
| Other bias | High risk | Financial support for this study was provided by BioStratum Inc |
Rabbani 2009.
| Methods |
|
|
| Participants |
|
|
| Interventions | Treatment group
Control group
Co‐medications
|
|
| Outcomes |
|
|
| Notes |
|
|
| Risk of bias | ||
| Bias | Authors' judgement | Support for judgement |
| Random sequence generation (selection bias) | Low risk | Random number method was used to generate randomisation sequence |
| Allocation concealment (selection bias) | Low risk | "Randomisation was by central office in sequentially numbered opaque, sealed envelopes." Comment: Stated in the abstract of the publication but not in the main body of the text |
| Blinding of participants and personnel (performance bias) All outcomes | Low risk | "Participants, caregivers and those assessing the outcomes were blinded to group assignment" Comment: Stated in the abstract of the publication but not in the main body of the text |
| Blinding of outcome assessment (detection bias) All outcomes | Low risk | Outcome assessor were blinded to assignment |
| Incomplete outcome data (attrition bias) All outcomes | Low risk | According to abstract of the publication, all the randomised patients were included in the analysis Numbers of patients in each group were included in the analysis not given in main body of the text. |
| Selective reporting (reporting bias) | Low risk | All the outcomes stated in the protocol were reported |
| Other bias | Low risk | Free from other sources of bias |
Wotherspoon 2008.
| Methods |
|
|
| Participants |
|
|
| Interventions | Treatment group
Control group
|
|
| Outcomes |
|
|
| Notes |
|
|
| Risk of bias | ||
| Bias | Authors' judgement | Support for judgement |
| Random sequence generation (selection bias) | Unclear risk | Insufficient information |
| Allocation concealment (selection bias) | Unclear risk | Insufficient information |
| Blinding of participants and personnel (performance bias) All outcomes | High risk | Insufficient information |
| Blinding of outcome assessment (detection bias) All outcomes | High risk | Insufficient information |
| Incomplete outcome data (attrition bias) All outcomes | Unclear risk | Insufficient information |
| Selective reporting (reporting bias) | High risk | Only reported biochemical outcomes not reported all of the outcomes measured. |
| Other bias | Unclear risk | Insufficient information |
ACEi ‐ angiotensin‐converting enzyme inhibitors; ACR ‐ albumin:creatinine ratio; AKI ‐ acute kidney injury; ARB ‐ angiotensin receptor blockers; BCC ‐ basal cell carcinoma; BMI ‐ body mass index; BP ‐ blood pressure; DKD ‐ diabetic kidney disease; DM ‐ diabetic mellitus; ESKD ‐ end‐stage kidney disease; NS ‐ not stated; RCT ‐ randomised controlled trial; SCC ‐ squamous cell carcinoma; SCr ‐ serum creatinine; UAE ‐ urinary albumin excretion rate
Characteristics of excluded studies [ordered by study ID]
| Study | Reason for exclusion |
|---|---|
| Ardalan 2003 | RCT assessing the effects of vitamin B preparation in the patients with ESKD undergoing haemodialysis |
| Arnadottir 2003 | RCT assessing the effects of vitamin B12 after each dialysis session in the folate‐replete haemodialysis patients with ESKD |
| Azadibakhsh 2009 | RCT assessing efficacy of supplementation with high dose folic acid with and without vitamin B12 in lowering plasma total homocysteine concentrations in haemodialysis patients with ESKD |
| Biagini 2002 | RCT assessing the effects of vitamin supplementation on the progression atherosclerosis in hyperhomocysteinaemia in kidney transplant recipients |
| Bostom 1996 | RCT evaluating the effects on plasma homocysteine of adding supraphysiologic dose folic acid, vitamin B6, and vitamin B12 to the usual daily dosing of them in hyperhomocysteinaemia in dialysis patients with ESKD |
| Brensing 2003 | RCT assessing the effects of vitamin B therapy hyperhomocysteinaemia in haemodialysis patients |
| Chang 2007 | RCT assessing the effects of folic acid and vitamin B complex administration in patients on maintenance haemodialysis |
| Cheng 2008 | RCT assessing the safety and efficacy of niacinamide in haemodialysis patients with high phosphorus levels |
| Chiu 2009 | RCT assessing the effects of vitamin B preparations in patients on chronic haemodialysis therapy |
| De Angelis 2007 | RCT assessing the effects of alternate vitamin supplementation with folic acid and vitamin B12 in haemodialysis patients |
| Dierkes 2001 | RCT assessing the effects of various doses vitamins required for optimised treatment in ESKD patients treated with chronic intermittent maintenance haemodialysis |
| Dobronravov 2008 | Clinical study assessing the effect of IV administration of sodium 2,3‐dimercaptopropane‐1‐sulfonate and 8‐week high‐dosed IV vitamin B therapy on total plasma homocysteine in patients undergoing chronic haemodialysis |
| Ducloux 2002 | RCT evaluating the effects of IV or oral folinic acid and oral folic acid in haemodialysis patients |
| Farvid 2005 | RCT assessing the effects of vitamins or mineral supplementation, or both other than vitamin B therapy on glomerular and tubular dysfunction in type 2 DM patients |
| Frank 1999 | RCT assessing the pharmacokinetics profiles of two therapeutically used thiamine preparations in patients with ESKD |
| Frank 2000 | RCT assessing the effects of benfotiamine in patients with ESKD |
| Gonin 2000 | RCT comparing abnormally high doses of folic acid alone or with supplemental vitamin B6 and B12 compared with active folate alone or with serine in haemodialysis patients |
| Heinz 2009 | Protocol including design and baseline data for RCT assessing effects of vitamins on cardiovascular morbidity and mortality in patients with ESKD |
| Henning 2001 | RCT comparing the effects of a four‐week course of intravenous treatment with folate, cobalamin, and pyridoxal phosphate in haemodialysis patients |
| HOPE‐2 Study 2006 | RCT assessing effects of vitamin B derivatives in all diabetic patients irrespective of their diabetic nephropathy status |
| Hyndman 2003 | Study assessing the influence of genetic and nutritional status response to high‐dose vitamin B12 and folate treatment in ESKD patients with hyperhomocysteinaemia |
| Isbel 2003 | RCT assessing the effects of vitamin B12 in the treatment of hyperhomocysteinaemia in patients with ESKD |
| Klemm 1994 | Narrative review on the use of folate and vitamin B12 supplementation necessary in the chronic haemodialysis patients with erythropoietin treatment |
| Kuhlmann 2004 | RCT assessing the effects of IV dose of vitamin therapy in hyperhomocysteinaemia in haemodialysis patients |
| Libetta 2004 | RCT assessing the effects of vitamin therapy for hyperhomocysteinaemia in haemodialysis patients |
| Manns 2001 | RCT assessing the effects of oral vitamin B12 for hyperhomocysteinaemia in haemodialysis patients |
| Manrique 2005 | RCT assessing the effects of folic acid and Vitamin B for hyperhomocysteinaemia in kidney transplant patients |
| Marcucci 2002 | RCT assessing the effects of vitamin supplements for hyperhomocysteinaemia in kidney transplant patients |
| Mazdeh 2005 | RCT assessing the effects of folinic acid and folic acid with Vitamin B for hyperhomocysteinaemia in haemodialysis patients |
| Meng 2004 | Clinical studies comparing dose of ginkgo leaf extract with vitamin B12 in patients with diabetic neuropathy. Studies did not assess the effects of Vitamin B12 alone or with placebo in the patients with diabetic neuropathy |
| Mydlik 1995 | Study did not address treatment related to vitamin B in DKD |
| Nakamura 2003 | RCT assessing the effects of folic acid and Vitamin B12 for hyperhomocysteinaemia in haemodialysis patients |
| Nakhoul 2004 | RCT assessing the effects of folic acid and Vitamin B for hyperhomocysteinaemia in haemodialysis patients |
| Nascimento 2004 | RCT assessing the efficacy of the thiamine in patients with haemodialysis |
| Okada 2000 | RCT assessing the effects of vitamin B6 in the patients with haemodialysis |
| Pastore 2006 | RCT assessing the effects of folic acid and Vitamin B12 in haemodialysis patients |
| Peng 2005 | RCT assessing the effects of folic acid and IV vitamin B complex for hyperhomocysteinaemia in haemodialysis patients |
| Polkinghorne 2003 | RCT assessing the effects of intramuscular vitamin B12 for hyperhomocysteinaemia in haemodialysis patients |
| Righetti 2006 | Review on RCT assessing the effects of vitamin B treatment for hyperhomocysteinaemia in haemodialysis patients |
| Sanchez Alvarez 2005 | RCT assessing the effects of vitamin B treatment for cardiovascular events in haemodialysis patients |
| Schupp 2008 | Study assessing the effects of benfotiamine on genomic damage in peripheral lymphocytes in haemodialysis patients |
| Sjogren 1979 | RCT assessing effect of high dose of thiamine on bone marrow morphology in patients on regular haemodialysis |
| Spoelstra 2004 | RCT assessing the effects of vitamin B preparation among individuals with diabetes. None of the patients with diabetes had DKD at the baseline |
| Thambyrajah 2000 | RCT assessing the effects of folic acid in patients with predialysis kidney failure |
| Tremblay 2000 | RCT assessing the effects of folic acid in patients with ESKD |
| Tungkasereerak 2004 | RCT assessing the effects of hydro soluble vitamins in patients with haemodialysis |
| Vrentzos 2001 | RCT assessing the effects of vitamin B12 in patient with ESKD |
| Weissgarten 2001 | RCT assessing the effects of vitamin B6 supplement in patient with haemodialysis |
| Xu 2005a | RCT assessing the effects of vitamin B supplement in kidney transplant recipient |
| Young 2009a | RCT assessing the effects of oral niacinamide in patient with peritoneal dialysis |
DKD ‐ diabetic kidney disease; DM ‐ diabetes mellitus; ESKD ‐ end‐stage kidney disease; RCT ‐ randomised controlled trial
Characteristics of studies awaiting assessment [ordered by study ID]
NCT00737126.
| Methods | The effect of folic acid administration in the progression of microalbuminuria |
| Participants |
Inclusion criteria
Exclusion criteria
|
| Interventions |
|
| Outcomes | Primary outcomes
Secondary outcomes
|
| Notes |
|
ACR ‐ albumin:creatinine ratio; DM ‐ diabetes mellitus; NS ‐ not stated; UAE ‐ urinary albumin excretion
Contributions of authors
Draft the protocol: ADR, DG, AR, DT
Study selection: DG, DT,
Extract data from studies: DG, DT
Enter data into RevMan: DG, DT
Carry out the analysis: DG, ADR, DT
Interpret the analysis: ADR, DG, DT, RW
Draft the final review: ADR, DG, AR, DT, RW
Disagreement resolution: ADR
Update the review: ADR, DG, AR, DT, RW
Sources of support
Internal sources
Cochrane Renal Group, Australia.
External sources
None, Other.
Declarations of interest
Amit D Raval: none known
Divyesh Thakker: none known
Arohi N Rangoonwala: none known
Deval Gor: none known
Rama Walia: none known
Edited (no change to conclusions)
References
References to studies included in this review
Agha 2009 {published data only}
- Agha A, Amer W, Anwar E, Bashir K. Reduction of microalbuminuria by using losartan in normotensive patients with type 2 diabetes mellitus: a randomized controlled trial. Saudi Journal of Kidney Diseases & Transplantation 2009;20(3):429‐35. [MEDLINE: ] [PubMed] [Google Scholar]
Alkhalaf 2010 {published data only}
- Alkhalaf A, Klooster A, Oeveren W, Achenbach U, Kleefstra N, Slingerland RJ, et al. A double‐blind, randomized, placebo‐controlled clinical trial on benfotiamine treatment in patients with diabetic nephropathy. Diabetes Care 2010;33(7):1598‐601. [MEDLINE: ] [DOI] [PMC free article] [PubMed] [Google Scholar]
DIVINe Study 2010 {published data only}
- House AA, Ehasziw M, Cattran DC, Churchill DN, Oliver MJ, Fine A, et al. Vitamin therapy for homocysteine accelerates loss of renal function in diabetic kidney disease [abstract no: SA‐FC343]. Journal of the American Society of Nephrology 2009;20:80A. [CENTRAL: CN‐00740523] [Google Scholar]
- House AA, Eliasziw M, Cattran DC, Churchill DN, Oliver MJ, Fine A, et al. Effect of B‐vitamin therapy on progression of diabetic nephropathy: a randomized controlled trial. JAMA 2010;303(16):1603‐9. [MEDLINE: ] [DOI] [PubMed] [Google Scholar]
Lewis 2012 {published data only}
- Lewis EJ, Greene T, Spitalewiz S, Blumenthal S, Berl T, Hunsicker LG, et al. Pyridorin in type 2 diabetic nephropathy. Journal of the American Society of Nephrology 2012;23(1):131‐6. [MEDLINE: ] [DOI] [PMC free article] [PubMed] [Google Scholar]
PYR‐205 Study 2007 {published data only}
- McGill JB, Williams ME, Degenhardt TP, Szabo JR, Schotzinger RJ, PYR‐205/207 Study Group. A phase 2 clinical investigation of pyridoxamine (Pyridorim™) in type 1 and type 2 diabetic patients with overt diabetic nephropathy (PYR‐205/207) [abstract no: SU‐PO152]. Journal of the American Society of Nephrology 2004;15(Oct):565A. [Google Scholar]
- Wassenberg JJ, Fox W, Degenhardt TP, Szabo J, Khalifah RG. Pyridoxamine (Pyridorin™) reduces urinary TGF‐b1 in Phase 2 clinical studies (PYR‐205/207) on Type 1 and Type 2 diabetic patients with overt nephropathy [abstract no: SU‐PO914]. Journal of the American Society of Nephrology 2004;15(Oct):729A. [Google Scholar]
- Williams ME, Bolton WK, Khalifah RG, Degenhardt TP, Schotzinger RJ, McGill JB. Effects of pyridoxamine in combined phase 2 studies of patients with type 1 and type 2 diabetes and overt nephropathy. American Journal of Nephrology 2007;27(6):605‐14. [MEDLINE: ] [DOI] [PubMed] [Google Scholar]
PYR‐206 Study 2007 {published data only}
- Bell DS, Degenhardt TP, Szabo JR, Khalifah RG, Schotzinger RJ, PYR‐206 Study Group. Investigation of the safety and efficacy of pyridoxamine (Pyridorin) in patients with diabetic nephropathy (PYR‐206) [abstract]. Diabetes 2004;53(Suppl 2):A119. [Google Scholar]
- Wassenberg JJ, Knight ST, Fox JW, Degenhardt TP, Szabo J, Khalifah RG. The AGE inhibitor pyridoxamine (Pyridorin™) reduces urinary TGF‐b1 in diabetic patients with overt nephropathy [abstract no: SA‐PO451]. Journal of the American Society of Nephrology 2003;14(Nov):395A. [Google Scholar]
- Williams ME, Bolton WK, Degenhardt TP, Schotzinger R. A phase 2 clinical trial of pyridoxamine (Pyridorin™) in type 1 and type 2 diabetic patients with overt nephropathy (PYR‐206) [abstract no: F‐FC029]. Journal of the American Society of Nephrology 2003;14(Nov):7A. [Google Scholar]
- Williams ME, Bolton WK, Khalifah RG, Degenhardt TP, Schotzinger RJ, McGill JB. Effects of pyridoxamine in combined phase 2 studies of patients with type 1 and type 2 diabetes and overt nephropathy. American Journal of Nephrology 2007;27(6):605‐14. [MEDLINE: ] [DOI] [PubMed] [Google Scholar]
PYR‐207 Study 2007 {published data only}
- McGill JB, Williams ME, Degenhardt TP, Szabo JR, Schotzinger RJ, PYR‐205/207 Study Group. A phase 2 clinical investigation of pyridoxamine (Pyridorim™) in type 1 and type 2 diabetic patients with overt diabetic nephropathy (PYR‐205/207) [abstract no: SU‐PO152]. Journal of the American Society of Nephrology 2004;15(Oct):565A. [Google Scholar]
- Wassenberg JJ, Fox W, Degenhardt TP, Szabo J, Khalifah RG. Pyridoxamine (Pyridorin™) reduces urinary TGF‐b1 in Phase 2 clinical studies (PYR‐205/207) on Type 1 and Type 2 diabetic patients with overt nephropathy [abstract no: SU‐PO914]. Journal of the American Society of Nephrology 2004;15(Oct):729A. [Google Scholar]
- Williams ME, Bolton WK, Khalifah RG, Degenhardt TP, Schotzinger RJ, McGill JB. Effects of pyridoxamine in combined phase 2 studies of patients with type 1 and type 2 diabetes and overt nephropathy. American Journal of Nephrology 2007;27(6):605‐14. [MEDLINE: ] [DOI] [PubMed] [Google Scholar]
Rabbani 2009 {published data only}
- Rabbani N, Alam SS, Riaz S, Larkin JR, Akhtar MW, Shafi T, et al. High‐dose thiamine therapy for patients with type 2 diabetes and microalbuminuria: a randomised, double‐blind placebo‐controlled pilot study. Diabetologia 2009;52(2):208‐12. [MEDLINE: ] [DOI] [PubMed] [Google Scholar]
Wotherspoon 2008 {published data only}
- Wotherspoon F, Laight DW, Turner C, Meeking DR, Allard SE, Munday LJ, et al. The effect of oral folic acid upon plasma homocysteine, endothelial function and oxidative stress in patients with type 1 diabetes and microalbuminuria. International Journal of Clinical Practice 2008;62(4):569‐74. [MEDLINE: ] [DOI] [PubMed] [Google Scholar]
References to studies excluded from this review
Ardalan 2003 {published data only}
- Ardalan MR, Etemadi J, Mortazavi M, Majidi J. Hyperhomocysteinaemia therapy in haemodialysis patients with combination of Vitamin B6, B12 and folic acid [abstract no: W467]. Nephrology Dialysis Transplantation 2003;18(4):696. [CENTRAL: CN‐00716091] [Google Scholar]
- Ardalan MR, Mortazavi M, Etemadi J. Hyperhomocysteinemia and its therapy in renal transplant recipients with combination of: Vit B6, Vit B12 and folic acid [abstract]. Nephrology Dialysis Transplantation 2003;18(Suppl 4):509‐10. [CENTRAL: CN‐00444217] [Google Scholar]
Arnadottir 2003 {published data only}
- Arnadottir M, Hultberg B. The effect of vitamin B12 on total plasma homocysteine concentration in folate‐replete hemodialysis patients. Clinical Nephrology 2003;59(3):186‐9. [MEDLINE: ] [DOI] [PubMed] [Google Scholar]
Azadibakhsh 2009 {published data only}
- Azadibakhsh N, Hosseini RS, Atabak S, Nateghiyan N, Golestan B, Rad AH. Efficacy of folate and vitamin B12 in lowering homocysteine concentrations in hemodialysis patients. Saudi Journal of Kidney Diseases & Transplantation 2009;20(5):779‐88. [MEDLINE: ] [PubMed] [Google Scholar]
Biagini 2002 {published data only}
- Biagini M, Bertoni E, Marcucci R, Zanazzi M, Rosati A, Fedi S, et al. Vitamin supplementation reduces the progression atherosclerosis in hyperhomocysteinemic renal transplant recipients [abstract]. XIXth International Congress of the Transplantation Society; 2002 Aug 25‐30; Miami, FL. 2002. [CENTRAL: CN‐00415280] [DOI] [PubMed]
Bostom 1996 {published data only}
- Bostom AG, Shemin D, Lapane KL, Hume AL, Yoburn D, Nadeau MR, et al. High dose‐B‐vitamin treatment of hyperhomocysteinemia in dialysis patients. Kidney International 1996;49(1):147‐52. [MEDLINE: ] [DOI] [PubMed] [Google Scholar]
Brensing 2003 {published data only}
- Brensing KA, Hages M, Raab P, Pietrzik K, Bergmann K, Frotscher U, et al. Vitamin B12 and folic‐acid as intravenous high‐dose vitamin therapy for hyperhomocysteinemia in hemodialysed ESRD‐patients: data of a prospective randomized controlled study [abstract no: SU‐PO1048]. Journal of the American Society of Nephrology 2003;14(Nov):766A. [CENTRAL: CN‐00644257] [Google Scholar]
Chang 2007 {published data only}
- Chang TY, Chou KJ, Tseng CF, Chung HM, Fang HC, Hung YM, et al. Effects of folic acid and vitamin B complex on serum C‐reactive protein and albumin levels in stable hemodialysis patients. Current Medical Research & Opinion 2007;23(8):1879‐86. [MEDLINE: ] [DOI] [PubMed] [Google Scholar]
Cheng 2008 {published data only}
- Cheng SC, Young DO, Delmez JA, Coyne DW. The effect of oral niacinamide on serum phosphorus levels in hemodialysis patients [abstract no: PUB430]. Journal of the American Society of Nephrology 2007;18(Abstracts):924A. [Google Scholar]
- Cheng SC, Young DO, Huang Y, Delmez JA, Coyne DW. A randomized, double‐blind, placebo‐controlled trial of niacinamide for reduction of phosphorus in hemodialysis patients. Clinical Journal of The American Society of Nephrology: CJASN 2008;3(4):1131‐38. [MEDLINE: ] [DOI] [PMC free article] [PubMed] [Google Scholar]
Chiu 2009 {published data only}
- Chiu YW, Chang JM, Hwang SJ, Tsai JC, Chen HC. Pharmacological dose of vitamin B12 is as effective as low‐dose folinic acid in correcting hyperhomocysteinemia of hemodialysis patients. Renal Failure 2009;31(4):278‐83. [MEDLINE: ] [DOI] [PubMed] [Google Scholar]
De Angelis 2007 {published data only}
- Angelis S, Noce A, Dessi M, Pastore A, Scaccia F, Trombetta M, et al. Hyperhomocysteinemia and alternate vitamin supplementation [Iperomocisteinemia nei pazienti uremici: effetti della supplementazione alternata di acido folico e vitamina B 12]. Giornale Italiano di Nefrologia 2007;24(1):51‐5. [MEDLINE: ] [PubMed] [Google Scholar]
Dierkes 2001 {published data only}
- Dierkes J, Domrose U, Bosselmann KP, Neumann KH, Luley C. Homocysteine lowering effect of different multivitamin preparations in patients with end‐stage renal disease. Journal of Renal Nutrition 2001;11(2):67‐72. [MEDLINE: ] [DOI] [PubMed] [Google Scholar]
Dobronravov 2008 {published data only}
- Dobronravov V, Ardebili M, Golubev R, Galkina O, Nabokow A, Kliem V, et al. The effect of IV administration of sodium 2,3‐dimercaptopropane‐1‐sulfonate (DMPS) and 8‐week high‐dosed IV vitamin B therapy on total plasma homocysteine (tHcy) in patients undergoing chronic hemodialysis (HD) [abstract no: PUB584]. Journal of the American Society of Nephrology 2008;19(Abstracts Issue):943A. [CENTRAL: CN‐00758243] [Google Scholar]
Ducloux 2002 {published data only}
- Ducloux D, Aboubakr A, Motte G, Toubin G, Fournier V, Chalopin JM, et al. Hyperhomocysteinaemia therapy in haemodialysis patients: folinic versus folic acid in combination with vitamin B6 and B12. Nephrology Dialysis Transplantation 2002;17(5):865‐70. [MEDLINE: ] [DOI] [PubMed] [Google Scholar]
- Ducloux D, Aboubakr A, Motte G, Toubin G, Fournier V, Chalopin JM, et al. Hyperhomocysteinemia therapy in hemodialysis (HD) patients: folinic versus folic acid in combination with vitamin B6 and B12 [abstract]. Journal of the American Society of Nephrology 2001;12(Program & Abstracts):354A‐5A. [CENTRAL: CN‐00445156] [DOI] [PubMed] [Google Scholar]
Farvid 2005 {published data only}
- Farvid MS, Jalali M, Siassi F, Hosseini M. Comparison of the effects of vitamins and/or mineral supplementation on glomerular and tubular dysfunction in type 2 diabetes. Diabetes Care 2005;28(10):2458‐64. [MEDLINE: ] [DOI] [PubMed] [Google Scholar]
Frank 1999 {published data only}
- Frank T, Bitsch R, Maiwald J, Stein G. Alteration of thiamine pharmacokinetics by end‐stage renal disease (ESRD). International Journal of Clinical Pharmacology & Therapeutics 1999;37(9):449‐55. [MEDLINE: ] [PubMed] [Google Scholar]
Frank 2000 {published data only}
- Frank T, Bitsch R, Maiwald J, Stein G. High thiamine diphosphate concentrations in erythrocytes can be achieved in dialysis patients by oral administration of benfontiamine. European Journal of Clinical Pharmacology 2000;56(3):251‐7. [MEDLINE: ] [DOI] [PubMed] [Google Scholar]
Gonin 2000 {published data only}
- Gonin JM, Nguyen H, Gonin R, Sarna A, Michels A, Masri‐Imad F, et al. Controlled trials of very high dose folic acid, vitamins B12 and B6, intravenous folinic acid and serine for treatment of hyperhomocysteinemia in ESRD. Journal of Nephrology 2003;16(4):522‐34. [MEDLINE: ] [PubMed] [Google Scholar]
- Gonin JM, Sarna A, Loya A, Gonin R, Chassaing C, Wainer I, et al. A double‐blind, controlled study of folate and vitamin therapy for hyperhomocysteinemia in hemodialysis [abstract]. Journal of the American Society of Nephrology 2000;11(Sept):269A. [CENTRAL: CN‐00755224] [Google Scholar]
Heinz 2009 {published data only}
- Heinz J, Dierkes J, Domrose U, Neumann KH, Luley C. Influence of a supplementation with vitamins on morbidity and mortality of ESRD patients: a multi‐center randomly designed double blinded intervention trial; Prismavit ‐ prospective intervention study from Magdeburg with vitamins [abstract]. XIV Lipid Meeting; 2003 Dec 5‐7; Leipzig, Germany. 89. [CENTRAL: CN‐00740532]
- Heinz J, Domrose U, Luley C, Westphal S, Kropf S, Neumann KH, et al. Influence of a supplementation with vitamins on cardiovascular morbidity and mortality in patients with end‐stage renal disease: design and baseline data of a randomized clinical trial. Clinical Nephrology 2009;71(3):363‐5. [MEDLINE: ] [DOI] [PubMed] [Google Scholar]
- Heinz J, Kropf S, Domrose U, Westphal S, Borucki K, Luley C, et al. B vitamins and the risk of total mortality and cardiovascular disease in end‐stage renal disease: results of a randomized controlled trial. Circulation 2010;121(12):1432‐8. [MEDLINE: ] [DOI] [PubMed] [Google Scholar]
Henning 2001 {published data only}
- Henning BF, Zidek W, Riezler R, Graefe U, Tepel M. Homocyst(e)ine metabolism in hemodialysis patients treated with vitamins B6, B12 and folate. Research in Experimental Medicine 2001;200(3):155‐68. [MEDLINE: ] [PubMed] [Google Scholar]
HOPE‐2 Study 2006 {published data only}
- Lonn E, Yusuf S, Arnold MJ, Sheridan P, Pogue J, Micks M, et al. Homocysteine lowering with folic acid and B vitamins in vascular disease. New England Journal of Medicine 2006;354(15):1567‐77. [MEDLINE: ] [DOI] [PubMed] [Google Scholar]
- Mann JF, Sheridan P, McQueen MJ, Held C, Arnold JM, Fodor G, et al. Homocysteine lowering with folic acid and B vitamins in people with chronic kidney disease‐‐results of the renal Hope‐2 study. Nephrology Dialysis Transplantation 2008;23(2):645‐53. [MEDLINE: ] [DOI] [PubMed] [Google Scholar]
- Ray JG, Kearon C, Yi Q, Sheridan P, Lonn E, Heart Outcomes Prevention Evaluation (HOPE‐2) Investigators. Homocysteine‐lowering therapy and risk for venous thromboembolism: a randomized trial. Annals of Internal Medicine 2007;146(11):761‐7. [MEDLINE: ] [DOI] [PubMed] [Google Scholar]
- Righetti M. Hopeful for a second HOPE‐2 post hoc analysis. Nephrology Dialysis Transplantation 2008;23(7):2428‐9. [MEDLINE: ] [DOI] [PubMed] [Google Scholar]
- Saposnik G, Ray JG, Sheridan P, McQueen M, Lonn E, Heart Outcomes Prevention Evaluation 2 Investigators. Homocysteine‐lowering therapy and stroke risk, severity, and disability: additional findings from the HOPE 2 trial. Stroke 2009;40(4):1365‐72. [MEDLINE: ] [DOI] [PubMed] [Google Scholar]
- Sawka AM, Ray JG, Yi Q, Josse RG, Lonn E. Randomized clinical trial of homocysteine level lowering therapy and fractures. Archives of Internal Medicine 2007;167(19):2136‐9. [MEDLINE: ] [DOI] [PubMed] [Google Scholar]
Hyndman 2003 {published data only}
- Hyndman ME, Manns BJ, Snyder FF, Bridge PJ, Scott‐Douglas NW, Fung E, et al. Vitamin B12 decreases, but does not normalize, homocysteine and methylmalonic acid in end‐stage renal disease: a link with glycine metabolism and possible explanation of hyperhomocysteinemia in end‐stage renal disease. Metabolism: Clinical & Experimental 2003;52(2):168‐72. [MEDLINE: ] [DOI] [PubMed] [Google Scholar]
Isbel 2003 {published data only}
- Isbel NM, Reiger K, Hayley CM, Campbell SB, Burke J, Bofinger A, et al. Vitamin B12 is effective in the treatment of hyperhomocysteinaemia in patients with ESRD [abstract no: 58]. Nephrology 2003;8(Suppl 3):A69. [CENTRAL: CN‐00758625] [Google Scholar]
Klemm 1994 {published data only}
- Klemm A, Sperschneider H, Lauterbach H, Stein G. Is folate and vitamin B12 supplementation necessary in chronic hemodialysis patients with EPO treatment?. Clinical Nephrology 1994;42(5):343‐5. [MEDLINE: ] [PubMed] [Google Scholar]
Kuhlmann 2004 {published data only}
- Kuhlmann MK, Obeid R, Herrmann W. Normalization of plasma homocystein (Hcy) levels in hyperhomocysteinemic hemodialysis patients by intravenous dosage of vitamins B6, B12 and folic acid [abstract no SA‐PO345]. Journal of the American Society of Nephrology 2004;15(Oct):377A. [CENTRAL: CN‐00757352] [Google Scholar]
Libetta 2004 {published data only}
- Libetta C, Villa G, Gori E, Zucchi M, Pisacco P, Bezoari G, et al. Vitamins supplementation effectiveness on hyperhomocysteinemia in hemodialyzed patients: a two‐year single‐blind randomized study [abstract no: SA‐PO344]. Journal of the American Society of Nephrology 2004;15(Oct):377A. [CENTRAL: CN‐00626027] [Google Scholar]
- Libetta C, Villa G, Gori E, Zucchi M, Sepe V, Pisacco P, et al. Effect of folate or folate plus vitamins B6 and B12 on hyperhomocysteinemia in hemodialyzed patients: a 2‐year controlled randomized study [abstract]. 41st Congress. European Renal Association. European Dialysis and Transplantation Association; 2004 May 15‐18; Lisbon, Portugal. 126. [CENTRAL: CN‐00636150]
Manns 2001 {published data only}
- Manns B, Hyndman E, Burgess E, Parsons H, Schaefer J, Snyder F, et al. Oral vitamin B(12) and high‐dose folic acid in hemodialysis patients with hyper‐homocyst(e)inemia. Kidney International 2001;59(3):1103‐9. [MEDLINE: ] [DOI] [PubMed] [Google Scholar]
Manrique 2005 {published data only}
- Manrique J, Errasti P, Orbe J, Paramo JA, Rodriguez JA. Folic acid and B vitamins improve hyperhomocysteinemia‐induced cardiovascular risk profile in renal transplant recipients. Journal of Thrombosis & Haemostasis 2007;5(5):1072‐6. [MEDLINE: ] [DOI] [PubMed] [Google Scholar]
Marcucci 2002 {published data only}
- Bertoni E, Rosati A, Zanazzi M, Marcucci R, Fedi S, Abbate R, et al. Vitamin supplement reduces the progression of atherosclerosis in hyperhomocysteinemic renal transplant recipients [abstract no: F‐FC055]. Journal of the American Society of Nephrology 2002;13(September, Program & Abstracts):74P. [CENTRAL: CN‐00444418] [Google Scholar]
- Marcucci R, Bertoni E, Zanazzi M, Rosati A, Fedi S, Rogolino A, et al. Vitamin supplementation reduces the progression of atherosclerosis in hyperhomocysteinemic renal transplant recipients [abstract]. Nephrology Dialysis Transplantation 2002;17(Suppl 1):31. [CENTRAL: CN‐00520363] [DOI] [PubMed] [Google Scholar]
- Marcucci R, Zanazzi M, Bertoni E, Rosati A, Fedi S, Lenti M, et al. Homocysteine‐lowering therapy and carotid intima‐media thickness in renal transplant recipients. Transplantation Proceedings 2005;37(6):2491‐2. [MEDLINE: ] [DOI] [PubMed] [Google Scholar]
- Marcucci R, Zanazzi M, Bertoni E, Rosati A, Fedi S, Lenti M, et al. Vitamin supplementation reduces the progression of atherosclerosis in hyperhomocysteinemic renal‐transplant recipients. Transplantation 2003;75(9):1551‐5. [MEDLINE: ] [DOI] [PubMed] [Google Scholar]
- Rosati A, Bertoni E, Zanazzi M, Marcucci R, Fedi S, Castellani S, et al. Vitamin supplement reduces the progression of atherosclerosis in hyperhomocysteinemic renal transplant recipients [abstract]. Nephrology Dialysis Transplantation 2003;18(Suppl 4):510. [CENTRAL: CN‐00447462] [DOI] [PubMed] [Google Scholar]
Mazdeh 2005 {published data only}
- Abolghasemi R, Mazdeh MM, Khatami M, Lessan‐Pezeshki M, Ahmadi F, Seifi S, et al. Hyperhomocysteinemia therapy in haemodialysis patients: folinic versus folic acid in combination with vitamin B6 and B12 [abstract no: MP318]. Nephrology Dialysis Transplantation 2005;20(Suppl 5):v307. [DOI] [PubMed] [Google Scholar]
- Mazdeh MM, Abolghasemi R, Khatami M, Lessan‐Pezeshki M, Ahmadi F, Seifi S, et al. Hyperhomocysteinemia therapy in hemodialysis patients: folinic versus folic acid in combination with vitamin B6 and B12 [abstract no: W‐PO40014]. Nephrology 2005;10(Suppl 1):A283. [CENTRAL: CN‐00756890] [Google Scholar]
Meng 2004 {published data only}
- Meng WL, Wang RJ, Yu J. Clinical observation on treatment of diabetic peripheral neuphropathy by ginkgo leaf extract combined with active vitamin B12. Zhongguo Zhong Xi Yi Jie He Za Zhi Zhongguo Zhongxiyi Jiehe Zazhi [Chinese Journal of Integrated Traditional & Western Medicine] 2004;24(7):645‐6. [MEDLINE: ] [PubMed] [Google Scholar]
Mydlik 1995 {published data only}
- Mydlik M, Derzsiova K. Water and fat soluble vitamins during erythropoietin (EPO) treatment(t) in haemodialyzed patients (HDP) [abstract]. ISN XIII International Congress of Nephrology; 1995 Jul 2‐6; Madrid, Spain. 504. [CENTRAL: CN‐00509374]
Nakamura 2003 {published data only}
- Nakamura T, Hirayama H, Tajiri M, Saionji K, Hata A. Methylenetetrahydrofolate reductase (MTHFR) gene polymorphism influences the efficacy of folic acid (FA) and vitamin b12 (B12) on hyperhomocyteinemia in hemodialysis (HD) patients [abstract]. Nephrology Dialysis Transplantation 2003;18(Suppl 4):699‐700. [CENTRAL: CN‐00446896] [Google Scholar]
Nakhoul 2004 {published data only}
- Nakhoul F, Abassi Z, Plawner M, Khankin E, Ramadan R, Lanir N, et al. Comparative study of response to treatment with supraphysiologic doses of B‐vitamins in hyperhomocysteinemic hemodialysis patients. Israel Medical Association Journal: Imaj 2004;6(4):213‐7. [MEDLINE: ] [PubMed] [Google Scholar]
- Plawner M, Nakhoul F, Khankin E, Laneer N, Brenner B, Green J. Folic acid and varying doses of B‐vitamines in the treatment of hyperhomocystinemia in hemodialysis patients [abstract]. Journal of the American Society of Nephrology 2000;11(Sept):295A. [CENTRAL: CN‐00644331] [Google Scholar]
Nascimento 2004 {published data only}
- Nascimento MM, Suliman ME, Murayama Y, Nihi M, Hayashi SY, Riella MC, et al. The effect of high‐dose thiamine (B1) and pyridoxine (B6) on advanced glycation end products (AGEs) and oxidative stress markers in HD patients [abstract no: SU‐PO470]. Journal of the American Society of Nephrology 2004;15(Oct):637A. [CENTRAL: CN‐00644272] [Google Scholar]
- Nascimento MM, Suliman ME, Murayama Y, Nihi M, Hayashi SY, Stenvinkel P, et al. Effect of high‐dose thiamine and pyridoxine on advanced glycation end products and other oxidative stress markers in hemodialysis patients: a randomized placebo‐controlled study. Journal of Renal Nutrition 2006;16(2):119‐24. [MEDLINE: ] [DOI] [PubMed] [Google Scholar]
Okada 2000 {published data only}
- Okada H, Moriwaki K, Kanno Y, Sugahara S, Nakamoto H, Yoshizawa M, et al. Vitamin B6 supplementation can improve peripheral polyneuropathy in patients with chronic renal failure on high‐flux haemodialysis and human recombinant erythropoietin. Nephrology Dialysis Transplantation 2000;15(9):1410‐3. [MEDLINE: ] [DOI] [PubMed] [Google Scholar]
Pastore 2006 {published data only}
- Pastore A, Angelis S, Casciani S, Ruggia R, Giovamberardino G, Noce A, et al. Effects of folic acid before and after vitamin B12 on plasma homocysteine concentrations in hemodialysis patients with known MTHFR genotypes. Clinical Chemistry 2006;52(1):145‐8. [MEDLINE: ] [DOI] [PubMed] [Google Scholar]
Peng 2005 {published data only}
- Peng L, Liu Q. A prospective, randomized, placebo‐controlled study to evaluate the effect of combined treatment of folic acid and intravenous B‐complex vitamins on hyperhomocysteinemia in hemodialysis patients [abstract no: W‐PO40032]. Nephrology 2005;10(Suppl 1):A288. [CENTRAL: CN‐00671827] [Google Scholar]
Polkinghorne 2003 {published data only}
- Polkinghorne KR, Zoungas S, Branley P, Villanueva E, McNeil JJ, Atkins RC, et al. A randomised placebo controlled trial of intramuscular vitamin B12 (hydroxyocobalamin) for the treatment of hyperhomocysteinemia in haemodialysis patients [abstract]. Kongres Nasional VIII Annual Meeting Perhimpunan Nefrologi Indonesia; 2002 Oct; Surabaya, Indonesia. 2.5. [CENTRAL: CN‐00447252]
- Polkinghorne KR, Zoungas S, Branley P, Villanueva E, McNeil JJ, Atkins RC, et al. A randomized placebo controlled trial of intramuscular vitamin B12 (hydroxyocobalamin) for the treatment of hyperhomocysteinemia in haemodialysis patients [abstract no: SU‐FC267]. Journal of the American Society of Nephrology 2002;13(September, Program & Abstracts):55a. [CENTRAL: CN‐00447251] [Google Scholar]
- Polkinghorne KR, Zoungas S, Branley P, Villanueva E, McNeil JJ, Atkins RC, et al. Randomized, placebo‐controlled trial of intramuscular vitamin B12 for the treatment of hyperhomocysteinaemia in dialysis patients. Internal Medicine Journal 2003;33(11):489‐94. [MEDLINE: ] [DOI] [PubMed] [Google Scholar]
- Polkinghorne KR, Zoungas S, Branley P, Villnueva E, McNeil J, Atkins RC, et al. A randomised placebo controlled trial of intramuscular vitamin B12 (hydroxyocobalamin) for the treatment of hyperhomocysteinemia in haemodialysis patients [abstract]. Nephrology 2002;7(Suppl 3):A68. [Google Scholar]
Righetti 2006 {published data only}
- Righetti M. Homocysteine‐lowering vitamin B treatment decreases cardiovascular events in hemodialysis patients. Clinical Chemistry & Laboratory Medicine 2007;45(12):1586‐9. [EMBASE: 2007598900] [DOI] [PubMed] [Google Scholar]
- Righetti M, Serbelloni P, Milani S, Ferrario G. Homocysteine‐lowering vitamin B treatment decreases cardiovascular events in hemodialysis patients. Blood Purification 2006;24(4):379‐86. [MEDLINE: ] [DOI] [PubMed] [Google Scholar]
Sanchez Alvarez 2005 {published data only}
- Sanchez Alvarez JE, Perez Tamajon L, Hernandez D, Alvarez Gonzalez A, Delgado P, Lorenzo V. Efficacy and safety of two vitamin supplement regimens on homocysteine levels in hemodialysis patients. Prospective, randomized clinical trial [Eficacia y seguridad de dos pautas de suplementos vitaminicos sobre los niveles de homocisteina en pacientes en hemodialisis. Ensayo clinico prospectivo y randomizado]. Nefrologia 2005;25(3):288‐96. [MEDLINE: ] [PubMed] [Google Scholar]
- Sanchez JE, Molina E, Vega MJ, Hernandez D, Perez L, Garcia R, et al. Sustained effect of two vitamin supplement regimens on hyperhomocysteinemia in maintenance hemodialysis (MHD) patients [abstract no: F‐PO773]. Journal of the American Society of Nephrology 2003;14(Nov):231A. [CENTRAL: CN‐00583425] [Google Scholar]
Schupp 2008 {published data only}
- Schupp N, Dette EM, Schmid U, Bahner U, Winkler M, Heidland A, et al. Benfotiamine reduces genomic damage in peripheral lymphocytes of hemodialysis patients. Naunyn‐Schmiedebergs Archives of Pharmacology 2008;378(3):283‐91. [MEDLINE: ] [DOI] [PubMed] [Google Scholar]
Sjogren 1979 {published data only}
- Sjogren U, Thysell H, Lindholm T. The influence of vitamin B6 supplementation on the bone marrow morphology in patients on regular haemodialysis treatment. A double‐blind study. Scandinavian Journal of Urology & Nephrology 1979;13(1):101‐3. [MEDLINE: ] [DOI] [PubMed] [Google Scholar]
Spoelstra 2004 {published data only}
- Spoelstra‐de MA, Brouwer CB, Terheggen F, Bollen JM, Stehouwer CD, Smulders YM. No effect of folic acid on markers of endothelial dysfunction or inflammation in patients with type 2 diabetes mellitus and mild hyperhomocysteinaemia. Netherlands Journal of Medicine 2004;62(7):246‐53. [MEDLINE: ] [PubMed] [Google Scholar]
Thambyrajah 2000 {published data only}
- Thambyrajah J, Landray MJ, McGlynn FJ, Jones HJ, Wheeler DC, Townend JN. Does folic acid decrease plasma homocysteine and improve endothelial function in patients with predialysis renal failure?. Circulation 2000;102(8):871‐5. [MEDLINE: ] [DOI] [PubMed] [Google Scholar]
- Thambyrajah J, Landray MJ, Townend JN, Wheeler DC. Folic acid decreases plasma homocysteine but does not improve endothelial function in chronic renal failure [abstract]. Journal of the American Society of Nephrology 2000;11(Sept):372A. [CENTRAL: CN‐00583252] [Google Scholar]
Tremblay 2000 {published data only}
- Tremblay R, Bonnardeaux A, Geadah D, Busque L, Lebrun M, Ouimet D, et al. Hyperhomocysteinemia in hemodialysis patients: effects of 12‐month supplementation with hydrosoluble vitamins. Kidney International 2000;58(2):851‐8. [MEDLINE: ] [DOI] [PubMed] [Google Scholar]
Tungkasereerak 2004 {published data only}
- Tungkasereerak P, Chaiyasoot W, Taruangsri P, Leowattana W, Vasuvattakul S, Vareesangthip K, et al. Can folate and vitamin B supplementation reduce total homocysteine levels and atherosclerosis in hemodialysis patients? [abstract no: SA‐PO472]. Journal of the American Society of Nephrology 2004;15(Oct):406A. [CENTRAL: CN‐00583721] [Google Scholar]
- Tungkasereerak P, Ong‐ajyooth L, Chaiyasoot W, Ong‐ajyooth S, Leowattana W, Vasuvattakul S, et al. Effect of short‐term folate and vitamin B supplementation on blood homocysteine level and carotid artery wall thickness in chronic hemodialysis patients. Journal of the Medical Association of Thailand 2006;89(8):1187‐93. [MEDLINE: ] [PubMed] [Google Scholar]
Vrentzos 2001 {published data only}
- Vrentzos G, Ganotakis E, Vardakis K, Maliaraki N, Stratigis S, Stilianou K, et al. Effect of vitamin B12 supplementation in serum total homocysteine and folate in patients with end‐stage renal failure [abstract]. Atherosclerosis Supplements 2001;2(2):107. [CENTRAL: CN‐00671820] [Google Scholar]
Weissgarten 2001 {published data only}
- Weissgarten J, Modai D, Oz D, Chen Levy Z, Cohn M, Marcus O, et al. Vitamin B(6) therapy does not improve hematocrit in hemodialysis patients supplemented with iron and erythropoietin. Nephron 2001;87(4):328‐32. [MEDLINE: ] [DOI] [PubMed] [Google Scholar]
Xu 2005a {published data only}
- Xu T, Wang XF, Qu XK, Ye HY, Huang XB, Zhang XP, et al. Treatment of hyperhomocysteinemia and endothelial dysfunction in renal‐transplant recipients with vitamin B. Chung‐Hua Wai Ko Tsa Chih [Chinese Journal of Surgery] 2005;43(14):940‐3. [MEDLINE: ] [PubMed] [Google Scholar]
- Xu T, Zhang XW, Qu XK, Ye HY, Huang XB, Zhang XP, et al. Treatment of hyperhomocysteinemia and endothelial dysfunction in renal transplant recipients with B vitamins in the Chinese population. Journal of Urology 2008;179(3):1190‐4. [MEDLINE: ] [DOI] [PubMed] [Google Scholar]
Young 2009a {published data only}
- Young DO, Cheng SC, Delmez JA, Coyne DW. The effect of oral niacinamide on plasma phosphorus levels in peritoneal dialysis patients. Peritoneal Dialysis International 2009;29(5):562‐7. [MEDLINE: ] [PubMed] [Google Scholar]
References to studies awaiting assessment
NCT00737126 {published data only}
- Lavalle FJ. Folic acid administration reduces the progression of microalbuminuria. www.clinicaltrials.gov/ct2/show/NCT00737126 (accessed 11 December 2014).
Additional references
ADA 1999
- Gavin JR III, Alberti KG, Davidson MB, DeFronzo RA, Drash A, Gabbe SG, et al. Report of the expert committee on the diagnosis and classification of diabetes mellitus. Diabetes Care 1999;22(1 Suppl):S5‐19. [EMBASE: 1999016853] [Google Scholar]
ADA 2008
- American Diabetes Association. Standards of medical care in diabetes ‐ 2008. Diabetes Care 2008;31 Suppl 1:S12‐54. [MEDLINE: ] [DOI] [PubMed] [Google Scholar]
ADA 2010
- American Diabetes Association. Standards of medical care in diabetes ‐ 2010. Diabetes Care 2010;33 Suppl 1:S11‐61. [MEDLINE: ] [DOI] [PMC free article] [PubMed] [Google Scholar]
Adler 2000
- Adler AI, Stratton IM, Neil HA, Yudkin JS, Matthews DR, Cull CA, et al. Association of systolic blood pressure with macrovascular and microvascular complications of type 2 diabetes (UKPDS 36): prospective observational study. BMJ 2000;321(7258):412‐9. [MEDLINE: ] [DOI] [PMC free article] [PubMed] [Google Scholar]
Adler 2003
- Adler AI, Stevens RJ, Manley SE, Bilous RW, Cull CA, Holman RR, et al. Development and progression of nephropathy in type 2 diabetes: the United Kingdom Prospective Diabetes Study (UKPDS 64). Kidney international 2003;63(1):225‐32. [MEDLINE: ] [DOI] [PubMed] [Google Scholar]
ADVANCE 2008
- ADVANCE Collaborative Group, Patel A, MacMahon S, Chalmers J, Neal B, Billot L, et al. Intensive blood glucose control and vascular outcomes in patients with type 2 diabetes. New England Journal of Medicine 2008;358(24):2560‐72. [MEDLINE: ] [DOI] [PubMed] [Google Scholar]
Alberti 1998
- Alberti KM, Zimmet PZ. Definition, diagnosis and classification of diabetes mellitus and its complications. Part 1: diagnosis and classification of diabetes mellitus provisional report of a WHO consultation. Diabetic Medicine 1998;15(7):539‐53. [MEDLINE: ] [DOI] [PubMed] [Google Scholar]
Alderson 2003
- Alderson NL, Chachich ME, Youssef NN, Beattie RJ, Nachtigal M, Thorpe SR, et al. The AGE inhibitor pyridoxamine inhibits lipemia and development of renal and vascular disease in Zucker obese rats. Kidney international 2003;63(6):2123‐33. [MEDLINE: ] [DOI] [PubMed] [Google Scholar]
Appel 2003
- Appel GB, Radhakrishnan J, Avram MM, DeFronzo RA, Escobar‐Jimenez F, Campos MM, et al. Analysis of metabolic parameters as predictors of risk in the RENAAL study. Diabetes Care 2003;26(5):1402‐7. [MEDLINE: ] [DOI] [PubMed] [Google Scholar]
Ayo 1991
- Ayo SH, Radnik R, Garoni JA, Troyer DA, Kreisberg JI. High glucose increases diacylglycerol mass and activates protein kinase C in mesangial cell cultures. American Journal of Physiology 1991;261(4 Pt 2):F571‐7. [MEDLINE: ] [DOI] [PubMed] [Google Scholar]
Babaei‐Jadidi 2003
- Babaei‐Jadidi R, Karachalias N, Ahmed N, Battah S, Thornalley PJ. Prevention of incipient diabetic nephropathy by high‐dose thiamine and benfotiamine. Diabetes 2003;52(8):2110‐20. [MEDLINE: ] [DOI] [PubMed] [Google Scholar]
Bakker 1997
- Bakker SJ, Heine RJ, Gans RO. Thiamine may indirectly act as an antioxidant. Diabetologia 1997; Vol. 40, issue 6:741‐2. [MEDLINE: ] [PubMed]
Bergfeld 2001
- Bergfeld R, Matsumara T, Du X, Brownlee M. Benfotiamin prevents the consequences of hyperglycemia induced mitochondrial overproduction of reactive oxygen species and experimental diabetic retinopathy [abstract]. Diabetologia 2001;44(Suppl 1):A39. [Google Scholar]
Berhane 2011
- Berhane AM, Weil EJ, Knowler WC, Nelson RG, Hanson RL. Albuminuria and estimated glomerular filtration rate as predictors of diabetic end‐stage renal disease and death. Clinical Journal of The American Society of Nephrology: CJASN 2011;6(10):2444‐51. [MEDLINE: ] [DOI] [PMC free article] [PubMed] [Google Scholar]
Bloomgarden 2008
- Bloomgarden ZT. Diabetic nephropathy. Diabetes Care 2008;31(4):823‐7. [MEDLINE: ] [DOI] [PubMed] [Google Scholar]
Bolignano 2014
- Bolignano D, Palmer SC, Navaneethan SD, Strippoli GF. Aldosterone antagonists for preventing the progression of chronic kidney disease. Cochrane Database of Systematic Reviews 2014, Issue 4. [DOI: 10.1002/14651858.CD007004.pub3] [DOI] [PubMed] [Google Scholar]
Booth 1996
- Booth AA, Khalifah RG, Hudson BG. Thiamine pyrophosphate and pyridoxamine inhibit the formation of antigenic advanced glycation end‐products: comparison with aminoguanidine. Biochemical & Biophysical Research Communications 1996;220(1):113‐9. [MEDLINE: ] [DOI] [PubMed] [Google Scholar]
Brownlee 2001
- Brownlee M. Biochemistry and molecular cell biology of diabetic complications. Nature 2001;414(6865):813‐20. [MEDLINE: ] [DOI] [PubMed] [Google Scholar]
Caramori 1999
- Caramori ML, Gross JL, Pecis M, Azevedo MJ. Glomerular filtration rate, urinary albumin excretion rate, and blood pressure changes in normoalbuminuric normotensive type 1 diabetic patients: an 8‐year follow‐up study. Diabetes Care 1999;22(9):1512‐6. [MEDLINE: ] [DOI] [PubMed] [Google Scholar]
Chaturvedi 2001
- Chaturvedi N, Fuller JH, Taskinen MR, EURODIAB PCS Group. Differing associations of lipid and lipoprotein disturbances with the macrovascular and microvascular complications of type 1 diabetes. Diabetes Care 2001;24(12):2071‐7. [MEDLINE: ] [DOI] [PubMed] [Google Scholar]
Chung 2003
- Chung SS, Ho EC, Lam KS, Chung SK. Contribution of polyol pathway to diabetes‐induced oxidative stress. Journal of the American Society of Nephrology 2003;14(8 Suppl 3):S233‐6. [MEDLINE: ] [DOI] [PubMed] [Google Scholar]
Cohen 1960
- Cohen J. A coefficient of agreement for nominal scales. Educational & Psychological Measurement 1960;20:37‐46. [Google Scholar]
Dahlquist 2001
- Dahlquist G, Stattin EL, Rudberg S. Urinary albumin excretion rate and glomerular filtration rate in the prediction of diabetic nephropathy; a long‐term follow‐up study of childhood onset type‐1 diabetic patients. Nephrology Dialysis Transplantation 2001;16(7):1382‐6. [MEDLINE: ] [DOI] [PubMed] [Google Scholar]
Dinneen 1997
- Dinneen SF, Gerstein HC. The association of microalbuminuria and mortality in non‐insulin‐dependent diabetes mellitus. A systematic overview of the literature. Archives of Internal Medicine 1997;157(13):1413‐8. [MEDLINE: ] [PubMed] [Google Scholar]
Dronavalli 2008
- Dronavalli S, Duka I, Bakris GL. The pathogenesis of diabetic nephropathy. Nature Clinical Practice Endocrinology & Metabolism 2008;4(8):444‐52. [MEDLINE: ] [DOI] [PubMed] [Google Scholar]
Du 2000
- Du XL, Edelstein D, Rossetti L, Fantus IG, Goldberg H, Ziyadeh F, et al. Hyperglycemia‐induced mitochondrial superoxide overproduction activates the hexosamine pathway and induces plasminogen activator inhibitor‐1 expression by increasing Sp1 glycosylation. Proceedings of the National Academy of Sciences of the United States of America 2000;97(22):12222‐6. [MEDLINE: ] [DOI] [PMC free article] [PubMed] [Google Scholar]
Finglas 1993
- Finglas PM. Thiamin. International Journal for Vitamin & Nutrition Research 1993;63(4):270‐4. [MEDLINE: ] [PubMed] [Google Scholar]
Fioretto 1998
- Fioretto P, Steffes MW, Sutherland DE, Goetz FC, Mauer M. Reversal of lesions of diabetic nephropathy after pancreas transplantation. New England journal of Medicine 1998;339(2):69‐75. [MEDLINE: ] [DOI] [PubMed] [Google Scholar]
Forbes 2003
- Forbes JM, Cooper ME, Oldfield MD, Thomas MC. Role of advanced glycation end products in diabetic nephropathy. Journal of the American Society of Nephrology 2003;14(8 Suppl 3):S254‐8. [MEDLINE: ] [DOI] [PubMed] [Google Scholar]
Gall 1993
- Gall MA, Nielsen FS, Smidt UM, Parving HH. The course of kidney function in type 2 (non‐insulin‐dependent) diabetic patients with diabetic nephropathy. Diabetologia 1993;36(10):1071‐8. [MEDLINE: ] [DOI] [PubMed] [Google Scholar]
Gall 1997
- Gall MA, Hougaard P, Borch‐Johnsen K, Parving HH. Risk factors for development of incipient and overt diabetic nephropathy in patients with non‐insulin dependent diabetes mellitus: prospective, observational study. BMJ 1997;314(7083):783‐8. [MEDLINE: ] [DOI] [PMC free article] [PubMed] [Google Scholar]
Goh 2008
- Goh SY, Cooper ME. Clinical review: the role of advanced glycation end products in progression and complications of diabetes. Journal of Clinical Endocrinology & Metabolism 2008;93(4):1143‐52. [MEDLINE: ] [DOI] [PubMed] [Google Scholar]
Gross 2005
- Gross JL, Azevedo MJ, Silveiro SP, Canani LH, Caramori ML, Zelmanovitz T. Diabetic nephropathy: diagnosis, prevention, and treatment. Diabetes Care 2005;28(1):164‐76. [MEDLINE: ] [DOI] [PubMed] [Google Scholar]
Hammes 2003
- Hammes HP, Du X, Edelstein D, Taguchi T, Matsumura T, Ju Q, et al. Benfotiamine blocks three major pathways of hyperglycemic damage and prevents experimental diabetic retinopathy. Nature Medicine 2003;9(3):294‐9. [MEDLINE: ] [DOI] [PubMed] [Google Scholar]
Hatfield 2005
- Hatfield J. Advanced glycation end‐products (AGEs) in hyperglycemic patients. October 2005. www.jyi.org/issue/review‐advanced‐glycation‐end‐products‐ages‐in‐hyperglycemic‐patients (accessed 23 December 2014).
Heilig 1995
- Heilig CW, Concepcion LA, Riser BL, Freytag SO, Zhu M, Cortes P. Overexpression of glucose transporters in rat mesangial cells cultured in a normal glucose milieu mimics the diabetic phenotype. Journal of Clinical Investigation 1995;96(4):1802‐14. [MEDLINE: ] [DOI] [PMC free article] [PubMed] [Google Scholar]
Higgins 2003
- Higgins JP, Thompson SG, Deeks JJ, Altman DG. Measuring inconsistency in meta‐analyses. BMJ 2003;327(7414):557‐60. [MEDLINE: ] [DOI] [PMC free article] [PubMed] [Google Scholar]
Higgins 2011
- Higgins JP, Green S (editors). Cochrane Handbook for Systematic Reviews of Interventions Version 5.1.0 (updated February 2011). The Cochrane Collaboration, 2011. Available from www.cochrane‐handbook.org.
Hovind 2003
- Hovind P, Rossing P, Tarnow L, Parving HH. Smoking and progression of diabetic nephropathy in type 1 diabetes. Diabetes Care 2003;26(3):911‐6. [MEDLINE: ] [DOI] [PubMed] [Google Scholar]
Huijberts 2008
- Huijberts MS, Schaper NC, Schalkwijk CG. Advanced glycation end products and diabetic foot disease. Diabetes/Metabolism Research Reviews 2008;24 Suppl 1:S19‐24. [MEDLINE: ] [DOI] [PubMed] [Google Scholar]
Karachalias 2003
- Karachalias N, Babaei‐Jadidi R, Ahmed N, Thornalley PJ. Accumulation of fructosyl‐lysine and advanced glycation end products in the kidney, retina and peripheral nerve of streptozotocin‐induced diabetic rats. Biochemical Society Transactions 2003;31(Pt 6):1423‐5. [MEDLINE: ] [DOI] [PubMed] [Google Scholar]
KDOQI 2007
- KDOQI. KDOQI Clinical Practice Guidelines and Clinical Practice Recommendations for Diabetes and Chronic Kidney Disease. American Journal of Kidney Diseases 2007;49(2 Suppl 2):S12‐154. [MEDLINE: ] [DOI] [PubMed] [Google Scholar]
La Selva 1996
- Selva M, Beltramo E, Pagnozzi F, Bena E, Molinatti PA, Molinatti GM, et al. Thiamine corrects delayed replication and decreases production of lactate and advanced glycation end‐products in bovine retinal and human umbilical vein endothelial cells cultured under high glucose conditions. Diabetologia 1996;39(11):1263‐8. [MEDLINE: ] [DOI] [PubMed] [Google Scholar]
Levin 2003
- Levin A. Clinical epidemiology of cardiovascular disease in chronic kidney disease prior to dialysis. Seminars in Dialysis 2003;16(2):101‐5. [MEDLINE: ] [DOI] [PubMed] [Google Scholar]
Liberati 2009
- Liberati A, Altman DG, Tetzlaff J, Mulrow C, Gøtzsche PC, Ioannidis JP, et al. The PRISMA statement for reporting systematic reviews and meta‐analyses of studies that evaluate health care interventions: explanation and elaboration. PLoS Medicine/Public Library of Science 1999;6(7):e1000100. [MEDLINE: ] [DOI] [PMC free article] [PubMed] [Google Scholar]
Marshall 2004
- Marshall SM. Recent advances in diabetic nephropathy. Postgraduate Medical Journal 2004;80(949):624‐33. [MEDLINE: ] [DOI] [PMC free article] [PubMed] [Google Scholar]
MCSG 1999
- Anonymous. Predictors of the development of microalbuminuria in patients with Type 1 diabetes mellitus: a seven‐year prospective study. The Microalbuminuria Collaborative Study Group. Diabetic Medicine 1999;16(11):918‐25. [MEDLINE: ] [PubMed] [Google Scholar]
Miettinen 1996
- Miettinen H, Haffner SM, Lehto S, Ronnemaa T, Pyorala K, Laakso M. Proteinuria predicts stroke and other atherosclerotic vascular disease events in nondiabetic and non‐insulin‐dependent diabetic subjects. Stroke 1996;27(11):2033‐9. [MEDLINE: ] [DOI] [PubMed] [Google Scholar]
Mogensen 1995
- Mogensen CE. Microalbuminuria in prediction and prevention of diabetic nephropathy in insulin‐dependent diabetes mellitus patients. Journal of Diabetes & its Complications 1995;9(4):337‐49. [MEDLINE: ] [DOI] [PubMed] [Google Scholar]
Mogensen 1999
- Mogensen CE. Drug treatment for hypertensive patients in special situations: diabetes and hypertension. Clinical & Experimental Hypertension (New York) 1999;21(5‐6):895‐906. [PUBMED: 10423111] [DOI] [PubMed] [Google Scholar]
Mollsten 2001
- Mollsten AV, Dahlquist GG, Stattin EL, Rudberg S. Higher intakes of fish protein are related to a lower risk of microalbuminuria in young Swedish type 1 diabetic patients. Diabetes Care 2001;24(5):805‐10. [MEDLINE: ] [DOI] [PubMed] [Google Scholar]
Monnier 1999
- Monnier VM, Bautista O, Kenny D, Sell DR, Fogarty J, Dahms W, et al. Skin collagen glycation, glycoxidation, and crosslinking are lower in subjects with long‐term intensive versus conventional therapy of type 1 diabetes: relevance of glycated collagen products versus HbA1c as markers of diabetic complications. DCCT Skin Collagen Ancillary Study Group. Diabetes Control and Complications Trial. Diabetes 1999;48(4):870‐80. [MEDLINE: ] [DOI] [PMC free article] [PubMed] [Google Scholar]
Nishikawa 2000
- Nishikawa T, Edelstein D, Du XL, Yamagishi S, Matsumura T, Kaneda Y, et al. Normalizing mitochondrial superoxide production blocks three pathways of hyperglycaemic damage. Nature 2000;404(6779):787‐90. [MEDLINE: ] [DOI] [PubMed] [Google Scholar]
Palmer 2008
- Palmer AJ, Valentine WJ, Chen R, Mehin N, Gabriel S, Bregman B, et al. A health economic analysis of screening and optimal treatment of nephropathy in patients with type 2 diabetes and hypertension in the USA. Nephrology Dialysis Transplantation 2008;23(4):1216‐23. [MEDLINE: ] [DOI] [PubMed] [Google Scholar]
Pecis 1994
- Pecis M, Azevedo MJ, Gross JL. Chicken and fish diet reduces glomerular hyperfiltration in IDDM patients. Diabetes Care 1994;17(7):665‐72. [MEDLINE: ] [DOI] [PubMed] [Google Scholar]
Perry 2004
- Perry CA, Renna SA, Khitun E, Ortiz M, Moriarty DJ, Caudill MA. Ethnicity and race influence the folate status response to controlled folate intakes in young women. Journal of Nutrition 2004;134(7):1786‐92. [MEDLINE: ] [DOI] [PubMed] [Google Scholar]
Ravid 1998
- Ravid M, Brosh D, Ravid‐Safran D, Levy Z, Rachmani R. Main risk factors for nephropathy in type 2 diabetes mellitus are plasma cholesterol levels, mean blood pressure, and hyperglycemia. Archives of Internal Medicine 1998;158(9):998‐1004. [MEDLINE: ] [DOI] [PubMed] [Google Scholar]
Remuzzi 1997
- Remuzzi G, Ruggenenti P, Benigni A. Understanding the nature of renal disease progression. Kidney international 1997;51(1):2‐15. [MEDLINE: ] [DOI] [PubMed] [Google Scholar]
Riley 1998
- Riley MD, Dwyer T. Microalbuminuria is positively associated with usual dietary saturated fat intake and negatively associated with usual dietary protein intake in people with insulin‐dependent diabetes mellitus. American Journal of Clinical Nutrition 1998;67(1):50‐7. [MEDLINE: ] [DOI] [PubMed] [Google Scholar]
Ritz 1999
- Ritz E, Orth SR. Nephropathy in patients with type 2 diabetes mellitus. New England Journal of Medicine 1999;341(15):1127‐33. [MEDLINE: ] [DOI] [PubMed] [Google Scholar]
Ruggenenti 1998
- Ruggenenti P, Remuzzi G. Nephropathy of type‐2 diabetes mellitus. Journal of the American Society of Nephrology 1998;9(11):2157‐69. [MEDLINE: ] [DOI] [PubMed] [Google Scholar]
Sawicki 1994
- Sawicki PT, Didjurgeit U, Muhlhauser I, Bender R, Heinemann L, Berger M. Smoking is associated with progression of diabetic nephropathy. Diabetes Care 1994;17(2):126‐31. [MEDLINE: ] [DOI] [PubMed] [Google Scholar]
Schreeb 1997
- Schreeb KH, Freudenthaler S, Vormfelde SV, Gundert‐Remy U, Gleiter CH. Comparative bioavailability of two vitamin B1 preparations: benfotiamine and thiamine mononitrate. European Journal of Clinical Pharmacology 1997; Vol. 52, issue 4:319‐20. [MEDLINE: ] [PubMed]
Silveiro 1998
- Silveiro SP, Costa LA, Beck MO, Gross JL. Urinary albumin excretion rate and glomerular filtration rate in single‐kidney type 2 diabetic patients. Diabetes Care 1998;21(9):1521‐4. [MEDLINE: ] [DOI] [PubMed] [Google Scholar]
Stratton 2000
- Stratton IM, Adler AI, Neil HA, Matthews DR, Manley SE, Cull CA, et al. Association of glycaemia with macrovascular and microvascular complications of type 2 diabetes (UKPDS 35): prospective observational study. BMJ 2000;321(7258):405‐12. [MEDLINE: ] [DOI] [PMC free article] [PubMed] [Google Scholar]
Thornalley 2005
- Thornalley PJ. The potential role of thiamine (vitamin B1) in diabetic complications. Current Diabetes Reviews 2005;1(3):287‐98. [MEDLINE: ] [DOI] [PubMed] [Google Scholar]
Thornalley 2007
- Thornalley PJ, Babaei‐Jadidi R, Al Ali H, Rabbani N, Antonysunil A, Larkin J, et al. High prevalence of low plasma thiamine concentration in diabetes linked to a marker of vascular disease. Diabetologia 2007;50(10):2164‐70. [MEDLINE: ] [DOI] [PMC free article] [PubMed] [Google Scholar]
Tilton 1992
- Tilton RG, Baier LD, Harlow JE, Smith SR, Ostrow E, Williamson JR. Diabetes‐induced glomerular dysfunction: links to a more reduced cytosolic ratio of NADH/NAD+. Kidney International 1992;41(4):778‐88. [MEDLINE: ] [DOI] [PubMed] [Google Scholar]
Toeller 1997
- Toeller M, Buyken A, Heitkamp G, Bramswig S, Mann J, Milne R, et al. Protein intake and urinary albumin excretion rates in the EURODIAB IDDM Complications Study. Diabetologia 1997;40(10):1219‐26. [MEDLINE: ] [DOI] [PubMed] [Google Scholar]
Valk 2011
- Valk EJ, Bruijn JA, Bajema IM. Diabetic nephropathy in humans: pathologic diversity. Current Opinion in Nephrology & Hypertension 2011;20(3):285‐9. [MEDLINE: ] [DOI] [PubMed] [Google Scholar]
Valmadrid 2000
- Valmadrid CT, Klein R, Moss SE, Klein BE. The risk of cardiovascular disease mortality associated with microalbuminuria and gross proteinuria in persons with older‐onset diabetes mellitus. Archives of Internal Medicine 2000;160(8):1093‐100. [MEDLINE: ] [DOI] [PubMed] [Google Scholar]
Volvert 2008
- Volvert ML, Seyen S, Piette M, Evrard B, Gangolf M, Plumier JC, et al. Benfotiamine, a synthetic S‐acyl thiamine derivative, has different mechanisms of action and a different pharmacological profile than lipid‐soluble thiamine disulfide derivatives. BMC Pharmacology 2008;8:10. [MEDLINE: ] [DOI] [PMC free article] [PubMed] [Google Scholar]
Wang 2010
- Wang H, Deng JL, Yue J, Li J, Hou YB. Prostaglandin E1 for preventing the progression of diabetic kidney disease. Cochrane Database of Systematic Reviews 2010, Issue 5. [DOI: 10.1002/14651858.CD006872.pub2] [DOI] [PubMed] [Google Scholar]
WHO 1980
- WHO Expert Committee on Diabetes Mellitus. World Health Organization. Second report. Technical Report Series 646. 1980. whqlibdoc.who.int/trs/WHO_TRS_646.pdf (accessed 12 December 2014).
WHO 1985
- WHO Expert Committee on Diabetes Mellitus. Diabetes mellitus. World Health Organization Technical Report Series 727. 1985. whqlibdoc.who.int/trs/WHO_TRS_727.pdf (accessed 12 December 2014).
Wu 2006
- Wu S, Ren J. Benfotiamine alleviates diabetes‐induced cerebral oxidative damage independent of advanced glycation end‐product, tissue factor and TNF‐alpha. Neuroscience Letters 2006;394(2):158‐62. [MEDLINE: ] [DOI] [PubMed] [Google Scholar]
Yim 2001
- Yim MB, Yim HS, Lee C, Kang SO, Chock PB. Protein glycation: creation of catalytic sites for free radical generation. Annals of the New York Academy of Sciences 2001;928:48‐53. [MEDLINE: ] [PubMed] [Google Scholar]
References to other published versions of this review
Raval 2011
- Raval AD, Gor D, Rangoonwala AN, Thakker D. Vitamin B and/or its derivatives for diabetic kidney disease. Cochrane Database of Systematic Reviews 2011, Issue 10. [DOI: 10.1002/14651858.CD009403] [DOI] [PMC free article] [PubMed] [Google Scholar]