

Abstract
Background
Results of studies investigating associations between individual endocrine-disrupting chemicals (EDCs) and incidence of uterine leiomyomata (UL), a hormone-dependent gynecological condition, have been inconsistent. However, few studies have evaluated simultaneous exposure to a mixture of EDCs with UL incidence.
Methods
We conducted a case-cohort analysis (n=708) of data from the Study of the Environment, Lifestyle and Fibroids (SELF), a prospective cohort study. Participants were aged 23–35 years at enrollment, had an intact uterus, and identified as Black or African American. We measured biomarker concentrations of 21 non-persistent EDCs, including phthalates, phenols, parabens, and triclocarban, in urine collected at baseline, 20-month, and 40-month clinic visits. We ascertained UL incidence and characteristics using ultrasounds at baseline and approximately every 20 months through 60 months. We used probit Bayesian Kernel Machine Regression (BKMR-P) to evaluate joint associations between EDC mixtures with cumulative UL incidence. We estimated the mean difference in the probit of UL incidence over the study period, adjusting for baseline age, education, years since last birth, parity, smoking status and body mass index. We converted probit estimates to odds ratios for ease of interpretation.
Results
We observed that urinary concentrations of the overall EDC mixture were inversely associated with UL incidence in the overall mixtures model, with the strongest inverse associations at the 70th percentile of all biomarkers compared with their 50th percentile (odds ratio =0.59; 95% confidence interval: 0.36, 0.96). Strongest contributors to the joint association for the mixture were bisphenol S (BPS), ethyl paraben (EPB), bisphenol F (BPF) and mono(2-ethyl-5-carboxypentyl) phthalate (MECPP), which each demonstrated inverse associations except for MECPP. There was suggestive evidence of an interaction between MECPP and EPB.
Conclusion
In this prospective ultrasound study, we observed evidence of an inverse association between the overall mixture of urinary biomarker concentrations of non-persistent EDCs with UL incidence.
Keywords: Endocrine disrupting chemicals, biomarkers, mixtures, environmental exposures, reproductive health, epidemiology
Graphical Abstract

1.1. Introduction
Endocrine disrupting chemicals (EDCs) are exogenous chemicals that interfere with hormonal regulation in the human body (NIEHS, 2022). Phthalates, parabens, and phenols are all EDCs produced at high volumes worldwide (ATSDR, 2008; EPA, 2012). These EDCs are commonly added to consumer products as preservatives, antiseptics, disinfectants, plasticizers, and antimicrobial agents (CDC, 2021; FDA, 2022; NIEHS, 2022). As such, EDCs are widely detected in human samples (ATSDR, 2008; Calafat et al., 2010; EPA, 2012; Silva et al., 2004), with routes of exposure consisting of ingestion, inhalation, and dermal absorption (NIEHS, 2022). Phthalates, parabens, and phenols have short half-lives in the body (ranging from hours to days) and are therefore considered non-persistent.
Uterine leiomyomata (UL), also known as uterine fibroids, are uterine smooth muscle neoplasms that are diagnosed in nearly 30% of reproductive aged women (Coronado et al., 2000; Stewart et al., 2017). Symptoms of UL can include pelvic pain, infertility, and heavy menstrual bleeding (Wise and Laughlin-Tommaso, 2016). UL are the leading indication of hysterectomy in the United States (Barjon and Mikhail, 2022). Given that UL are hormone-dependent neoplasms (Yang et al., 2021), research has been expanding to investigate the impact of EDC exposure on the development of UL (Lee et al., 2020; Sifakis et al., 2017; Smarr et al., 2016), though findings to date have been mixed.
Prior experimental studies have reported distinct hormonal activity among phthalates, phenols, parabens, and triclosan (Craig et al., 2013; Davis et al., 1994; Makoto Ema et al., 2000; Gray et al., 2006; Hannon and Flaws, 2015; Jarfelt et al., 2005; Lovekamp and Davis, 2001; Lovekamp-Swan and Davis, 2003; Mylchreest and Foster, 2000; Okubo et al., 2003; Pedersen et al., 2000; Pop et al., 2018; Vo et al., 2010), which could contribute to the potential individual effects of each EDC class and/or biomarker on UL. The focus of many epidemiologic studies on UL to date have been on associations with individual EDCs without evaluating potential confounding by other EDCs, rather than investigating exposure to EDC mixtures that characterize our real-world environment (Zhang et al., 2021). Additionally, many previous studies have been cross-sectional in design, examined surgical UL cases, or did not screen for UL with ultrasound, the clinical standard for diagnosis (Weuve et al., 2010; Zota et al., 2019, Kim et al., 2016; Sun et al., 2016). Research on EDCs and UL among reproductive-aged Black women is even more limited, although this population experiences greater UL symptoms and severity than other racial/ethnic groups (Baird et al., 2003; Eltoukhi et al., 2014; Huyck et al., 2008; Kjerulff et al., 1996). Our previous work assessed associations between individual phthalates, phenols, parabens, and triclocarban with UL incidence, with no strong evidence of associations (Fruh et al., 2021; Wesselink et al., 2021). In the current prospective ultrasound study, we build on this prior work by examining mixtures of urinary biomarker concentrations of phthalates, phenols, parabens, and triclocarban in relation to UL incidence among a population of reproductive-aged Black individuals using the gold standard for UL diagnosis. We additionally evaluated associations between the mixture of EDC biomarkers and UL volume.
1.2. Materials and Methods
Study population
The Study of Environment, Lifestyle, and Fibroids (SELF) is a prospective cohort of 1,693 reproductive-aged Black individuals from the Detroit, Michigan area enrolled in 2010–2012. Enrolled participants were aged 23–35 years and had an intact uterus, no previous diagnosis of UL, no history of cancer treated with chemotherapy or radiation, and no history of autoimmune disease needing medication. Participants had up to 3 follow-up visits at approximately 20 month intervals. At each visit, participants completed telephone and computer-assisted questionnaires, underwent anthropometric measurements, provided blood and urine samples, and had transvaginal ultrasound examinations. All visits occurred at Henry Ford Health clinics in Detroit, MI, USA.
We conducted a case-cohort analysis of prospectively-collected data to maximize study efficiency based on sampling, as described previously (Wesselink et al., 2021b). From the 1,308 participants who were UL-free at baseline, without regard to biomarker concentrations, we randomly selected a subcohort of 549 participants. We used all study data from these 549 participants to examine UL development over 5 years (n=130 developed UL, 23.6%). Additionally, we identified 159 incident UL cases among the participants outside of the randomly selected subcohort. The final analytic sample for this analysis was 708 participants, of whom 289 were identified as having an incident UL during the 5 years of follow-up (Figure S1).
The National Institute of Environmental Health Sciences (NIEHS), Henry Ford Health, and Boston University Medical Campus institutional review boards approved the protocol for this study. All participants provided written informed consent. The involvement of the Centers for Disease Control and Prevention (CDC) did not constitute engagement in human subjects research.
1.2.1. Urine Samples and Quantification of Chemical Biomarkers
We collected urine samples in sterile polypropylene cups at baseline and at 20, 40 and 60 months of follow-up, stored them at −80°C and then shipped the samples in batches on dry ice to the NIEHS SELF biorepository. The NIEHS stored urine samples at −80°C. We later shipped frozen samples on dry ice overnight to the CDC for quantification of urinary concentrations of biomarkers using a modification of the online solid-phase extraction coupled with isotope dilution-high-performance liquid chromatography-tandem mass spectrometry approaches described previously (Silva et al., 2013; Ye et al., 2005; Zhou et al., 2014). The NIEHS measured urinary creatinine with Beckman Coulter clinical analyzers AU400e and AU480 and Beckman Coulter reagents.
We measured concentrations of the following 26 urinary biomarkers: 1) fourteen phthalate metabolites: mono-n-butyl phthalate (MBP), mono-hydroxybutyl phthalate (MHBP), mono-isobutyl phthalate (MIBP), mono-hydroxyisobutyl phthalate (MHIBP), monobenzyl phthalate (MBZP), mono(2-ethyl-5-hydroxyhexyl) phthalate (MEHHP), mono(2-ethylhexyl) phthalate (MEHP), mono(2-ethyl-5-oxohexyl) phthalate (MEOHP), mono(2-ethyl-5-carboxypentyl) phthalate (MECPP), monoethyl phthalate (MEP), mono carboxyisooctyl phthalate (MCOP), mono-isononyl phthalate (MNP), mono carboxyisononyl phthalate (MCNP) and mono-3-carboxypropyl phthalate (MCPP); 2) four parabens: methylparaben (MBP; methyl 4-hydroxybenzoate), ethylparaben (EPB; ethyl 4-hydroxybenzoate), propylparaben (PPB; propyl 4-hydroxybenzoate), and butylparaben (BPB; butyl 4-hydroxybenzoate); 3) seven phenols: bisphenol A (BPA; 4,4′-(propane-2,2-diyl)diphenol), bisphenol F (BPF; 4,4′-dihydroxydiphenylmethane), bisphenol S (BPS; bis(4-hydroxyphenyl)sulfone), 2,4-dichlorophenol (DCP24), 2,5-dichlorophenol (DCP25), benzophenone-3 (BP3), and triclosan (TCS; 5-chloro-2-(2,4-dichlorophenoxy) phenol); and 4) an antimicrobial/antifungal agent: triclocarban (TCC; 3-(4-chlorophenyl)-1-(3,4-dichlorophenyl) urea).
We divided urinary biomarker concentrations by urinary creatinine concentrations to account for urine dilution. To better characterize exposure during the follow-up period for these EDCs with relatively short half-lives, we calculated the cumulative average of baseline, 20-month, and 40-month concentrations that occurred prior to UL diagnosis as our primary analysis, as described previously (Fruh et al., 2021). Cumulatively-averaged exposure was calculated as the geometric mean of concentrations from the baseline, 20-month, and 40-month samples. Specifically, we used biomarker concentrations from baseline for the 0–20 month interval, we averaged biomarker concentrations from baseline and 20-month follow-up visits for the 20–40 month interval, and we averaged biomarker concentrations from baseline, 20-month, and 40-month follow-up visits for the 40–60 month interval. We restricted our analysis to biomarkers detected (i.e., concentrations above the limit of detection [LOD]) in at least 60% of samples; all the previously mentioned biomarkers met this criterion. For biomarker concentrations below the LOD, we imputed values as the LOD/√2. We found high pairwise Spearman correlations in baseline measurements (r ≥ 0.90) for 6 pairs of biomarkers (MHBP-MBP [r=0.98], MECPP-MEHHP [r=0.90], MECPP-MEOHP [r=0.92], MEOHP-MEHHP [r=0.97], DCP25-DCP24 [r=1.0], MHIBP-MIBP [r=0.93]). Due to the difficulty in distinguishing concentrations in these highly correlated pairs, we selected for inclusion, among each pair, the biomarker with the highest median concentration (DCP25, MECPP, MBP, MIBP) and excluded the others (DCP24, MHBP, MEOHP, MEHHP, MHIBP), as previously described (Braun et al., 2014). Given that MECPP had the highest median concentration in each correlation pair with MEOHP and MEHHP, we excluded both MEOHP and MEHHP. We employed these methods to avoid collinearity created by high correlations between exposure variables and to reduce dimensionality in a high-dimensional exposure setting (Hubbard et al., 2019), resulting in the selection of 21 biomarkers for analyses: BPA, BPF, BP3, BPS, TCS, TCC, BPB, EPB, MPB, PPB, MBP, MBZP, MCNP, MCOP, MCPP, MECPP, MEHP, MEP, MIBP, MNP and DCP25.
1.2.2. Outcome Assessment
Participants underwent transvaginal ultrasound at the baseline clinic visit and at approximately 20, 40, and 60 months. Transvaginal ultrasounds have a high sensitivity (91%) and specificity (99%) to detect UL, compared with the gold standard of UL detection (histologic verification) (Dueholm et al., 2002). Sonographers conducting transvaginal ultrasounds had at least 3 years of experience with gynecology ultrasounds and were trained in the SELF protocol and UL assessment, with details reported previously (Baird et al., 2015). The head sonographer conducted monthly quality control based on archived images. Sonographers measured a maximum of six UL. They scanned the uterus three separate times to record the three diameter measures of each UL each time so the three volume calculations (using the ellipsoid formula) could be averaged for a final UL volume measure, as previously described (Baird et al., 2015, 2020).
As a primary analysis, we defined cumulative UL incidence as initial detection of any UL (yes vs. no) over the entire study period from baseline through 60 months. As a secondary analysis, we examined the relationship between the EDC biomarker mixture and UL size greater than or equal to 2 cubic centimeters (cc). The UL volume measure was dichotomized as ever having an individual UL ≥2 cc vs. never having an individual UL ≥ 2cc (including no UL) over the entire study period, from baseline through 60 months (Figure S2).
1.2.3. Covariate Data Collection
We collected covariate data using telephone and computer-assisted questionnaires for assessment of demographic characteristics, including baseline age, educational attainment, income, marital status, lifestyle factors and reproductive history. Technicians measured height at baseline and weight at each clinic visit, and we calculated body mass index at baseline (BMI, kg/m2).
1.2.4. Statistical Analysis
We evaluated descriptive statistics for selected covariates. A total of 23 (3.1%) participants did not have complete follow-up data on UL outcomes; we conducted a complete case analysis with respect to UL. Complete data, including concentrations for all biomarkers, were available for the 708 participants included in this analysis. Participants were followed from baseline until the diagnosis of incident UL or the occurrence of a censoring event (i.e., non-UL-related hysterectomy, loss to follow-up, or the end of follow-up), whichever came first.
In primary analyses, we used Bayesian Kernel Machine Regression (BKMR) to evaluate the joint associations of multiple chemical classes with UL cumulative incidence (Bobb et al., 2018). BKMR allows for pairwise and higher-order interactions between chemicals, and for non-linearity between exposures and outcomes. We used a probit extension of BKMR (BKMR-P), which is applicable for binary outcomes using the probit link function, to flexibly model the associations of the mixture with UL cumulative incidence. BKMR-P models the exposure-response function between urinary biomarker concentrations and a latent continuous outcome that represents UL, and estimates the difference in the probit of the probability of UL, hereafter referred to as the probit of UL (Bobb et al., 2018; Chen et al., 2022). BKMR estimates a 95% credible interval (CrI), indicating that there is 95% probability that the true association is within the given range, based on observed data and the specified model (Hespanhol et al., 2019; Lesaffre and Lawson, 2012; O’Neill, 2002). We fit BKMR-P models using a Markov Chain Monte Carlo (MCMC) algorithm (Hamra et al., 2013) with 50,000 iterations and 50% burn in, using the ‘bkmr’ R package (Bobb et al., 2018). BKMR-P models yield estimates of posterior inclusion probabilities (PIPs), which reflect the relative importance, or ranking, of each biomarker included in the mixture in relation to the health outcome. To facilitate interpretation of our findings across exposures, all urinary biomarkers were natural log-transformed and then standardized (by subtracting mean and dividing by standard deviation, on natural log scale) for model fitting. We visualized the exposure-response relationships of the EDC mixture with UL with the following plots: a) the overall association of the mixture with the outcome, represented as the estimated difference in the probit of UL, when all biomarker concentrations were fixed at 10 percentile increments (from their 10th percentiles through their 90th percentiles) vs. when all biomarker concentrations were held at their 50th percentiles; b) individual and interactive associations, denoted as the estimated difference in the probit of UL when a given biomarker concentration increased from its 25th to 75th percentiles and all other biomarker concentrations were fixed at their 25th, 50th, or 75th percentiles; and c) exposure-response functions for a given biomarker when all other biomarker concentrations were fixed at their 50th percentile. For secondary analyses on UL volume, all models were analyzed in the same way as described above for UL incidence. Further details of statistical methods for BKMR-P modeling associations can be found in the Supplementary Materials, Methods section.
Analyses were adjusted for baseline characteristics, including age at study start (years), educational attainment (≤high school/GED vs. some college or beyond), body mass index (BMI) (<25, 25–29, 30–34, ≥35 kg/m2), smoking status (current smoker vs. not current smoker), parity (one birth or more vs. nulliparous), and recent birth (less than 3 years since last birth vs. no recent births [including nulliparous]). We investigated model convergence using the R package ‘bkmrhat’ by inspecting trace plots and Gelman-Rubin convergence statistics at 30,000 iterations (Keil, 2022), and ensuring that Gelman Rubin (rhat) values obtained from bkmrhat were ≤1.05, as previously described (Keil, 2022; M. Zhang et al., 2021) and as reported in the literature (Lyall et al., 2023; M. Zhang et al., 2021). Additionally, as probit models are less common than logistic regression in the environmental health literature (Bobb et al., 2016), we converted probit estimates to odds ratios (OR) and 95% confidence intervals (CI) using an exponentiation of the previously published formula: βlogit = 1.6 * βprobit (Bobb et al., 2016, Amemiya et al., 1981). This formula was applied under the standard assumption that the probability of the outcome is not close to 0 or 1 (Bobb et al., 2016, Amemiya et al., 1981).
Given the large number of potential pairwise interactions, and that BKMR does not estimate PIPs for interactions in its current version, we applied Bayesian semiparametric regression with sparsity-inducing priors to rank pairwise interactions in the model (Antonelli et al., 2020). This approach models exposure–response associations with cubic splines to provide estimates of PIPs for pairwise interactions between biomarkers in the mixture. We used the ‘NLinteraction’ R package, with 200,000 MCMC iterations and 50% burn-in, and designated two degrees of freedom for spline models following Watanabe-Akaike information criterion (Antonelli et al., 2020). In sensitivity analyses for identified potential interactions from BKMR plots detailed above, we evaluated bivariate BKMR exposure-response plots for one biomarker at different percentiles (25th-75th) of another biomarker, to visualize potential pairwise interactions.
In another sensitivity analysis, we fit BKMR models using biomarker concentrations at baseline, rather than the cumulative average, to evaluate associations of the EDC biomarkers mixture with UL incidence allowing for a longer induction period between exposure and outcome. We performed all statistical procedures using SAS and R (version 3.5.0).
1.3. Results
The majority of participants in the analytic cohort were parous (62%) and never smoked tobacco products (74%), with educational attainment beyond high school (78%). Most participants had an annual household income of less than $50,000 (83%) and a BMI of 35 kg/m2 or greater (40%) (Table 1). These characteristics were similar to the rest of the cohort, as published previously (Bethea et al., 2020). Distributions of urinary concentrations of non-persistent EDC biomarkers are summarized in Table 2. Median concentrations among SELF individuals were similar to median concentrations among Black, Non-Hispanic individuals in the National Health and Nutrition Examination Survey (NHANES), with the exception of MEP concentrations, which were slightly lower among SELF participants (59.4 vs. 92.7 μg/g creatinine), and MCOP and BP3 concentrations, which were slightly higher in SELF participants (20.4 vs. 7.6 μg/g creatinine and 13.5 vs. 6.5 μg/g creatinine, respectively), as published previously (Bethea et al., 2020; Fruh et al., 2021; Wesselink et al., 2021a). The Spearman correlation coefficients ranged from −0.07 for MEHP-TCC to 0.82 for MNP-MCOP (Figure 1). Pairwise correlations were generally weak, but some strong positive correlations were observed. The five highest correlations were MNP-MCOP (r=0.82), MEHP-MECPP (r=0.76), PPB-MPB (r=0.61), TCS-MBZP (r=0.43) and EPB-BP3 (r=0.41).
Table 1.
Baseline characteristics of participants in the Study of Environment, Lifestyle, and Fibroids (SELF) (n=708) (2010–2012)
| Characteristics | All participants (Mean ± SD or %) |
|---|---|
| Age at Study Start (Years) | 29.0 ± 3.5 |
| Age at First Birth* (Years) | 19.0 ± 3.6 |
| Parity | |
| Nulliparous | 38.0% |
| 1 birth | 27.3% |
| 2 births | 17.2% |
| ≥3 births | 17.5% |
| Smoking Status | |
| Never | 73.5% |
| Past | 7.9% |
| Current | 18.6% |
| Alcohol Use in Last Year | |
| None | 28.8% |
| Moderate | 51.4% |
| Heavy | 19.8% |
| Education | |
| ≤High school diploma/GED | 21.6% |
| Some college/Associate’s/Technical | 51.0% |
| ≥Bachelor’s degree | 27.4% |
| Gross Annual Household Income | |
| <$20,000 | 45.6% |
| $20,000-$50,000 | 37.7% |
| >$50,000 | 16.8% |
| Body Mass Index (kg/m2) | |
| <25 | 18.8% |
| 25–29 | 21.1% |
| 30–34 | 20.1% |
| 35–39 | 16.8% |
| ≥40 | 23.3% |
Among parous women (n=439)
Table 2.
Distribution of baseline urinary concentrations of phenols, parabens, and triclocarban biomarkers among 708 SELF participants from 2010–2012 and in NHANES (2009–2010)
| SELF subcohort (2010–12) | NHANES subsample** (2009–10) | |||||
|---|---|---|---|---|---|---|
|
| ||||||
| Biomarker Concentrations (μg/g creatinine) | LOD (ng/L) | % Detect | Median | 75th %ile | Median | 75th %ile |
| Phenol Biomarkers | ||||||
| Bisphenol A (BPA) | 0.2 | 99.9 | 1.7 | 2.8 | 1.7 | 2.9 |
| Bisphenol F (BPF) | 0.2 | 65.9 | 0.3 | 1.0 | 0.4* | 1.0* |
| Bisphenol S (BPS) | 0.1 | 95.8 | 0.3 | 0.6 | 0.4* | 0.9* |
| Benzophenone-3 (BP3) | 0.4 | 99.3 | 13.5 | 47.1 | 6.5 | 23.1 |
| Triclosan (TCS) | 1.7 | 91.3 | 7.2 | 25.8 | 6.6 | 22.7 |
| Triclocarban (TCC) | 0.1 | 69.2 | 0.2 | 1.0 | <LOD* | 0.4* |
| 2,5-dichlorophenol (25 DCP) | 0.1 | 99.6 | 2.3 | 6.0 | 12.5 | 58.9 |
| Phthalate Biomarkers | ||||||
| Mono-n-butyl phthalate (MBP/MNBP) | 0.4 | 99.9 | 15.8 | 23.8 | 15.3 | 24.9 |
| Mono-isobutyl phthalate (MiBP) | 0.8 | 99.3 | 16.4 | 49.8 | 10.5 | 15.2 |
| Monobenzyl phthalate (MBZP) | 0.3 | 99.7 | 6.5 | 11.9 | 6.5 | 11.7 |
| Mono-2-ethylhexyl phthalate (MEHP) | 0.8 | 91.5 | 2.3 | 4.2 | 1.5 | 2.9 |
| Mono-2-ethyl-5-carboxypentyl phthalate (MECPP) | 0.4 | 99.9 | 15.1 | 24.3 | 14.5 | 26.3 |
| Monoethyl phthalate (MEP) | 1.2 | 100 | 59.4 | 121.9 | 92.7 | 236.0 |
| Mono carboxyisooctyl phthalate (MCOP) | 0.3 | 100 | 20.4 | 54.9 | 7.6 | 19.8 |
| Mono-isononyl phthalate (MNP/MINP) | 0.9 | 72.2 | 1.8 | 5.3 | <LOD | 1.5 |
| Mono carboxyisononyl phthalate (MCNP) | 0.2 | 99.7 | 2.8 | 5.0 | 2.5 | 4.5 |
| Mono-3-carboxypropyl phthalate (MCPP) | 0.4 | 98.0 | 2.2 | 5.6 | 2.3 | 4.1 |
| Paraben Biomarkers | ||||||
| Butylparaben (BPB) | 0.1 | 60.0 | 0.1 | 0.3 | <LOD | 0.390 |
| Ethylparaben (EPB) | 1.0 | 78.8 | 2.3 | 8.4 | 1.6 | 7.35 |
| Methylparaben (MPB) | 1.0 | 100.0 | 122.4 | 316.9 | 165.0 | 403.0 |
| Propylparaben (PPB) | 0.1 | 100.0 | 16.6 | 49.8 | 21.1 | 80.9 |
Note: LOD = limit of detection.
Black, Non-Hispanic individuals
Earliest NHANES data available: 2013/2014 data
Figure 1.
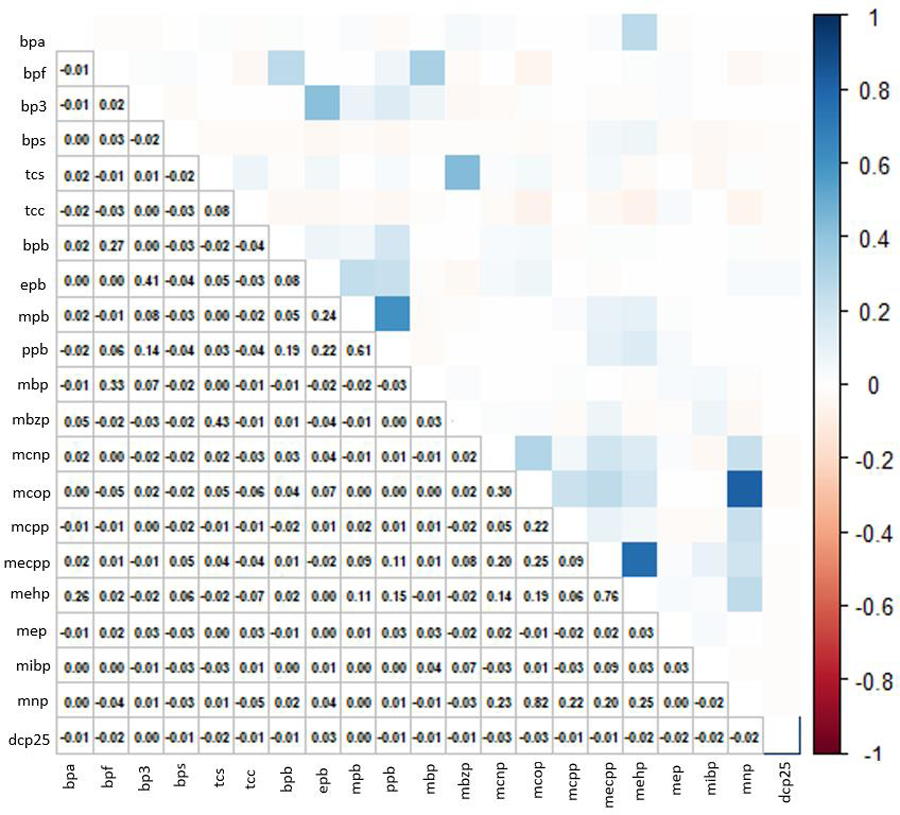
Spearman correlation matrix for log-transformed non-persistent chemical mixture, cumulatively averaged concentrations (21 chemicals). Abbreviations: Bisphenol A (BPA), Bisphenol F (BPF), Bisphenol S (BPS), Benzophenone-3 (BP3), Triclosan (TCS), Triclocarban (TCC), Butylparaben (BPB), Ethylparaben (EPB), Methylparaben (MPB), Propylparaben (PPB), Mono-n-butyl phthalate (MBP/MNBP), Mono-isobutyl phthalate (MiBP), Monobenzyl phthalate (MBZP), Mono-2-ethylhexyl phthalate (MEHP), Mono-2-ethyl-5-carboxypentyl phthalate (MECPP), Monoethyl phthalate (MEP), Mono carboxyisooctyl phthalate (MCOP), Mono-isononyl phthalate (MNP/MINP), Mono carboxyisononyl phthalate (MCNP), Mono-3-carboxypropyl phthalate (MCPP), 2,5-dichlorophenol (DCP25). (color figure)
1.3.1. Non-persistent EDC biomarker mixtures and UL
Figure 2 depicts the joint association between the EDC biomarker mixture and UL cumulative incidence, plotted as the mean difference in the probit of UL with 95% CrIs, for an incremental increase in all biomarkers compared with estimates when all biomarkers were set to their 50th percentile. We observed inverse associations between urinary concentrations of the EDC mixture and UL incidence, with the largest magnitude for the inverse association estimated when biomarker concentrations were set to their 70th percentile compared to their 50th percentile (probit of UL: −0.33, 95% CrI: −0.63, −0.03; OR: 0.59, 95% CI: 0.36, 0.96).
Figure 2.
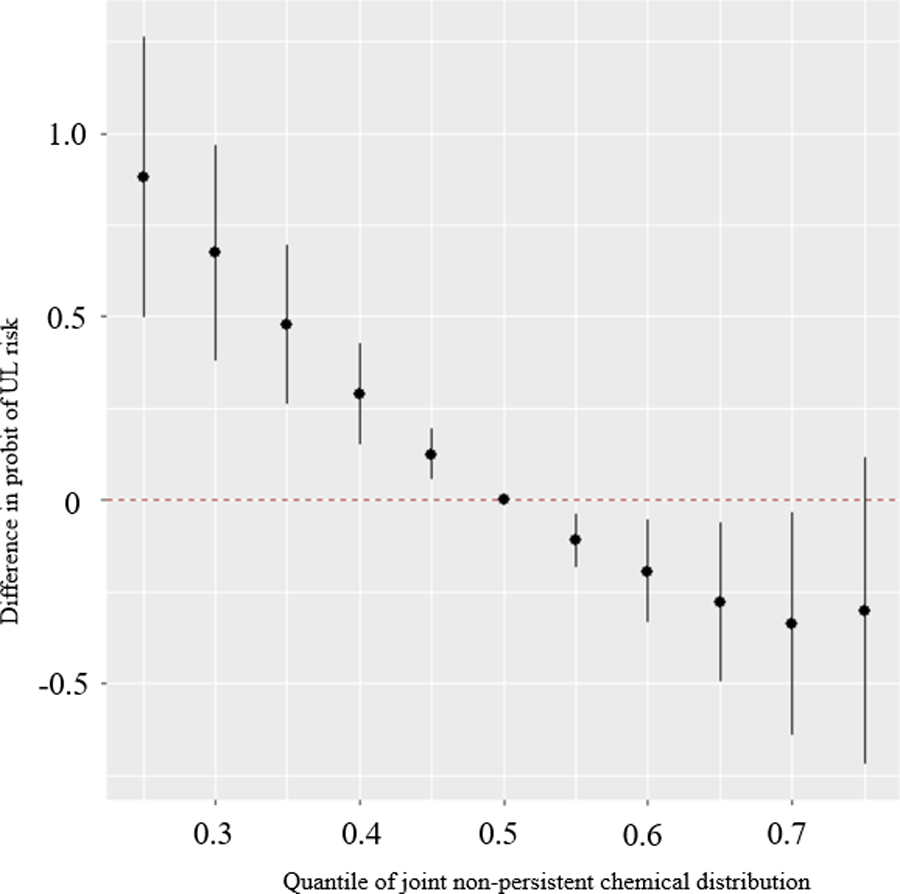
Overall association of the EDC metabolite mixture with UL (mean difference in the probit of UL and 95% credible intervals) when all chemical biomarker concentrations are at a particular quantile, compared to when all biomarker concentrations are at their 50th percentiles. Model adjusted for age, education, years since last birth, parity, smoking status, and BMI. Biomarker concentrations are ln-transformed and z-scored based on biomarker concentrations averaged over baseline, 20-month and 40-month visits. Biomarkers included in the model: Bisphenol A (BPA), Bisphenol F (BPF), Bisphenol S (BPS), Benzophenone-3 (BP3), Triclosan (TCS), Triclocarban (TCC), Butylparaben (BPB), Ethylparaben (EPB), Methylparaben (MPB), Propylparaben (PPB), Mono-n-butyl phthalate (MBP/MNBP), Mono-isobutyl phthalate (MiBP), Monobenzyl phthalate (MBZP), Mono-2-ethylhexyl phthalate (MEHP), Mono-2-ethyl-5-carboxypentyl phthalate (MECPP), Monoethyl phthalate (MEP), Mono carboxyisooctyl phthalate (MCOP), Mono-isononyl phthalate (MNP/MINP), Mono carboxyisononyl phthalate (MCNP), Mono-3-carboxypropyl phthalate (MCPP), 2,5-dichlorophenol (DCP25).
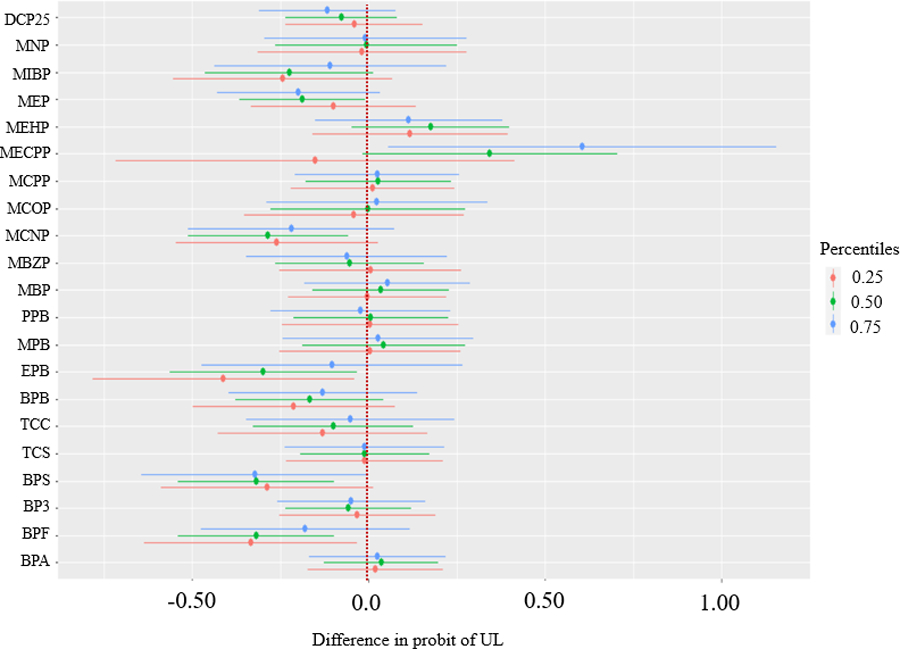
The largest PIPs were estimated for BPS (0.99), EPB (0.96), MECPP (0.95), and BPF (0.94) (Figure 3). Based on exposure biomarker-response plots, the shape of associations of individual EDCs with UL incidence appeared to be mostly inverse or null (Figure 4). Among the biomarkers with the highest PIPs, we observed suggestive inverse relationships for BPS, EPB, and BPF and the suggestion of a potential U-shaped relationship for MECPP. To evaluate individual estimates of effect and potential interactions, we examined associations for a given biomarker (for an increase from its 25th to 75th percentiles) at varying percentiles (25th, 50th, and 75th) of all other biomarker concentrations (Figure 5). When all other biomarkers were set to their 50th percentile, we observed the strongest inverse associations for individual biomarkers of BPS (probit of UL: −0.32, 95% CrI: −0.54, −0.10; OR: 0.60; 95% CI: 0.42, 0.86), EPB (probit of UL: −0.30, 95% CrI: −0.56, −0.03; OR: 0.62, 95% CI: 0.41, 0.95), and BPF (probit of UL: −0.32, 95% CrI: −0.54, −0.10; OR: 0.60, 95% CI: 0.42, 0.86). When all other biomarkers were set to their 50th percentile, we also observed strong inverse associations for MEP (probit of UL: −0.19, 95% CrI: −0.37, −0.01; OR: 0.74, 95% CI: 0.56, 0.99) and MCNP (probit of UL: −0.28, 95% CrI: −0.51, −0.06; OR: 0.63, 95% CI: 0.44, 0.91). In addition to the inverse association, we observed the suggestion of potential weak, positive associations for the exposure-response plots of MEHP, MBP and BPA (Figure 4). Associations for an increase from the 25th to 75th percentile were imprecise and generally weak for MEHP (probit of UL: 0.18, 95% CrI: −0.05, 0.40; OR: 1.32, 95% CI: 0.93, 1.89), MBP (probit of UL: 0.03, 95% CrI: −0.16, 0.23; OR: 1.06, 95% CI: 0.78, 1.44) and BPA (probit of UL: 0.04, 95% CrI: −0.13, 0.20; OR: 1.06, 95% CI: 0.82, 1.37) when all other biomarkers were set to their 50th percentile (Figure 5).
Figure 3.
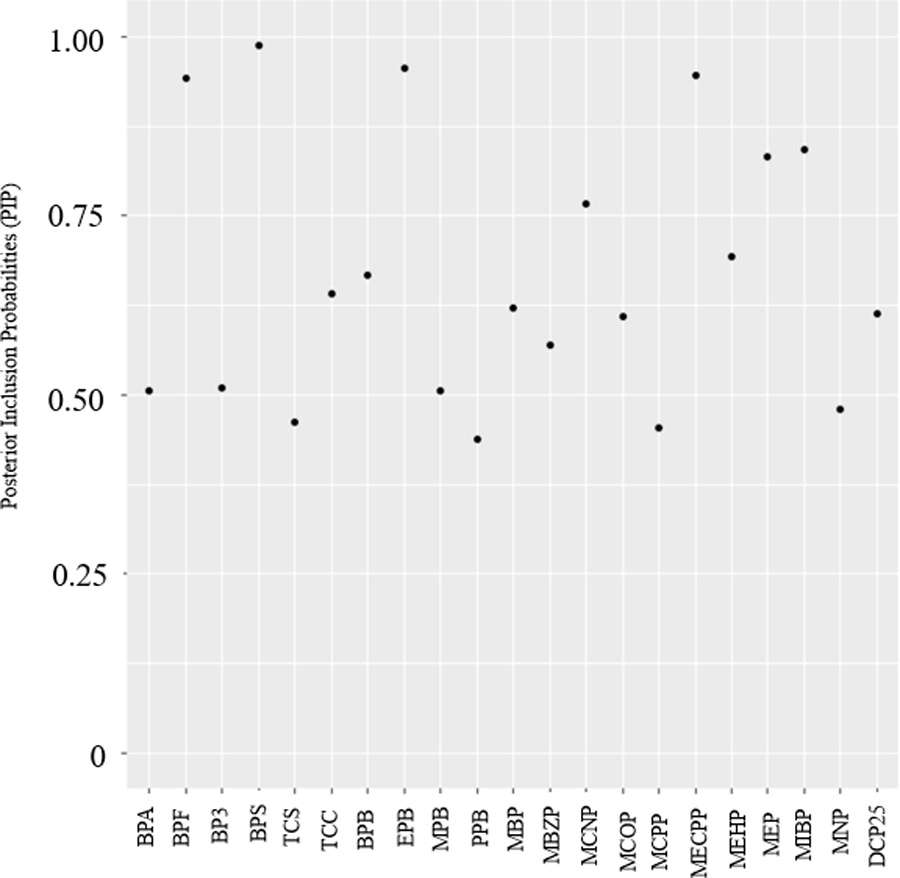
Posterior Inclusion Probabilities (PIPs) from a Probit Bayesian kernel machine regression (BKMR-P) model for associations between an EDC metabolite mixture and mean difference in the probit of UL. Biomarkers included in the model (based on metabolites averaged over baseline, 20-month and 40-month visits): Bisphenol A (BPA), Bisphenol F (BPF), Bisphenol S (BPS), Benzophenone-3 (BP3), Triclosan (TCS), Triclocarban (TCC), 2,5-dichlorophenol (25 DCP), Butylparaben (BPB), Ethylparaben (EPB), Methylparaben (MPB), Propylparaben (PPB), Mono-n-butyl phthalate (MBP/MNBP), Mono-isobutyl phthalate (MiBP), Monobenzyl phthalate (MBZP), Mono-2-ethylhexyl phthalate (MEHP), Mono-2-ethyl-5-carboxypentyl phthalate (MECPP), Monoethyl phthalate (MEP), Mono carboxyisooctyl phthalate (MCOP), Mono-isononyl phthalate (MNP/MINP), Mono carboxyisononyl phthalate (MCNP), Mono-3-carboxypropyl phthalate (MCPP).
Figure 4.
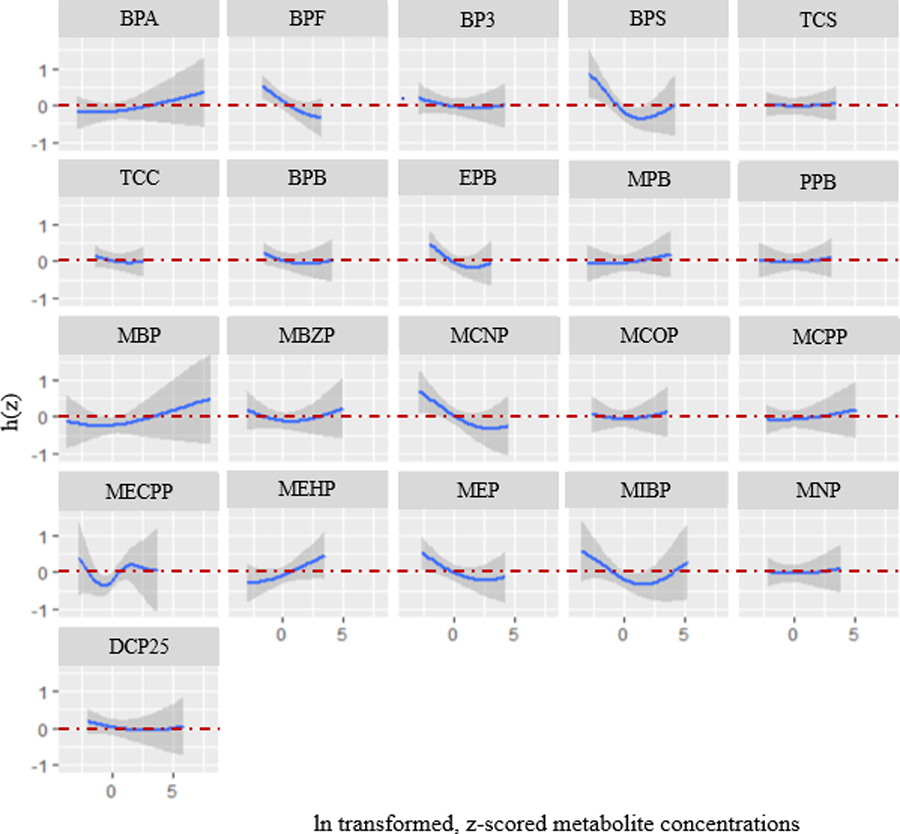
Exposure-response functions representing associations between a given biomarker concentrations and mean difference in the probit of UL (with 95% credible intervals), when all other biomarkers are at their 50th percentiles. Model adjusted for age, education, years since last birth, parity, smoking status, and BMI. Biomarker concentrations are ln-transformed and z-scored. Biomarkers included in the model (averaged over baseline, 20-month and 40-month visits): Bisphenol A (BPA), Bisphenol F (BPF), Bisphenol S (BPS), Benzophenone-3 (BP3), Triclosan (TCS), Triclocarban (TCC), 2,5-dichlorophenol (25 DCP), Butylparaben (BPB), Ethylparaben (EPB), Methylparaben (MPB), Propylparaben (PPB), Mono-n-butyl phthalate (MBP/MNBP), Mono-isobutyl phthalate (MiBP), Monobenzyl phthalate (MBZP), Mono-2-ethylhexyl phthalate (MEHP), Mono-2-ethyl-5-carboxypentyl phthalate (MECPP), Monoethyl phthalate (MEP), Mono carboxyisooctyl phthalate (MCOP), Mono-isononyl phthalate (MNP/MINP), Mono carboxyisononyl phthalate (MCNP), Mono-3-carboxypropyl phthalate (MCPP).
Figure 5.
Mean difference in the probit of UL for an increase from the 25th to 75th percentile of an individual biomarker, when all other biomarkers in the mixture are fixed to the 25th, 50th, and 75th percentiles. Model adjusted for age, education, years since last birth, parity, smoking status, and BMI. Biomarker concentrations are ln-transformed and z-scored.
In the assessment of interactions, there was little evidence for most biomarkers that associations with UL differed at varying concentrations of the mixture, with the exception of MECPP and EPB (Figure 5). For the association between MECPP and the probit of UL, which appeared non-linear in individual exposure-response plots (Figure 4), we observed a stronger positive association by IQR increase when all the other biomarkers were set to their 75th percentiles (probit of UL: 0.61, 95% CrI: 0.06, 1.16; OR: 2.63, 95% CI: 1.09, 6.35) compared to when all other biomarkers were set to their 50th (probit of UL: 0.34, 95% CrI: −0.02, 0.70; OR: 1.73, 95% CI: 0.97, 3.09) or 25th percentiles (probit of UL: −0.15, 95% CrI: −0.72, 0.41; OR: 0.79, 95% CI: 0.32, 1.94) (Figure 5). However, there was a large degree of uncertainty as the CrIs were wide. For the association between EPB and the probit of UL, we observed a stronger inverse association when all the other biomarkers were set to their 25th percentiles (probit of UL: −0.41, 95% CrI: −0.78, −0.04; OR: 0.52, 95% CI: 0.29, 0.94), compared to when all other biomarkers were set to their 50th (probit of UL: −0.30, 95% CrI: −0.56, −0.03; OR: 0.62, 95% CI: 0.41, 0.95) or 75th percentiles (probit of UL: −0.10, 95% CrI: −0.47, 0.27; OR: 0.85, 95% CI: 0.47, 1.53). Based on the NLinteraction method used to rank the importance of interaction pairs (Antonelli et al., 2020), PIPs for pairwise interactions between MECPP-EPB ranked highest (Figure S3a). For sensitivity analysis bivariate plots, we observed evidence suggesting an interaction for MECPP and EPB (Figure S4). We observed stronger inverse associations between MECPP and the probit of UL at lower quartiles (25th percentile) of EPB. Associations for EPB appeared stronger at higher quartiles (75th percentile) of MECPP, with a non-linear, u-shaped exposure-response curve (Figure S4). For bkmrhat models, MCMC chains showed good convergence across all estimated parameters. In sensitivity analyses, models that used baseline EDC biomarker concentrations only were similar to those that used the cumulative average over follow-up, though less precise.
1.3.2. Non-persistent EDC biomarker mixtures and UL volume
As a secondary analysis, we examined the relationship between the EDC biomarker mixture and UL volume ≥ 2 cc by plotting the difference in the probit of individual UL size (ever having an individual UL ≥ 2 vs. UL <2 cc or no UL over the study period) at increasing percentiles of all biomarkers, compared to their 50th percentiles. Overall, we observed an inverse association of the biomarker mixture with risk of UL ≥ 2 cc, similar to our analysis with UL incidence, though with smaller magnitudes of association (Figure S5). PIPs for BPS (0.88) and MEP (0.67) ranked highest for the association for UL ≥ 2 cc (Figure S6). Based on individual EDC exposure biomarker-response plots, most associations appeared inverse (i.e., MEP and BPS) or null (Figure S7). There was little evidence of interactions between biomarkers in the relationship with UL ≥ 2 cc, with wide CrIs (Figure S8; Figure S3b).
1.4. Discussion
We estimated the joint association of a mixture of 21 non-persistent EDC urinary biomarkers with UL incidence in a prospective ultrasound study of reproductive-aged Black participants. These EDCs are commonly found in consumer products, and their biomarkers reflect everyday exposure to a complex mixture. We found evidence of inverse associations between the overall mixture of EDC biomarker concentrations and UL incidence, with BPF, BPS, EPB, and MECPP acting as the strongest contributors to the mixture. We observed potential evidence of interactions between MECPP and EPB.
Previous studies on the associations of individual urinary biomarkers of phthalates, phenols, parabens, and triclocarban with UL in the literature have been inconclusive. Some prior epidemiologic studies reported positive associations between urinary concentrations of some phenols and odds of UL (Shen et al., 2013), while other work observed null associations for several phenols (Lee and Eata, 2022; Pollack et al., 2015; Wesselink et al., 2021b), including a previous analysis of the SELF cohort (Wesselink et al. 2021). This prior analysis in SELF found mostly weak, inverse associations between individual urinary concentrations of parabens and triclocarban and UL incidence (Wesselink et al. 2021). In contrast, a case-control study from South Korea found that urinary concentrations of ethyl paraben and 3,4-dihydroxybenzoic acid were associated with increased odds of UL (Lee et al., 2020). Likewise, research on the associations between urinary phthalate biomarkers and UL (Fruh et al., 2021; Huang et al., 2014; Kim et al., 2016; Pollack et al., 2015; Sun et al., 2016; Weuve et al., 2010;), or measures of UL size (Zota et al., 2019), together with one of our previous analyses in SELF (Fruh et al., 2021), has been inconsistent. A meta-analysis of five of these studies observed a positive association in the pooled odds of di(2-ethylhexyl phthalate (DEHP) metabolites, including MECPP and MEHP, and UL (Fu et al., 2017). Another study investigated UL among a population of women undergoing laparoscopy or laparotomy and reported no evidence of strong or precise associations between phthalate biomarkers and the odds of UL (Pollack et al., 2015). One cross-sectional study from NHANES investigating individual phthalates and self-reported, clinically diagnosed UL and found the strongest odds for the biomarkers MBP and MEHP, suggesting a positive association for MBP and an inverse association for MEHP and UL (Weuve et al., 2010). Our study findings suggested a potential weak, positive association for both the DEHP biomarker of MEHP and for MBP (although the magnitude of effect was small), while other biomarkers were held at their median. Important to note, however, is the limitation in our ability to compare our findings to other studies evaluating individual EDCs. Research examining individual EDCs has not investigated the joint effect of the overall mixture or the exposure-response functions for each EDC while accounting for other biomarkers at varying levels, as is the case for BKMR models. As described, previous studies outside of the SELF cohort have also been distinct from ours in that some have evaluated UL with cross-sectional analyses (Weuve et al., 2010; Zota et al., 2019) and case-control analysis (Kim et al., 2016; Sun et al., 2016), while others have evaluated UL at the time of surgery (Pollack et al., 2015).
Given that we were interested in examining multiple environmental contaminants jointly, we sought to build on this research by applying mixtures analyses that explore joint effects of EDC exposure. Only one prior study to our knowledge has investigated the joint effects of a mixture of EDCs (i.e., phthalates, heavy metals, equol) in association with the odds of UL (Zhang et al., 2021). In this analysis of cross-sectional NHANES data, urinary MEHP concentrations were inversely associated with UL when evaluating joint effects in BKMR models. In contrast, our results suggested a weak, positive association for MEHP and UL when all other EDC biomarkers in the mixture were set to their median. Discrepancies in these results may relate to differences in study design (cross-sectional that is limited in its ability to assess temporality of exposure and disease vs. prospective design), specific EDCs analyzed, and UL ascertainment method (self-report vs. ultrasound) between these two studies.
We observed potential evidence of interactive effects for MECPP, a metabolite of DEHP, and the rest of the mixture, although findings were imprecise. In experimental studies, phthalates, phenols, and parabens were observed to have estrogenic (Craig et al., 2013; Davis et al., 1994; Hannon and Flaws, 2015; Lovekamp and Davis, 2001; Lovekamp-Swan and Davis, 2003; Okubo et al., 2003; Pedersen et al., 2000; Vo et al., 2010), anti-estrogenic (Pop et al., 2018) or anti-androgenic activity (M. Ema et al., 2000; Gray et al., 2006; Jarfelt et al., 2005; Mylchreest et al., 1999; Mylchreest and Foster, 2000; Parks et al., 2000), which may influence the potential additive and interactive effects of a mixture of EDCs on the pituitary ovarian axis (Andersen, 1996; Andersen and Barbieri, 1995), and consequently, UL development. One recent study evaluated mechanistic pathways between phthalates and UL risk and reported that MEHHP, another metabolite of DEHP, promotes UL cell survival through activation of the aryl hydrocarbon receptor pathway (Iizuka et al., 2022). However, evidence of the pathway for MECPP was not defined.
Our study has potential limitations. Given that we evaluated biomarkers of non-persistent EDCs that have biological half-lives on the order of hours, measurement of EDCs at specific timepoints may not reflect chronic exposure over time. Exposures to non-persistent EDCs are irregular and biomarker concentrations have been shown to vary by weeks and months (Bethea et al., 2019; Cox et al., 2016; Lassen et al., 2013; Pollack et al., 2016). We measured non-persistent EDCs concentrations from repeated collections of samples at baseline, 20-month, and 40-month follow-up visits with the aim of reducing exposure measurement error. To explore potential differences in associations related to timing of exposure measurement, we evaluated a cumulative average of biomarker concentrations within our primary measures to represent EDC concentrations over time and evaluated baseline models as a sensitivity analysis to investigate associations with a longer timeframe between exposure and UL; findings were similar between analyses.
Additionally, there is limited evidence regarding the most etiologically relevant windows of exposure for UL incidence; we therefore acknowledge that we may not have assessed the most relevant exposure period. Early life exposures that occur while the uterus is forming and maturing may be important (Bariani et al., 2023; D’Aloisio et al., 2012, 2010). Among the limited number of studies that have evaluated other early life environmental exposures (e.g., diethylstilbestrol exposure, soy formula intake, and in utero exposure to cigarette smoke), the results have been inconsistent (Baird and Newbold, 2005; D’Aloisio et al., 2012, 2010; Langton et al., 2023; Wise, 2021; Wise et al., 2012, 2005). We are unaware of any studies that have measured non-persistent EDCs prenatally or in early life that have then assessed future UL development in adulthood. Many studies to date have evaluated exposures during adulthood (Kim et al., 2016; Lee and Eata, 2022; Pollack et al., 2015; Sun et al., 2016; Weuve et al., 2010; Zota et al., 2019). In this study, we utilized cumulatively-averaged measures within our statistical models to reflect exposures over months or years. Our exposure assessment is an improvement upon previous work as the repeated exposure measures, which precede UL detection, aim to represent longer-term exposure. SELF represents the only UL study to date with repeated measurements of multiple EDC biomarkers over time, and prospective ultrasound detection of fibroids in participants known to be fibroid free at baseline.
We were not able to statistically account for the case-cohort study design given that the current implementation of BKMR does not accommodate weighting. However, previous literature has demonstrated similar effect estimates between models with weighting and models without weighting in the full cohort when the size of the subcohort is sufficiently large and is approximately ~15% of the full cohort (Kulathinal et al., 2007; Onland-Moret et al., 2007). Our subcohort size is about 42% of the full cohort (549/1308). Our analysis was also not able to account for time varying covariates in a survival model since BKMR does not currently accommodate Cox proportional hazards modeling. However, our BKMR probit modeling importantly accounts for a mixture of exposures within the model and evaluates cumulative incidence of UL. Given our study population (reproductive-aged Black individuals from the Detroit, Michigan area), our analyses may also have limited generalizability; however, metabolite concentrations were similar to those of same-aged non-Hispanic Black individuals in the nationally representative NHANES. Finally, given previous evidence demonstrating adverse reproductive health effects associated with exposure to non-persistent EDCs (Basso et al., 2022; Cho et al., 2020), our results cannot be interpreted as a pathway toward UL prevention. Our study highlights the importance of future research efforts to understand specific mechanisms of chemical based endocrine disruption in humans and mechanisms of UL development.
Study strengths include the large number of EDCs across several chemical classes that allowed us to assess the joint effects of this EDC mixture and provide more extensive control for confounding by other EDCs. We were able to screen all participants for UL with transvaginal ultrasound, which has a high sensitivity (91%) and specificity (99%) relative to histologic evidence (Dueholm et al., 2002) and aids in reducing potential for outcome misclassification. This study is also one of the first to evaluate UL characteristics (e.g., UL volume). Importantly, this study is the first to prospectively evaluate the joint effects of a mixture of urinary biomarkers of phthalates, parabens, phenols and triclocarban in association with UL among a population of Black individuals, who are known to experience higher environmental exposures to non-persistent EDCs, earlier UL incidence and worse UL symptom severity (Baird et al., 2003; Eltoukhi et al., 2014; Huyck et al., 2008; Kjerulff et al., 1996; Nguyen et al., 2021).
1.5. Conclusion
In this prospective ultrasound study of reproductive-aged Black individuals, urinary biomarker concentrations of phthalates, parabens, phenols and triclocarban and their mixture were inversely associated with UL incidence overall, as estimated by probit BKMR models.
Supplementary Material
Highlights.
EDCs mixtures and UL incidence examined in a prospective ultrasound study
EDCs were widely detected among a cohort of reproductive-aged Black women
Strongest individual EDC contributors for joint associations were identified
Overall mixture of EDCs showed evidence of inverse associations with UL incidence
Potential evidence of interactions between specific EDCs
Acknowledgements:
This work was funded by research from the National Institutes of Health [R01-ES024749]. In addition, this work was supported by the Intramural Research Program of the NIH, National Institute of Environmental Health Sciences (ZIAES09013) and funds from the American Recovery and Reinvestment Act funds designated for National Institute of Health research.
Footnotes
Publisher's Disclaimer: This is a PDF file of an unedited manuscript that has been accepted for publication. As a service to our customers we are providing this early version of the manuscript. The manuscript will undergo copyediting, typesetting, and review of the resulting proof before it is published in its final form. Please note that during the production process errors may be discovered which could affect the content, and all legal disclaimers that apply to the journal pertain.
Disclaimer: The findings and conclusions in this report are those of the authors and do not necessarily represent the official position of the Centers for Disease Control and Prevention (CDC). Use of trade names is for identification only and does not imply endorsement by the CDC, the Public Health Service, or the U.S. Department of Health and Human Services.
Declaration of interests
The authors declare that they have no known competing financial interests or personal relationships that could have appeared to influence the work reported in this paper.
REFERENCES
- Andersen J, 1996. Growth factors and cytokines in uterine leiomyomas. Semin Reprod Endocrinol 14, 269–282. 10.1055/s-2007-1016336 [DOI] [PubMed] [Google Scholar]
- Andersen J, Barbieri RL, 1995. Abnormal gene expression in uterine leiomyomas. J Soc Gynecol Investig 2, 663–672. 10.1016/1071-5576(95)00021-6 [DOI] [PubMed] [Google Scholar]
- Antonelli J, Mazumdar M, Bellinger D, Christiani D, Wright R, Coull B, 2020. Estimating the health effects of environmental mixtures using Bayesian semiparametric regression and sparsity inducing priors. The Annals of Applied Statistics 14, 257–275. 10.1214/19-AOAS1307 [DOI] [Google Scholar]
- ATSDR, A. for T.S. and D.R., 2008. Toxicological Profile for Phenol [PubMed]
- Baird DD, Dunson DB, Hill MC, Cousins D, Schectman JM, 2003. High cumulative incidence of uterine leiomyoma in black and white women: ultrasound evidence. Am J Obstet Gynecol 188, 100–107. 10.1067/mob.2003.99 [DOI] [PubMed] [Google Scholar]
- Baird DD, Harmon QE, Upson K, Moore KR, Barker-Cummings C, Baker S, Cooper T, Wegienka G, 2015. A Prospective, Ultrasound-Based Study to Evaluate Risk Factors for Uterine Fibroid Incidence and Growth: Methods and Results of Recruitment. J Womens Health (Larchmt) 24, 907–915. 10.1089/jwh.2015.5277 [DOI] [PMC free article] [PubMed] [Google Scholar]
- Baird DD, Newbold R, 2005. Prenatal diethylstilbestrol (DES) exposure is associated with uterine leiomyoma development. Reprod Toxicol 20, 81–84. 10.1016/j.reprotox.2005.01.002 [DOI] [PubMed] [Google Scholar]
- Baird DD, Patchel SA, Saldana TM, Umbach DM, Cooper T, Wegienka G, Harmon QE, 2020. Uterine fibroid incidence and growth in an ultrasound-based, prospective study of young African Americans. American Journal of Obstetrics & Gynecology 223, 402.e1–402.e18. 10.1016/j.ajog.2020.02.016 [DOI] [PMC free article] [PubMed] [Google Scholar]
- Bariani MV, Cui Y-H, Ali M, Bai T, Grimm SL, Coarfa C, Walker CL, He Y-Y, Yang Q, Al-Hendy A, 2023. TGFβ signaling links early life endocrine-disrupting chemicals exposure to suppression of nucleotide excision repair in rat myometrial stem cells. Cell Mol Life Sci 80, 288. 10.1007/s00018-023-04928-z [DOI] [PMC free article] [PubMed] [Google Scholar]
- Barjon K, Mikhail LN, 2022. Uterine Leiomyomata, StatPearls [Internet]. StatPearls Publishing. [PubMed] [Google Scholar]
- Basso CG, de Araújo-Ramos AT, Martino-Andrade AJ, 2022. Exposure to phthalates and female reproductive health: A literature review. Reprod Toxicol 109, 61–79. 10.1016/j.reprotox.2022.02.006 [DOI] [PubMed] [Google Scholar]
- Bethea TN, Wesselink AK, Weuve J, McClean MD, Hauser R, Williams PL, Ye X, Calafat AM, Baird DD, Wise LA, 2020. Correlates of exposure to phenols, parabens, and triclocarban in the Study of Environment, Lifestyle and Fibroids. J Expo Sci Environ Epidemiol 30, 117–136. 10.1038/s41370-019-0114-9 [DOI] [PMC free article] [PubMed] [Google Scholar]
- Bethea TN, Wesselink AK, Weuve J, McClean MD, Hauser R, Williams PL, Ye X, Calafat AM, Baird DD, Wise LA, 2019. Correlates of exposure to phenols, parabens, and triclocarban in the Study of Environment, Lifestyle and Fibroids. Journal of Exposure Science & Environmental Epidemiology 1. 10.1038/s41370-019-0114-9 [DOI] [PMC free article] [PubMed] [Google Scholar]
- Bobb JF, Claus Henn B, Valeri L, Coull BA, 2018. Statistical software for analyzing the health effects of multiple concurrent exposures via Bayesian kernel machine regression. Environ Health 17, 67. 10.1186/s12940-018-0413-y [DOI] [PMC free article] [PubMed] [Google Scholar]
- Braun JM, Kalkbrenner AE, Just AC, Yolton K, Calafat AM, Sjödin A, Hauser R, Webster GM, Chen A, Lanphear BP, 2014. Gestational exposure to endocrine-disrupting chemicals and reciprocal social, repetitive, and stereotypic behaviors in 4- and 5-year-old children: the HOME study. Environ Health Perspect 122, 513–520. 10.1289/ehp.1307261 [DOI] [PMC free article] [PubMed] [Google Scholar]
- Calafat AM, Ye X, Wong L-Y, Bishop AM, Needham LL, 2010. Urinary concentrations of four parabens in the U.S. population: NHANES 2005–2006. Environ Health Perspect 118, 679–685. 10.1289/ehp.0901560 [DOI] [PMC free article] [PubMed] [Google Scholar]
- CDC, C. for D.C., 2021. Phthalates Factsheet | National Biomonitoring Program [WWW Document]. URL https://www.cdc.gov/biomonitoring/Phthalates_FactSheet.html (accessed 1.18.23).
- Chen W-J, Robledo C, Davis EM, Goodman JR, Xu C, Hwang J, Janitz AE, Garwe T, Calafat AM, Peck JD, 2022. Assessing urinary phenol and paraben mixtures in pregnant women with and without gestational diabetes mellitus: A case-control study. Environmental Research 214, 113897. 10.1016/j.envres.2022.113897 [DOI] [PMC free article] [PubMed] [Google Scholar]
- Cho YJ, Yun JH, Kim SJ, Kwon HY, 2020. Nonpersistent endocrine disrupting chemicals and reproductive health of women. Obstet Gynecol Sci 63, 1–12. 10.5468/ogs.2020.63.1.1 [DOI] [PMC free article] [PubMed] [Google Scholar]
- Coronado GD, Marshall LM, Schwartz SM, 2000. Complications in pregnancy, labor, and delivery with uterine leiomyomas: a population-based study. Obstet Gynecol 95, 764–769. 10.1016/s0029-7844(99)00605-5 [DOI] [PubMed] [Google Scholar]
- Cox KJ, Porucznik CA, Anderson DJ, Brozek EM, Szczotka KM, Bailey NM, Wilkins DG, Stanford JB, 2016. Exposure Classification and Temporal Variability in Urinary Bisphenol A Concentrations among Couples in Utah--The HOPE Study. Environ. Health Perspect. 124, 498–506. 10.1289/ehp.1509752 [DOI] [PMC free article] [PubMed] [Google Scholar]
- Craig ZR, Hannon PR, Wang W, Ziv-Gal A, Flaws JA, 2013. Di-n-butyl phthalate disrupts the expression of genes involved in cell cycle and apoptotic pathways in mouse ovarian antral follicles. Biol Reprod 88, 23. 10.1095/biolreprod.112.105122 [DOI] [PMC free article] [PubMed] [Google Scholar]
- D’Aloisio AA, Baird DD, DeRoo LA, Sandler DP, 2012. Early-life exposures and early-onset uterine leiomyomata in black women in the Sister Study. Environ Health Perspect 120, 406–412. 10.1289/ehp.1103620 [DOI] [PMC free article] [PubMed] [Google Scholar]
- D’Aloisio AA, Baird DD, DeRoo LA, Sandler DP, 2010. Association of intrauterine and early-life exposures with diagnosis of uterine leiomyomata by 35 years of age in the Sister Study. Environ Health Perspect 118, 375–381. 10.1289/ehp.0901423 [DOI] [PMC free article] [PubMed] [Google Scholar]
- Davis BJ, Maronpot RR, Heindel JJ, 1994. Di-(2-ethylhexyl) phthalate suppresses estradiol and ovulation in cycling rats. Toxicol Appl Pharmacol 128, 216–223. 10.1006/taap.1994.1200 [DOI] [PubMed] [Google Scholar]
- Dueholm M, Lundorf E, Hansen ES, Ledertoug S, Olesen F, 2002. Accuracy of magnetic resonance imaging and transvaginal ultrasonography in the diagnosis, mapping, and measurement of uterine myomas. American Journal of Obstetrics and Gynecology 186, 409–415. 10.1067/mob.2002.121725 [DOI] [PubMed] [Google Scholar]
- Eltoukhi HM, Modi MN, Weston M, Armstrong AY, Stewart EA, 2014. The health disparities of uterine fibroid tumors for African American women: a public health issue. Am J Obstet Gynecol 210, 194–199. 10.1016/j.ajog.2013.08.008 [DOI] [PMC free article] [PubMed] [Google Scholar]
- Ema Makoto, Miyawaki E, Kawashima K, 2000. Critical period for adverse effects on development of reproductive system in male offspring of rats given di-n-butyl phthalate during late pregnancy. Toxicology Letters 111, 271–278. 10.1016/S0378-4274(99)00192-7 [DOI] [PubMed] [Google Scholar]
- EPA, U.S.E.P.A., 2012. Phthalates Action Plan.
- FDA, F. and D.A., 2022. Parabens in Cosmetics. FDA, Center for Food Safety and Applied. [Google Scholar]
- Fruh V, Claus Henn B, Weuve J, Wesselink AK, Orta OR, Heeren T, Hauser R, Calafat AM, Williams PL, Baird DD, Wise LA, 2021. Incidence of uterine leiomyoma in relation to urinary concentrations of phthalate and phthalate alternative biomarkers: A prospective ultrasound study. Environ Int 147, 106218. 10.1016/j.envint.2020.106218 [DOI] [PMC free article] [PubMed] [Google Scholar]
- Fu Z, Zhao F, Chen K, Xu J, Li P, Xia D, Wu Y, 2017. Association between urinary phthalate metabolites and risk of breast cancer and uterine leiomyoma. Reproductive Toxicology 74, 134–142. 10.1016/j.reprotox.2017.09.009 [DOI] [PubMed] [Google Scholar]
- Gray LE, Laskey J, Ostby J, 2006. Chronic di-n-butyl phthalate exposure in rats reduces fertility and alters ovarian function during pregnancy in female Long Evans hooded rats. Toxicol Sci 93, 189–195. 10.1093/toxsci/kfl035 [DOI] [PubMed] [Google Scholar]
- Hamra G, MacLehose R, Richardson D, 2013. Markov Chain Monte Carlo: an introduction for epidemiologists. International Journal of Epidemiology 42, 627–634. 10.1093/ije/dyt043 [DOI] [PMC free article] [PubMed] [Google Scholar]
- Hannon PR, Flaws JA, 2015. The effects of phthalates on the ovary. Front Endocrinol (Lausanne) 6, 8. 10.3389/fendo.2015.00008 [DOI] [PMC free article] [PubMed] [Google Scholar]
- Hespanhol L, Vallio CS, Costa LM, Saragiotto BT, 2019. Understanding and interpreting confidence and credible intervals around effect estimates. Braz J Phys Ther 23, 290–301. 10.1016/j.bjpt.2018.12.006 [DOI] [PMC free article] [PubMed] [Google Scholar]
- Huang P-C, Li W-F, Liao P-C, Sun C-W, Tsai E-M, Wang S-L, 2014. Risk for estrogen-dependent diseases in relation to phthalate exposure and polymorphisms of CYP17A1 and estrogen receptor genes. Environ Sci Pollut Res 21, 13964–13973. 10.1007/s11356-014-3260-6 [DOI] [PubMed] [Google Scholar]
- Hubbard A, Trostle J, Cangemi I, Eisenberg JNS, 2019. Countering the Curse of Dimensionality: Exploring data-generating mechanisms through participant observation and mechanistic modeling. Epidemiology 30, 609–614. 10.1097/EDE.0000000000001025 [DOI] [PMC free article] [PubMed] [Google Scholar]
- Huyck KL, Panhuysen CIM, Cuenco KT, Zhang J, Goldhammer H, Jones ES, Somasundaram P, Lynch AM, Harlow BL, Lee H, Stewart EA, Morton CC, 2008. The impact of race as a risk factor for symptom severity and age at diagnosis of uterine leiomyomata among affected sisters. Am J Obstet Gynecol 198, 168.e1–9. 10.1016/j.ajog.2007.05.038 [DOI] [PMC free article] [PubMed] [Google Scholar]
- Iizuka T, Yin P, Zuberi A, Kujawa S, Coon JS, Björvang RD, Damdimopoulou P, Pacyga DC, Strakovsky RS, Flaws JA, Bulun SE, 2022. Mono-(2-ethyl-5-hydroxyhexyl) phthalate promotes uterine leiomyoma cell survival through tryptophan-kynurenine-AHR pathway activation. Proc Natl Acad Sci U S A 119, e2208886119. 10.1073/pnas.2208886119 [DOI] [PMC free article] [PubMed] [Google Scholar]
- Jarfelt K, Dalgaard M, Hass U, Borch J, Jacobsen H, Ladefoged O, 2005. Antiandrogenic effects in male rats perinatally exposed to a mixture of di(2-ethylhexyl) phthalate and di(2-ethylhexyl) adipate. Reproductive Toxicology 19, 505–515. 10.1016/j.reprotox.2004.11.005 [DOI] [PubMed] [Google Scholar]
- Keil A, 2022. bkmrhat: Parallel Chain Tools for Bayesian Kernel Machine Regression.
- Kim YA, Kho Y, Chun KC, Koh JW, Park JW, Bunderson-Schelvan M, Cho YH, 2016. Increased Urinary Phthalate Levels in Women with Uterine Leiomyoma: A Case-Control Study. International Journal of Environmental Research and Public Health 13, 1247. 10.3390/ijerph13121247 [DOI] [PMC free article] [PubMed] [Google Scholar]
- Kjerulff KH, Langenberg P, Seidman JD, Stolley PD, Guzinski GM, 1996. Uterine leiomyomas. Racial differences in severity, symptoms and age at diagnosis. J Reprod Med 41, 483–490. [PubMed] [Google Scholar]
- Kulathinal S, Karvanen J, Saarela O, Kuulasmaa K, 2007. Case-cohort design in practice – experiences from the MORGAM Project. Epidemiol Perspect Innov 4, 15. 10.1186/1742-5573-4-15 [DOI] [PMC free article] [PubMed] [Google Scholar]
- Langton CR, Harmon QE, Upson K, Baird DD, 2023. Soy-Based Infant Formula Feeding and Uterine Fibroid Development in a Prospective Ultrasound Study of Black/African-American Women. Environ Health Perspect 131, 17006. 10.1289/EHP11089 [DOI] [PMC free article] [PubMed] [Google Scholar]
- Lassen TH, Frederiksen H, Jensen TK, Petersen JH, Main KM, Skakkebæk NE, Jørgensen N, Kranich SK, Andersson A-M, 2013. Temporal variability in urinary excretion of bisphenol A and seven other phenols in spot, morning, and 24-h urine samples. Environmental Research 126, 164–170. 10.1016/j.envres.2013.07.001 [DOI] [PubMed] [Google Scholar]
- Lee AW, Eata V, 2022. Association of environmental phenols with endometriosis and uterine leiomyoma: An analysis of NHANES, 2003–2006. Reproductive Toxicology 113, 30–34. 10.1016/j.reprotox.2022.08.003 [DOI] [PubMed] [Google Scholar]
- Lee G, Kim S, Bastiaensen M, Malarvannan G, Poma G, Caballero Casero N, Gys C, Covaci A, Lee S, Lim J-E, Mok S, Moon H-B, Choi G, Choi K, 2020. Exposure to organophosphate esters, phthalates, and alternative plasticizers in association with uterine fibroids. Environ Res 189, 109874. 10.1016/j.envres.2020.109874 [DOI] [PubMed] [Google Scholar]
- Lesaffre E, Lawson AB, 2012. Bayesian Biostatistics. John Wiley & Sons. [Google Scholar]
- Lovekamp TN, Davis BJ, 2001. Mono-(2-ethylhexyl) phthalate suppresses aromatase transcript levels and estradiol production in cultured rat granulosa cells. Toxicol Appl Pharmacol 172, 217–224. 10.1006/taap.2001.9156 [DOI] [PubMed] [Google Scholar]
- Lovekamp-Swan T, Davis BJ, 2003. Mechanisms of phthalate ester toxicity in the female reproductive system. Environ Health Perspect 111, 139–145. [DOI] [PMC free article] [PubMed] [Google Scholar]
- Lyall K, Rando J, Wang S, Hamra GB, Chavarro J, Weisskopf MG, Croen LA, Fallin MD, Hertz-Picciotto I, Volk HE, Schmidt RJ, Newschaffer CJ, 2023. Examining Prenatal Dietary Factors in Association with Child Autism-Related Traits Using a Bayesian Mixture Approach: Results from 2 United States Cohorts. Current Developments in Nutrition 7, 101978. 10.1016/j.cdnut.2023.101978 [DOI] [PMC free article] [PubMed] [Google Scholar]
- Mylchreest E, Foster PM, 2000. DBP exerts its antiandrogenic activity by indirectly interfering with androgen signaling pathways. Toxicol Appl Pharmacol 168, 174–175. 10.1006/taap.2000.9031 [DOI] [PubMed] [Google Scholar]
- Mylchreest E, Sar M, Cattley RC, Foster PMD, 1999. Disruption of Androgen-Regulated Male Reproductive Development by Di(n-Butyl) Phthalate during Late Gestation in Rats Is Different from Flutamide. Toxicology and Applied Pharmacology 156, 81–95. 10.1006/taap.1999.8643 [DOI] [PubMed] [Google Scholar]
- NIEHS, N.I. of E.H.S., 2022. Endocrine Disruptors [WWW Document]. URL https://www.niehs.nih.gov/health/topics/agents/endocrine/index.cfm (accessed 1.18.23).
- Okubo T, Suzuki T, Yokoyama Y, Kano K, Kano I, 2003. Estimation of estrogenic and anti-estrogenic activities of some phthalate diesters and monoesters by MCF-7 cell proliferation assay in vitro. Biol Pharm Bull 26, 1219–1224. 10.1248/bpb.26.1219 [DOI] [PubMed] [Google Scholar]
- O’Neill PD, 2002. A tutorial introduction to Bayesian inference for stochastic epidemic models using Markov chain Monte Carlo methods. Math Biosci 180, 103–114. 10.1016/s0025-5564(02)00109-8 [DOI] [PubMed] [Google Scholar]
- Onland-Moret NC, van der A DL, van der Schouw YT, Buschers W, Elias SG, van Gils CH, Koerselman J, Roest M, Grobbee DE, Peeters PHM, 2007. Analysis of case-cohort data: A comparison of different methods. Journal of Clinical Epidemiology 60, 350–355. 10.1016/j.jclinepi.2006.06.022 [DOI] [PubMed] [Google Scholar]
- Parks LG, Ostby JS, Lambright CR, Abbott BD, Klinefelter GR, Barlow NJ, Gray LE, 2000. The plasticizer diethylhexyl phthalate induces malformations by decreasing fetal testosterone synthesis during sexual differentiation in the male rat. Toxicol Sci 58, 339–349. 10.1093/toxsci/58.2.339 [DOI] [PubMed] [Google Scholar]
- Pedersen KL, Pedersen SN, Christiansen LB, Korsgaard B, Bjerregaard P, 2000. The Preservatives Ethyl-, Propyl- and Butylparaben are Oestrogenic in an in vivo Fish Assay. Pharmacology & Toxicology 86, 110–113. 10.1034/j.1600-0773.2000.pto860303.x [DOI] [PubMed] [Google Scholar]
- Pollack A, Buck Louis G, Chen Z, Sun L, Trabert B, Guo Y, Kannan K, 2015. Bisphenol A, benzophenone-type ultraviolet filters, and phthalates in relation to uterine leiomyoma. Environ Res 137, 101–107. 10.1016/j.envres.2014.06.028 [DOI] [PMC free article] [PubMed] [Google Scholar]
- Pollack AZ, Perkins NJ, Sjaarda L, Mumford SL, Kannan K, Philippat C, Wactawski-Wende J, Schisterman EF, 2016. Variability and exposure classification of urinary phenol and paraben metabolite concentrations in reproductive-aged women. Environmental Research 151, 513–520. 10.1016/j.envres.2016.08.016 [DOI] [PMC free article] [PubMed] [Google Scholar]
- Pop A, Drugan T, Gutleb AC, Lupu D, Cherfan J, Loghin F, Kiss B, 2018. Estrogenic and anti-estrogenic activity of butylparaben, butylated hydroxyanisole, butylated hydroxytoluene and propyl gallate and their binary mixtures on two estrogen responsive cell lines (T47D-Kbluc, MCF-7). Journal of Applied Toxicology 38, 944–957. 10.1002/jat.3601 [DOI] [PubMed] [Google Scholar]
- Shen Y, Xu Q, Xu J, Ren ML, Cai YL, 2013. Environmental exposure and risk of uterine leiomyoma: an epidemiologic survey. Eur Rev Med Pharmacol Sci 17, 3249–3256. [PubMed] [Google Scholar]
- Sifakis S, Androutsopoulos VP, Tsatsakis AM, Spandidos DA, 2017. Human exposure to endocrine disrupting chemicals: effects on the male and female reproductive systems. Environ Toxicol Pharmacol 51, 56–70. 10.1016/j.etap.2017.02.024 [DOI] [PubMed] [Google Scholar]
- Silva MJ, Barr DB, Reidy JA, Malek NA, Hodge CC, Caudill SP, Brock JW, Needham LL, Calafat AM, 2004. Urinary levels of seven phthalate metabolites in the U.S. population from the National Health and Nutrition Examination Survey (NHANES) 1999–2000. Environ Health Perspect 112, 331–338. [DOI] [PMC free article] [PubMed] [Google Scholar]
- Silva MJ, Jia T, Samandar E, Preau JL, Calafat AM, 2013. Environmental exposure to the plasticizer 1,2-cyclohexane dicarboxylic acid, diisononyl ester (DINCH) in U.S. adults (2000–2012). Environ. Res 126, 159–163. 10.1016/j.envres.2013.05.007 [DOI] [PMC free article] [PubMed] [Google Scholar]
- Smarr MM, Kannan K, Buck Louis GM, 2016. Endocrine disrupting chemicals and endometriosis. Fertil Steril 106, 959–966. 10.1016/j.fertnstert.2016.06.034 [DOI] [PubMed] [Google Scholar]
- Stewart E, Cookson C, Gandolfo R, Schulze-Rath R, 2017. Epidemiology of uterine fibroids: a systematic review. BJOG: An International Journal of Obstetrics & Gynaecology 124, 1501–1512. 10.1111/1471-0528.14640 [DOI] [PubMed] [Google Scholar]
- Sun J, Zhang M-R, Zhang L-Q, Zhao D, Li S-G, Chen B, 2016. Phthalate monoesters in association with uterine leiomyomata in Shanghai. International Journal of Environmental Health Research 26, 306–316. 10.1080/09603123.2015.1111310 [DOI] [PubMed] [Google Scholar]
- Vo TTB, Yoo Y-M, Choi K-C, Jeung E-B, 2010. Potential estrogenic effect(s) of parabens at the prepubertal stage of a postnatal female rat model. Reproductive Toxicology 29, 306–316. 10.1016/j.reprotox.2010.01.013 [DOI] [PubMed] [Google Scholar]
- Wesselink AK, Fruh V, Hauser R, Weuve J, Taylor KW, Orta OR, Claus Henn B, Bethea TN, McClean MD, Williams PL, Calafat AM, Baird DD, Wise LA, 2021a. Correlates of urinary concentrations of phthalate and phthalate alternative metabolites among reproductive-aged Black women from Detroit, Michigan. J Expo Sci Environ Epidemiol 31, 461–475. 10.1038/s41370-020-00270-9 [DOI] [PMC free article] [PubMed] [Google Scholar]
- Wesselink AK, Weuve J, Fruh V, Bethea TN, Claus Henn B, Harmon QE, Hauser R, Williams PL, Calafat AM, McClean M, Baird DD, Wise LA, 2021b. Urinary concentrations of phenols, parabens, and triclocarban in relation to uterine leiomyomata incidence and growth. Fertility and Sterility 116, 1590–1600. 10.1016/j.fertnstert.2021.07.003 [DOI] [PMC free article] [PubMed] [Google Scholar]
- Weuve J, Hauser R, Calafat AM, Missmer SA, Wise LA, 2010. Association of exposure to phthalates with endometriosis and uterine leiomyomata: findings from NHANES, 1999–2004. Environ Health Perspect 118, 825–832. 10.1289/ehp.0901543 [DOI] [PMC free article] [PubMed] [Google Scholar]
- Wise LA, 2021. Environmental Chemicals and Risk of Uterine Leiomyomata., in: Uterine Leiomyomata Routledge/CRC Press. [Google Scholar]
- Wise LA, Laughlin-Tommaso SK, 2016. Epidemiology of Uterine Fibroids – From Menarche to Menopause. Clin Obstet Gynecol 59, 2–24. 10.1097/GRF.0000000000000164 [DOI] [PMC free article] [PubMed] [Google Scholar]
- Wise LA, Palmer JR, Rowlings K, Kaufman RH, Herbst AL, Noller KL, Titus-Ernstoff L, Troisi R, Hatch EE, Robboy SJ, 2005. Risk of benign gynecologic tumors in relation to prenatal diethylstilbestrol exposure. Obstet Gynecol 105, 167–173. 10.1097/01.AOG.0000147839.74848.7c [DOI] [PubMed] [Google Scholar]
- Wise LA, Radin RG, Palmer JR, Rosenberg L, 2012. Association of intrauterine and early life factors with uterine leiomyomata in black women. Ann Epidemiol 22, 847–854. 10.1016/j.annepidem.2012.09.006 [DOI] [PMC free article] [PubMed] [Google Scholar]
- Yang Q, Ciebiera M, Bariani MV, Ali M, Elkafas H, Boyer TG, Al-Hendy A, 2021. Comprehensive Review of Uterine Fibroids: Developmental Origin, Pathogenesis, and Treatment. Endocr Rev 43, 678–719. 10.1210/endrev/bnab039 [DOI] [PMC free article] [PubMed] [Google Scholar]
- Ye X, Kuklenyik Z, Needham LL, Calafat AM, 2005. Automated On-Line Column-Switching HPLC-MS/MS Method with Peak Focusing for the Determination of Nine Environmental Phenols in Urine. Anal. Chem 77, 5407–5413. 10.1021/ac050390d [DOI] [PubMed] [Google Scholar]
- Zhang M, Liu T, Wang G, Buckley JP, Guallar E, Hong X, Wang M-C, Wills -Karp Marsha, Wang X, Mueller NT, 2021. In Utero Exposure to Heavy Metals and Trace Elements and Childhood Blood Pressure in a U.S. Urban, Low-Income, Minority Birth Cohort. Environmental Health Perspectives 129, 067005. 10.1289/EHP8325 [DOI] [PMC free article] [PubMed] [Google Scholar]
- Zhang Y, Lu Y, Ma H, Xu Q, Wu X, 2021. Combined Exposure to Multiple Endocrine Disruptors and Uterine Leiomyomata and Endometriosis in US Women. Front Endocrinol (Lausanne) 12, 726876. 10.3389/fendo.2021.726876 [DOI] [PMC free article] [PubMed] [Google Scholar]
- Zhou F, Zhang L, Liu A, Shen Y, Yuan J, Yu X, Feng X, Xu Q, Cheng C, 2013. Measurement of phenolic environmental estrogens in human urine samples by HPLC-MS/MS and primary discussion the possible linkage with uterine leiomyoma. J Chromatogr B Analyt Technol Biomed Life Sci 938, 80–85. 10.1016/j.jchromb.2013.08.032 [DOI] [PubMed] [Google Scholar]
- Zhou X, Kramer JP, Calafat AM, Ye X, 2014. Automated on-line column-switching high performance liquid chromatography isotope dilution tandem mass spectrometry method for the quantification of bisphenol A, bisphenol F, bisphenol S, and 11 other phenols in urine. Journal of Chromatography B 944, 152–156. 10.1016/j.jchromb.2013.11.009 [DOI] [PubMed] [Google Scholar]
- Zota AR, Geller RJ, Calafat AM, Marfori CQ, Baccarelli AA, Moawad GN, 2019. Phthalates exposure and uterine fibroid burden among women undergoing surgical treatment for fibroids: a preliminary study. Fertility and Sterility 111, 112–121. 10.1016/j.fertnstert.2018.09.009 [DOI] [PMC free article] [PubMed] [Google Scholar]
Associated Data
This section collects any data citations, data availability statements, or supplementary materials included in this article.