

Abstract
Protein structure has been well established to play a key role in determining function; however, intrinsically disordered proteins and regions (IDPs and IDRs) defy this paradigm. IDPs and IDRs exist as an ensemble of structures rather than a stable 3D structure yet play essential roles in many cell-signaling processes. Nearly all Ras superfamily GTPases are tethered to membranes by a lipid tail at the end of a flexible IDR. The sequence of the IDR is a key determinant of membrane localization, and interaction between the IDR and the membrane has been shown to affect signaling in RAS proteins through the modulation of dynamic membrane organization. Here, we utilized atomistic molecular dynamics simulations to study the membrane interaction, conformational dynamics, and lipid sorting of three IDRs from small GTPases Rheb, RhoA, and DiRas3 in model membranes representing their physiological target membranes. We found that complementarity between the lipidated IDR sequence and target membrane lipid composition is a determinant of conformational plasticity. We also show that electrostatic interactions between anionic lipids and basic residues on IDRs are correlated with sampling of semistable conformational substates, and lack of these interactions is associated with greater conformational diversity. Finally, we show that small GTPase IDRs with a polybasic domain alter local lipid composition by segregating anionic lipids and, in some cases, excluding other lipids from their immediate vicinity in favor of anionic lipids.
Graphical Abstract

INTRODUCTION
Intrinsically disordered regions (IDRs) of proteins are characterized by functionally relevant rapid transitions among structural ensembles.1,2 IDRs are most common in proteins involved in signal transduction pathways and membrane binding.3,4 One example of membrane proteins in which IDRs are indispensable for function is the RAS superfamily of small GTPases. RAS GTPases are ubiquitously expressed in mammalian cells and mediate diverse cell-signaling pathways including the MAPK pathway.5 Small GTPases are active when GTP-bound and inactive when GTP is hydrolyzed to GDP.6–8 Dysregulation of this GTPase cycle due to mutation or overexpression leads to many diseases including cancer and developmental disorders.9,10 The structure of small GTPases is characterized by a highly conserved globular catalytic domain that is tethered to a target membrane by a hypervariable myristoylated N- or prenylated C-terminal IDR.11,12
In addition to prenly or myristoyl lipid modification, the IDR of small GTPases often contains a secondary membrane targeting motif such as a polybasic domain (PBD), an amphipathic helix, or additional lipid modification(s) near the site of penylation or myristoylation. The interplay between these membrane targeting signals and the structural plasticity of the IDR determine cellular localization and lipid selectivity,13–15 as well as membrane orientation dynamics.16–18 Membrane reorientation is functionally relevant as certain orientations can be deficient in signaling due to the occlusion of key effector interacting loop regions by the membrane. Moreover, we have shown previously that the lipid anchor of KRAS, one of the three RAS isoforms in humans, engages in electrostatic interactions with anionic lipids to stabilize specific conformational substates.19,20 These observations highlight how lipidated IDRs play important roles in the signaling function of small GTPases on membrane surfaces.
Despite this progress, more work is required to elucidate all of the shared and unique features of the many diverse lipidated IDRs and how they engage lipids in their respective target membranes. Are there unifying principles underlying the organization of IDR-containing lipidated proteins at the membrane surfaces? As part of a broader effort toward addressing this fundamental question, we conducted microsecond-scale (~35 μs aggregate time) atomistic molecular dynamics (MD) simulations of the lipid anchors of three small GTPases from the RAS superfamily: Rheb, RhoA, and DiRas3. Since these proteins differ in cellular location and function, the simulations were conducted in bilayers modeling the presumed target membrane of each protein: RhoA and DiRas3 are primarily localized at the plasma membrane, while Rheb is predominantly found at the endoplasmic reticulum (ER). Rheb regulates cell growth and proliferation by activating the mammalian target of rapamycin complex 1 (mTORC1),21,22 RhoA regulates cytoskeleton actin organization,23 and DiRas3 suppresses tumor growth24 likely by disrupting KRAS signaling on the plasma membrane (PM).25 The three membrane anchors also differ in lipid modification: Rheb and RhoA are C-terminally prenylated, while DiRas3 is N-terminally myristoylated. The membrane anchors we studied thus represent lipidated IDRs of distinct sequence, structure, and target membranes that have potentially unique functional consequences. We show that these IDRs share structural plasticity and preferential interactions with specific lipid species but diverge in their ability to sample a defined set of conformational substates that are stabilized by selective interactions with lipids.
METHODS
Initial Peptide Structure and System Construction.
The amino acid sequence, lipid modification, and initial structure of the C-terminally prenylated lipid anchors of Rheb and RhoA as well as the N-terminally myristoylated membrane anchor of DiRas3 (DNTE) are shown in Figure 1. No experimental structure is available for these peptides, but they are expected to be largely unstructured except for DNTE, which was found to have ~14% helical content in solution using circular dichroism (CD) spectroscopy.25 Therefore, the 11-residue-long Rheb and RhoA were modeled as random coils, and the starting structure for DNTE was prepared as described in the SI. These initial structures were attached to a bilayer by manually inserting at least 5 carbon atoms of the myristic or prenyl lipid tail in the hydrophobic core of one leaflet, as described previously.20 Each peptide-bilayer system was then solvated with TIP3P waters26 and neutralized by adding Na+ ions, resulting in the simulation systems listed in Table 1.
Figure 1.
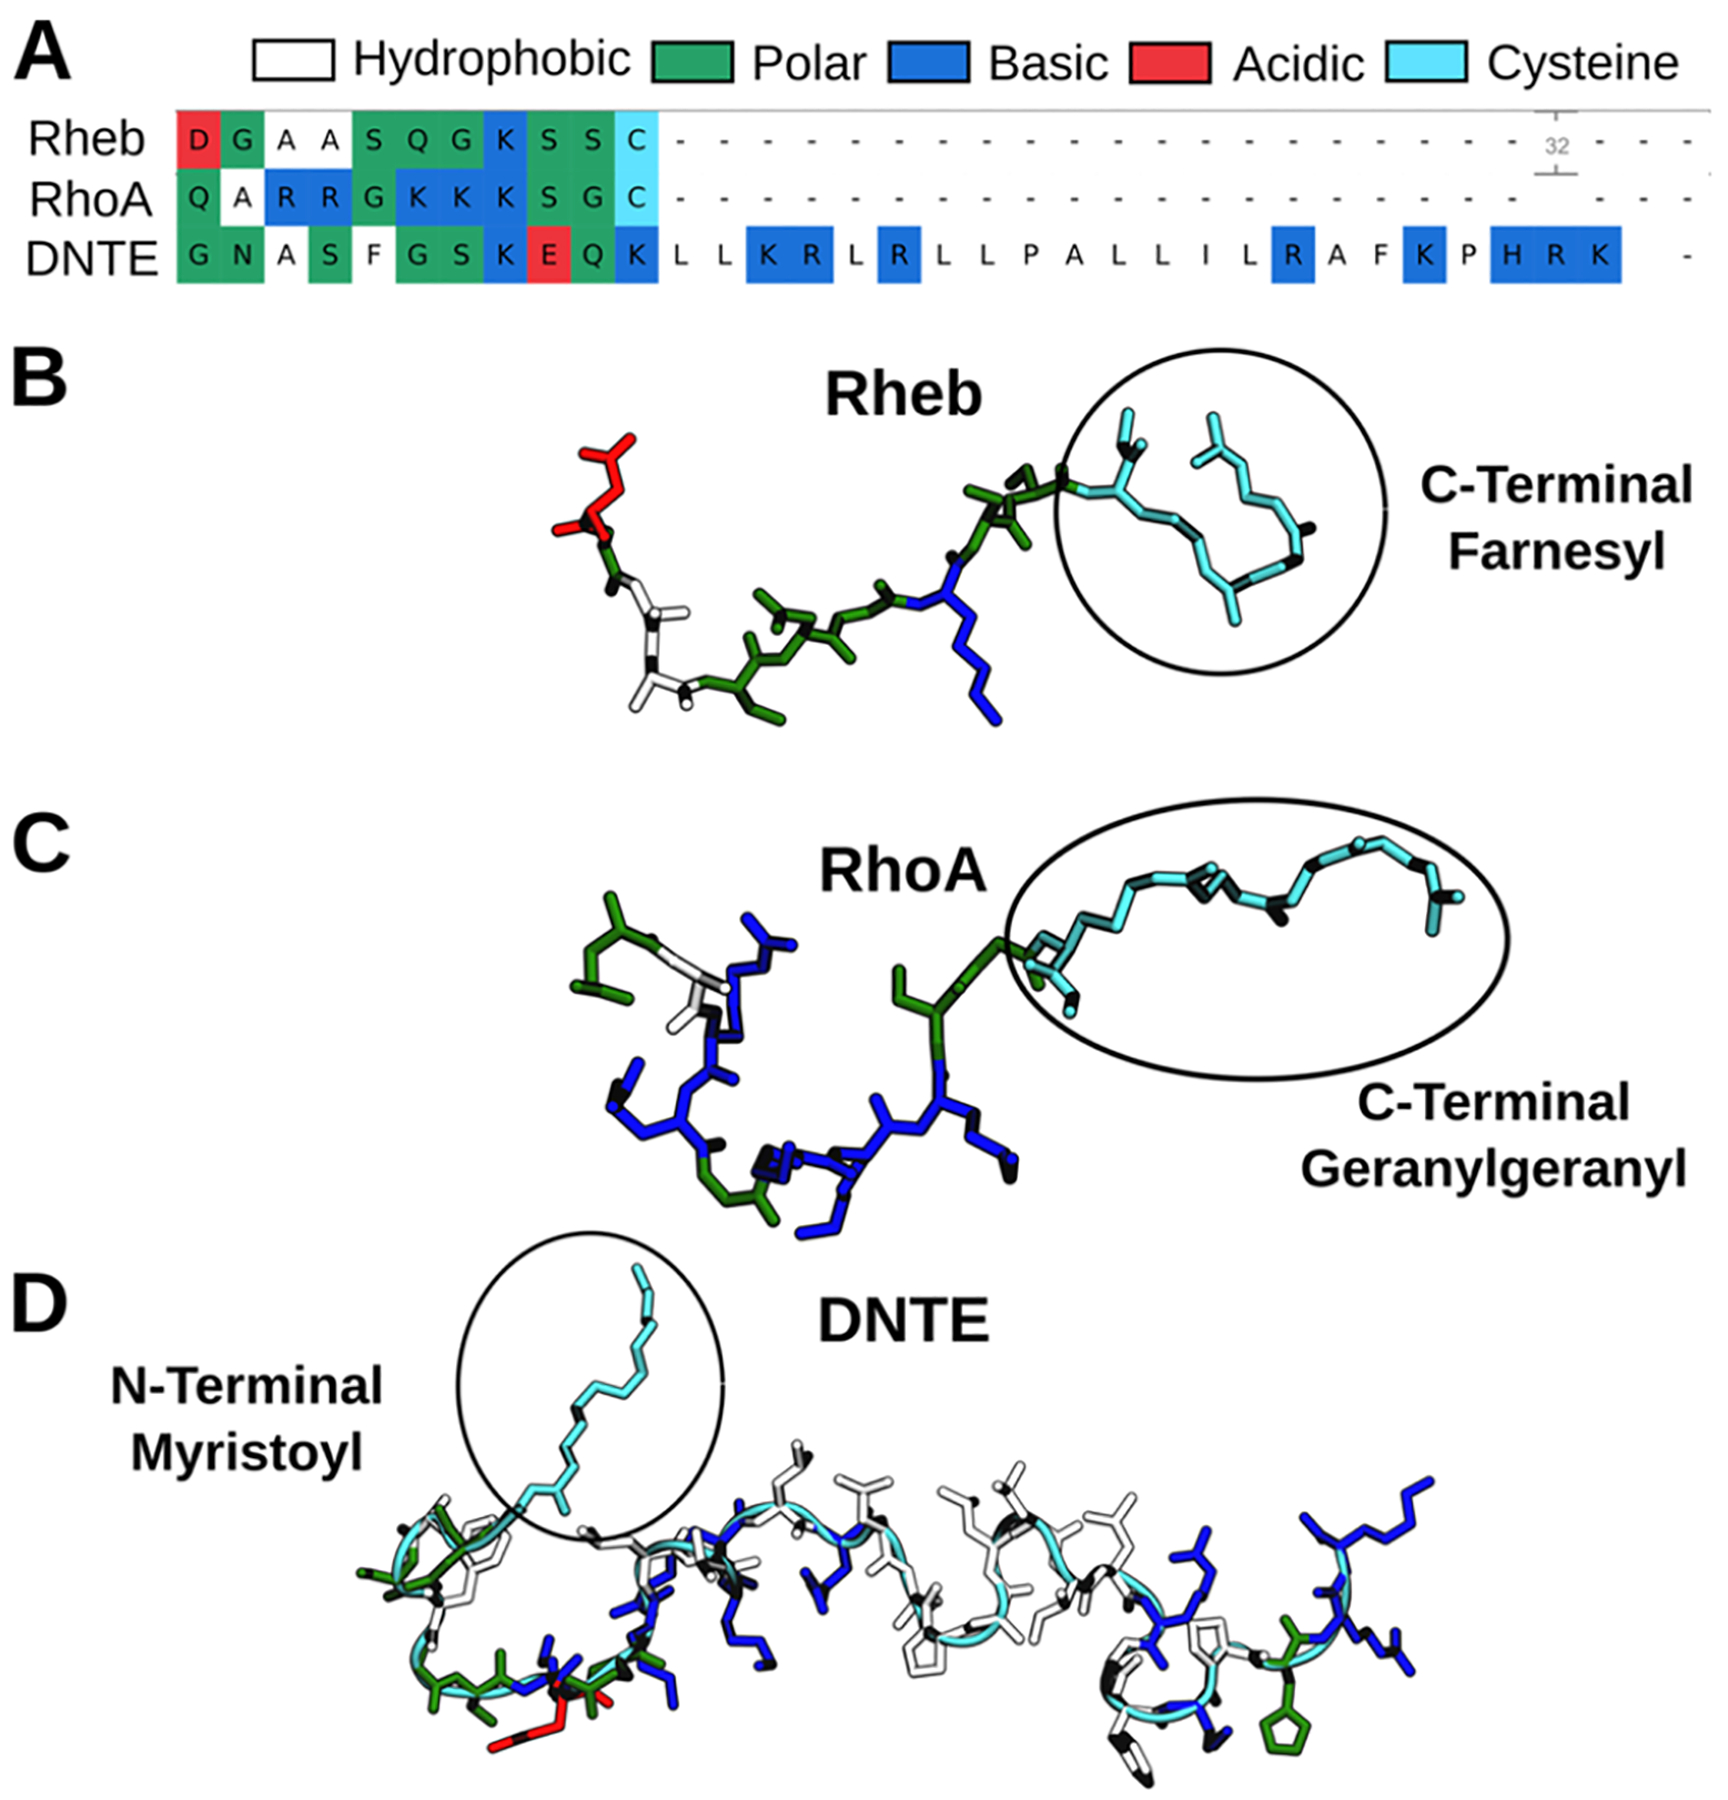
Sequence (A) and initial structure (B–D) of prenylated C-terminal membrane anchors of Rheb and RhoA and myristoylated N-terminal extension of DiRas3 (DNTE). Color code as indicated.
Table 1.
Summary of Simulations Discussed in This Studya
| lipid composition | bilayer structure | |||||
|---|---|---|---|---|---|---|
| simulation | # atoms | sim length (μs) | inner | outer | thickness (Å) | area (Å2) |
| Rheb | 57 731 | 2 | 7:8:30:55 (PI:Chol:PE:PC) | 7:8:30:56 (PI:Chol:PE:PC) | 40.4 ± 0.6 | 58.6 ± 0.9 |
| RhoA | 66 364 | 2 | 20:30:50 (PS:PE:PC) | 96 (PC) | 39.0 ± 0.5 | 63.8 ± 1.1 |
| DNTE | 57 956 | 10 | 25:25:25:25 (PC:PE:PS:PlaPE) | 50:50 (PC:PSM) | 39.2 ± 0.5 | 61.7 ± 1.0 |
See the Supporting Information for additional simulations of DNTE. Abbreviations: Chol = cholesterol; PI = phosphatidylinositol; PE = phosphatidylethanolamine; PC = phosphatidylcholine; PS = phosphatidylserine; PlaPE = plasmalogen PE; PSM = sphingomyelin. The molecular structure of each lipid type is found in Figure S1. Membrane thickness is measured as the average z-distance between phosphorus atoms at the two leaflets. Area represents the surface area of the peptide-free monolayer normalized by the number of lipids in that monolayer.
Model Membranes and Lipid Composition.
Initial bilayer models were generated using CHARMM-GUI Membrane Builder27,28 with the composition of lipids determined on the basis of a lipidomic analysis of cell membranes.29 As noted above, Rheb is primarily localized in the cytosolic side of the ER membrane.21 Therefore, we simulated its lipid anchor in a bilayer approximating the ER lipid composition composed of 56 POPC, 30 POPE, 7 PI, and 8 Chol lipids in which a single POPC lipid from the Rhebcontaining leaflet was removed to account for the area occupied by the peptide (see Table 1 for abbreviations and Figure S1 for lipid chemical structures). RhoA is primarily localized at the inner leaflet of the plasma membrane (PM), which is enriched in phosphatidylserine (PS) and phosphatidylethanolamine (PE) lipids and likely prefers liquid-ordered domains. Therefore, the RhoA lipid anchor was simulated in a simplified PM model bilayer containing 96 POPC lipids in one leaflet (outer) and 50 POPC, 30 POPE, and 20 POPS lipids in the other leaflet (lower), where the peptide is attached. Interleaflet area symmetry was achieved by adjusting the number of lipids per leaflet using areas per lipid determined by CHARMM-GUI’s Membrane Builder and accounting for the approximate surface area of the peptide, as described previously.20 This was required to reduce differences in lipid packing between leaflets that would cause membrane curvature.30 Even though the ratio of PS to the total number of lipids is low in this setup, the 20% PS content in the lower leaflet exposes the RhoA peptide to a similar charge density as in our previous simulations of KRAS,16,31 allowing us to make direct comparisons. The longer and more complex DiRas3 N-terminal membrane anchor,25,32 which to our knowledge has not been simulated before, was initially simulated in a simpler model bilayer of asymmetric PC and PS lipids and then in a more complex asymmetric PM mimic based on a recent paper describing specific leaflet compositions.33 Here, the peptide-free (upper) leaflet contained POPC and PSM lipids of equal ratio, while the peptide-containing lower leaflet comprised equal numbers of POPC, POPE, PlaPE, and POPS lipids (Table 1).
MD Simulations.
All simulations were conducted using the CHARMM36 force field.34,35 Rheb and RhoA were equilibrated with the NAMD simulation package36 and DiRas3 with GROMACS.37 Similar equilibration protocols were used for all systems, with each system energy-minimized for 2000 steps with lipid phosphorus and protein backbone atoms fixed and then for another 2000 steps without fixed atoms using the conjugate gradient (NAMD) or the steepest descent (GROMACS) method. After minimization, systems were equilibrated with Δt = 1 fs for 4 ns applying a harmonic restraint of force constant k = 4 kcal/mol Å2 to lipid phosphorus and protein backbone atoms. The restraint was scaled down by 25% in four steps of 1 ns each until k = 0. The systems were then simulated with Δt = 2 fs, using the particle mesh Ewald (PME) method38 for long-range electrostatic interactions and restraining bonds involving hydrogen atoms with SHAKE39 (NAMD) or LINCS40 (GROMACS). A switching function with 10 and 12 Å distance cutoffs was used, with a 14 Å cutoff for the pair-list update. The NPT (constant number of particles, pressure, and temperature) ensemble was used with the Nose-Hoover Langevin piston and Langevin thermostat (NAMD) or the velocity-rescaling thermostat41 and Parinello-Rahman barostat42 (GROMACS) to maintain pressure at 1 bar and temperature at 310 K, respectively. After equilibration, RhoA and Rheb were simulated for 40 ns and DNTE for 400 ns on local resources and then transferred to Anton 2.43 Anton simulations used default Desmond parameters for the NPT ensemble and a 2.5 fs time step and ran for 2 μs (RhoA and Rheb) or 10 μs (DNTE), with snapshots written out every 100 ps for analysis. Note that although DNTE was equilibrated with GROMACS, it used the same force field and a similar equilibration protocol as those of the RhoA and Rheb systems. Moreover, all production runs were conducted on Anton 2 with an identical protocol.
Trajectory Analysis.
Trajectories were analyzed using the MDAnalysis python library44 or GROMACS analysis tools, with additional analysis performed with Visual Molecular Dynamics (VMD) scripts.45 Statistical analyses were performed in Python using the Scipy library.46 For Rheb and RhoA, the best equilibrated last 1.5 μs of the trajectories was used to obtain equilibrium properties. We used the entire 10 μs trajectory of DNTE for analysis because this simulation was started from an already well-equilibrated bilayer system (see SI text and Figure S2). Bilayer thickness (P–P) was measured by using the z-component of the distance between the centers of mass (COM) of the phosphorus atoms in the two leaflets. Area per lipid (APL) was calculated using the area-per-lipid class in the Lipyphilic Python toolkit,47 which utilizes Voronoi Tesselations to calculate the surface area of individual lipid molecules. Probability density functions were calculated using the Gaussian KDE method from scipy stats. 2D particle density calculations were performed by wrapping lipid coordinate positions around the COM of each protein and calculating the Gaussian kernel density distribution of X/Y coordinates of lipid phosphorus atoms around the protein COM. We used mean square displacement (MSD) calculations to obtain the lateral diffusion coefficient (D) of lipids. Multiple reaction coordinates were defined for structural analyses of the peptides. These included end-to-end distance (d) of the backbone to measure compactness, pseudo-dihedral angles (a) defined by four consecutive Cα atoms to assess local structural features, and pairwise distances between nonadjacent Cα atoms to perform principal component analysis (PCA) with the PyEMMA library.48 Secondary structure content was calculated using the DSSP49 method implemented in the MDTraj Python library.50 Peptide-lipid interactions were monitored by counting the number of hydrogen bonds (defined by an angle cutoff of 130° and distance cutoff of 3 Å) and van der Waals (vdW) contacts (defined to occur if two carbon atoms are within 4 Å of each other).
RESULTS AND DISCUSSION
The current work has focused on MD simulation analyses of the lipidated IDRs shown in Figure 1 bound to the model membranes listed in Table 1. The time evolution of bilayer thicknesses (Figure S3) and surface areas (not shown) indicated that all three bilayers have fully stabilized during the equilibration phase of the simulations, fluctuating around the mean values listed in Table 1. Plots of backbone root-mean-square deviation (RMSD) and membrane insertion depth of the lipid-modified residue (ID), as well as the numbers of hydrogen bonding (NHB) and vdW (NvdW) contacts (Figure S4), show that all three peptides quickly adsorbed and stabilized in their respective bilayers (e.g., within 0.5 μs in RhoA and Rheb). Based on the RMSD profiles, we decided to use the last 1.5 μs data of Rheb and RhoA and the entire trajectory of the more complex DNTE for the analysis of equilibrium properties.
A bilayer similar to our RhoA model membrane has been simulated before,20 but, to our knowledge, the Rheb and DNTE bilayer systems were not previously studied with simulations. Therefore, we first briefly discuss the structure and dynamics of the three bilayers based on typical structural properties such as bilayer thickness (P–P distance), APL, diffusion coefficient (D), and acyl chain order parameters. We then describe our findings on the membrane interaction, structure, and dynamics of the lipidated IDRs.
Bilayer Structure and Dynamics.
Table 1 shows that the P–P distances in the RhoA and DNTE bilayers are 39.0 and 39.2 Å, respectively. Their peptide-free monolayer surface area normalized by the number of lipids in that monolayer is also comparable (Table 1). These suggest that, despite differences in lipid composition, our PM models are structurally similar to each other and to other PM model membranes such as PC–PC/PS and PC–PC/PS/PE bilayers.20,51 By contrast, an average thickness of 40.4 Å in the Rheb bilayer indicates that our ER model membrane is slightly thicker. This is expected because cholesterol increases lipid packing and bilayer thickness and decreases area per lipid (APL).52,53 Consistent with the trend in bilayer thickness (Table 1), the APL of both POPC (APL(PC)) and POPE (APL(PE)) is slightly smaller in Rheb than that in RhoA or DNTE (Figure 2A). This is consistent with C13-nuclear magnetic resonance (NMR) experiments showing that cholesterol reduces the APL of a POPC bilayer.52 APLs of PI and Chol from the Rheb simulation (Figure 2A) are consistent with expectation from the size of their headgroup (Figure S1).
Figure 2.
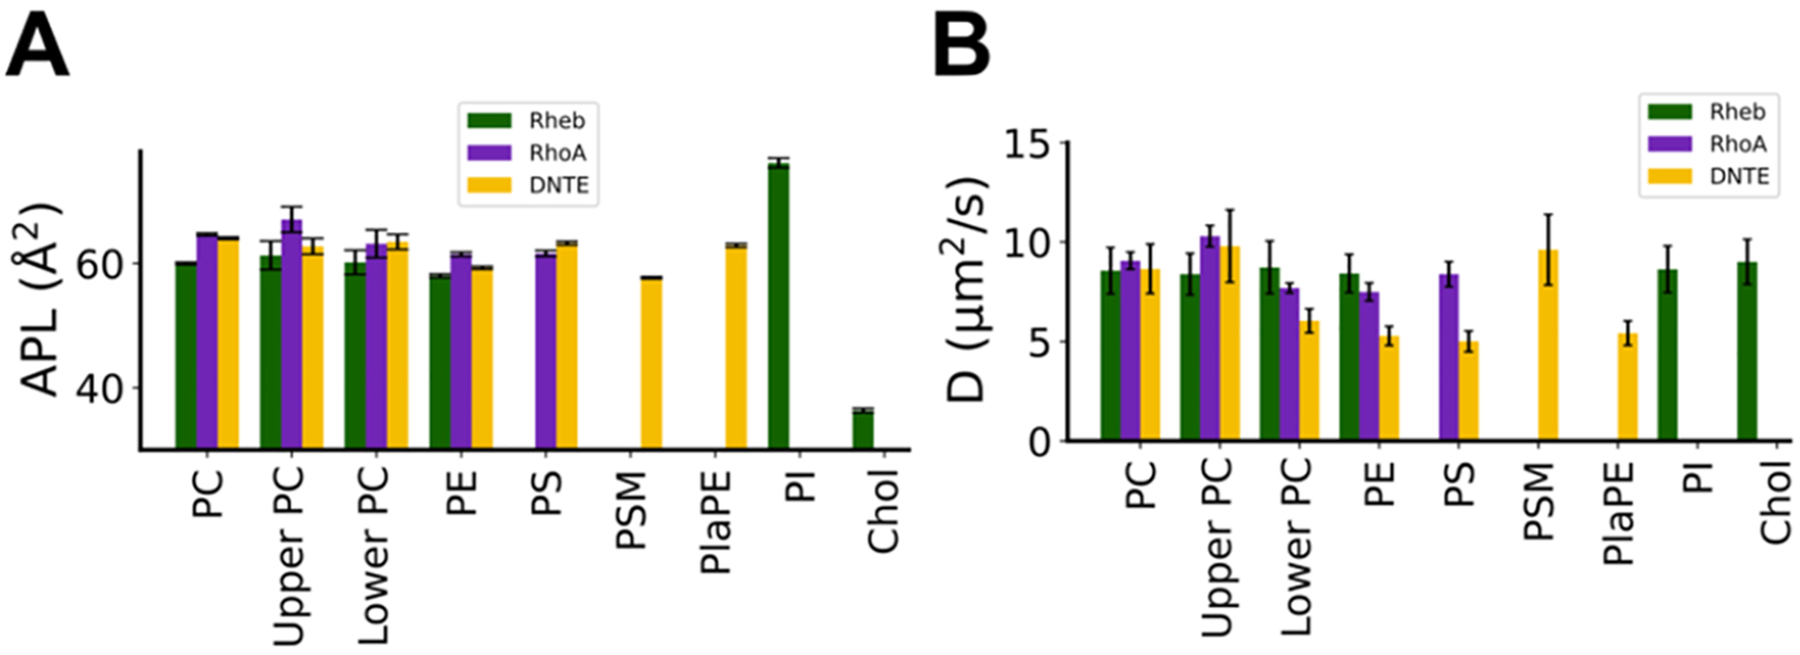
(A) Time averaged area per lipid (APL) and (B) lateral diffusion coefficient (D) of each lipid type in each simulation. APL was calculated using the last 1.5 μs of Rheb and RhoA simulations and the entire trajectory of DNTE. D was obtained from mean square displacements (MSD) calculated using 200 ns time blocks of the last 1 μs data, with linear regression performed on the most linear portion of the MSD plots, as described previously.20
We obtained average APL = 67.1 ± 2.0 Å2 for POPC in the peptide-free leaflet of the RhoA simulation, a value similar to that from a previous simulation of a similar mixed bilayer (66.2 ± 1.3 Å2),20 and experimental data in a pure POPC bilayer (67.3 Å2 at 323 K).54 APL(PC) in the peptide-containing lower leaflet of RhoA is slightly smaller than that in the upper leaflet likely because of interactions with the bound peptide. APL(PS) and APL(PE) from the RhoA simulation are comparable to data from a previous simulation of the same lipid mixture.20 As in the P–P distances, the average APL of lipids in the compositionally more complex DNTE bilayer is similar to those in the simpler PM mimic RhoA. However, there is no difference in APL(PC) between leaflets, and APL(PS) is slightly larger and APL(PE) slightly smaller in DNTE than in RhoA (Figure 2A). APL(PSM) and APL(PlaPE) are consistent with expectations from molecular structures (Figure S1).
Acyl chain order parameters (SCH) plotted in Figure S5 show that the three bilayers are remarkably similar in lipid packing despite differences in composition and symmetry. Still, both the Sn-1 and Sn-2 acyl chains of PC and PE lipids are somewhat more ordered in Rheb than in the other bilayers (Figure S5), consistent with the increased bilayer thickness and reduced APL discussed above. The SCH profiles of lipid types shared between the simpler RhoA and the more complex DNTE PM mimics are very close to each other. Interestingly, acyl chain dynamics are identical between the peptide-containing lower and peptide-free upper leaflets in Rheb and DNTE, and the SCH profiles of lipids found only in Rheb (PI) or DNTE (PSM and PlaPE) do not display unexpected behavior (Figure S5). In contrast, acyl chains of POPC are slightly less ordered in the peptide-containing lower leaflet of the RhoA bilayer, reflecting the interleaflet difference in APL(PC) seen in Figure 2 and recapitulating a previous observation in a similar bilayer with the KRAS membrane anchor.20 Overall, the two compositionally different PM mimics RhoA and DNTE are characterized by similar average structural properties that differ from those of our ER model membrane Rheb.
To assess the consequence of these structural differences and similarities in lipid dynamics, we calculated the lateral diffusion coefficient (D) of each lipid type (Figure 2B). It is immediately clear that lipids in the DNTE membrane are generally less mobile than in Rheb and RhoA, and that the latter two share similarity in terms of lipid mobility (Figure 2B). For POPC, we obtained an average D ≈ 9.0 μm2/s in all simulations, a value close to previous observations from simulations19,20 and experiments.55 Similar values were obtained for POPC, POPS, and POPE in the lower leaflet of RhoA, as well as for POPC, POPE, PI, and Chol in the Rheb simulation and for PSM in DNTE (Figure 2B). However, we obtained a lower value of D ≈ 6.0 μm2/s for POPS, POPE, and PlaPE lipids in the DNTE system. Lipids including POPC in the peptide-containing lower leaflet are less mobile in RhoA and even more significantly in DNTE. The restricted lateral dynamics of lipids in the lower leaflet of these systems is likely due to interaction with the bound peptide, which will be discussed in subsequent sections.
Rheb Membrane Anchor Is Flexible and RhoA Samples Multiple Semistable Conformational Substates.
As noted above and shown in Figure S4B using the membrane insertion depth of the prenyl chains (ID), both Rheb and RhoA rapidly inserted and stabilized in their respective bilayer. Following insertion, RhoA fully adsorbed into the bilayer with the backbone lying flat in the headgroup region (Figure 3). In contrast, Rheb remained extended and flexible, interacting with the host monolayer primarily via its farnesyl chain (Figure 3). These observations are consistent with previous findings from simulations in asymmetric PC–PC/PS bilayers,51 with the difference between the two peptides in bilayer localization ascribed to RhoA’s ability to engage anionic lipids through its PBD. This is supported by the 2-fold higher number of peptide-lipid HB interactions (NHB) in RhoA (5.5 ± 2.4) than in Rheb (2.6 ± 1.5) (Figure 4A & S4D). Unsurprisingly given the PBD, RhoA predominantly interacts with PS (and PC to some extent), while Rheb interchangeably and weakly engages PC and PE (Figure 4A). The radial pair distribution plots in Figure 4B further show that each of the three Lys and two Arg residues in the RhoA PBD strongly interact with PS and to a lesser extent with PE, whereas the single Lys in Rheb only modestly interacts with POPE. The Rheb and RhoA IDRs also differ in the number of vdW contacts (NvdW) they make with lipid acyl chains (Figure S4C). We obtained NvdW = 24.5 ± 9.4 for RhoA and 17 ± 6.9 for Rheb. This difference is almost entirely a result of the longer 20-carbon geranyl–geranyl acyl chain in RhoA versus the 15-carbon farnesyl chain in Rheb. Taken together, these results suggest that not only do Rheb and RhoA IDRs differ in structure and membrane adsorption but also in apparent affinity for their host membrane, with RhoA likely attaching to the PM more tightly than Rheb to the ER membrane. We arrived at the same general conclusion in a previous MD study using a bilayer of different lipid compositions and where sampling of phase space was more extensive.51
Figure 3.
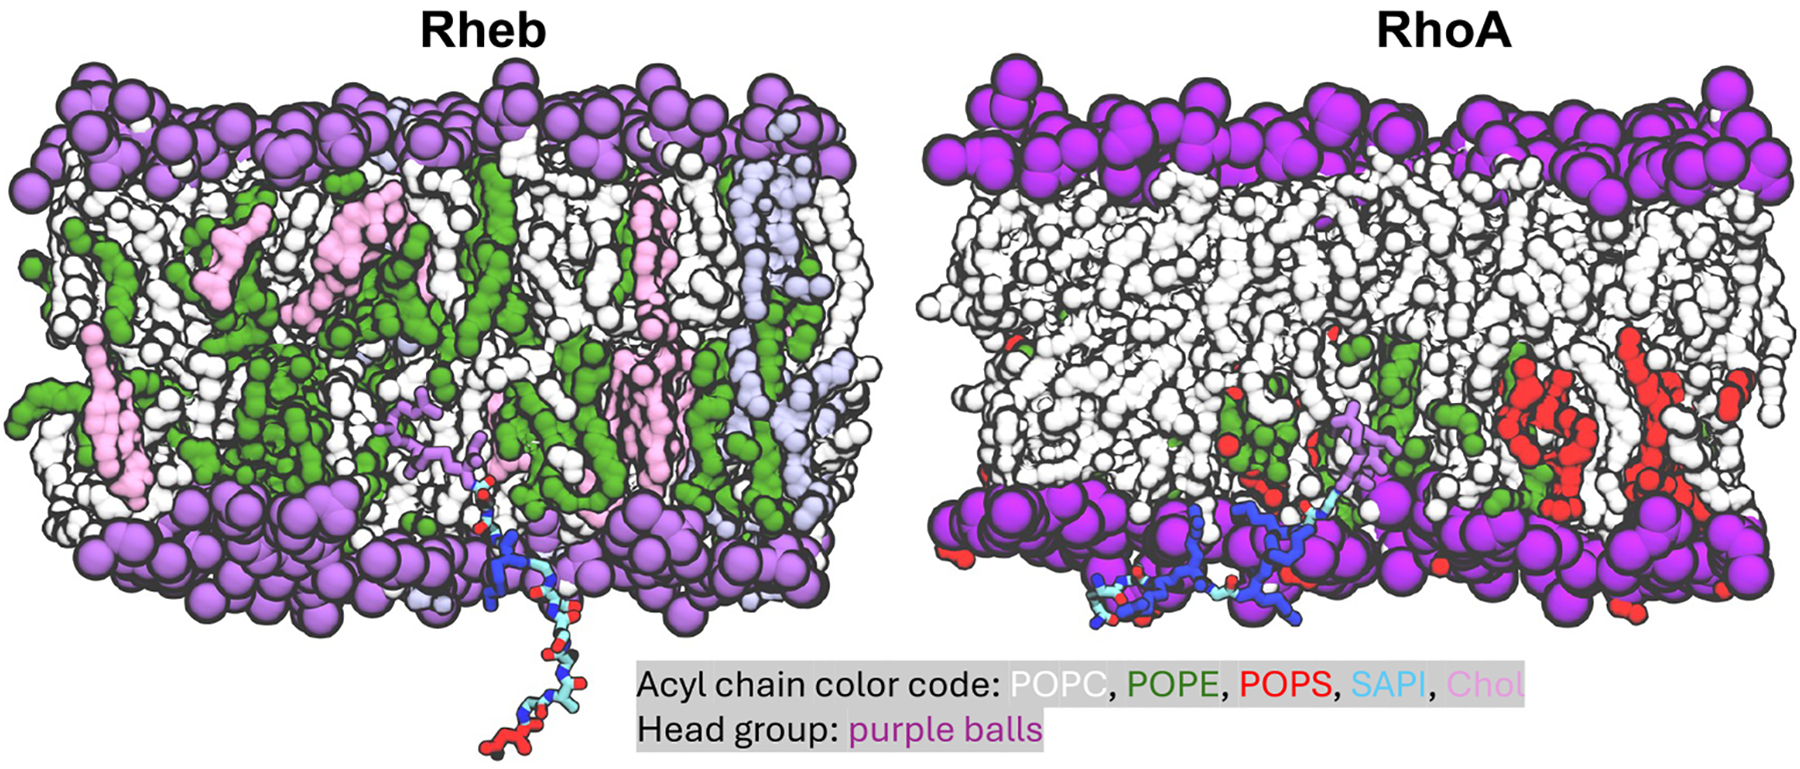
Snapshot at the end of Rheb and RhoA simulations illustrating the organization of the lipidated IDR in bilayer, highlighting basic residues in blue, acidic in red, lipidated cysteines in magenta, and remaining backbone atoms in atom-colored licorice. Protein backbone is shown in cartoon and side chains in licorice. Lipid acyl chains are shown as surface and head groups as sphere colored as indicated. Lipid atoms including those of POPS within 10 Å of protein heavy atoms as well as water and ions are omitted for a better visualization of the peptide.
Figure 4.
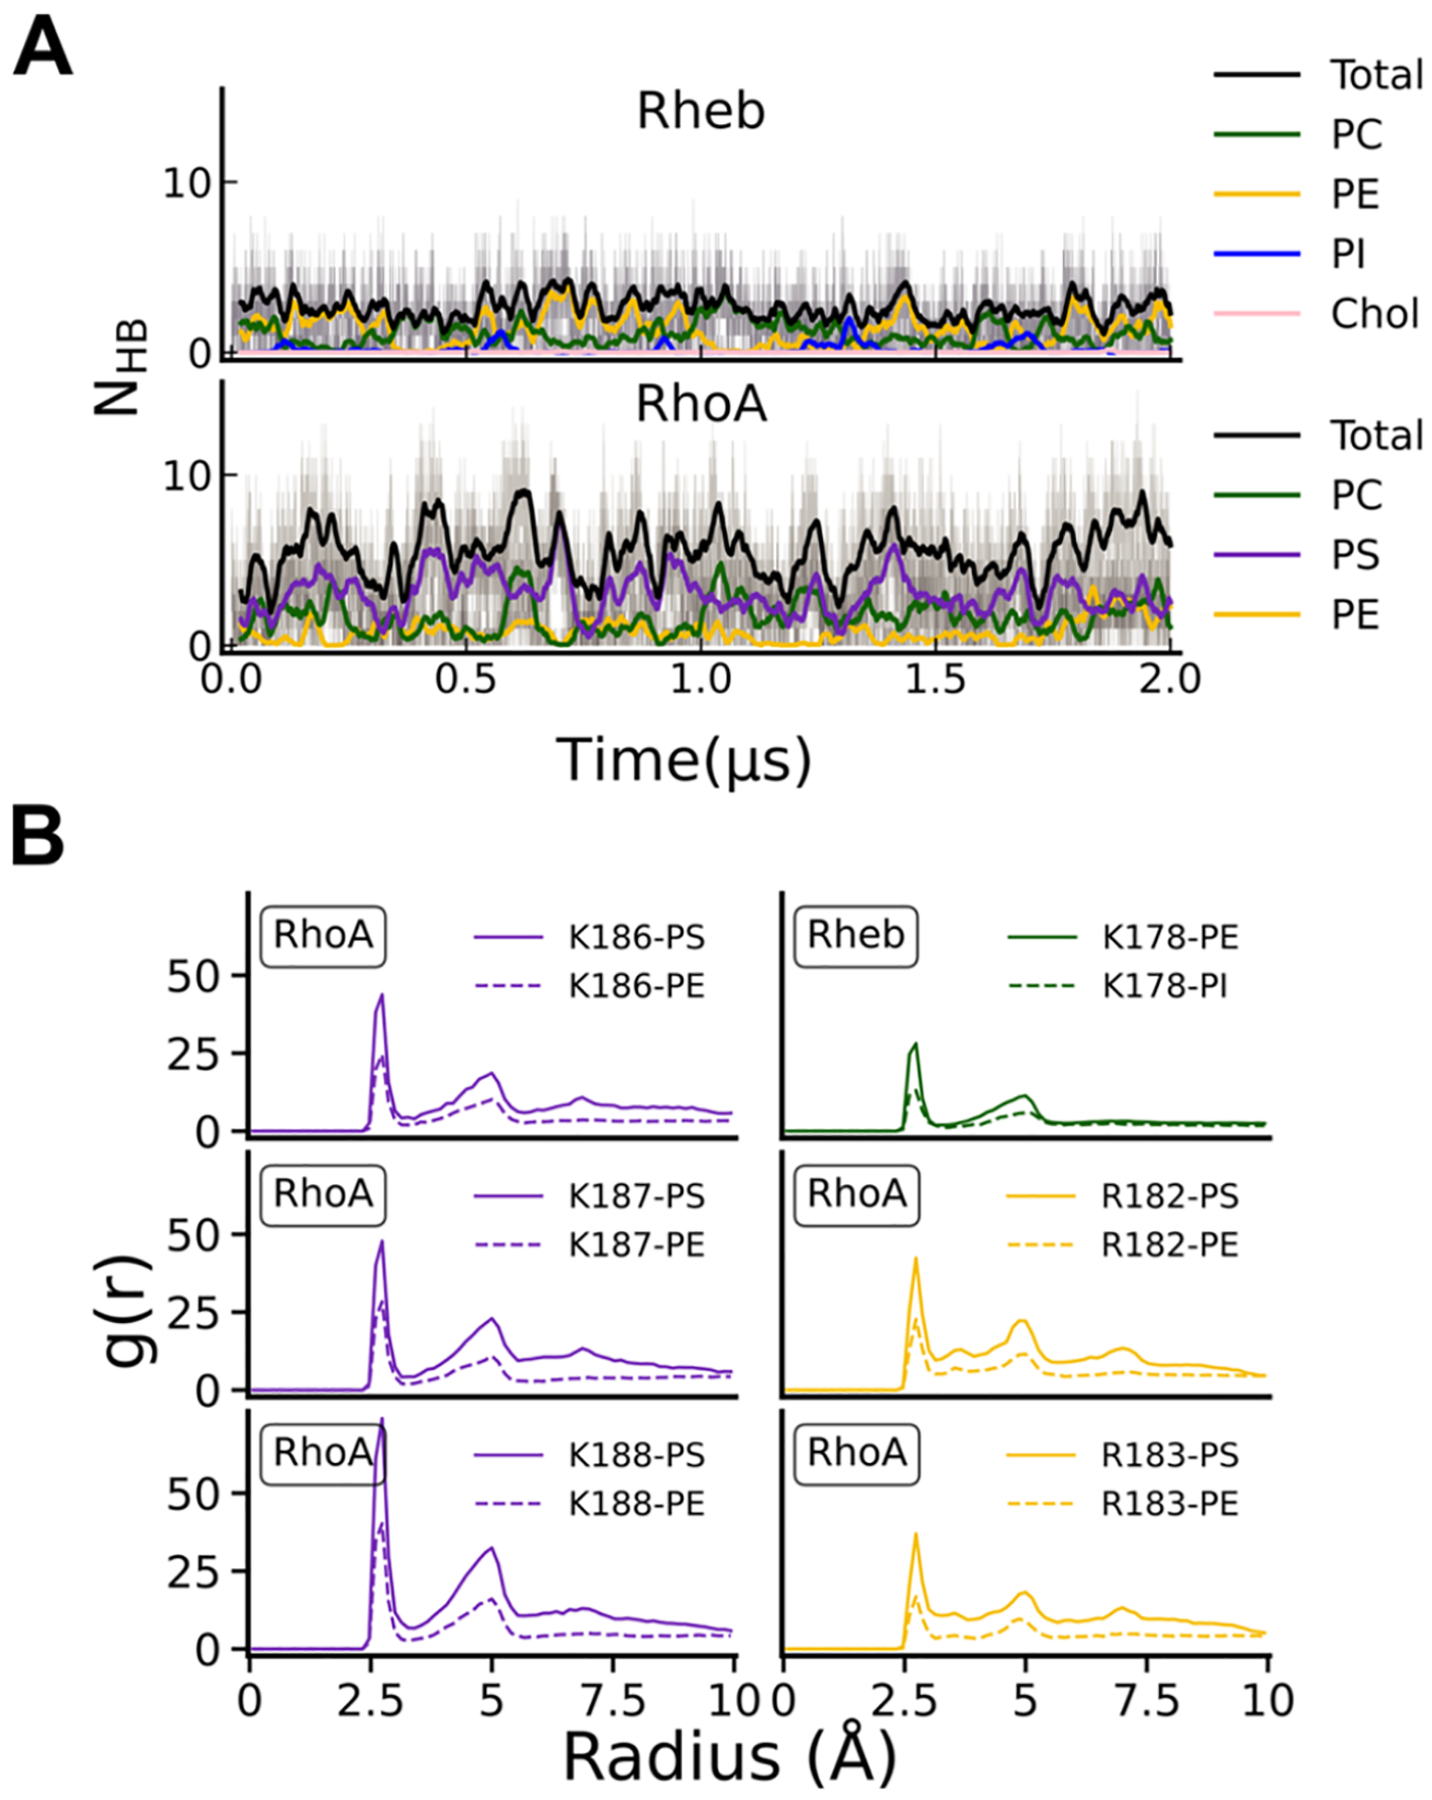
(A) Time evolution of the number of hydrogen bonds (NHB) between all protein hydrogen bond donors and phosphate oxygen atoms of each lipid type in Rheb (top) and RhoA (bottom) simulations. (B) Radial pair distribution of phosphate oxygen atoms around the NZ atom of lysine and NH1 atom of Arg side chains on the Rheb and RhoA anchors.
We have shown in previous studies19,20,51 that bilayer organization and lipid interaction of lipidated IDRs are correlated with backbone conformational dynamics. To test if this is the case in the current Rheb and RhoA simulations, we analyzed simulated conformers of each trajectory (last 1.5 μs) using backbone end-to-end distance (d) and pseudo-dihedral angle (a) as reaction coordinates to respectively measure global and local structural features (see the Methods section). Plots of P(d,a) probability density distributions (Figure 5A) show that Rheb predominantly sampled extended conformations of specific planarity, with occasional excursions into conformations of local structure characterized by a > 0.0°. In contrast, RhoA sampled multiple metastable states including a compact semiordered conformation and extended structures with either a < 0.0° or a > 0.0°. As found in a previous study51 and further discussed later, sampling of these metastable conformations is correlated with preferential interactions with anionic lipids (Figure 5B), suggesting that interplay between IDR sequence and anionic lipid content of the membrane underlies the conformational energy landscape of lapidated IDRs.
Figure 5.
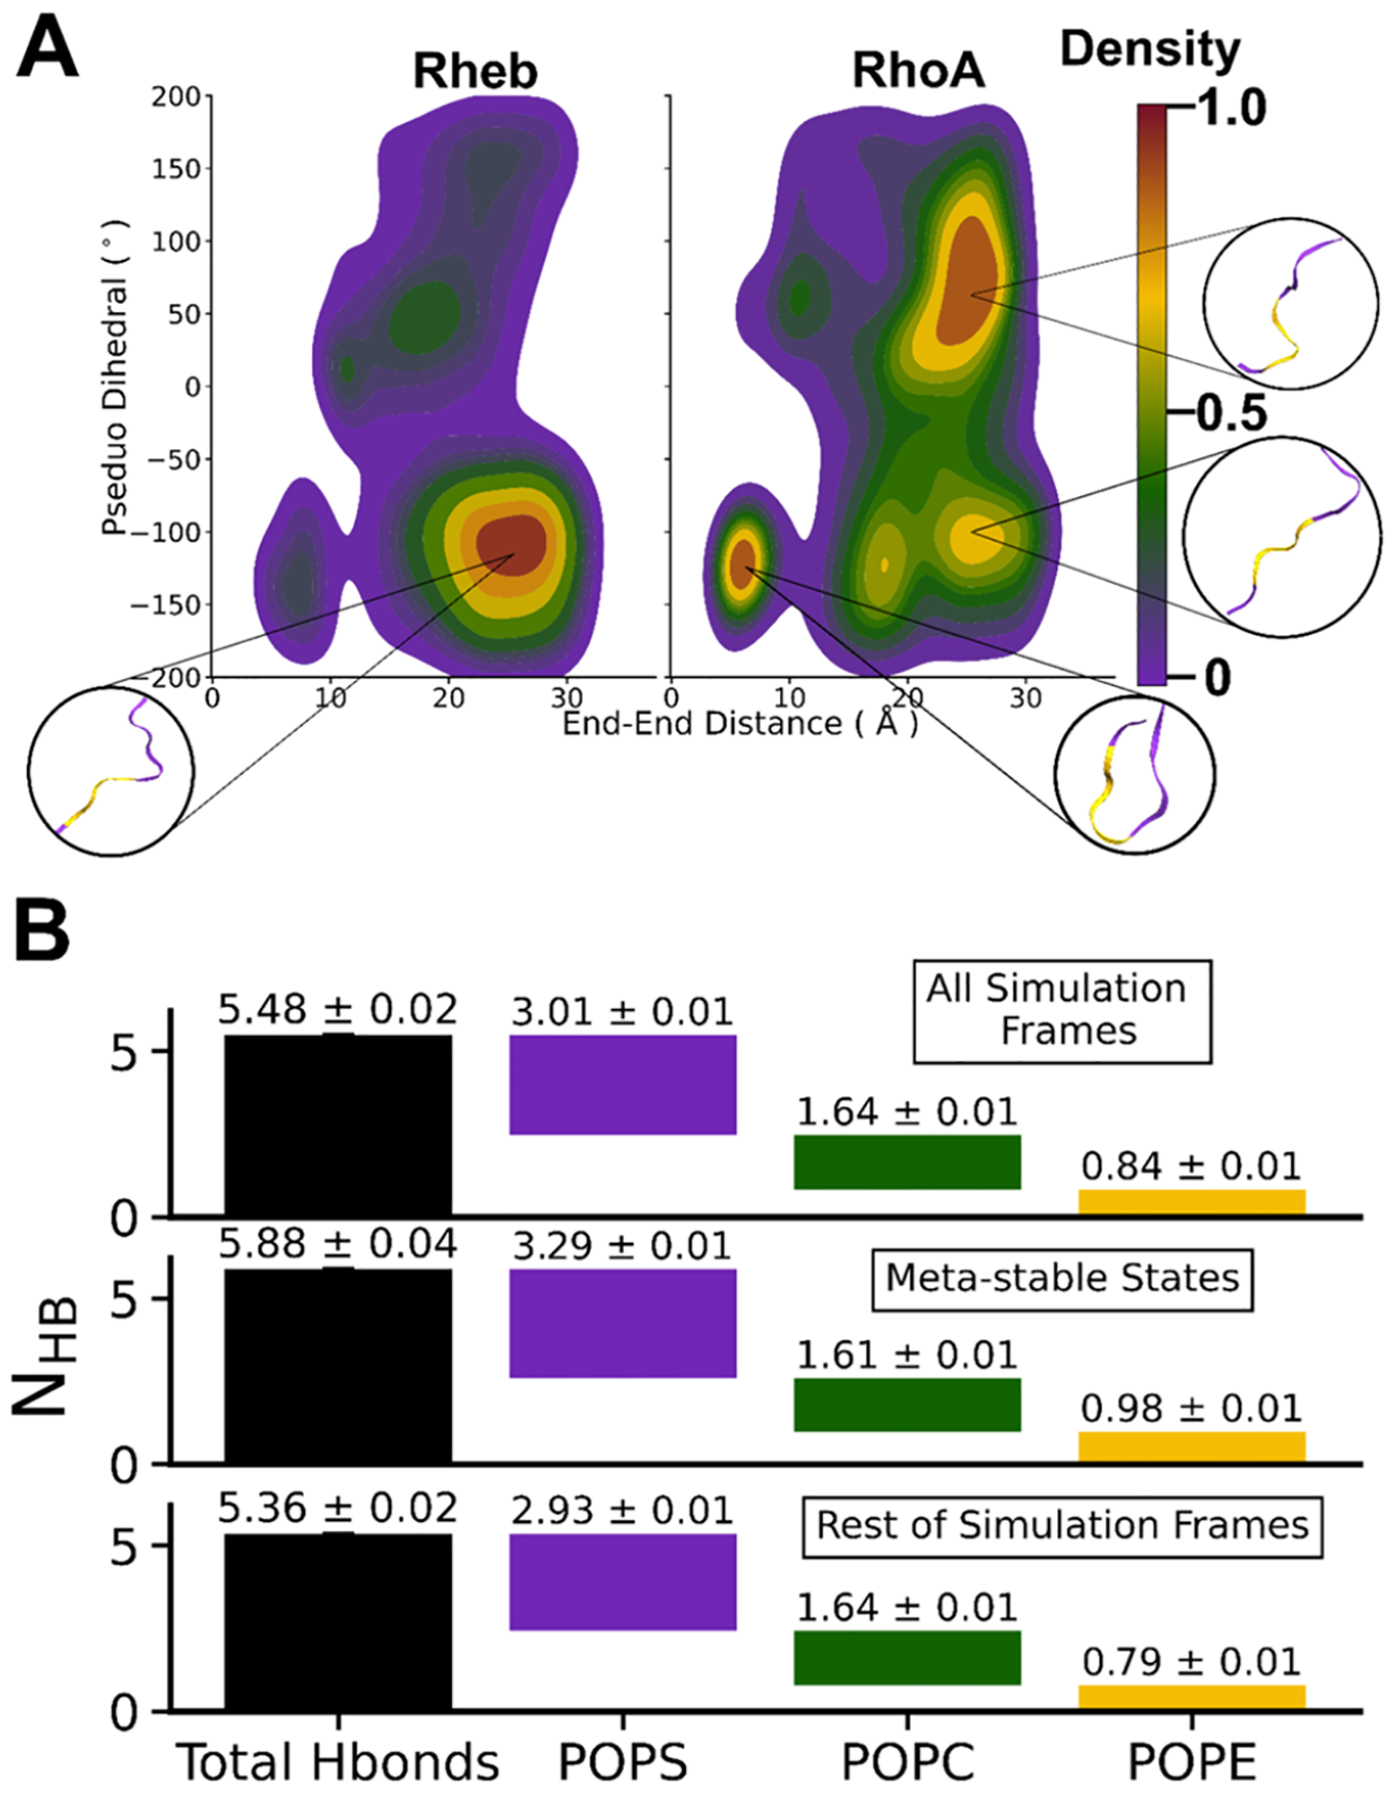
(A) Peak-normalized 2D probability number density distribution of the Rheb and RhoA simulated conformers along a pseudo-dihedral angle and end-end distance reaction coordinates. The dihedral angles were calculated using four consecutive Cα atoms and the distance was between Cα atoms of C and N-terminal residues. Representative structures for the highest peaks are shown in purple with residues used for pseudo-dihedral angle calculation marked in gold. (B) Waterfall plots of the average number of hydrogen bonds between RhoA and lipids comparing all semistable conformations (combining conformers in all of the high-density contours in Figure 2) and the rest of the conformers.
DNTE Undergoes Disorder to Order Transition upon Binding to and Stabilizing in an Anionic Membrane.
As described in the SI, the DNTE simulation discussed here was preceded by extensive (21 μs aggregate time) exploratory simulations in search of an initial structure and setup that may produce reliable results and conforms to known patterns of amphipathic helix membrane binding.56–58 In this final simulation, we found that DNTE quickly adsorbed and stabilized in the bilayer as in the Rheb and RhoA simulations, with its ID fluctuating around a mean value of ~11 Å (Figure S4B). However, unlike the smaller Rheb and RhoA peptides, DNTE’s electrostatic and vdW interactions with lipids continued to evolve until about 3 μs, as can be seen from the plateauing of the time evolution of NHB and NvdW after this time point (Figure S4C,D). The backbone RMSD fluctuated until about 5 μs (Figure S4A). Note that the initial solution structure of DNTE was characterized by a helix-turn-helix motif, with the N-terminal α-helix (residues 8–16) persisting throughout our exploratory simulations in bilayers (Figure S2). Therefore, we monitored changes in secondary structure content during the final simulation and found that DNTE undergoes substantial structural changes (Figure S6). This included the N-terminal helix unfolding quickly, including during a 400 ns equilibration run, and the C-terminal helix reemerging within the first 100–200 ns of the production run (Figure S6). The C-terminal helix was unstable until about 3 μs but fully stabilized as a 9 amino acids-long helix (residues 21–29) in the second half of the trajectory, following the stabilization of NHB, NvdW, and RMSD (Figures S4 and S6). In addition, π- and 3/10-helices sporadically formed throughout the simulation, and a short helix spanning residues 2–6 appeared at the end of the simulation (Figure S6). In short, DNTE’s helical content fluctuated between 0 and 20% in the first half and stabilized at ~30% during most of the second half of the trajectory, reaching ~40% at the end of the simulation. Consistent with this observation, it was found experimentally that DNTE’s helicity increases upon binding to anionic lipids.25 Moreover, mutating the myristoylatable Gly 2 (first residue in Figure 1) to Ala did not affect the helical content or response to anionic lipid binding, and a peptide made up of residues 2–11 of DNTE has a lower helicity than the wild type (8% versus 14%) in solution. Importantly, the helical content of this peptide did not increase in the presence of anionic lipids. In contrast, a peptide made up of residues 12–29 of DNTE transitioned from 11% helicity to mostly helical upon anioniclipid binding.25 These experimental findings validate our simulation results.
DNTE Interacts with Lipids Extensively through both Hydrophobic and Basic Residues.
Like the PBD-containing RhoA membrane anchor, the entire structure of DNTE with the exception of the polar residues around Gln 9 submerged in the bilayer (Figure 6A,B). Note that while polar or basic amino acids dominate in Rheb and RhoA membrane anchors, DNTE harbors mostly polar (residues 1–10, which we call p) and hydrophobic (residues 18–25, np) segments, as well as two segments of basic plus hydrophobic amino acids: residues 12–17 (pb1) and residues 26–33 (pb2) (Figure 1). Moreover, the C-terminally prenylated Rheb and RhoA lack secondary structure, whereas the N-terminally myristoylated DNTE has a significant helical content (discussed above). Therefore, DNTE has the potential to interact with lipids via a combination of hydrophobic residues, an amphipathic helix, and two PBDs. Figure 6A,B shows that this is indeed the case. Almost all residues in the np segment, which are mostly located on the C-terminal helix, are deeply inserted into the bilayer and interact with lipid acyl chains. These include Leu 18, Leu 22, Ile 24, and Leu 25. Similarly, both the hydrophobic (e.g., Leu 13 and Leu 16) and basic (Lys 14, Arg 15, and Arg 17) residues in pb1 interact with lipids, with the Arg and Lys snorkeling to engage in both vdW and electrostatic interactions. The N-terminal half of pb2 residues including those on the helix, such as Arg 26, Phe 28, and Lys 29, engage lipids in a similar manner, whereas the last few residues of pb2 remained flexible and occasionally solvent-exposed. The polar segment p forms a hook-like structure so that most side chains remain solvent-exposed throughout the simulation while the myristate and Phe 5 insert deep into the bilayer hydrophobic core. These interactions are consistent with experimental observations. For example, simultaneously replacing 5 basic amino acids to Gln in pb1 and pb2 (Lys 11, Lys 14, Arg 15, Arg 17, and Arg 26) eliminated DNTE’s ability to bind anionic lipids but did not affect helicity.25 Mutating the hydrophobic Leu and Ile residues in the middle of the peptide (in pb1 and np) eliminated both helicity and lipid binding ability.25 Taking these together, we conclude that the basic residues of DNTE contribute to membrane binding, whereas the nonpolar amino acids in the center of the peptide have roles both in structural integrity and membrane binding.
Figure 6.
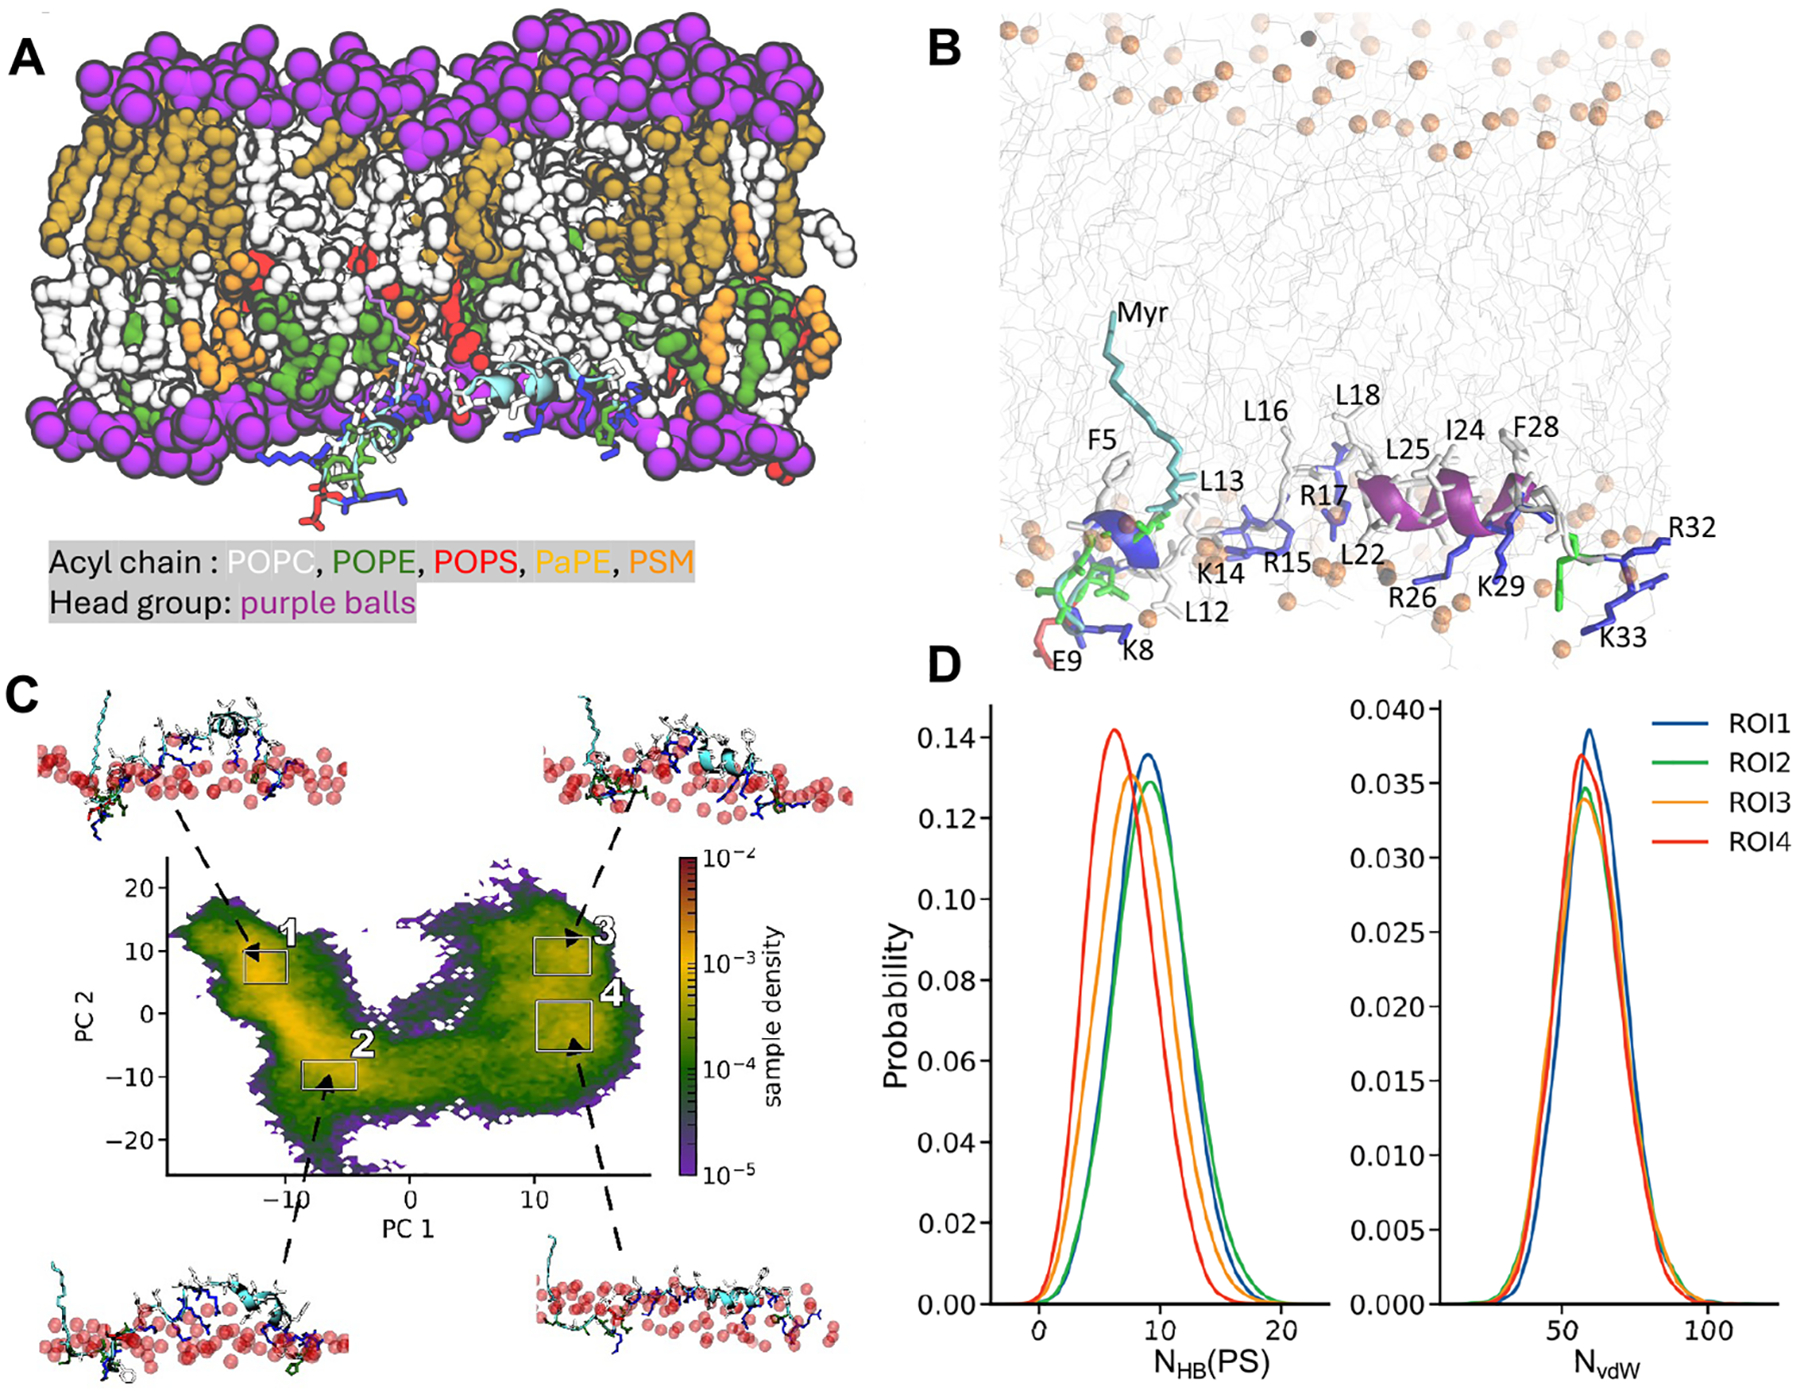
(A) Snapshot at the end of the DNTE simulation illustrating the organization of the peptide on the host monolayer with residues colored as in Figure 1D, except for the myristoylated Gly which is now in magenta. Lipid atoms including those of POPS within 10 Å of protein heavy atoms as well as water and ions are omitted for clarity. (B) Close-up view of the bilayer insertion depth and lipid interaction of DNTE. Lipids are in gray lines with phosphorus atoms shown as orange balls. DNTE is shown in cartoon representation with side chains colored in red (acidic), blue (basic), white (nonpolar), and green (polar). (C) Distribution of simulated conformers along the top two principal components, PC1 and PC2, based on pairwise Cα atom distances excluding adjacent residues. Example structures for the high-density regions labeled 1–4 are shown (arrows), highlighting the shape and insertion depth of DNTE relative to the phosphate groups of the host monolayer (red spheres). Side chains are shown in licorice with residues colored as in Figure 1. (D) Frequency of DNTE-PS hydrogen bonds (NHB, left) and van der Waals contacts (NvdW) of DNTE nonpolar side chains and lipid acyl chains. Calculations were done using conformers from the regions of interest (ROI) marked with black squares in panel (C).
Electrostatic Interactions with Anionic Lipids Stabilize Semiordered Structures of RhoA and DNTE at Membrane Surfaces.
We previously observed that extended and curled or semiordered conformations of KRAS,19,20 as well as RhoA and other51 PBD-containing lipid anchors of small GTPases, interact differently with PS lipids. We therefore wondered whether the frequently sampled RhoA conformations seen in Figure 5A differ from the rest in their electrostatic interactions with lipids. To check this, we pooled together all metastable conformers (high-density regions in Figure 5A) and compared their average NHB with PS, PC, and PE to that observed in all simulated conformers and in a pool of nonmetastable conformers. We found that the number of HB contacts of RhoA with POPC is similar in the different pools of conformers but the metastable conformations have a higher total NHB as well as PS- and PE-specific NHBs (Figure 5B). This suggests that increased levels of hydrogen bonding with anionic lipids stabilize distinct substates including semiordered conformations of RhoA.
To test if this observation on RhoA extends to the much longer and more complex IDR of DiRas3, we first performed principal component (PC) analysis over the entire trajectory based on pairwise distances between nonadjacent Cα atoms (see the Methods section). The goal was to categorize the simulated conformers into a manageable set of subensembles. Figure 6C shows the resulting distribution of DNTE conformers along the top 2 PCs, which together covered over 55% of the variance. We observe two well-separated ensembles of conformers along PC1, each of which is further divided into at least two subensembles along PC2. The snapshots taken from the center of the four high-density regions or subensembles (labeled 1–4 in Figure 6C) demonstrate a clear relationship between backbone conformation and lipid interaction including membrane insertion depth (Figure 6C). In subensembles 1 and 2, the peptide is bent at the center and inserts deep into the bilayer, with the two subensembles differing primarily in the extent of bilayer penetration. The backbone is straighter in subensembles 3 and 4 and lies mostly flat at the surface close to the phosphate group region. We then tested if these subensembles differ in interactions with lipids by comparing the number of hydrogen bonds with PS (NHB(PS)) and the number of vdW contacts with lipid acyl chain carbons (NvdW). There is a clear correlation between backbone conformation, membrane insertion depth, and NHB(PS), but not NvdW (Figure 6D): deeply inserted conformations interact with PS phosphate oxygens less frequently. The correlation between conformational preferences of RhoA and DNTE and side-chain-dominated interactions with inner leaflet PM lipids supports previous observations on ensemble-dependent lipid sorting and a key role of the PBD in this process.14,15,20,51
Protein–Membrane Electrostatic Interactions Alter Local Lipid Composition.
Because previous studies have indicated that the PBD of small GTPase membrane anchors induces clustering of anionic membrane lipids,14,15,19,20,51 we decided to look at lipid clustering around the peptides simulated in this work. To do this, we calculated the 2D particle density of lipids around each peptide’s center of mass. We found significant clustering of the anionic PS lipids around the PBD-containing DNTE and RhoA, with the density of other lipids around DNTE being much smaller (Figure 7). This result is consistent with the reduced lateral mobility of lipids in the peptide-containing leaflet of these systems (Figure 2B), and concordant with our previous observations in the KRAS membrane anchor.14,15,19,20 Rheb appears to have some preference for PE and Chol as suggested by their density near the peptide center of mass (Figure 7) and the radial pair distribution (g(r)) of Rheb side-chain atoms around lipid phosphorus atoms (Figure S7A). There are also high-density areas of PI including near the Rheb peptide (Figure 7), but the g(r) plots in Figure S7A show that colocalization of PI with Rheb is not much different from that of PC. Instead, we found that the g(r) for PI self-interaction is much higher than any other lipid type (Figure S7B). To check this further, we performed the same 2D particle density calculation for lipids in the peptide-free leaflet of the Rheb simulation (Figure S8). The data show a nonuniform distribution of PI and to a lesser extent Chol, but the degree of clustering is stronger in the peptide-containing monolayer. Although further investigation is required because the small number of PI and Chol in the Rheb system makes number density analysis less reliable, these observations suggest that clustering of PI and to some extent Chol may be induced by self-interaction that is enhanced by the peptide. This inference is supported by experimental studies that have shown that PI forms microdomains.59,60 In contrast, there was little PS self-interaction in either of our PS-containing systems (Figure S7B), confirming that the clustering of PS lipids we observe in Figure 7 is caused by selective interaction and sorting of these lipids by RhoA and DNTE. In addition to differences in basic residue content, the observed differential peptide-lipid associations among Rheb, RhoA, and DNTE may reflect differences in the number of PS and PI lipids in the bilayers as well as the better availability for interaction of the PS carboxylate than the PI phosphate, whose accessibility is impeded by the large sugar head (see Figure S1).
Figure 7.
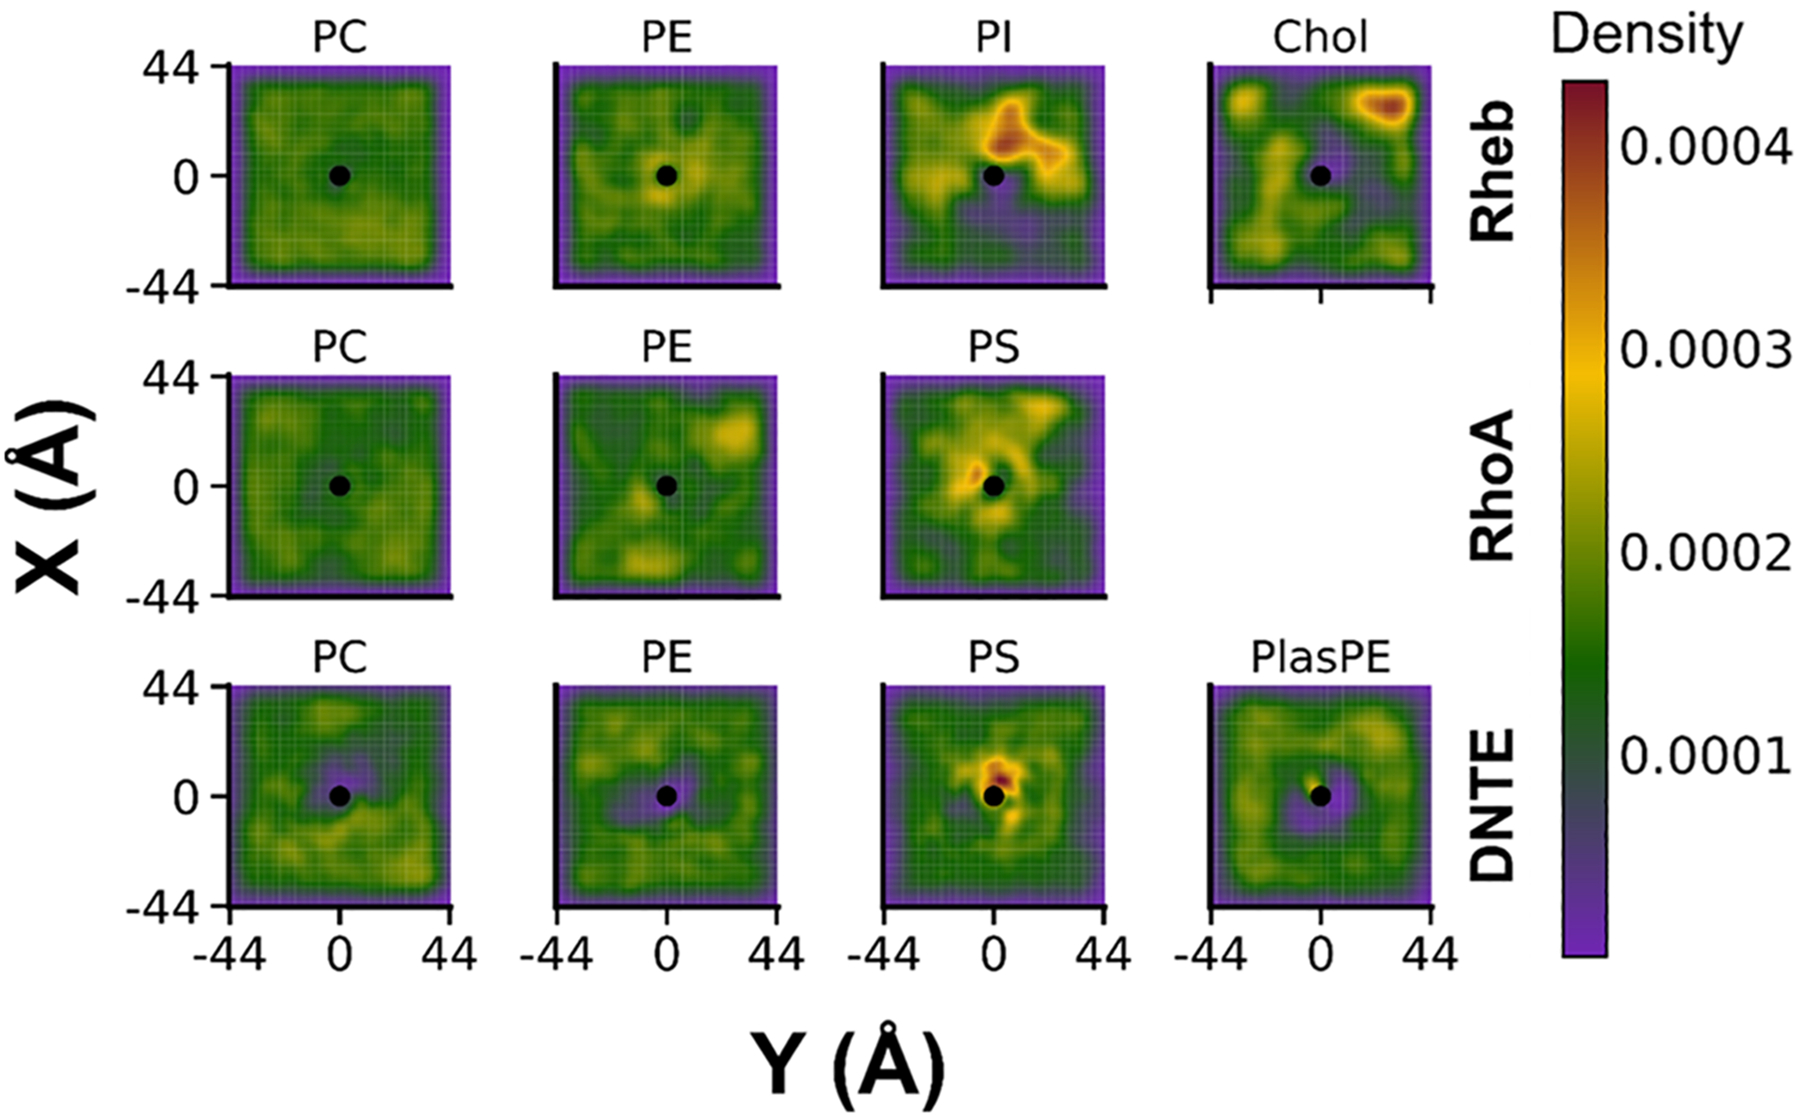
2D particle density of lipids around each lipidated IDR during the three simulations (see the Methods section). Normalized Gaussian kernel density values are shaded according to a global color scale where highest and lowest densities are the maximum and minimum densities out of all data sets. This allows one to compare the relative probability among lipid types and across simulations.
Conclusions and Implications for Function.
The three membrane anchors studied in this work represent distinct classes of lipidated IDRs in terms of both sequence composition and lipid modification (Figure 1). The C-terminally prenylated Rheb and RhoA are both 11-residues long, highly polar, and lack a secondary structure, while the N-terminally myristoylated DNTE is much longer, more complex in sequence composition, and is partially helical. In addition, the small GTPases from which the three membrane anchors were derived diverge in their preference for cellular membranes, with Rheb primarily residing in ER membranes, RhoA in the PM, and DiRas3 more widely distributed but with a preference for the PM. Therefore, we simulated each peptide in a different model membrane: Rheb in a bilayer of lipid composition approximating that of the ER, RhoA in a simplified PM model membrane, and DNTE in a complex bilayer following exploratory simulations in simpler bilayers. Results from the simulations indicate that the three lipidated IDRs display a wide range of membrane organization profiles and conformational dynamics, and sampling of semistable conformational substates is correlated with the combined effects of target membrane lipid composition and IDR sequence. Specifically, the PBD of RhoA and DNTE stabilizes specific conformational substates by interacting with anionic lipids, in agreement with observations in the KRAS membrane anchor.14,15,19,20 In contrast, the IDR of Rheb lacks not only a PBD but also a net charge and therefore only weakly interacts with PE but less so with the anionic PI. The plasma membrane is highly enriched with anionic lipids, while the ER membrane is more neutral. This contrast highlights the importance of complementarity between a lipidated IDR sequence and the lipid composition of its target membrane. We note in this context that lipid species not included in the current simulations, such as phosphorylated PIPs, may modulate the population distribution of the conformational substates we have observed. This will be tested in future studies.
The high density of polar residues in Rheb may also reduce its membrane affinity, and the lack of favorable electrostatic or hydrophobic interactions may prevent formation of metastable conformational substates. We have shown previously that the conformational plasticity of the KRAS16,31,61 and the Rheb and RhoA17 membrane anchors is a key determinant of orientational dynamics of the full-length proteins on membrane surfaces. Insights from the current work provide a molecular basis for how the interplay between the anchor sequence and lipids may modulate membrane reorientation of small GTPases. Conversely, transient interactions of the catalytic domain with the flexible anchor or with lipids may stabilize certain lipid anchor conformations. Furthermore, interaction with negatively charged phospholipids is believed to be an important mechanism by which KRAS forms nanoclusters on the PM to enhance signaling efficacy.62 Besides KRAS, there is evidence that other small GTPases such as Rac163,64 also form nanoclusters that may enhance their signaling potential. Although the mechanism of RhoA clustering is unclear65 and there is no evidence for DNTE forming nanoclusters, our findings that their membrane anchors preferentially interact with and segregate anionic lipids imply that these proteins may also be able to form signaling nanoclusters through a similar lipid sorting mechanism. Moreover, DNTE segregated PS lipids to such a degree that other lipid species were far less present around the peptide (Figure 7). This result corroborates experimental studies that have shown that DNTE interacts strongly with anionic PIP lipids and, albeit with less affinity, with PS lipids.25 While DiRas3 has been shown to prevent formation of KRAS nanoclusters, possibly through competitive dimerization with KRAS,32 our observations on DNTE’s ability to displace other lipid species in favor of PS suggest that competitive interactions with anionic phospholipids may also contribute to the disruption of KRAS nanoclusters whose stability has been shown to be PS-dependent.62,66
Supplementary Material
ACKNOWLEDGMENTS
This work was supported in part by the National Institutes of Health Institute of General Medicine grant R01GM144836 to A.A.G. C.M.H. was supported by an F32 Fellowship grant # T32GM139801. Computational resources have been provided by the Texas Advanced Computing Center (TACC) and Anton 2. Anton 2 computer time was provided by the Pittsburgh Supercomputing Center (PSC) through Grant R01GM116961 from the National Institutes of Health. The Anton 2 machine at PSC was generously made available by D.E. Shaw Research. The authors thank Violeta Burns Casamayor for running the initial exploratory simulations.
Footnotes
The authors declare no competing financial interest.
Supporting Information
The Supporting Information is available free of charge at https://pubs.acs.org/doi/10.1021/acs.jpcb.4c01876.
Molecular structure of lipids used in the current simulations (Figure S1); text describing the generation of initial structure for the final DNTE simulation; time evolution of DNTE backbone RMSD and secondary structure during two exploratory MD simulations (Figure S2); time evolution of bilayer thickness (Figure S3); time evolution of peptide backbone RMSD (Figure S4); acyl chain order parameters (Figure S5); evolution of DNTE secondary structure during the final simulation (Figure S6); radial pair distribution plots (Figure S7); 2D particle density for lipids in the peptide-free leaflet of the Rheb simulation on the same density scale as in Figure 7 (Figure S8); and references (PDF)
Complete contact information is available at: https://pubs.acs.org/10.1021/acs.jpcb.4c01876
Contributor Information
Chase M. Hutchins, Department of Integrative Biology and Pharmacology, McGovern Medical School, University of Texas Health Science Center at Houston, Houston, Texas 77030, United States; Biochemistry and Cell Biology Program & Therapeutics and Pharmacology Program, MD Anderson Cancer Center UTHealth Graduate School of Biomedical Sciences, Houston, Texas 77030, United States
Alemayehu A. Gorfe, Department of Integrative Biology and Pharmacology, McGovern Medical School, University of Texas Health Science Center at Houston, Houston, Texas 77030, United States; Biochemistry and Cell Biology Program & Therapeutics and Pharmacology Program, MD Anderson Cancer Center UTHealth Graduate School of Biomedical Sciences, Houston, Texas 77030, United States;
Data Availability Statement
Starting structures for the MD simulations reported in this work and analyses scripts can be found at https://github.com/hutchcha/lidrpaperjpcb/tree/main, and trajectories can be accessed directly from Anton 2 at the Pittsburgh Supercomputing Center.
REFERENCES
- (1).Oldfield CJ; Dunker AK Intrinsically Disordered Proteins and Intrinsically Disordered Protein Regions. Annu. Rev. Biochem 2014, 83, 553–584. [DOI] [PubMed] [Google Scholar]
- (2).Granata D; Baftizadeh F; Habchi J; Galvagnion C; De Simone A; Camilloni C; Laio A; Vendruscolo M The Inverted Free Energy Landscape of an Intrinsically Disordered Peptide by Simulations and Experiments. Sci. Rep 2015, 5, No. 15449. [DOI] [PMC free article] [PubMed] [Google Scholar]
- (3).Wright PE; Dyson HJ Intrinsically Disordered Proteins in Cellular Signaling and Regulation. Nat. Rev. Mol. Cell Biol 2015, 16 (1), 18–29. [DOI] [PMC free article] [PubMed] [Google Scholar]
- (4).Iakoucheva LM; Brown CJ; Lawson JD; Obradović Z; Dunker AK Intrinsic Disorder in Cell-Signaling and Cancer-Associated Proteins. J. Mol. Biol 2002, 323 (3), 573–584. [DOI] [PubMed] [Google Scholar]
- (5).Braicu C; Buse M; Busuioc C; Drula R; Gulei D; Raduly L; Rusu A; Irimie A; Atanasov AG; Slaby O; Ionescu C; Berindan-Neagoe I A Comprehensive Review on MAPK: A Promising Therapeutic Target in Cancer. Cancers 2019, 11 (10), 1618. [DOI] [PMC free article] [PubMed] [Google Scholar]
- (6).Goitre L; Trapani E; Trabalzini L; Retta SF The Ras Superfamily of Small GTPases: The Unlocked Secrets. In Ras Signaling: Methods and Protocols; Trabalzini L; Retta SF, Eds.; Humana Press: Totowa, NJ, 2014; pp; pp 1–18. [DOI] [PubMed] [Google Scholar]
- (7).Wennerberg K; Rossman KL; Der CJ The Ras Superfamily at a Glance. J. Cell Sci 2005, 118 (5), 843–846. [DOI] [PubMed] [Google Scholar]
- (8).Macara IG; Lounsbury KM; Richards SA; McKiernan C; Bar-Sagi D The Ras Superfamily of GTPases. FASEB J. Off. Publ. Fed. Am. Soc. Exp. Biol 1996, 10 (5), 625–630. [DOI] [PubMed] [Google Scholar]
- (9).Cox AD; Der CJ Ras Family Signaling: Therapeutic Targeting. Cancer Biol. Ther 2002, 1 (6), 599–606. [DOI] [PubMed] [Google Scholar]
- (10).Qu L; Pan C; He S-M; Lang B; Gao G-D; Wang X-L; Wang Y The Ras Superfamily of Small GTPases in Non-Neoplastic Cerebral Diseases. Front. Mol. Neurosci 2019, 12, 121. [DOI] [PMC free article] [PubMed] [Google Scholar]
- (11).Vetter IR; Wittinghofer A The Guanine Nucleotide-Binding Switch in Three Dimensions. Science 2001, 294 (5545), 1299–1304. [DOI] [PubMed] [Google Scholar]
- (12).Hancock JF; Magee AI; Childs JE; Marshall CJ All Ras Proteins Are Polyisoprenylated but Only Some Are Palmitoylated. Cell 1989, 57 (7), 1167–1177. [DOI] [PubMed] [Google Scholar]
- (13).Hancock JF Ras Proteins: Different Signals from Different Locations. Nat. Rev. Mol. Cell Biol 2003, 4 (5), 373–385. [DOI] [PubMed] [Google Scholar]
- (14).Zhou Y; Prakash P; Liang H; Cho K-J; Gorfe AA; Hancock JF Lipid-Sorting Specificity Encoded in K-Ras Membrane Anchor Regulates Signal Output. Cell 2017, 168 (1), 239–251.e16. [DOI] [PMC free article] [PubMed] [Google Scholar]
- (15).Zhou Y; Prakash PS; Liang H; Gorfe AA; Hancock JF The KRAS and Other Prenylated Polybasic Domain Membrane Anchors Recognize Phosphatidylserine Acyl Chain Structure. Proc. Natl. Acad. Sci. U.S.A 2021, 118 (6), No. e2014605118. [DOI] [PMC free article] [PubMed] [Google Scholar]
- (16).Prakash P; Zhou Y; Liang H; Hancock JF; Gorfe AA Oncogenic K-Ras Binds to an Anionic Membrane in Two Distinct Orientations: A Molecular Dynamics Analysis. Biophys. J 2016, 110 (5), 1125–1138. [DOI] [PMC free article] [PubMed] [Google Scholar]
- (17).Prakash P; Gorfe AA Determinants of Membrane Orientation Dynamics in Lipid-Modified Small GTPases. JACS Au 2022, 2 (1), 128–135. [DOI] [PMC free article] [PubMed] [Google Scholar]
- (18).Prakash P; Gorfe AA Membrane Orientation Dynamics of Lipid-Modified Small GTPases. Small GTPases 2017, 8 (3), 129–138. [DOI] [PMC free article] [PubMed] [Google Scholar]
- (19).Janosi L; Gorfe AA Segregation of Negatively Charged Phospholipids by the Polycationic and Farnesylated Membrane Anchor of Kras. Biophys. J 2010, 99 (11), 3666–3674. [DOI] [PMC free article] [PubMed] [Google Scholar]
- (20).Araya MK; Gorfe AA Phosphatidylserine and Phosphatidylethanolamine Asymmetry Have a Negligible Effect on the Global Structure, Dynamics, and Interactions of the KRAS Lipid Anchor. J. Phys. Chem. B 2022, 126 (24), 4491–4500. [DOI] [PMC free article] [PubMed] [Google Scholar]
- (21).Angarola B; Ferguson SM Weak Membrane Interactions Allow Rheb to Activate mTORC1 Signaling without Major Lysosome Enrichment. Mol. Biol. Cell 2019, 30 (22), 2750–2760. [DOI] [PMC free article] [PubMed] [Google Scholar]
- (22).Saucedo LJ; Gao X; Chiarelli DA; Li L; Pan D; Edgar BA Rheb Promotes Cell Growth as a Component of the Insulin/TOR Signalling Network. Nat. Cell Biol 2003, 5 (6), 566–571. [DOI] [PubMed] [Google Scholar]
- (23).Jaffe AB; Hall A Rho GTPases: Biochemistry and Biology. Annu. Rev. Cell Dev. Biol 2005, 21, 247–269. [DOI] [PubMed] [Google Scholar]
- (24).Yu Y; Xu F; Peng H; Fang X; Zhao S; Li Y; Cuevas B; Kuo WL; Gray JW; Siciliano M; Mills GB; Bast RC NOEY2 (ARHI), an Imprinted Putative Tumor Suppressor Gene in Ovarian and Breast Carcinomas. Proc. Natl. Acad. Sci. U.S.A 1999, 96 (1), 214–219. [DOI] [PMC free article] [PubMed] [Google Scholar]
- (25).Liang X; Jung SY; Fong LW; Bildik G; Gray JP; Mao W; Zhang S; Millward SW; Gorfe AA; Zhou Y; Lu Z; Bast RC Membrane Anchoring of the DIRAS3 N-Terminal Extension Permits Tumor Suppressor Function. iScience 2023, 26 (11), No. 108151. [DOI] [PMC free article] [PubMed] [Google Scholar]
- (26).Mark P; Nilsson L Structure and Dynamics of the TIP3P, SPC, and SPC/E Water Models at 298 K. J. Phys. Chem. A 2001, 105 (43), 9954–9960. [Google Scholar]
- (27).Jo S; Kim T; Iyer VG; Im W CHARMM-GUI: A Web-Based Graphical User Interface for CHARMM. J. Comput. Chem 2008, 29 (11), 1859–1865. [DOI] [PubMed] [Google Scholar]
- (28).Jo S; Lim JB; Klauda JB; Im W CHARMM-GUI Membrane Builder for Mixed Bilayers and Its Application to Yeast Membranes. Biophys. J 2009, 97 (1), 50–58. [DOI] [PMC free article] [PubMed] [Google Scholar]
- (29).van Meer G; Voelker DR; Feigenson GW Membrane Lipids: Where They Are and How They Behave. Nat. Rev. Mol. Cell Biol 2008, 9 (2), 112–124. [DOI] [PMC free article] [PubMed] [Google Scholar]
- (30).Park S; Im W; Pastor RW Developing Initial Conditions for Simulations of Asymmetric Membranes: A Practical Recommendation. Biophys. J 2021, 120 (22), 5041–5059. [DOI] [PMC free article] [PubMed] [Google Scholar]
- (31).Prakash P; Litwin D; Liang H; Sarkar-Banerjee S; Dolino D; Zhou Y; Hancock JF; Jayaraman V; Gorfe AA Dynamics of Membrane-Bound G12V-KRAS from Simulations and Single-Molecule FRET in Native Nanodiscs. Biophys. J 2019, 116 (2), 179–183. [DOI] [PMC free article] [PubMed] [Google Scholar]
- (32).Sutton MN; Lu Z; Li Y-C; Zhou Y; Huang T; Reger AS; Hurwitz AM; Palzkill T; Logsdon C; Liang X; Gray JW; Nan X; Hancock J; Wahl GM; Bast RC DIRAS3 (ARHI) Blocks RAS/MAPK Signaling by Binding Directly to RAS and Disrupting RAS Clusters. Cell Rep. 2019, 29 (11), 3448–3459.e6. [DOI] [PMC free article] [PubMed] [Google Scholar]
- (33).Lorent JH; Levental KR; Ganesan L; Rivera-Longsworth G; Sezgin E; Doktorova M; Lyman E; Levental I Plasma Membranes Are Asymmetric in Lipid Unsaturation, Packing and Protein Shape. Nat. Chem. Biol 2020, 16 (6), 644–652. [DOI] [PMC free article] [PubMed] [Google Scholar]
- (34).Klauda JB; Venable RM; Freites JA; O’Connor JW; Tobias DJ; Mondragon-Ramirez C; Vorobyov I; MacKerell AD; Pastor RW Update of the CHARMM All-Atom Additive Force Field for Lipids: Validation on Six Lipid Types. J. Phys. Chem. B 2010, 114 (23), 7830–7843. [DOI] [PMC free article] [PubMed] [Google Scholar]
- (35).Best RB; Zhu X; Shim J; Lopes PEM; Mittal J; Feig M; MacKerell AD Optimization of the Additive CHARMM All-Atom Protein Force Field Targeting Improved Sampling of the Backbone φ, ψ and Side-Chain X1 and X2 Dihedral Angles. J. Chem. Theory Comput 2012, 8 (9), 3257–3273. [DOI] [PMC free article] [PubMed] [Google Scholar]
- (36).Phillips JC; Hardy DJ; Maia JDC; Stone JE; Ribeiro JV; Bernardi RC; Buch R; Fiorin G; Hénin J; Jiang W; McGreevy R; Melo MCR; Radak BK; Skeel RD; Singharoy A; Wang Y; Roux B; Aksimentiev A; Luthey-Schulten Z; Kalé LV; Schulten K; Chipot C; Tajkhorshid E Scalable Molecular Dynamics on CPU and GPU Architectures with NAMD. J. Chem. Phys 2020, 153 (4), No. 044130. [DOI] [PMC free article] [PubMed] [Google Scholar]
- (37).Abraham MJ; Murtola T; Schulz R; Páll S; Smith JC; Hess B; Lindahl E GROMACS: High Performance Molecular Simulations through Multi-Level Parallelism from Laptops to Supercomputers. SoftwareX 2015, 1–2, 19–25. [Google Scholar]
- (38).Darden T; York D; Pedersen L Particle Mesh Ewald: An N· log(N) Method for Ewald Sums in Large Systems. J. Chem. Phys 1993, 98 (12), 10089–10092. [Google Scholar]
- (39).Elber R; Ruymgaart AP; Hess B SHAKE Parallelization. Eur. Phys. J. Spec. Top 2011, 200 (1), 211–223. [DOI] [PMC free article] [PubMed] [Google Scholar]
- (40).Hess B; Bekker H; Berendsen HJC; Fraaije JGEM LINCS: A Linear Constraint Solver for Molecular Simulations. J. Comput. Chem 1997, 18 (12), 1463–1472. [Google Scholar]
- (41).Bussi G; Donadio D; Parrinello M Canonical Sampling through Velocity Rescaling. J. Chem. Phys 2007, 126 (1), No. 014101. [DOI] [PubMed] [Google Scholar]
- (42).Parrinello M; Rahman A Polymorphic Transitions in Single Crystals: A New Molecular Dynamics Method. J. Appl. Phys 1981, 52 (12), 7182–7190. [Google Scholar]
- (43).Shaw DE; Grossman JP; Bank JA; Batson B; Butts JA; Chao JC; Deneroff MM; Dror RO; Even A; Fenton CH; Forte A; Gagliardo J; Gill G; Greskamp B; Ho CR; Ierardi DJ; Iserovich L; Kuskin JS; Larson RH; Layman T; Lee L-S; Lerer AK; Li C; Killebrew D; Mackenzie KM; Mok SY-H; Moraes MA; Mueller R; Nociolo LJ; Peticolas JL; Quan T; Ramot D; Salmon JK; Scarpazza DP; Schafer UB; Siddique N; Snyder CW; Spengler J; Tang PTP; Theobald M; Toma H; Towles B; Vitale B; Wang SC; Young C Anton 2: Raising the Bar for Performance and Programmability in a Special-Purpose Molecular Dynamics Supercomputer. In SC ′14: Proceedings of the International Conference for High Performance Computing, Networking, Storage and Analysis 2014; pp 41–53. [Google Scholar]
- (44).Gowers RJ; Linke M; Barnoud J; Reddy TJE; Melo MN; Seyler SL; Domański J; Dotson DL; Buchoux S; Kenney IM; Beckstein O MDAnalysis: A Python Package for the Rapid Analysis of Molecular Dynamics Simulations. In Proceedings of the Python in Science Conference 2016; pp 98–105. [Google Scholar]
- (45).Humphrey W; Dalke A; Schulten K VMD: Visual Molecular Dynamics. J. Mol. Graph 1996, 14 (1), 33–38. [DOI] [PubMed] [Google Scholar]
- (46).Virtanen P; Gommers R; Oliphant TE; Haberland M; Reddy T; Cournapeau D; Burovski E; Peterson P; Weckesser W; Bright J; van der Walt SJ; Brett M; Wilson J; Millman KJ; Mayorov N; Nelson ARJ; Jones E; Kern R; Larson E; Carey CJ; Polat İ; Feng Y; Moore EW; VanderPlas J; Laxalde D; Perktold J; Cimrman R; Henriksen I; Quintero EA; Harris CR; Archibald AM; Ribeiro AH; Pedregosa F; van Mulbregt P; et al. SciPy 1.0: Fundamental Algorithms for Scientific Computing in Python. Nat. Methods 2020, 17 (3), 261–272. [DOI] [PMC free article] [PubMed] [Google Scholar]
- (47).Smith P; Lorenz CD LiPyphilic: A Python Toolkit for the Analysis of Lipid Membrane Simulations. J. Chem. Theory Comput 2021, 17 (9), 5907–5919. [DOI] [PubMed] [Google Scholar]
- (48).Scherer MK; Trendelkamp-Schroer B; Paul F; Pérez-Hernández G; Hoffmann M; Plattner N; Wehmeyer C; Prinz J-H; Noé F PyEMMA 2: A Software Package for Estimation, Validation, and Analysis of Markov Models. J. Chem. Theory Comput 2015, 11 (11), 5525–5542. [DOI] [PubMed] [Google Scholar]
- (49).Kabsch W; Sander C Dictionary of Protein Secondary Structure: Pattern Recognition of Hydrogen-Bonded and Geometrical Features. Biopolymers 1983, 22 (12), 2577–2637. [DOI] [PubMed] [Google Scholar]
- (50).McGibbon RT; Beauchamp KA; Harrigan MP; Klein C; Swails JM; Hernández CX; Schwantes CR; Wang L-P; Lane TJ; Pande VS MDTraj: A Modern Open Library for the Analysis of Molecular Dynamics Trajectories. Biophys. J 2015, 109 (8), 1528–1532. [DOI] [PMC free article] [PubMed] [Google Scholar]
- (51).Araya MK; Gorfe AA Conformational Ensemble-Dependent Lipid Recognition and Segregation by Prenylated Intrinsically Disordered Regions in Small GTPases. Commun. Biol 2023, 6, 1111. [DOI] [PMC free article] [PubMed] [Google Scholar]
- (52).Leftin A; Molugu TR; Job C; Beyer K; Brown MF Area per Lipid and Cholesterol Interactions in Membranes from Separated Local-Field 13C NMR Spectroscopy. Biophys. J 2014, 107 (10), 2274–2286. [DOI] [PMC free article] [PubMed] [Google Scholar]
- (53).Ferreira TM; Coreta-Gomes F; Ollila OHS; Moreno MJ; Vaz WLC; Topgaard D Cholesterol and POPC Segmental Order Parameters in Lipid Membranes: Solid State 1H-13C NMR and MD Simulation Studies. Phys. Chem. Chem. Phys 2013, 15 (6), 1976–1989. [DOI] [PubMed] [Google Scholar]
- (54).Kučerka N; Nieh M-P; Katsaras J Fluid Phase Lipid Areas and Bilayer Thicknesses of Commonly Used Phosphatidylcholines as a Function of Temperature. Biochim. Biophys. Acta BBA - Biomembr 2011, 1808 (11), 2761–2771. [DOI] [PubMed] [Google Scholar]
- (55).Filippov A; Orädd G; Lindblom G The Effect of Cholesterol on the Lateral Diffusion of Phospholipids in Oriented Bilayers. Biophys. J 2003, 84 (5), 3079–3086. [DOI] [PMC free article] [PubMed] [Google Scholar]
- (56).Drin G; Casella J-F; Gautier R; Boehmer T; Schwartz TU; Antonny B A General Amphipathic α-Helical Motif for Sensing Membrane Curvature. Nat. Struct. Mol. Biol 2007, 14 (2), 138–146. [DOI] [PubMed] [Google Scholar]
- (57).Cui H; Lyman E; Voth GA Mechanism of Membrane Curvature Sensing by Amphipathic Helix Containing Proteins. Biophys. J 2011, 100 (5), 1271–1279. [DOI] [PMC free article] [PubMed] [Google Scholar]
- (58).Giménez-Andrés M; Čopič A; Antonny B The Many Faces of Amphipathic Helices. Biomolecules 2018, 8 (3), 45. [DOI] [PMC free article] [PubMed] [Google Scholar]
- (59).Motegi T; Takiguchi K; Tanaka-Takiguchi Y; Itoh T; Tero R Physical Properties and Reactivity of Microdomains in Phosphatidylinositol-Containing Supported Lipid Bilayer. Membranes 2021, 11 (5), 339. [DOI] [PMC free article] [PubMed] [Google Scholar]
- (60).Redfern DA; Gericke A Domain Formation in Phosphatidylinositol Monophosphate/Phosphatidylcholine Mixed Vesicles. Biophys. J 2004, 86 (5), 2980–2992. [DOI] [PMC free article] [PubMed] [Google Scholar]
- (61).Prakash P; Gorfe AA Probing the Conformational and Energy Landscapes of KRAS Membrane Orientation. J. Phys. Chem. B 2019, 123 (41), 8644–8652. [DOI] [PMC free article] [PubMed] [Google Scholar]
- (62).Zhou Y; Gorfe AA; Hancock JF RAS Nanoclusters Selectively Sort Distinct Lipid Headgroups and Acyl Chains. Front. Mol. Biosci 2021, 8, No. 686338. [DOI] [PMC free article] [PubMed] [Google Scholar]
- (63).Remorino A; De Beco S; Cayrac F; Di Federico F; Cornilleau G; Gautreau A; Perini CM; Masson J-B; Dahan M; Coppey M Gradients of Rac1 Nanoclusters Support Spatial Patterns of Rac1 Signaling. Cell Rep. 2017, 21 (7), 1922–1935. [DOI] [PubMed] [Google Scholar]
- (64).Maxwell KN; Zhou Y; Hancock JF Rac1 Nanoscale Organization on the Plasma Membrane Is Driven by Lipid Binding Specificity Encoded in the Membrane Anchor. Mol. Cell. Biol 2018, 38 (18), No. e00186–18. [DOI] [PMC free article] [PubMed] [Google Scholar]
- (65).de Seze J; Gatin J; Coppey M RhoA Regulation in Space and Time. FEBS Lett. 2023, 597 (6), 836–849. [DOI] [PubMed] [Google Scholar]
- (66).Zhou Y; Wong C-O; Cho K; van der Hoeven D; Liang H; Thakur DP; Luo J; Babic M; Zinsmaier KE; Zhu MX; Hu H; Venkatachalam K; Hancock JF Membrane Potential Modulates Plasma Membrane Phospholipid Dynamics and K-Ras Signaling. Science 2015, 349 (6250), 873–876. [DOI] [PMC free article] [PubMed] [Google Scholar]
Associated Data
This section collects any data citations, data availability statements, or supplementary materials included in this article.
Supplementary Materials
Data Availability Statement
Starting structures for the MD simulations reported in this work and analyses scripts can be found at https://github.com/hutchcha/lidrpaperjpcb/tree/main, and trajectories can be accessed directly from Anton 2 at the Pittsburgh Supercomputing Center.