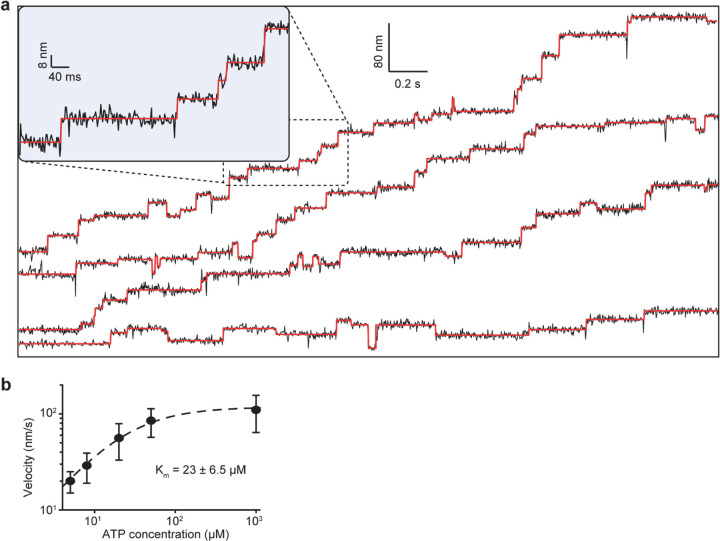
Extended Data Figure 6 |. Velocity of dynein motility under different ATP concentrations.
a, Additional example trajectories of dynein stepping along the MT on-axis at 20 µM ATP. b, The mean velocity of analyzed trajectories under different ATP concentrations. The dashed curve shows that dynein velocity vs. [ATP] follows Michaelis-Menten kinetics with KM near 20 µM (±s.e.).

