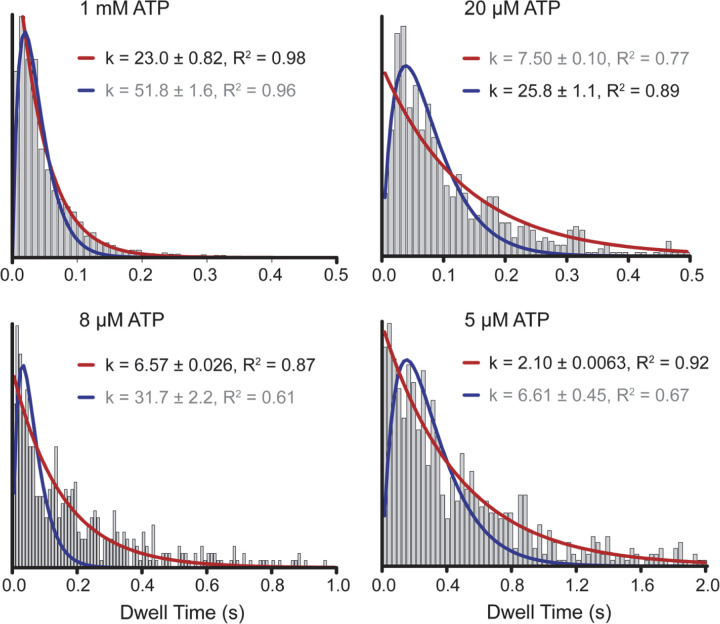
Extended Data Figure 7 |. Dynein rates at different ATP concentrations.
The dwell time distribution of dynein stepping fits better to a single exponential decay (red curves) at limited (5 and 8 µM) and saturating (1 mM) ATP concentrations. In comparison, the dwell time distribution at KM = 20 µM ATP fits better to a Gamma distribution (blue curves). R2 represents the goodness of fit of a model. The fitting parameter of a better fit is highlighted in black.

