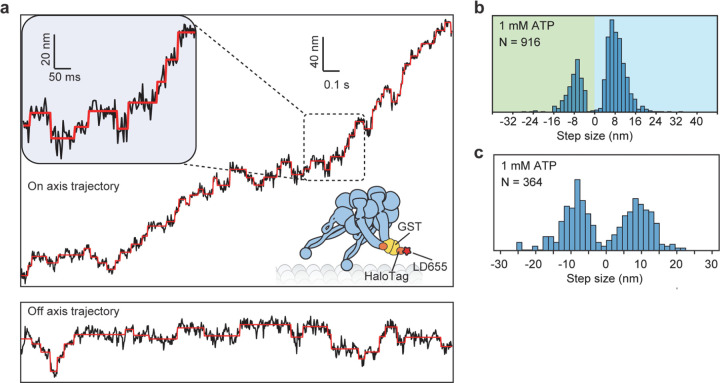
Extended Data Figure 3 |. MINFLUX analysis of tail-labeled dynein.
a, An example trajectory of GST-Dyn314kDa labeled at its tail domain at 1 mM ATP. On- and off-axis displacement of the same motor are shown separately. Red horizontal lines represent a fit to the step finder algorithm. Despite high precision in localization (σ = 3.2 nm), the insert shows large fluctuations in the dye position while the motor dwells on the MT between steps. b, The histogram of the size steps taken by dynein in the on- and off-axis direction. c, The dwell time distribution of tail-labeled dynein fits to a single exponential decay (dashed curve, ±s.e.).

