

Abstract
Escherichia coli biotin ligase site-specifically biotinylates a lysine side chain within a 15-amino acid acceptor peptide (AP) sequence. We show that mammalian cell surface proteins tagged with AP can be biotinylated by biotin ligase added to the medium, while endogenous proteins remain unmodified. The biotin group then serves as a handle for targeting streptavidin-conjugated quantum dots (QDs). This labeling method helps to address the two major deficiencies of antibody-based labeling, which is currently the most common method for targeting QDs to cells: the size of the QD conjugate after antibody attachment and the instability of many antibody–antigen interactions. To demonstrate the versatility of our method, we targeted QDs to cell surface cyan fluorescent protein and epidermal growth factor receptor in HeLa cells and to α-amino-3-hydroxy-5-methyl-4-isoxazolepropionate (AMPA) receptors in neurons. Labeling requires only 2 min, is extremely specific for the AP-tagged protein, and is highly sensitive. We performed time-lapse imaging of single QDs bound to AMPA receptors in neurons, and we compared the trafficking of different AMPA receptor subunits by using two-color pulse–chase labeling.
Keywords: BirA, labeling, streptavidin, glutamate receptor, single molecule
Quantum dots (QDs) are semiconductor nanoparticles that greatly expand the possibilities for fluorescence imaging of cells and living animals (1). Compared with small molecule dyes, the intense fluorescence emission of QDs makes it easier to track single protein molecules (2), they are remarkably resistant to photobleaching (3, 4), their narrow emission spectrum facilitates imaging of many proteins simultaneously (5), and their large two-photon cross sections allow in vivo imaging at greater depths (6). Since QDs have become commercially available, their use to study protein trafficking has grown rapidly. Two key problems we aimed to address in the use of QDs for tracking surface proteins are the size of the QD conjugate and dissociation of the QD from the protein of interest. The QDs themselves have a size comparable to GFP (Fig. 1A) (7). However, QDs are often targeted to the protein of interest with a three-layer strategy: primary antibody, followed by biotinylated secondary antibody, followed by streptavidin-QD (Fig. 1 A). The size of this QD complex (≈50 nm) can affect membrane protein trafficking and can reduce accessibility to crowded locations in cells (8). Our aim was to develop a method to target QDs to cell surface proteins that eliminated the bulky antibodies and provided a stable linkage between the QD and the protein of interest.
Fig. 1.

General strategy for targeting QDs to cell surface proteins. (A) The size of GFP is compared with unconjugated QD605 and QD605-streptavidin conjugated to biotinylated secondary antibody and primary antibody, as used to label a cell surface protein. (B) The AP, GLNDIFEAQKIEWHE (shown in pink), is genetically encoded at the N terminus or C terminus of the protein of interest. Recombinantly expressed biotin ligase (BirA) is added to the cell medium with ATP and biotin, biotinylating AP. Excess biotin is removed by washing. Streptavidin-conjugated QDs are added to bind the biotinylated surface proteins. B, biotin.
Site-specific labeling of proteins in live cells poses an enormous challenge, because one must target the functional groups of one protein amidst all of the other expressed proteins containing the same range of amino acids. The merits and limitations of existing labeling approaches in cells have recently been reviewed (9). Here, we use the Escherichia coli enzyme biotin ligase (BirA) to address the challenge of specificity. BirA biotinylates a 15-amino acid peptide called the acceptor peptide (AP) (10, 11). BirA has previously been used to biotinylate AP-tagged proteins in vitro or when expressed in the cytosol (11, 12). BirA also biotinylates a truncated version of a bacterial transcarboxylase, when enzyme and substrate are coexpressed in the mammalian secretory pathway (13). The mammalian enzyme with biotin ligase activity, holocarboxylase synthetase (14), does not recognize AP as a substrate (12). In our approach for QD targeting (Fig. 1B), a cell surface protein fused to AP is biotinylated by adding recombinant BirA, ATP, and biotin to the medium. The biotinylated protein is then recognized by a streptavidin-conjugated QD. Biotin detection by streptavidin has numerous advantages. It is one of the tightest interactions known (Kd = 10–13 M), with an off-rate on the order of days (15). In addition, streptavidin displays little nonspecific binding and is significantly smaller than an IgG antibody (60 versus 150 kDa), and a large number of streptavidin conjugates are commercially available. Nonspecific cell surface biotinylation is widely used to study membrane protein trafficking (16) and is commonly achieved by incubation of cells with an amine-reactive biotin probe. After lysis, surface proteins can be separated from internal proteins by using streptavidin-agarose. However, nonspecific biotinylation does not allow tracking of individual proteins by microscopy, and lysine residues important for protein function are sometimes modified (17).
α-Amino-3-hydroxy-5-methyl-4-isoxazolepropionate (AMPA) receptors are glutamate-activated ion channels and are tetramers composed of glutamate receptor (GluR) subunits 1–4 in various combinations. There is great interest in imaging AMPA receptors because their trafficking has a key role in modulating synaptic strength and thus learning and memory (18). We show first that BirA attaches biotin specifically to AP-tagged proteins on the surface of fibroblasts. We analyze the speed of this ligation and then show that this method allows QD targeting to specific cell surface proteins. We use BirA to label AMPA receptors in live neurons with QDs and examine the dynamics of the QD-labeled protein and how it colocalizes with synapses. The speed, specificity, and simplicity of labeling with BirA should make it a common tool for the study of cell surface proteins.
Materials and Methods
Bacterial Expression and Purification of BirA. BirA was purified and expressed as described in ref. 19. Briefly, His6-tagged BirA was induced in E. coli JM109 and purified with Ni-nitrilotriacetic acid-agarose. Typical yields were 3 mg/liter of culture. BirA was stable for months in aliquots at –80°C. BirA copurifies with biotin-AMP. To perform appropriate negative controls, biotin-AMP was removed by incubating BirA with a substrate peptide, as described in ref. 19, to give “recycled” BirA. Recycled BirA was used in all experiments, except for that shown in Fig. 8, which is published as supporting information on the PNAS web site.
Cell Surface Biotinylation. Cells were washed in PBS (pH 7.4) with 5 mM MgCl2 (PBS-Mg), and biotinylation was performed in PBS-Mg with 0.3 μM BirA, 10 μM biotin, and 1 mM ATP for 1–60 min at room temperature. The cells were washed twice with PBS-Mg at 4°C and incubated with 10 μg/ml streptavidin-Alexa Fluor 568/Alexa Fluor 488 (Molecular Probes) or 10 nM streptavidin-QD605 (Quantum Dot, Hayward, CA) in PBS-Mg/1% predialyzed BSA for 10 min at 4°C. The cells were washed with PBS-Mg and imaged in the same buffer. Biotinylation was the same for neurons, except PBS-Mg was replaced with Tyrode's solution. For single-particle imaging, neurons were transfected 9 days after plating using calcium phosphate and imaged the next day. Cells were biotinylated for 5 min at 37°C, washed twice, and incubated with 0.4 nM streptavidin-QD605 for 2 min at room temperature. After one wash in Tyrode's solution and a second wash in Tyrode's solution with 10 μM biotin for 5 min, cells were imaged in a temperature-controlled chamber at 37°C. For myc staining, cells were stained with 4 μg/ml anti-myc antibody (Oncogene Science) in PBS-Mg/1% BSA for 30 min at 4°C. After two washes in PBS-Mg, cells were incubated in 20 μg/ml Alexa Fluor 568 anti-mouse IgG (Molecular Probes) in PBS-Mg/1% BSA for 30 min and then washed twice with PBS-Mg. All antibodies and streptavidin conjugates were centrifuged at 15,600 × g for 5 min at 4°C before use to remove aggregates.
Imaging. Images were collected on a Zeiss Axiovert 200M inverted epifluorescence microscope using a ×40 oil-immersion lens and a MicroMAX charge-coupled device camera (Roper Scientific, Trenton, NJ), except for Movie 1, which is published as supporting information on the PNAS web site, for which a 100× oil-immersion lens was used. Cyan fluorescent protein (CFP) (420DF20 excitation, 450DRLP dichroic, and 475DF40 emission), Alexa Fluor 568 (560DF20 excitation, 585 DRLP dichroic, and 605DF30 emission), QD605 (405 broad excitation, 585DRLP dichroic, and 605DF30 emission), yellow fluorescent protein (YFP) and Alexa Fluor 488 (495DF10 excitation, 515DRLP dichroic, and 530DF30 emission), and differential interference contrast images (630DF10 emission) were collected and analyzed with openlab software (Improvision, Lexington, MA). Fluorescence images were background-corrected. Acquisition times ranged from 30 ms to 4 s. Movies were acquired with 0.1-s exposure and 0.3-s total delay between frames. Colocalization values were determined from the dendrites of four or more neurons by using openlab: A region of interest was chosen surrounding a dendrite. Pixels were selected if they were >2 standard deviations above mean intensity. The percentage of colocalization for red or green pixels was calculated as the percentage of selected pixels of that color on which selected pixels of the other color superimposed. For each dendrite, both red and green percentage colocalizations were calculated, and the higher value was used. Means are given ±SE, and significance was determined by using Student's t test.
Immunoblotting. After biotinylating as above, cells were washed in PBS and removed from the dish by scraping (trypsin could cleave AP). Cells were washed again in ice-cold PBS and kept at 4°C thereafter. Cells were lysed in 150 mM NaCl/5 mM EDTA/20 mM Tris·HCl/2 mM PMSF/1% protease inhibitor mixture (Calbiochem)/1% Triton X-100, pH 7.4 for 20 min. The postnuclear supernatant was mixed with an equal volume of 2× SDS/PAGE loading buffer with 5% 2-mercaptoethanol and run on a polyacrylamide gel. The number of cell equivalents loaded per lane was 1.5 × 10⁵. After transfer to a nitrocellulose membrane, the membrane was blocked in Tris-buffered saline with 0.05% Tween 20 (TBST) and 3% BSA for 1 h. The membrane was incubated with 0.67 μg/ml ImmunoPure streptavidin-horseradish peroxidase (Pierce) in TBST for 40 min, washed four times for 5 min each time in TBST, developed in Supersignal West Pico substrate (Pierce), and imaged on a ChemiImager 5500 (Alpha Innotech, San Leandro, CA).
For further information on general materials, plasmid construction, and cell culture and transfection, see Supporting Methods, which is published as supporting information on the PNAS web site.
Results
Site-Specific Biotinylation of AP-Tagged Cell Surface Proteins. Our strategy for site-specific cell surface labeling is illustrated in Fig. 1B. Biotin ligase (BirA) is a 35-kDa protein that specifically biotinylates the 15-amino acid AP tag. We genetically attach AP to either terminus of the protein of interest and add recombinant BirA, ATP, and biotin to the cell medium. The population of biotinylated proteins at the surface is then detected with streptavidin-dye or a streptavidin-QD conjugate. Neither BirA nor streptavidin is membrane-permeable, so intracellular proteins are not labeled.
Initially, to demonstrate our method, we fused AP to CFP targeted to the surface with a signal peptide and the transmembrane (TM) domain of the platelet-derived growth factor receptor (AP-CFP-TM). We transfected this construct into HeLa cells. As a negative control, we made an equivalent construct with a point mutation at the acceptor lysine of AP (Ala-CFP-TM). BirA was added to the cell medium, along with ATP and biotin, and biotinylation was detected with streptavidin conjugated to Alexa Fluor 568 by fluorescence microscopy (Fig. 2). In the presence of BirA, ATP, and biotin, strong cell surface labeling with streptavidin was detected. The CFP signal serves as a control for equivalent expression of the protein target in each condition. A point mutation in AP, omitting BirA, or omitting biotin stopped all labeling. It is possible that other cell types would express endogenous substrates for BirA on their surfaces, diminishing the specificity of this labeling method. However, similar specificity was observed by fluorescence microscopy for AP-tagged proteins in human embryonic kidney (HEK) cells (data not shown), CHO cells (data not shown), and hippocampal neurons (see below).
Fig. 2.

Specific labeling of a cell surface protein by BirA shown by imaging. HeLa cells expressing AP-CFP-TM were biotinylated with BirA for 10 min. Biotinylated proteins at the cell surface were detected with streptavidin-Alexa Fluor 568. Controls are shown with a point mutation in AP (Ala-CFP-TM) or with BirA or biotin omitted from the labeling reaction.
We further tested the specificity of cell surface labeling with BirA by immunoblotting. HeLa cells transfected with AP-CFP-TM were incubated with BirA, ATP, and biotin. Total cell lysate was blotted with streptavidin-horseradish peroxidase (Fig. 3). Bands were detected in the absence of BirA because mammalian cells contain endogenous biotinylated proteins in the mitochondria and cytosol (14). However, there are no biotinylated proteins on the cell surface or in the secretory pathway. The only new biotinylated protein detected after incubation with BirA, ATP, and biotin corresponded to the molecular weight of AP-CFP-TM. Thus, BirA does not recognize endogenous proteins on the surface of HeLa cells, and AP-CFP-TM is not biotinylated by any endogenous enzyme. BirA labeling of AP-GluR2 showed similar specificity by immunoblotting in HeLa and HEK cells (data not shown).
Fig. 3.

Specific labeling of cell surface proteins by BirA shown by immunoblot. HeLa cells transfected with AP-CFP-TM were biotinylated with BirA for 5 min. Total cell lysates were blotted with streptavidin-horseradish peroxidase to detect biotinylated proteins. Results are shown for: lane 1, a point mutation in AP (Ala-CFP-TM); lane 2, without BirA; lane 3, without biotin; lane 4, with all components present. Endogenous biotinylated proteins are labeled with arrows and serve as a control for equivalent loading in each lane.
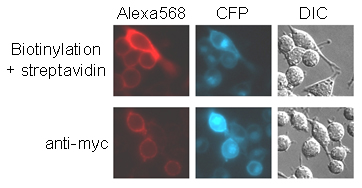
We tested the sensitivity of this method of cell surface labeling by comparing it to antibody detection (Fig. 9, which is published as supporting information on the PNAS web site). AP-CFP-TM also has an extracellular myc tag. We compared the signal from myc to the signal from AP-CFP-TM biotinylation by using either anti-myc primary antibody followed by Alexa Fluor 568-conjugated secondary antibody or streptavidin-Alexa Fluor 568. When we normalized according to CFP intensity, the signal from biotinylation was ≈3-fold brighter than that from myc staining, showing that BirA labeling is a sensitive method for detecting cell surface proteins.
In many studies, it is useful to perform a pulse–chase, following the fate of proteins at various times after, for example, adding a drug or ligand. The shorter the pulse, the better the time resolution for the fate of the target protein. For this reason, we also determined the speed of BirA surface labeling on HeLa cells transfected with the AMPA receptor subunit AP-GluR2. We showed that labeling could be detected with streptavidin-Alexa Fluor 568 after only 1 min of incubation with BirA and was maximal at ≈10 min (Fig. 10, which is published as supporting information on the PNAS web site). We also found that cell surface biotinylation was comparably efficient in PBS with 5 mM MgCl2, Hanks' balanced salt solution, DMEM, or DMEM with 10% FCS (data not shown).
Surface Protein Labeling with QDs. Having established the specificity of BirA for cell surface biotinylation, we determined whether streptavidin-conjugated QDs could be targeted to our protein of interest with similar specificity. The surface of QDs must be properly passivated to avoid nonspecific binding and consequent high backgrounds (1). The streptavidin-QD conjugates that we used in this study were passivated by the manufacturer using a proprietary mixed hydrophobic/philic polymer. HeLa cells expressing AP-CFP-TM were incubated briefly with BirA, and surface biotinylation was detected with streptavidin-QD605 and fluorescence microscopy (Fig. 4). A strong signal was detected on the surface of cells expressing AP-CFP-TM. Point mutation of AP or omitting BirA or biotin abolished the signal, and there was minimal background, even at long exposure times (3 s). Using a shorter exposure time of 0.2 s showed that the labeling was restricted to the cell surface. Thus, BirA provides an effective way to target QDs to cell surface proteins.
Fig. 4.

QD labeling of cell surface proteins in HeLa cells. HeLa cells expressing AP-CFP-TM were biotinylated with BirA for 5 min. Biotinylation was detected with streptavidin-QD605. A control is shown with a point mutation in AP (Ala-CFP-TM). The QD605 signal is shown with 3-s and 0.2-s exposure.
We compared the intensity of QD labeling to the brightest organic dyes, the Alexa Fluor series (20). Biotinylation was easily detectable with streptavidin-Alexa Fluor 568, but, as expected (21), the QD signal was much brighter and could be detected with a 30-fold shorter exposure time (Fig. 11 A, which is published as supporting information on the PNAS web site). Thus, use of QD labeling would help to detect surface proteins with lower copy numbers. We also minimized the total time for QD labeling on the cell surface (Fig. 11B). Labeling was specific and clearly detectable after 2 min, showing that BirA can give good time resolution for tracking surface proteins with QDs.
To test the generality of this method for QD targeting, we attached AP to the epidermal growth factor receptor (EGFR). After incubating with BirA and streptavidin-QD605, AP-EGFR was clearly detected by fluorescence microscopy (Fig. 11C), whereas mutation of the acceptor lysine completely abolished labeling.
Site-Specific Targeting of QDs with BirA in Neurons. HeLa cells are robust to experimental manipulation, easy to transfect, and able to express recombinant proteins at high levels on the cell surface. Primary cells, specifically hippocampal neurons in dissociated culture, pose a more challenging test of our labeling method and allow us to determine whether we can use BirA as a tool for analyzing the dynamics of AMPA receptor trafficking.
Hippocampal neurons were transfected with AP-GluR2 and incubated with BirA. Streptavidin-conjugated QDs were then used to detect surface biotinylation (Fig. 5). QD fluorescence was clearly detected on cells expressing AP-GluR2, indicated by the presence of the cotransfection marker CFP, but not on untransfected cells. The signal was abolished by point mutation of AP (Fig. 5) or by omitting BirA or biotin (data not shown). It is unlikely that AP would disrupt the function of the AMPA receptor because fusion at the same site to the much larger GFP did not change localization, interaction with other subunits, or electrophysiological properties of GluR1 (22) or GluR2 (23). Thus, BirA allows cell surface labeling of AP-tagged proteins but does not label endogenous proteins in neurons, which should allow our method to be used for studies of neurotransmitter receptor trafficking.
Fig. 5.

Targeting QDs to AP-tagged AMPA receptors in neurons. Neurons transfected with AP-GluR2 were labeled with BirA for 5 min and then incubated with streptavidin-QD605. A control is shown with a point mutation in AP (Ala-GluR2). CFP was used as a cotransfection marker.
Effect of the QD Label on AMPA Receptor Localization. QDs greatly facilitate single-molecule tracking of cell surface proteins, which gives crucial information on internalization, diffusion, and the presence of membrane domains. However, there is some concern that the size of the QD reduces movement of attached proteins. For our method, we wanted to test (i) whether streptavidin-QDs could bind to biotinylated AP-GluR2 at the synapse and (ii) whether we could detect any difference in the distribution of AP-GluR2, when it is detected with streptavidin-QD versus streptavidin conjugated to the much smaller Alexa Fluor dyes.
Hippocampal neurons were cotransfected with AP-GluR2 and the synaptic marker postsynaptic density (PSD)-95 fused to YFP (24). After incubating with BirA, cells were labeled with streptavidin-QD605 (Fig. 6A). The colocalization between streptavidin-QD605 and PSD-95-YFP was moderate at 70 ± 3%. QD staining was visible at some PSD-95-YFP puncta, suggesting that the size of the QD does not eliminate synaptic localization. However, there were many regions with only QD or only PSD-95-YFP staining. The specificity of the QD staining was demonstrated by using cells transfected with Ala-GluR2 (data not shown). To determine whether this nonsynaptic staining of GluR2 was caused by AP (without the QD attachment), we repeated the experiment but detected biotinylation of AP-GluR2 with the smaller probe streptavidin-Alexa Fluor 568 (Fig. 6A). In this case, the degree of overlap between streptavidin-Alexa Fluor 568 and PSD-95-YFP was significantly greater (80 ± 3%; P < 0.05), with streptavidin-Alexa Fluor 568 staining visible at nearly all PSD-95-YFP puncta. This difference in colocalization indicates that some synaptic AP-GluR2 molecules are not accessible to streptavidin-QD605, most likely because of QD size.
Fig. 6.

The effect of QD size on surface labeling in neurons. (A) Neurons expressing AP-GluR2 and the synaptic marker PSD-95-YFP were labeled with BirA for 10 min at 37°C. After biotinylation, neurons were stained with streptavidin-QD605. (Middle) The staining at higher zoom. (Bottom) The same experiment, except the biotinylation was detected with streptavidin-Alexa Fluor 568 instead of streptavidin-QD605. (B) Neurons expressing AP-GluR2 were labeled with BirA for 10 min at 37°C. They were then incubated simultaneously with streptavidin-Alexa Fluor 488 and streptavidin-QD605.
To further investigate this, we also transfected neurons with AP-GluR2 alone. Then, after site-specific biotinylation, streptavidin-QD605 and streptavidin-Alexa Fluor 488 were allowed to compete for binding to biotinylated AP-GluR2 (Fig. 6B). The QD signal and Alexa Fluor 488 signal overlapped at many places but were distinct in other places (colocalization = 58 ± 3%), indicating that QD size can affect streptavidin recognition of certain AP-GluR2 subpopulations.
Analysis of AMPA Receptor Trafficking by Using Two-Color Pulse–Chase Labeling. To map the changing distribution of a cell surface protein with BirA, we incubated the tagged AMPA receptor subunits AP-GluR1 or AP-GluR2 at the neuron surface with BirA and briefly labeled with streptavidin-Alexa Fluor 488. We then added glycine to stimulate activation-induced remodeling of the neuronal surface (25). The cells were labeled a second time with BirA, and this population was detected with streptavidin-QD605 (Fig. 7). Labeling of AP-GluR1 was barely detectable in the basal state, but a good signal was observed after glycine stimulation. Ala-GluR1 did not give any signal under the same conditions (data not shown). In contrast, AP-GluR2 gave a good signal in the basal state, and the signal was little affected by glycine treatment, in agreement with the results of Passafaro et al. (26).
Fig. 7.

Pulse–chase labeling of AMPA receptor subunits. Neurons were transfected with AP-GluR1 or AP-GluR2 and labeled with BirA for 10 min at 37°C followed by streptavidin-Alexa Fluor 488 for 10 min at room temperature. After 3 min at room temperature with 200 μM glycine, the neurons were again incubated with BirA for 10 min at 37°C and streptavidin-QD605 for 10 min at 4°C before imaging.
Single-Particle Imaging of QDs Bound to Neuronal Proteins. We made use of the photophysical properties of QDs to track the movements of single AP-tagged AMPA receptors in neurons. We cotransfected hippocampal neurons with AP-GluR2 and PSD-95-YFP. After brief incubation with BirA and then streptavidin-QD605 (at 25-fold lower concentration than for Figs. 5, 6, 7), we imaged the dynamics of QD-labeled AP-GluR2 proteins (Movie 1). We were able to detect single QDs bound to the neurons, as determined by comparison to the intensity of diluted QDs spread on a glass slide (data not shown) and by the QD blinking behavior (27) (particles whose fluorescence completely disappears and then abruptly reappears, as plotted in Fig. 12, which is published as supporting information on the PNAS web site). A proportion of AP-GluR2 molecules showed rapid movement to and from regions that were largely immobile. Low mobility may reflect tethering to scaffold proteins or endocytosis of the QD bound to AP-GluR2 (28). We observed stable signals at PSD-95-YFP puncta (two examples are marked with arrows), but it is possible that other immobile spots also represent synapses that could be resolved with Mitotracker labeling (8).
Discussion
We have developed a general method to target QDs to cell surface proteins. Biotin ligase (BirA) specifically recognizes proteins bearing an AP at the cell surface, as demonstrated by fluorescence microscopy and immunoblotting. Biotinylated proteins at the cell surface can then be detected by streptavidin-conjugated QDs. We demonstrated this method for surface-displayed CFP and the epidermal growth factor receptor in HeLa cells and for GluR1 and GluR2 in neurons. Because biotinylation can be detected after 1 min, this method has the potential to give precise time resolution for studies of cell surface trafficking. The small size of AP means that it is unlikely to perturb folding, secretion, and protein–protein interactions during trafficking to the surface, compared with fluorescent proteins (GFP is 238 residues) (29, 30) or other proteins directing site-specific labeling, such as O6-alkylguanine-DNA alkyltransferase (31) or acyl carrier protein (32).
A key advantage of QDs is their photostability, which allows imaging over much longer periods than organic dyes. However, if cells are to be imaged over periods of hours to days, it is of no use if the QD has already detached from the protein of interest. Thus, the stability of streptavidin–biotin interaction in our system may help to realize the potential of QDs for long-term imaging. Also, using biotin to direct QD labeling significantly reduces the size of the QD conjugate compared with two- or three-layer antibody targeting. Using biotin ligase targeting will reduce the steric hindrance of the QD conjugate that may restrict access to certain regions of the cell surface or impair endocytosis. Fab antibody fragments could be used instead to reduce the size of QD antibody conjugates, but they tend to dissociate rapidly from their target protein. We biotinylated the AMPA receptor subunit GluR2 tagged with AP on neurons and tested the colocalization with a synaptic marker. QD fluorescence was present at many synapses, but the degree of colocalization was less than when AP-GluR2 was detected with streptavidin-Alexa Fluor 488. Similarly, when neurons expressing AP-GluR2 were biotinylated and coincubated with streptavidin-Alexa Fluor 488 and streptavidin-QD, there was only partial overlap between the Alexa Fluor 568 and QD signal. Thus, even though we have reduced the size of the QD conjugate compared with previous studies (8), the QD may still restrict access to certain parts of the cell surface. Because QDs can themselves be detected on the electron microscope (33), analysis of QD-labeled neurons by electron microscopy should allow us to address at greater resolution the question of access to synapses (2).
One concern common to targeting QDs with antibodies, streptavidin, or receptor ligands is the difficulty of attaching a single binding unit to the QD, which means that it is possible for the QD to cross-link cell surface proteins and thus disrupt their function. Using an excess of QD over the protein target helps to promote monovalent binding and minimize cross-linking. Derivatizing the QD surface with a single streptavidin protein and using monomeric rather than tetrameric streptavidin (34) could eliminate this concern. Also, an apprehension regarding the use of BirA for surface labeling is the presence of ATP in the labeling medium, because ATP and its degradation products can activate signaling pathways (35). However, recombinant BirA copurifies with biotin-AMP in the active site (Kd = 10–10 M) (36), and we have shown that the BirA–biotin–AMP complex can efficiently label AP-tagged proteins without addition of ATP to cells (Fig. 8).
Apart from its use in targeting QDs, BirA labeling of surface proteins could become a general method for analyzing protein–protein interactions and trafficking of cell surface proteins. For example, BirA can label proteins with 3H biotin (data not shown), or streptavidin could be used for immunoprecipitation, immunoblotting, or flow cytometry of surface proteins biotinylated with BirA. The advantages over genetically encoded tags for antibody recognition, such as myc or hemagglutinin, are two-fold. First, one can pulse-label a cohort of surface molecules with BirA, and the chase can be conducted with the protein modified only by the addition of a biotin group (0.24 kDa) rather than an antibody (150 kDa), so there will be less perturbation of protein interactions and trafficking. The biotin group can then be detected with streptavidin after the chase is over. Second, the remarkable stability of biotin-streptavidin binding enables more sensitive and stable detection and allows more stringent washing for purification, which improves the signal-to-noise ratio (37–39). However, antibodies to endogenous proteins, when available, do avoid the concern of the effect of overexpression when observing the behavior of transfected proteins.
The movement of AMPA receptors in the plasma membrane is important for synaptic plasticity, because both diffusion from extrasynaptic sites and exocytosis of AMPA receptors strengthen synapses (28). Our initial studies tracking GluR2 dynamics using BirA and QD labeling showed that we could detect single QDs, even using lamp rather than laser excitation. The mobility of AP-GluR2 is dramatic (8). BirA targeting of QDs could be used to investigate what factors control this mobility, and observations could be extended to GluR1 and GluR3. AMPA receptor trafficking has been analyzed with other labeling approaches (26, 40, 41). For example, fusion of GFP to GluR1 showed activity-dependent movement into dendritic spines (22), but pH-sensitive GFP was required to distinguish GluR1 in vesicles near the cell surface from GluR1 inserted into the postsynaptic membrane (41). The moderate brightness and multiple dark states of fluorescent proteins, however, make them poor for single particle imaging. AMPA receptors have also been tagged with a tetracysteine motif and observed with FlAsH, a fluorescent arsenical probe (42). However, FlAsH is not suitable for cell surface labeling, because it requires reduction of cell surface thiols, and the labeling protocol requires an hour, so rapid events cannot be detected. Biotin ligase labeling provides a specific, rapid, and generally applicable method for detecting and tracking cell surface proteins.
Supplementary Material
Acknowledgments
We thank Tanabe U.S.A. (San Diego) for biotin; I. Chen, E. Njie, J. Baskin, B. Schneider, C.-W. Lin, and H. Ames for assistance; and M. Bawendi, S. S. Licht, and R. Y. Tsien for helpful advice. This paper is dedicated to A. D. B. Arnold. This work was supported by National Institutes of Health Grants K22-HG002671-01 and 1 P20GM072029-01, the EJLB Foundation, Massachusetts Institute of Technology (MIT), a Computational and Systems Biology Initiative MIT-Merck Postdoctoral Fellowship (to M.H.), a Special Postdoctoral Researchers Fellowship from RIKEN (to K.T.), and The Ellison Medical Foundation (Y.H.).
Author contributions: M.H., Y.H., and A.Y.T. designed research; M.H. performed research; K.T. contributed new reagents/analytic tools; M.H. and A.Y.T. analyzed data; and M.H. and A.Y.T. wrote the paper.
Abbreviations: QD, quantum dot; AP, acceptor peptide; AMPA, α-amino-3-hydroxy-5-methyl-4-isoxazolepropionate; GluR, glutamate receptor; CFP, cyan fluorescent protein; YFP, yellow fluorescent protein; PSD, postsynaptic density; TM, transmembrane; BirA, biotin ligase.
References
- 1.Gao, X., Yang, L., Petros, J. A., Marshall, F. F., Simons, J. W. & Nie, S. (2005) Curr. Opin. Biotechnol. 16, 63–72. [DOI] [PubMed] [Google Scholar]
- 2.Dahan, M., Levi, S., Luccardini, C., Rostaing, P., Riveau, B. & Triller, A. (2003) Science 302, 442–445. [DOI] [PubMed] [Google Scholar]
- 3.Chan, W. C. & Nie, S. (1998) Science 281, 2016–2018. [DOI] [PubMed] [Google Scholar]
- 4.Bruchez, M., Jr., Moronne, M., Gin, P., Weiss, S. & Alivisatos, A. P. (1998) Science 281, 2013–2016. [DOI] [PubMed] [Google Scholar]
- 5.Han, M., Gao, X., Su, J. Z. & Nie, S. (2001) Nat. Biotechnol. 19, 631–635. [DOI] [PubMed] [Google Scholar]
- 6.Larson, D. R., Zipfel, W. R., Williams, R. M., Clark, S. W., Bruchez, M. P., Wise, F. W. & Webb, W. W. (2003) Science 300, 1434–1436. [DOI] [PubMed] [Google Scholar]
- 7.Jaiswal, J. K. & Simon, S. M. (2004) Trends Cell Biol. 14, 497–504. [DOI] [PubMed] [Google Scholar]
- 8.Groc, L., Heine, M., Cognet, L., Brickley, K., Stephenson, F. A., Lounis, B. & Choquet, D. (2004) Nat. Neurosci. 7, 695–696. [DOI] [PubMed] [Google Scholar]
- 9.Chen, I. & Ting, A. Y. (2005) Curr. Opin. Biotechnol. 16, 35–40. [DOI] [PubMed] [Google Scholar]
- 10.Schatz, P. J. (1993) Biotechnology (N.Y.) 11, 1138–1143. [DOI] [PubMed] [Google Scholar]
- 11.Beckett, D., Kovaleva, E. & Schatz, P. J. (1999) Protein Sci. 8, 921–929. [DOI] [PMC free article] [PubMed] [Google Scholar]
- 12.de Boer, E., Rodriguez, P., Bonte, E., Krijgsveld, J., Katsantoni, E., Heck, A., Grosveld, F. & Strouboulis, J. (2003) Proc. Natl. Acad. Sci. USA 100, 7480–7485. [DOI] [PMC free article] [PubMed] [Google Scholar]
- 13.Parrott, M. B. & Barry, M. A. (2001) Biochem. Biophys. Res. Commun. 281, 993–1000. [DOI] [PubMed] [Google Scholar]
- 14.Chapman-Smith, A. & Cronan, J. E., Jr. (1999) Biomol. Eng. 16, 119–125. [DOI] [PubMed] [Google Scholar]
- 15.Piran, U. & Riordan, W. J. (1990) J. Immunol. Methods 133, 141–143. [DOI] [PubMed] [Google Scholar]
- 16.Hurley, W. L., Finkelstein, E. & Holst, B. D. (1985) J. Immunol. Methods 85, 195–202. [DOI] [PubMed] [Google Scholar]
- 17.Gite, S., Reddy, G. & Shankar, V. (1992) Biochem. J. 285, Part 2, 489–494. [DOI] [PMC free article] [PubMed] [Google Scholar]
- 18.Malinow, R. & Malenka, R. C. (2002) Annu. Rev. Neurosci. 25, 103–126. [DOI] [PubMed] [Google Scholar]
- 19.Chen, I., Howarth, M., Lin, W. & Ting, A. Y. (2005) Nat. Methods 2, 99–104. [DOI] [PubMed] [Google Scholar]
- 20.Panchuk-Voloshina, N., Haugland, R. P., Bishop-Stewart, J., Bhalgat, M. K., Millard, P. J., Mao, F., Leung, W.-Y. & Haugland, R. P. (1999) J. Histochem. Cytochem. 47, 1179–1188. [DOI] [PubMed] [Google Scholar]
- 21.Wu, X., Liu, H., Liu, J., Haley, K. N., Treadway, J. A., Larson, J. P., Ge, N., Peale, F. & Bruchez, M. P. (2003) Nat. Biotechnol. 21, 41–46. [DOI] [PubMed] [Google Scholar]
- 22.Shi, S. H., Hayashi, Y., Petralia, R. S., Zaman, S. H., Wenthold, R. J., Svoboda, K. & Malinow, R. (1999) Science 284, 1811–1816. [DOI] [PubMed] [Google Scholar]
- 23.Shi, S., Hayashi, Y., Esteban, J. A. & Malinow, R. (2001) Cell 105, 331–343. [DOI] [PubMed] [Google Scholar]
- 24.Craven, S. E., El Husseini, A. E. & Bredt, D. S. (1999) Neuron 22, 497–509. [DOI] [PubMed] [Google Scholar]
- 25.Lu, W., Man, H., Ju, W., Trimble, W. S., MacDonald, J. F. & Wang, Y. T. (2001) Neuron 29, 243–254. [DOI] [PubMed] [Google Scholar]
- 26.Passafaro, M., Piech, V. & Sheng, M. (2001) Nat. Neurosci. 4, 917–926. [DOI] [PubMed] [Google Scholar]
- 27.Nirmal, M., Dabbousi, B. O., Bawendi, M. G., Macklin, J. J., Trautman, J. K., Harris, T. D. & Brus, L. E. (1996) Nature 383, 802–804. [Google Scholar]
- 28.Choquet, D. & Triller, A. (2003) Nat. Rev. Neurosci. 4, 251–265. [DOI] [PubMed] [Google Scholar]
- 29.Lisenbee, C. S., Karnik, S. K. & Trelease, R. N. (2003) Traffic 4, 491–501. [DOI] [PubMed] [Google Scholar]
- 30.Huh, W. K., Falvo, J. V., Gerke, L. C., Carroll, A. S., Howson, R. W., Weissman, J. S. & O'Shea, E. K. (2003) Nature 425, 686–691. [DOI] [PubMed] [Google Scholar]
- 31.Keppler, A., Gendreizig, S., Gronemeyer, T., Pick, H., Vogel, H. & Johnsson, K. (2003) Nat. Biotechnol. 21, 86–89. [DOI] [PubMed] [Google Scholar]
- 32.George, N., Pick, H., Vogel, H., Johnsson, N. & Johnsson, K. (2004) J. Am. Chem. Soc. 126, 8896–8897. [DOI] [PubMed] [Google Scholar]
- 33.Nisman, R., Dellaire, G., Ren, Y., Li, R. & Bazett-Jones, D. P. (2004) J. Histochem. Cytochem. 52, 13–18. [DOI] [PubMed] [Google Scholar]
- 34.Wu, S. C. & Wong, S. L. (2004) Anal. Biochem. 331, 340–348. [DOI] [PubMed] [Google Scholar]
- 35.Rathbone, M. P., Middlemiss, P. J., Gysbers, J. W., Andrew, C., Herman, M. A., Reed, J. K., Ciccarelli, R., Di Iorio, P. & Caciagli, F. (1999) Prog. Neurobiol. 59, 663–690. [DOI] [PubMed] [Google Scholar]
- 36.Xu, Y. & Beckett, D. (1994) Biochemistry 33, 7354–7360. [DOI] [PubMed] [Google Scholar]
- 37.Viens, A., Mechold, U., Lehrmann, H., Harel-Bellan, A. & Ogryzko, V. (2004) Anal. Biochem. 325, 68–76. [DOI] [PubMed] [Google Scholar]
- 38.Penalva, L. O. & Keene, J. D. (2004) BioTechniques 37, 604, 606, 608–610. [DOI] [PubMed] [Google Scholar]
- 39.Tucker, J. & Grisshammer, R. (1996) Biochem. J. 317, Part 3, 891–899. [DOI] [PMC free article] [PubMed] [Google Scholar]
- 40.Sekine-Aizawa, Y. & Huganir, R. L. (2004) Proc. Natl. Acad. Sci. USA 101, 17114–17119. [DOI] [PMC free article] [PubMed] [Google Scholar]
- 41.Ashby, M. C., De la Rue, S. A., Ralph, G. S., Uney, J., Collingridge, G. L. & Henley, J. M. (2004) J. Neurosci. 24, 5172–5176. [DOI] [PMC free article] [PubMed] [Google Scholar]
- 42.Ju, W., Morishita, W., Tsui, J., Gaietta, G., Deerinck, T. J., Adams, S. R., Garner, C. C., Tsien, R. Y., Ellisman, M. H. & Malenka, R. C. (2004) Nat. Neurosci. 7, 244–253. [DOI] [PubMed] [Google Scholar]
Associated Data
This section collects any data citations, data availability statements, or supplementary materials included in this article.