Abstract
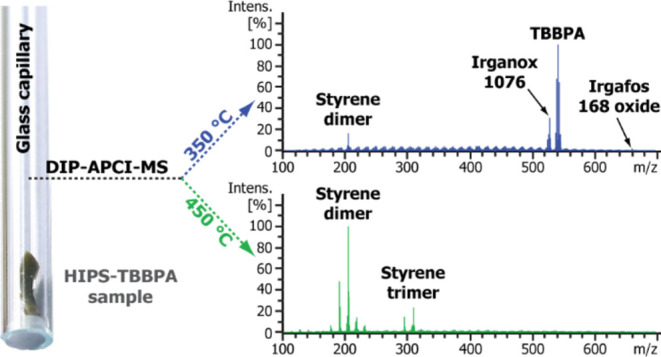
Brominated flame retardants (BFRs) are persistent organic pollutants that pose a major threat to the environment. In this study, a direct insertion probe (DIP) coupled with atmospheric pressure chemical ionization (APCI) quadrupole time-of-flight mass spectrometry (QTOF-MS) was used to characterize additives, especially BFRs, from solid polymer samples with minimal sample preparation. A temperature-programmed DIP analysis, from 150 to 450 °C within 10 min, was utilized to achieve temporal separation of analytes based on their boiling or degradation temperatures, thereby facilitating their easier identification within a single run. Studied BFRs showed different behaviors during the analysis: decabromodiphenyl ether and tetrabromobisphenol A were found to be stable within the studied temperature range, while hexabromocyclododecane already started to debrominate. Our study showed that the DIP-APCI-MS method suited well for the direct qualitative identification of BFRs from polymer matrices. Furthermore, by optimizing the sampling procedure with cryogenic grinding, even quantitative analysis could be performed. The DIP measurements also provided important information about the composition of polymer matrices, including the identification of the comonomers present. Overall, DIP-APCI QTOF-MS was found to be an excellent tool for the compositional analysis of plastic samples. Developing rapid and reliable analysis methods can pave the way for more efficient plastic recycling and the safer use of plastic recyclates.
1. Introduction
Plastics are one of the most used materials in the world due to their versatile physical and chemical properties as well as their low production cost. The amount of plastic waste is increasing steadily but recycling of plastics remains a challenge partly owing to the various additives, e.g., plasticizers, antioxidants, light stabilizers, and flame retardants, added into the polymer matrix to enhance the material properties.1 Some of these additives are particularly harmful to humans and the environment. For example, brominated flame retardants (BFRs), which are used to improve fire resistance in many textiles, electronic appliances, or building materials, have been classified as persistent, bioaccumulative, and toxic substances.2 Consequently, the European Union (EU) and the United Nations have banned or restricted the use of many BFRs. For instance, polybrominated diphenyl ethers (PBDEs), most notably decabromodiphenyl ether (decaBDE), and hexabromocyclododecane (HBCD) have been banned under the persistent organic pollutants (POPs) regulation,2−4 while tetrabromobisphenol A (TBBPA) is currently listed as a substance of very high concern by EU.2,3
Since commercial plastics are often mixtures of different types of polymers and additives, their comprehensive characterization is crucial to promote tightly regulated material reusage and circulation.5 Common analysis techniques for polymers and plastics include thermal analysis (e.g., thermogravimetric analysis and differential scanning calorimetry), spectroscopic techniques (nuclear magnetic resonance, infrared, and Raman spectroscopy), and chromatography (e.g., gel permeation chromatography).6−9 Mass spectrometry (MS) is often utilized in determining polymer molecular weight, polydispersity, heterogeneity, and the presence of additives or degradation products. The most common ionization techniques used in polymer analysis are matrix-assisted laser desorption/ionization (MALDI), atmospheric pressure chemical ionization (APCI), and electrospray ionization (ESI), all of which have their own advantages and limitations.6,10−12
Characterization of BFRs present in plastics is typically based on a time-consuming solvent extraction followed by quantitative analysis with gas chromatography–mass spectrometry (GC-MS) or liquid chromatography–mass spectrometry (LC-MS) techniques.13−21 X-ray fluorescence (XRF) can be used to quickly evaluate the total elemental bromine content of a plastic sample, but it lacks the ability to distinguish between different BFRs.6,22 Additionally, various mass spectrometry-based techniques for the direct analysis of solid samples, e.g., pyrolysis/thermal desorption gas chromatography–mass spectrometry (Py/TD-GC-MS),23−26 atmospheric solids analysis probe (ASAP),27−32 direct analysis in real-time (DART),20,21,33−35 or direct insertion probe (DIP),19,36−39 have been employed in polymer and plastic additive analysis. DIP and ASAP techniques are based on rapid vaporization and/or thermal decomposition of the sample followed by direct ionization and detection of sample components without any chromatographic separation.11,38 DART instead utilizes heated metastable gas flow in the volatilization and ionization of analytes from the sample surface.11 The direct MS-based methods can also be utilized for liquid samples, but their major benefit is the ability to analyze solid samples without any pretreatments and they are especially useful in the analysis of substances of low solvent extraction recoveries like PBDEs.11,39,40
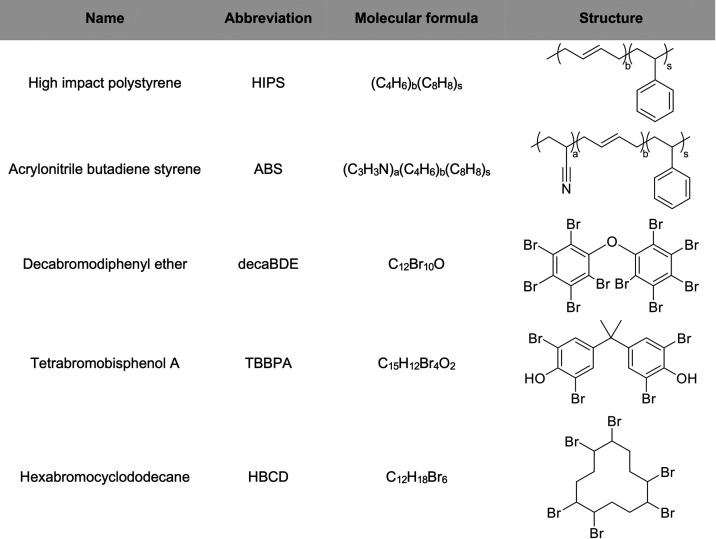
In this study, we report on the identification of BFRs present in synthetic polymer samples using DIP-APCI combined with high-resolution quadrupole time-of-flight (TOF) mass spectrometry. The BFR analysis was demonstrated using micro-compounded polymer samples, comprising high-impact polystyrene (HIPS) or acrylonitrile butadiene styrene (ABS) and different BFRs, namely, decaBDE, TBBPA, or HBCD. Molecular formulas as well as structures of the polymers and BFRs used in the study are presented in Table 1. The applicability of the method for quantitative BFR analysis was evaluated as well. In addition, the use of a temperature-programmed DIP-MS approach for the characterization of the polymer matrix was studied.
Table 1. Polymers and Brominated Flame Retardants Used in This Study.
2. Experimental Section
2.1. Materials and General Considerations
The employed ABS and HIPS polymer matrices were Cycolac Resin MG47F from Sabic, having a melt flow rate (MFR) of 5.6 g/10 min at 230 °C/3.7 kg, and Empera 622N from INEOS Styrolution with an MFR of 4.8 g/10 min at 200 °C/5.0 kg. The BFRs, namely, HBCD (powdered form, purity 95%), TBBPA (powdered form, purity 97%), and decaBDE (powdered form, purity 98%), were purchased from Sigma-Aldrich, while antimony trioxide (Sb2O3, powdered form, purity 99.6%) was obtained from Alfa Aesar. Glass capillaries (Hirschmann melting point tubes, inner diameter 1.15 mm; length 90 mm), quartz filters (Pallflex Tissuquartz 2500QAT-UP), and SiO2 (Sigma-Aldrich, purum p.a.) were prebaked at 500 °C under air for at least 5 h prior to the MS experiments in order to remove any organic impurities.
2.2. Sample Preparation
Various BFR-containing polymer reference samples, comprising injection molding grade ABS or HIPS and different quantities of brominated flame retardants (HBCD, TBBPA, or decaBDE) were manufactured via a small-scale melt-blending method. In addition, Sb2O3, a common synergist used alongside halogenated flame retardants, was added into samples using a Sb2O3-to-BFR ratio of 1:2 (w/w). In order to improve the premixing efficiency of the polymers before melt-blending, the ABS and HIPS pellets were powdered into fine particles by using a POLYMIX PX-MFC 90 D laboratory mill (Kinematica GmbH, Eschbach, Germany). Liquid nitrogen was used to cool the polymer material during the milling process. The reference sample formulations are presented in Table S1, with the target Br concentrations ranging from 1000 up to 10,000 ppm. The materials were accurately weighed, premixed using a SpeedMixer DAC 150 (Hauschild GmbH, Hamm, Germany) (2500 rpm, 30 s), followed by melt-blending using DSM Xplore mini-scale twin-screw extruder (Xplore Instruments BV, Sittard, The Netherlands) (temperature 220 °C, screw speed 100 rpm, mixing time 4 min). After melt-blending in the microcompounder, the compounds were transferred in molten state to Thermo-HAAKE MiniJet injection molding machine (Thermo Fisher Scientific, Massachusetts) to prepare flat specimens, having an approximate size of 25 × 25 × 2 mm3 (injection temperature 220 °C, mold temperature 60 °C, injection time 10 s, pressure 1000 bar, hold time 5 s).
The injection molded polymer samples were directly analyzed with XRF. In the case of mass spectrometric characterization, a small piece of each polymer sample was cut off with a scalpel. For certain MS measurements, the plastic samples were cryogenically ground using liquid nitrogen and a Retsch ZM200 ultracentrifugal mill (Retsch GmbH, Haan, Germany) (sieve hole size 0.5 mm and rotation speed 18,000 rpm). The pulverized samples were dried in an oven at 60 °C under ambient air overnight.
BFR reference samples were prepared by diluting decaBDE, TBBPA, and HBCD powders with prebaked SiO2 to give a final Br concentration of 100,000 ppm. The components were thoroughly mixed with a PerkinElmer vibrating mill.
2.3. Mass Spectrometry
All mass spectrometric experiments were performed on a high-resolution first-generation Bruker timsTOF Q-TOF instrument having an APCI source equipped with a DIP device (Bruker Daltonics GmbH, Bremen, Germany). The samples were packed into glass capillaries, which were closed with small pieces of quartz filter and placed inside the ion source (Figure 1). The sample size was 1.0 ± 0.1 mg for the pulverized samples, whereas for the other samples, it was below 0.1 mg. The vaporizer temperature was ramped from 150 to 450 °C with 50 °C steps, resulting in the analysis time of 10.5 min (Figure 2). The next sample could be introduced into the ion source after a cooling time of approximately 5 min. The instrument was operated in the positive-ion mode and ion transfer parameters were optimized to enable detection of ions in a m/z range between 150 and 1000. A complete set of utilized parameters is presented in Table S2. Prior to the experiments, the mass spectrometer was externally calibrated by using a polystyrene standard. In order to improve the mass accuracy, the obtained DIP-MS data was further internally recalibrated using custom-made reference mass lists (Table S3) for both polymer types (HIPS and ABS), resulting in RMS mass error below 0.5 ppm for the calibrant ion signals. Individual reference mass lists were also utilized for each BFR reference sample. The mass spectrometer was controlled, and the data was acquired using Bruker otofControl 6.2 software, and the data postprocessing and analysis was accomplished using Bruker DataAnalysis 5.1 software. Data was treated semimanually in a targeted manner. Compass IsotopePattern software by Bruker was used to simulate theoretical isotope patterns of brominated species.
Figure 1.
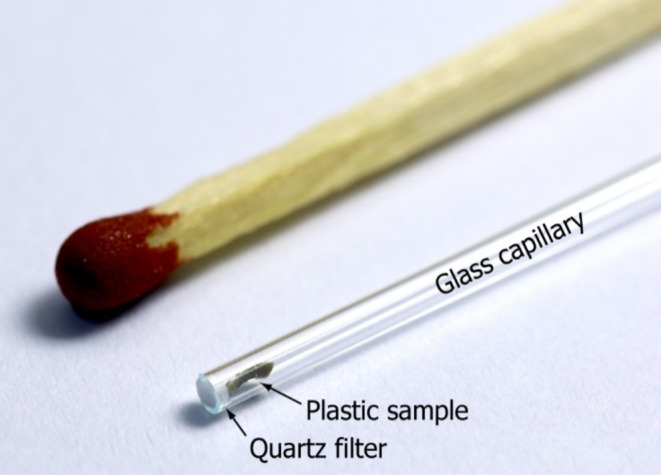
Photograph showing a glass capillary used for the DIP-MS analysis. A plastic sample is placed inside the capillary and closed with a quartz filter. A match is shown as the size reference.
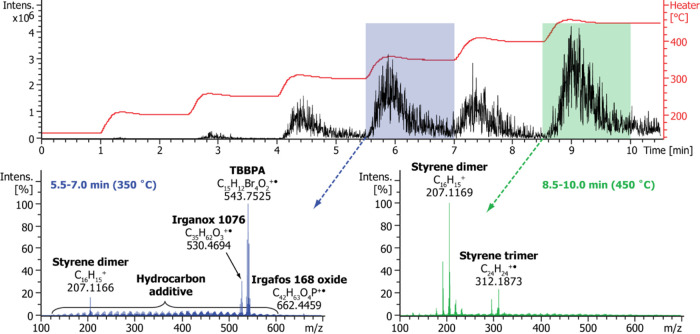
Figure 2.
Exemplary data obtained for a micro-compounded HIPS-TBBPA sample (10,000 ppm of Br) using a temperature-programmed DIP-MS analysis. The top panel shows a total ion chromatogram (TIC) obtained by ramping the vaporizer temperature from 150 to 450 °C, whereas the bottom panels show averaged mass spectra obtained within 5.5–7.0 min (left) and 8.5–10.0 min (right). The compounds identified based on accurate masses and isotopic distributions are indicated.
2.4. XRF Analysis
Elemental bromine content of the polymer samples was measured using a Niton XL3t 900s GOLDD XRF-analyzer (Thermo Scientific, Massachusetts). The injection molded samples were placed directly on the XRF measurement window inside a Pb-lined measurement stand. The XRF measurements were performed in a plastics analysis mode with 90 s of total measurement time and a thickness correction. The reported Br concentrations are average values of three parallel measurements from different locations of the sample.
3. Results and Discussion
3.1. Temperature-Programmed DIP-MS Analysis of Micro-Compounded Polymer
Figure 2 presents exemplary data of the temperature-programmed DIP-MS analysis of a micro-compounded HIPS-TBBPA sample, having a target bromine content of 10,000 ppm. The top panel shows a total ion chromatogram (TIC) obtained using the vaporizer temperature program 150–450 °C. The heating of the sample was conducted stepwise in order to obtain some degree of temporal separation of compounds based on their boiling points or decomposition temperatures. A temperature overshoot of about 10 °C was observed in the beginning of each temperature step. As seen from the mass spectra averaged over time frames of 5.5–7.0 min (Figure 2, left) or 8.5–10 min (right), the main signals observed at ∼350 °C are due to additives Irganox 1076 (C35H62O3, m/z 530.4694), Irgafos 168 oxide (C42H63O4P, m/z 662.4459), and TBBPA (C15H12Br4O2, m/z 543.7525), whereas the vast majority of signals at ∼450 °C are arising from the polymer matrix degradation products, i.e., styrene oligomers. Irganox 1076 and Irgafos 168 oxides were detected also in DIP-MS analysis of a HIPS sample containing no BRFs (Figure S1), indicating that these stabilizers were part of the commercial HIPS resin used in the sample formulations. Ballesteros-Gómez et al. have previously reported the use of temperature-programmed DIP-APCI QTOF-MS in the context of plastic additive analysis. A temperature range from 200 to 320 °C was utilized because the authors were only interested in additives and wanted to avoid polymer degradation, which could complicate the interpretation of the resulting mass spectra.19 However, our results indicate that with a careful design of the utilized temperature program, the polymer matrix and the additives can be analyzed rather independently from each other when a high-resolution instrument with a high charge capacity is used.
3.2. Characterization of BFRs
DecaBDE, TBBPA, and HBCD were analyzed in the absence of any polymer matrix with DIP-MS to identify the most abundant ions formed in the positive-ion APCI and the possible decomposition products in the applied temperature range. Calcined SiO2 was used as an inert dilution matrix to simplify the sample amount control, to decrease the BFR concentration, and hence to reduce the risk of ion source contamination. The volatilization or degradation behavior of each BFR during the temperature ramping can be seen from the total ion chromatograms (Figure S2) and the averaged mass spectra within the time frame of 4.0–7.0 min, corresponding to the temperature range of ca. 300–350 °C (Figure 3). For polybrominated BFRs, monoisotopic peaks can have very low relative intensities due to two natural bromine isotopes, 79Br and 81Br, with natural abundances of 50.686% and 49.314%, respectively. Therefore, the m/z values for BFRs have been reported for the most abundant isotopic peaks instead.
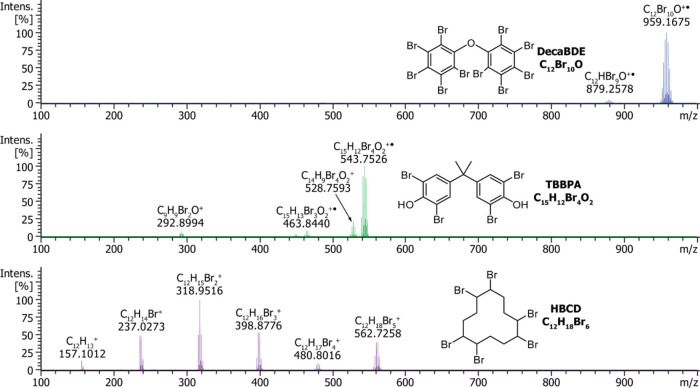
Figure 3.
Reference mass spectra of decaBDE (top), TBBPA (middle), and HBCD (bottom). The samples were diluted in an inert SiO2 matrix and measured using DIP-MS. The averaged spectra obtained within the time frame of 4.0–7.0 min (300–350 °C) are shown. The m/z values are indicated for the most abundant isotopic peaks.
DecaBDE, TBBPA, and HBCD were found to be readily ionized in the positive-ion APCI. Furthermore, each BFR provided a distinct spectral fingerprint, comprising either a molecular ion along with some decomposition products or solely debromination products. For decaBDE and TBBPA, the most intense signals were observed for the molecular ions at m/z 959.1675 and 543.7526, respectively, with only minor amounts of partially debrominated forms observed, implying that both compounds are stable against thermal degradation at the temperatures used in our experiments. The ions C14H9Br4O2+ and C9H9Br2O+ in the mass spectrum of TBBPA (C15H12Br4O2) correspond to decomposition products following the loss of a methyl radical or 2,6-dibromophenyl radical, respectively. Both of these TBBPA fragments were also detected in a direct exposure probe mass spectrometry (DEP-MS) study, in which the most abundant signal corresponded to C14H9Br4O2+.41
In contrast, HBCD (C12H18Br6) was found to degrade extensively during DIP-MS analysis. The most abundant ion in the averaged mass spectrum of HBCD was observed at m/z 318.9516 and was assigned to C12H15Br2+, although other debrominated forms were identified as well. Our results suggest that the thermal degradation of HBCD proceeds via sequential HBr eliminations, leading eventually to the completely debrominated species (C12H13+; observed at m/z 157.1012). The debromination pathway and the main degradation products of HBCD have been reported in several previous studies and are consistent with our observations.41−43 It is also noteworthy that the decomposition of HBCD occurred at lower temperatures compared to the effective volatilization temperatures of decaBDE or TBBPA. Our results also agree well with a recent DIP-MS study of PS-HBCD blend, in which the release of bromine was detected mainly around 290 °C.44
Most previous studies involving direct mass spectrometric analysis of BFRs in plastic samples have been conducted in negative-ion mode. For example, in the case of decaBDE analysis with DART, the most intense signals for decaBDE were assigned to either [M – C6Br5]− or [M – Br + O]−.20,21,34 Also, DIP with negative-ion APCI and APPI techniques has been reported to result in [M – Br + O]− as the main ion.19 Although the negative-ion mode can provide higher selectivity toward halogenated compounds, it might not be the preferential choice for the analysis of PBDE mixtures due to excessive fragmentation or debromination, hindering the identification of different PBDE congeners with varying bromine content. As demonstrated here, DIP with positive-ion APCI causes only minimal debromination of decaBDE, enabling its analysis by monitoring the molecular ion signal. On the other hand, the molecular ion of HBCD has been previously detected using negative-ion DIP-APCI and DIP-APPI,38 whereas in the positive-ion mode, it was not observed (Figure 3).
3.3. Characterization of Compounded ABS-BFR Samples
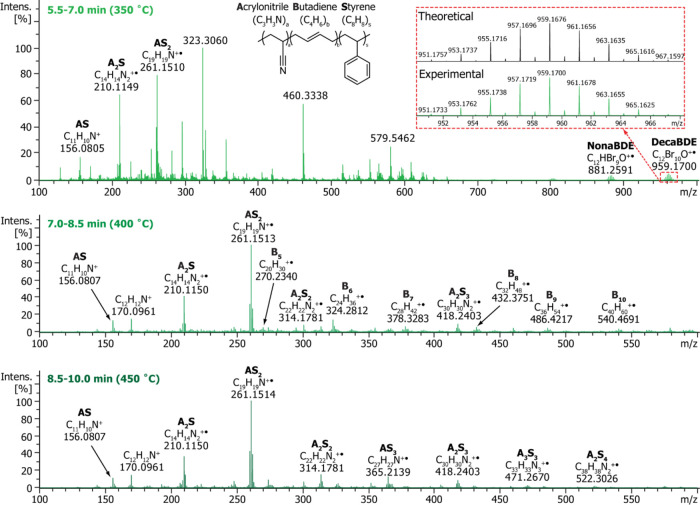
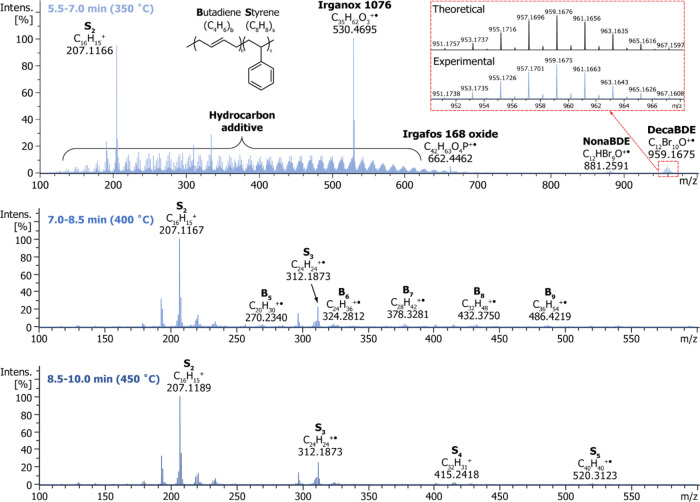
The TIC obtained in the temperature-programmed DIP-MS analysis of ABS-decaBDE sample (1000 ppm of bromine) is depicted in Figure S3, and the averaged mass spectra within three different time frames are presented in Figure 4. The mass accuracies and formulas for selected ions in the mass spectra of the ABS-decaBDE sample are listed in Table S4. In the low-temperature region (350 °C, 5.5–7.0 min), both additives and some polymer fragments were detected, whereas at higher temperatures (400 °C, 7.0–8.5 min; 450 °C, 8.5–10.0 min), solely a plethora of polymer fragment signals were observed. It is notable that butadiene oligomers (marked with Bb in Figure 4) were mainly identified at 400 °C. The other observed polymer fragment ions were assigned to different styrene-acrylonitrile oligomers (AaSs). No depolymerization products containing butadiene together with styrene and/or acrylonitrile (AaBbSs) were detected, which is in accordance with the structure of ABS, consisting of segregated polybutadiene rubber particles dispersed in an acrylonitrile-styrene copolymer matrix.45 Hence, in addition to polymer identification, the temperature-programmed DIP-MS was able to provide detailed information about the copolymer structure. Previously, direct mass spectrometric techniques have been utilized in the characterization of various synthetic polymer grades,31,32,35,39,46,47 but only a few structural studies of styrene copolymers have been published.27
Figure 4.
Averaged mass spectra obtained within time frames 5.5–7.0 min (top), 7.0–8.5 min (middle), and 8.5–10.0 min (bottom) from DIP-MS measurement of an ABS-decaBDE sample having a target Br concentration of 1000 ppm. The inset (in the top spectrum) presents a comparison between the experimental (bottom) and theoretical (top) isotope pattern of a signal observed at m/z 959.1700, which was assigned to C12Br10O+ molecular ion of decaBDE.
The high mass accuracy (Table S4) and low noise level of the obtained mass spectra allowed the reliable identification of all studied polybrominated additives. The BFR signals were highly distinguishable in the mass spectra of ABS-decaBDE (Figure 4) and ABS-TBBPA (Figure S4) samples with a target bromine content of 1000 ppm. Hence, the limit of detection for decaBDE and TBBPA from the ABS matrix with DIP-MS was notably below 1000 ppm of Br. Figure S5 presents the mass spectrum of an ABS-HBCD sample with the same bromine content. Due to excessive decomposition, signals arising from the HBCD were not as distinctive as in the case of other studied BFRs but could still be identified with certainty. Previously, Ballesteros-Gómez et al. have estimated a detection limit of 0.1 wt % (1,000 ppm) for BFR analysis from plastic samples using direct probe with APCI.19 In general, intensities of decaBDE, TBBPA, and HBCD signals were higher in the mass spectra of samples with higher BFR loadings, although there were large variations between the parallel measurements. The repeatability of DIP-MS measurements is discussed in more detail in Section 3.5.
The isotope patterns can be utilized in the identification of brominated compounds,48 due to two stable isotopes of bromine, 79Br and 81Br. The insets in Figures 4, S4, and S5 show baseline resolved signals for the most abundant BFR ions observed in the analysis of ABS samples containing decaBDE, TBBPA, and HBCD, respectively. The excellent agreement between experimental and theoretical isotope patterns of BFRs, in terms of both ion abundance and mass accuracy, provided further support for the reliable identification of all observed brominated species.
3.4. Characterization of Compounded HIPS-BFR Samples
The HIPS-BFR samples were analyzed similarly to the ABS-BFR samples. The averaged mass spectra within three different time frames for the HIPS-decaBDE sample (1000 ppm of Br) are presented in Figure 5, and a summary of selected signals is given in Table S5. Also, in the case of HIPS-BFR sample analysis, mainly plastic additives were observed in the early stages of the temperature program (350 °C, 5.5–7.0 min). In addition to BFR signals, the top spectrum in Figure 5 shows the presence of two common stabilizers Irganox 1076 and Irgafos 168 oxide, as well as an aliphatic hydrocarbon component, which can be seen as a series of ions separated by 14.015 Da (CH2). At higher temperatures, the polymer fragment signals dominated the spectra, and both monomers present in HIPS were identified. Styrene dimer (S2) and trimer (S3) signals were detected already at lower temperatures, whereas larger oligomers up to S5, were detected at 400 and 450 °C (time frames 7.0–8.5 and 8.5–10.0 min). As in the case of ABS sample analyses, butadiene oligomers were observed only at 400 °C (time frame of 7.0–8.5 min) and mixed oligomers, consisting of both styrene and butadiene units, were not detected at all. The structure of HIPS, consisting of isolated polybutadiene particles in polystyrene matrix, could explain the absence of SsBb oligomers also in the mass spectra of HIPS samples.45
Figure 5.
Averaged mass spectra obtained within time frames 5.5–7.0 min (top), 7.0–8.5 min (middle), and 8.5–10.0 min (bottom) from DIP-MS measurement of a HIPS-decaBDE sample having a target Br concentration of 1000 ppm. The inset (in the top spectrum) presents a comparison between the experimental (bottom) and theoretical (top) isotope pattern of a signal observed at m/z 959.1700, which was assigned to C12Br10O+ molecular ion of decaBDE.
High mass accuracy was obtained and the excellent correspondence between experimental and theoretical isotope patterns allowed a reliable identification of all studied polybrominated additives also from the HIPS matrix. Figures S6 and S7 present averaged mass spectra within a time frame of 5.5–7.0 min (350 °C) for HIPS-TBBPA and HIPS-HBCD samples (1000 ppm of Br), respectively. Signals of decaBDE and TBBPA were also highly distinctive in the analysis of HIPS samples. However, due to signals arising from the hydrocarbon additive, even the most abundant debrominated HBCD ion (m/z 318.9699) was not readily distinguishable but could still be detected (Figure S7).
In the mass spectra of all studied HIPS-BFR samples, the signals assigned to BFR debromination or decomposition products had higher relative intensities compared to the corresponding intensities in the mass spectra of BFRs measured in the SiO2 matrix. The effect was even more pronounced in the case of ABS-BFR samples. The results indicated that BFRs compounded with ABS and HIPS decomposed more extensively during the microcompounding or the DIP-MS analysis itself, possibly due to the availability of hydrogen donors from the polymer matrix for effective hydrodebromination.49−51 However, it must be emphasized that the observed decomposition of BFRs did not prevent their identification.
3.5. Quantitative DecaBDE Analysis
DIP-APCI-MS analysis with a small sample (<0.1 mg) cut from the injection molded samples was found to be well suited for the direct qualitative analysis of BFRs from polymer matrices. The applicability of the method for quantitative BFR analysis was examined as well. A signal normalization was performed between the BFR signals and a chosen polymer fragment signal to obtain normalized intensity values and, hence, to compensate for the absolute ion abundance or the actual sample mass variations. For HIPS samples, the styrene dimer signal seemed appropriate for this approach, owing to its occurrence at a wide temperature range.
In Figure S8, the normalized decaBDE signal intensities obtained within the time frame of 4.0–7.0 min for HIPS-decaBDE samples are presented as a function of decaBDE concentration. The mass fractions of decaBDE were calculated from experimental Br concentrations (XRF) with an assumption that all bromine existed in the form of decaBDE. The linear correlation between MS and XRF data was moderate (R2 = 0.9899), but the relative standard deviation between five parallel measurements was as high as 50% (Figure S8). The repeatability issues might have resulted from noneven mixing of the components during the microcompounding, resulting in nonhomogeneous samples. Furthermore, as a thermal analysis technique, DIP-MS is expected to be dependent on the evaporation kinetics, which are governed by, e.g., grain size and surface area of the sample. Hence, the nonuniform shape and size of the plastic samples might have contributed to the poor repeatability.
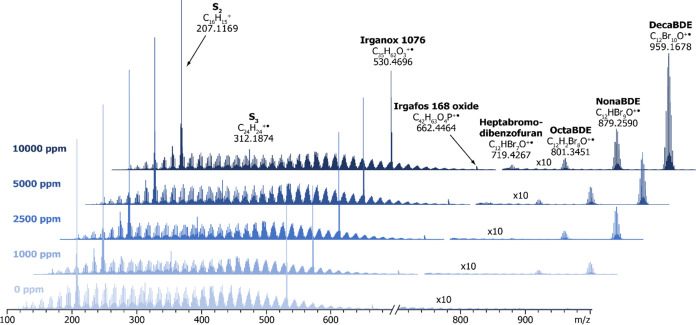
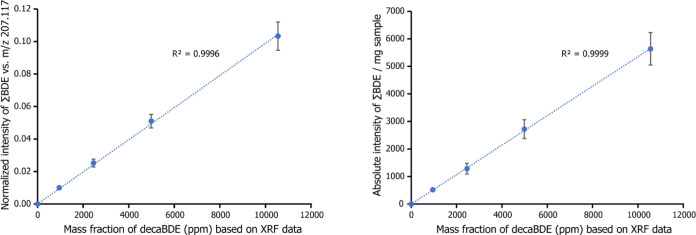
The sampling protocol was optimized by homogenizing the polymer samples with cryogenic grinding and increasing the sample size to 1.0 mg. Figure 6 presents exemplary MS data of HIPS-decaBDE samples (time frame 4.0–7.0) obtained after implementation of these changes. The spectra show a steady increase in decaBDE, nonaBDE, and octaBDE signal intensities with increasing target Br content of the sample from 0 to 10,000 ppm, whereas other spectral features remain practically unchanged. Relative standard deviation between five parallel measurements was typically below 10%, indicating that the optimization of the sampling protocol notably improved the repeatability of the DIP-MS measurements. Furthermore, the normalized intensity of the decaBDE signal correlated well with its concentration calculated based on XRF data (R2 = 0.9957). However, when normalized intensities of decaBDE and all of its observed decomposition products (nonaBDE, octaBDE, heptabromodibenzofuran, and hexabromodibenzofuran) were combined, an even higher R2 value of 0.9996 was obtained, as depicted in Figure 7 (left). The results indicated that all BDE species should be considered in quantification studies with DIP-APCI-MS.
Figure 6.
Averaged mass spectra (time frame of 4.0–7.0 min) from DIP-MS measurements of HIPS-decaBDE samples (target Br concentrations from 0 to 10,000 ppm) after optimization of the sampling protocol. The signal intensities for m/z values higher than 700 have been multiplied by a factor of 10 to emphasize the increase in the abundance of all BDE species.
Figure 7.
Normalized intensity (left) and absolute intensity (right) of the sum of BDE species after optimization of the sampling protocol compared to the mass fraction of decaBDE based on XRF data. The results are average values calculated from five parallel measurements and the error bars represent the standard deviations of the mean.
Conventionally, quantification of PBDEs from different sample matrices, including environmental, biological, and waste materials, has been conducted using solvent extraction followed by CG/LC-MS analysis.52 PBDE detection with low-resolution mass spectrometers is typically based on selected ion monitoring, although utilization of MS/MS has been reported to provide higher sensitivity and selectivity.52,53 The sample preparation process prior to chromatographic analysis is often highly complicated and may result in incomplete recovery of the analytes.52 Additionally, the chromatographic separation may also cause some interferences,52 making the DIP-MS technique with minimal sample preparation an attractive option.
DecaBDE quantification using absolute signal intensities was evaluated for the possibility of a more universal calibration. Moreover, the use of absolute intensity values could be beneficial, since a suitable reference for signal normalization might not always be present. Figure 7 (right) presents the correlation between the combined absolute intensity values of all detected BDE species and decaBDE concentration. The intensity values of BDE signals were proportioned against the sample mass. The standard deviation between parallel measurements and the resulting correlation factor (R2 = 0.9999) were comparable to those obtained using normalized signal intensities. Previously, Guzzonato et al. have reported quantification of decaBDE from ABS samples using DIP-MS.36 They established a linear correlation between the absolute signal intensity and decaBDE concentration in a concentration range from 0 to 2 wt %. These results together suggest that decaBDE quantification using DIP-MS and absolute intensity values is possible. However, the use of absolute signal intensities requires precise control over the sample amount, and hence, it might not always be the preferential choice. Overall, the DIP-APCI-MS method has remarkable potential for direct quantitative analysis of BFRs from plastic samples with proper calibration. Further studies are needed to test the method for the other compounds and to evaluate the extent of possible matrix effects.
4. Conclusions
The temperature-programmed direct mass spectrometric analysis provided a straightforward but comprehensive way to characterize brominated flame retardants and other additives in different polymer samples, potentially even quantitatively. Furthermore, this approach enabled identification and structural characterization of the polymer matrix with a single measurement. The utilized temperature program enabled temporal separation of different compounds based on their boiling points and/or degradation temperatures, thus providing sufficient selectivity for different compound classes. High-resolution mass spectrometry utilized in the study enabled the reliable identification of the analytes with high specificity. No solvent extractions or compound derivatization were needed, which are often required in polymer or additive analysis using more conventional techniques. However, there are some limitations regarding the possible detectable species. First, the analyte must be ionizable by APCI. Second, the maximum operating temperature with the DIP device is limited to 470 °C and, hence, high-boiling analytes cannot be detected. This limitation excludes mostly some inorganic additives, as most of the common synthetic polymers and organic additives have lower boiling/decomposition points. Although DIP-MS was shown to hold potential for quantitative decaBDE analysis, further studies are needed to evaluate its sensitivity and linear range of detection for decaBDE and other BFRs. Overall, the temperature-programmed DIP-APCI-MS was found to be an excellent tool for the rapid characterization of plastic samples, which plays a key role, for example, in enabling effective recycling processes and a safer use of plastic recyclates.
Acknowledgments
This work was supported by the European Union from the Horizon Europe Programme through the European Health and Digital Executive Agency (HADEA) under Grant Agreement No. 101057067. The mass spectrometry facility is supported by the Biocenter Kuopio, Biocenter Finland/FINStruct and the Research Council of Finland infrastructure funding (FIRI).
Supporting Information Available
The Supporting Information is available free of charge at https://pubs.acs.org/doi/10.1021/acsomega.4c04059.
Model compound formulations and summaries of selected signals observed in DIP-MS analysis of ABS-decaBDE and HIPS-decaBDE samples with 1000 ppm Br concentration; parameters utilized in DIP-APCI-MS analysis as well as the calibration lists for HIPS and ABS samples; total ion chromatograms from DIP-MS analyses of BFRs as well as HIPS-decaBDE and ABS-decaBDE samples (1000 ppm of Br); averaged mass spectra for HIPS sample without any BFRs and for compounded BFR-polymer samples (ABS-TBBPA, ABS-HBCD, HIPS-TBBPA, HIPS-HBCD); and correlation between MS and XRF data for HIPS-decaBDE samples (PDF)
The authors declare no competing financial interest.
Supplementary Material
References
- Pfaendner R.Polymer Additives. In Handbook of Polymer Synthesis, Characterization, and Processing; Saldivar-Guerra E.; Vivaldo-Lima E., Eds.; John Wiley & Sons: Newark, United States, 2013; pp 225–247. [Google Scholar]
- European Chemicals Agency . Regulatory Strategy for Flame Retardants, European Chemicals Agency; 2023.
- de Boer J.; Harrad S.; Sharkey M. The European Regulatory Strategy for Flame Retardants – The Right Direction but Still a Risk of Getting Lost. Chemosphere 2024, 347, 140638 10.1016/j.chemosphere.2023.140638. [DOI] [PubMed] [Google Scholar]
- Sharkey M.; Harrad S.; Abdallah M. A.-E.; Drage D. S.; Berresheim H. Phasing-out of Legacy Brominated Flame Retardants: The UNEP Stockholm Convention and Other Legislative Action Worldwide. Environ. Int. 2020, 144, 106041 10.1016/j.envint.2020.106041. [DOI] [PubMed] [Google Scholar]
- Kemmlein S.; Herzke D.; Law R. J. Brominated Flame Retardants in the European Chemicals Policy of REACH—Regulation and Determination in Materials. J. Chromatogr. A 2009, 1216 (3), 320–333. 10.1016/j.chroma.2008.05.085. [DOI] [PubMed] [Google Scholar]
- Baidurah S. Methods of Analyses for Biodegradable Polymers: A Review. Polymers 2022, 14 (22), 4928 10.3390/polym14224928. [DOI] [PMC free article] [PubMed] [Google Scholar]
- Kubicova M.; Puchta E.; Säger S.; Hug C.; Hofmann S.; Simat T. J. Styrene-Acrylonitrile-Copolymer and Acrylonitrile-Butadiene-Styrene-Copolymer: A Study on Extractable and Migratable Oligomers. Food Addit. Contam.: Part A 2022, 39 (2), 397–414. 10.1080/19440049.2021.1995631. [DOI] [PubMed] [Google Scholar]
- Jakab E.; Uddin M. A.; Bhaskar T.; Sakata Y. Thermal Decomposition of Flame-Retarded High-Impact Polystyrene. J. Anal. Appl. Pyrolysis 2003, 68–69, 83–99. 10.1016/S0165-2370(03)00075-5. [DOI] [Google Scholar]
- Xu L.; Li S.; Zhang Y.; Sun W.; Pan L.; Wang L. Non-Isothermal Thermal Decomposition Behavior and Reaction Kinetics of Acrylonitrile Butadiene Styrene (ABS). J. Environ. Manage. 2023, 348, 119080 10.1016/j.jenvman.2023.119080. [DOI] [PubMed] [Google Scholar]
- Liu S.; Zhao H.; Liu Z.; Zhang W.; Lai C.; Zhao S.; Cai X.; Qi Y.; Zhao Q.; Li R.; Wang F. High-Performance Micro/Nanoplastics Characterization by MALDI-FTICR Mass Spectrometry. Chemosphere 2022, 307, 135601 10.1016/j.chemosphere.2022.135601. [DOI] [PubMed] [Google Scholar]
- Wesdemiotis C.; Williams-Pavlantos K. N.; Keating A. R.; McGee A. S.; Bochenek C. Mass Spectrometry of Polymers: A Tutorial Review. Mass Spectrom. Rev. 2024, 43, 427–476. 10.1002/mas.21844. [DOI] [PubMed] [Google Scholar]
- Mahmoud Z.; Bray F.; Hubert-Roux M.; Sablier M.; Afonso C.; Rolando C. Regio- and Stereo-Specific Chemical Depolymerization of High Molecular Weight Polybutadiene and Polyisoprene for Their Analysis by High-Resolution Fourier Transform Ion Cyclotron Resonance Mass Spectrometry: Comparison with Pyrolysis-Comprehensive Two-Dimensional Gas Chromatography/Mass Spectrometry, Atmospheric Solid Analysis Probe, Direct Inlet Probe-Atmospheric Pressure Chemical Ionization Mass Spectrometry, and Ion Mobility Spectrometry-Mass Spectrometry. Anal. Chem. 2020, 92 (24), 15736–15744. 10.1021/acs.analchem.0c02650. [DOI] [PubMed] [Google Scholar]
- Evangelopoulos P.; Arato S.; Persson H.; Kantarelis E.; Yang W. Reduction of Brominated Flame Retardants (BFRs) in Plastics from Waste Electrical and Electronic Equipment (WEEE) by Solvent Extraction and the Influence on Their Thermal Decomposition. Waste Manage. 2019, 94, 165–171. 10.1016/j.wasman.2018.06.018. [DOI] [PubMed] [Google Scholar]
- Kousaiti A.; Hahladakis J. N.; Savvilotidou V.; Pivnenko K.; Tyrovola K.; Xekoukoulotakis N.; Astrup T. F.; Gidarakos E. Assessment of Tetrabromobisphenol-A (TBBPA) Content in Plastic Waste Recovered from WEEE. J. Hazard. Mater. 2020, 390, 121641 10.1016/j.jhazmat.2019.121641. [DOI] [PubMed] [Google Scholar]
- Geng D.; Kukucka P.; Jogsten I. E. Analysis of Brominated Flame Retardants and Their Derivatives by Atmospheric Pressure Chemical Ionization Using Gas Chromatography Coupled to Tandem Quadrupole Mass Spectrometry. Talanta 2017, 162, 618–624. 10.1016/j.talanta.2016.10.060. [DOI] [PubMed] [Google Scholar]
- Vilaplana F.; Karlsson P.; Ribes-Greus A.; Ivarsson P.; Karlsson S. Analysis of Brominated Flame Retardants in Styrenic Polymers. J. Chromatogr. A 2008, 1196–1197, 139–146. 10.1016/j.chroma.2008.05.001. [DOI] [PubMed] [Google Scholar]
- Ionas A. C.; Gómez A. B.; Uchida N.; Suzuki G.; Kajiwara N.; Takata K.; Takigami H.; Leonards P. E.; Covaci A. Comprehensive Characterisation of Flame Retardants in Textile Furnishings by Ambient High Resolution Mass Spectrometry, Gas Chromatography-Mass Spectrometry and Environmental Forensic Microscopy. Environ. Res. 2015, 142, 712–719. 10.1016/j.envres.2015.09.012. [DOI] [PubMed] [Google Scholar]
- Ionas A. C.; Gómez A. B.; Leonards P. E. G.; Covaci A. Identification Strategies for Flame Retardants Employing Time-of-flight Mass Spectrometric Detectors along with Spectral and Spectra-less Databases. J. Mass Spectrom. 2015, 50 (8), 1031–1038. 10.1002/jms.3618. [DOI] [PubMed] [Google Scholar]
- Ballesteros-Gómez A.; Jonkers T.; Covaci A.; De Boer J. Screening of Additives in Plastics with High Resolution Time-of-Flight Mass Spectrometry and Different Ionization Sources: Direct Probe Injection (DIP)-APCI, LC-APCI, and LC-Ion Booster ESI. Anal. Bioanal. Chem. 2016, 408 (11), 2945–2953. 10.1007/s00216-015-9238-5. [DOI] [PMC free article] [PubMed] [Google Scholar]
- Puype F.; Ackerman L. K.; Samsonek J. Evaluation of Direct Analysis in Real Time – High Resolution Mass Spectrometry (DART-HRMS) for WEEE Specific Substance Determination in Polymeric Samples. Chemosphere 2019, 232, 481–488. 10.1016/j.chemosphere.2019.05.166. [DOI] [PubMed] [Google Scholar]
- Paseiro-Cerrato R.; Ackerman L.; De Jager L.; Begley T. Brominated Flame Retardants (BFRs) in Contaminated Food Contact Articles: Identification Using DART-HRMS and GC-MS. Food Addit. Contam.: Part A 2021, 38 (2), 350–359. 10.1080/19440049.2020.1853250. [DOI] [PubMed] [Google Scholar]
- Gallen C.; Banks A.; Brandsma S.; Baduel C.; Thai P.; Eaglesham G.; Heffernan A.; Leonards P.; Bainton P.; Mueller J. F. Towards Development of a Rapid and Effective Non-Destructive Testing Strategy to Identify Brominated Flame Retardants in the Plastics of Consumer Products. Sci. Total Environ. 2014, 491–492, 255–265. 10.1016/j.scitotenv.2014.01.074. [DOI] [PubMed] [Google Scholar]
- Yanagisawa H.; Kudo Y.; Nakagawa K.; Miyagawa H.; Maruyama F.; Fujimaki S. Simultaneous Screening of Major Flame Retardants and Plasticizers in Polymer Materials Using Pyrolyzer/Thermal Desorption Gas Chromatography Mass Spectrometry (Py/TD–GC–MS). Molecules 2018, 23 (4), 728 10.3390/molecules23040728. [DOI] [PMC free article] [PubMed] [Google Scholar]
- Yanagisawa H.; Maruyama F.; Fujimaki S. Verification of Simultaneous Screening for Major Restricted Additives in Polymer Materials Using Pyrolyzer/Thermal Desorption Gas–Chromatography Mass Spectrometry (Py/TD-GC-MS). J. Anal. Appl. Pyrolysis 2019, 137, 37–42. 10.1016/j.jaap.2018.11.004. [DOI] [Google Scholar]
- Yuzawa T.; Hosaka A.; Watanabe C.; Tsuge S. Evaluation of the Thermal Desorption–GC/MS Method for the Determination of Decabromodiphenyl Ether (DeBDE) in Order of a Few Hundred Ppm Contained in a Certified Standard Polystyrene Sample. Anal. Sci. 2008, 24 (8), 953–955. 10.2116/analsci.24.953. [DOI] [PubMed] [Google Scholar]
- Akoueson F.; Chbib C.; Monchy S.; Paul-Pont I.; Doyen P.; Dehaut A.; Duflos G. Identification and Quantification of Plastic Additives Using Pyrolysis-GC/MS: A Review. Sci. Total Environ. 2021, 773, 145073 10.1016/j.scitotenv.2021.145073. [DOI] [PubMed] [Google Scholar]
- Alawani N.; Barrère-Mangote C.; Wesdemiotis C. Analysis of Thermoplastic Copolymers by Mild Thermal Degradation Coupled to Ion Mobility Mass Spectrometry. Macromol. Rapid Commun. 2023, 44 (1), 2200306 10.1002/marc.202200306. [DOI] [PubMed] [Google Scholar]
- Du Z.; Zhang Y.; Li A.; Lv S. Rapid Identification of Polymer Additives by Atmospheric Solid Analysis Probe with Quadrupole Time-of-Flight Mass Spectrometry. Rapid Commun. Mass Spectrom. 2014, 28 (19), 2035–2042. 10.1002/rcm.6998. [DOI] [PubMed] [Google Scholar]
- Smith M. J. P.; Cameron N. R.; Mosely J. A. Evaluating Atmospheric Pressure Solids Analysis Probe (ASAP) Mass Spectrometry for the Analysis of Low Molecular Weight Synthetic Polymers. Analyst 2012, 137 (19), 4524–4530. 10.1039/c2an35556f. [DOI] [PubMed] [Google Scholar]
- Lebeau D.; Ferry M. Direct Characterization of Polyurethanes and Additives by Atmospheric Solid Analysis Probe with Time-of-Flight Mass Spectrometry (ASAP-TOF-MS). Anal. Bioanal. Chem. 2015, 407 (23), 7175–7187. 10.1007/s00216-015-8881-1. [DOI] [PubMed] [Google Scholar]
- Vitali C.; Janssen H.-G.; Ruggeri F. S.; Nielen M. W. F. Rapid Single Particle Atmospheric Solids Analysis Probe-Mass Spectrometry for Multimodal Analysis of Microplastics. Anal. Chem. 2022, 95 (2), 1395–1401. 10.1021/acs.analchem.2c04345. [DOI] [PMC free article] [PubMed] [Google Scholar]
- Barrère C.; Selmi W.; Hubert-Roux M.; Coupin T.; Assumani B.; Afonso C.; Giusti P. Rapid Analysis of Polyester and Polyethylene Blends by Ion Mobility-Mass Spectrometry. Polym. Chem. 2014, 5 (11), 3576–3582. 10.1039/C4PY00164H. [DOI] [Google Scholar]
- Cody R. B.; Fouquet T. N. J.; Takei C. Thermal Desorption and Pyrolysis Direct Analysis in Real Time Mass Spectrometry for Qualitative Characterization of Polymers and Polymer Additives. Rapid Commun. Mass Spectrom. 2020, 34 (S2), e8687 10.1002/rcm.8687. [DOI] [PubMed] [Google Scholar]
- Lestido-Cardama A.; Paseiro-Cerrato R.; Ackerman L. K.; Sendón R.; de Quirós A. R.-B. Determination of BFRs in Food Contact Articles: An Analytical Approach Using DART-HRMS, XFR and HPLC-MS/MS. Food Packag. Shelf Life 2022, 33, 100883 10.1016/j.fpsl.2022.100883. [DOI] [Google Scholar]
- Abe Y.; Ackerman L. K.; Mutsuga M.; Sato K.; Begley T. H. Rapid Identification of Polyamides Using Direct Analysis in Real Time Mass Spectrometry. Rapid Commun. Mass Spectrom. 2020, 34 (S2), e8707 10.1002/rcm.8707. [DOI] [PubMed] [Google Scholar]
- Guzzonato A.; Mehlmann H.; Krumwiede D.; Harrad S. A Novel Method for Quantification of Decabromodiphenyl Ether in Plastics without Sample Preparation Using Direct Insertion Probe – Magnetic Sector High Resolution Mass Spectrometry. Anal. Methods 2016, 8 (27), 5487–5494. 10.1039/C6AY00460A. [DOI] [Google Scholar]
- Ballesteros-Gómez A.; De Boer J.; Leonards P. E. G. Novel Analytical Methods for Flame Retardants and Plasticizers Based on Gas Chromatography, Comprehensive Two-Dimensional Gas Chromatography, and Direct Probe Coupled to Atmospheric Pressure Chemical Ionization-High Resolution Time-of-Flight-Mass Spectrometry. Anal. Chem. 2013, 85 (20), 9572–9580. 10.1021/ac4017314. [DOI] [PubMed] [Google Scholar]
- Ballesteros-Gómez A.; Brandsma S. H.; De Boer J.; Leonards P. E. G. Direct Probe Atmospheric Pressure Photoionization/Atmospheric Pressure Chemical Ionization High-Resolution Mass Spectrometry for Fast Screening of Flame Retardants and Plasticizers in Products and Waste. Anal. Bioanal. Chem. 2014, 406 (11), 2503–2512. 10.1007/s00216-014-7636-8. [DOI] [PubMed] [Google Scholar]
- Farenc M.; Witt M.; Craven K.; Barrère-Mangote C.; Afonso C.; Giusti P. Characterization of Polyolefin Pyrolysis Species Produced Under Ambient Conditions by Fourier Transform Ion Cyclotron Resonance Mass Spectrometry and Ion Mobility-Mass Spectrometry. J. Am. Soc. Mass Spectrom. 2017, 28 (3), 507–514. 10.1007/s13361-016-1572-0. [DOI] [PubMed] [Google Scholar]
- de los Santos-Villarreal G.; Elizalde L. E.. Polymer Spectroscopy and Compositional Analysis. In Handbook of Polymer Synthesis, Characterization, and Processing; Saldivar-Guerra E.; Vivaldo-Lima E., Eds.; John Wiley & Sons: Newark, United States, 2013; pp 337–354. [Google Scholar]
- Jung J.; Bae S.; Lee L.; Shin J. K.; Choi J.; Lee S. Rapid Identification of Brominated Flame Retardants by Using Direct Exposure Probe Mass Spectrometry. Microchem. J. 2009, 91 (1), 140–146. 10.1016/j.microc.2008.09.005. [DOI] [Google Scholar]
- Ukisu Y. Complete Catalytic Debromination of Hexabromocyclododecane Using a Silica-Supported Palladium Catalyst in Alkaline 2-Propanol. Chemosphere 2017, 179, 179–184. 10.1016/j.chemosphere.2017.03.111. [DOI] [PubMed] [Google Scholar]
- Barontini F.; Cozzani V.; Petarca L. Thermal Stability and Decomposition Products of Hexabromocyclododecane. Ind. Eng. Chem. Res. 2001, 40 (15), 3270–3280. 10.1021/ie001002v. [DOI] [Google Scholar]
- Beach M. W.; Hull J. W.; King B. A.; Beulich I. I.; Stobby B. G.; Kram S. L.; Gorman D. B. Development of a New Class of Brominated Polymeric Flame Retardants Based on Copolymers of Styrene and Polybutadiene. Polym. Degrad. Stab. 2017, 135, 99–110. 10.1016/j.polymdegradstab.2016.11.008. [DOI] [Google Scholar]
- Bonilla-Cruz J.; Dehonor M.; Saldívar-Guerra E.; González-Montiel A.. Polymer Modification: Functionalization and Grafting. In Handbook of Polymer Synthesis, Characterization, and Processing; Saldívar-Guerra E.; Vivaldo-Lima E., Eds.; John Wiley & Sons: Newark, United States, 2013; pp 205–223. [Google Scholar]
- Lacroix-Andrivet O.; Castilla C.; Rüger C.; Hubert-Roux M.; Siqueira A. L. M.; Giusti P.; Afonso C. Direct Insertion Analysis of Polymer-Modified Bitumen by Atmospheric Pressure Chemical Ionization Ultrahigh-Resolution Mass Spectrometry. Energy Fuels 2021, 35 (3), 2165–2173. 10.1021/acs.energyfuels.0c03827. [DOI] [Google Scholar]
- Barrère C.; Hubert-Roux M.; Afonso C.; Racaud A. Rapid Analysis of Lubricants by Atmospheric Solid Analysis Probe–Ion Mobility Mass Spectrometry. J. Mass Spectrom. 2014, 49 (8), 709–715. 10.1002/jms.3404. [DOI] [PubMed] [Google Scholar]
- Ballesteros-Gómez A.; Ballesteros J.; Ortiz X.; Jonker W.; Helmus R.; Jobst K. J.; Parsons J. R.; Reiner E. J. Identification of Novel Brominated Compounds in Flame Retarded Plastics Containing TBBPA by Combining Isotope Pattern and Mass Defect Cluster Analysis. Environ. Sci. Technol. 2017, 51 (3), 1518–1526. 10.1021/acs.est.6b03294. [DOI] [PubMed] [Google Scholar]
- Bendig P.; Blumenstein M.; Hägele F.; Vetter W. Hydrodebromination of Decabromodiphenyl Ether (BDE-209) in Cooking Experiments with Salmon Fillet. J. Agric. Food Chem. 2012, 60 (34), 8521–8527. 10.1021/jf302137f. [DOI] [PubMed] [Google Scholar]
- Li Q.; Yang F.; Su G.; Huang L.; Lu H.; Zhao Y.; Zheng M. Thermal Degradation of Polybrominated Diphenyl Ethers over As-Prepared Fe3O4Micro/Nano-Material and Hypothesized Mechanism. Environ. Sci. Pollut. Res. 2016, 23 (2), 1540–1551. 10.1007/s11356-015-5400-z. [DOI] [PubMed] [Google Scholar]
- Ma C.; Yu J.; Wang B.; Song Z.; Xiang J.; Hu S.; Su S.; Sun L. Chemical Recycling of Brominated Flame Retarded Plastics from E-Waste for Clean Fuels Production: A Review. Renewable Sustainable Energy Rev. 2016, 61, 433–450. 10.1016/j.rser.2016.04.020. [DOI] [Google Scholar]
- Śmiełowska M.; Zabiegała B. Current Trends in Analytical Strategies for the Determination of Polybrominated Diphenyl Ethers (PBDEs) in Samples with Different Matrix Compositions – Part 2: New Approaches to PBDEs Determination. TrAC Trends Anal. Chem. 2020, 132, 115889 10.1016/j.trac.2020.115889. [DOI] [Google Scholar]
- Stapleton H. M. Instrumental Methods and Challenges in Quantifying Polybrominated Diphenyl Ethers in Environmental Extracts: A Review. Anal. Bioanal. Chem. 2006, 386 (4), 807–817. 10.1007/s00216-006-0400-y. [DOI] [PMC free article] [PubMed] [Google Scholar]
Associated Data
This section collects any data citations, data availability statements, or supplementary materials included in this article.


