

Abstract
Dynamic systems biology aims to identify the molecular mechanisms governing cell fate decisions through the analysis of living cells. Large scale molecular information from living cells can be obtained from reporter constructs that provide activities for either individual transcription factors or multiple factors binding to the full promoter following CRISPR/Cas9 directed insertion of luciferase. In this report, we investigated the design criteria to obtain reporters that are specific and responsive to transcription factor (TF) binding and the integration of TF binding activity with genetic reporter activity. The design of TF reporters was investigated for the impact of consensus binding site spacing sequence and off-target binding on the reporter sensitivity using a library of 25 SMAD3 activity reporters with spacers of random composition and length. A spacer was necessary to quantify activity changes after TGFβ stimulation. TF binding site prediction algorithms (BEEML, FIMO and DeepBind) were used to predict off-target binding, and nonresponsiveness to a SMAD3 reporter was correlated with a predicted competitive binding of constitutively active p53. The network of activity of the SMAD3 reporter was inferred from measurements of TF reporter library, and connected with large-scale genetic reporter activity measurements. The integration of TF and genetic reporters identified the major hubs directing responses to TGFβ, and this method provided a systems-level algorithm to investigate cell signaling.
Keywords: transcription factor, activity reporter, synthetic promoter
Graphical Abstract:
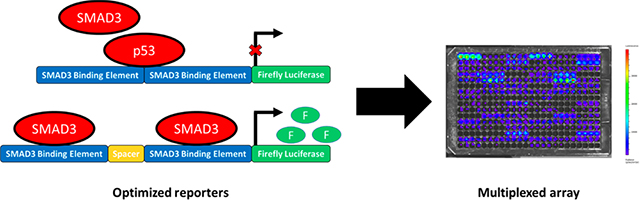
Synthetic reporter arrays are increasingly employed to study complex biological systems. Reporter constructs, either as transcription factor (TF) activity1–3 or CRISPR-mediated full promoter activity,4,5 provide dynamic outputs of intracellular signaling in living cells. Dynamic data can enable tracking of cellular processes during cell fate decisions, and reporters designed toward a particular signaling pathway or omics data set provides a powerful tool to connect the contribution of that pathway to the cell phenotype. Furthermore, these technologies can be multiplexed into arrays that provide a dynamic, live cell counterpart to the more traditional “omics” techniques that are inherently destructive and thus report on a snapshot in time. The implementation of synthetic reporter arrays remains poorly defined, in part due to the limited understanding of the design principles necessary for developing live cell reporter arrays. Herein, this study sought to develop design parameters for reporter arrays, which were applied to investigate the dynamics of a well-known pathway, TGFβ signaling, in a model cell line.
SMAD3 is the known transcriptional target of TGFβ signaling, and this pathway plays a major role in both health and disease. The design of reporters for SMAD3 and other TFs has commonly involved driving luciferase expression with the consensus binding sequence. Computational methods to identify TF binding sequences have increased substantially in recent years in terms of both accuracy and number of available algorithms. Position weight matrices (PWMs) that identify the probability of different binding motifs for a TF have been developed based on protein binding microarrays, SELEX, and CHIP-seq experiments.6–11 Reporters have been traditionally built on these PWMs, where a number of predicted high affinity binding sites are repeated upstream of a reporter coding region and used to measure the activity of a specific TF. This method has been useful for a range of canonical signaling pathways; however, differing PWMs from different algorithms6–8,12 point to both contextual specificity of TF binding and the need for methods to rationally design sensitive and specific reporter constructs. Previous studies have demonstrated that the exact sequence, spacing, and distance from the start codon all play a role in the activation of transcription.13–20 Additional work has suggested the use of PWMs is either insufficient to predict binding21 or is more accurate as a general description for classes of factors.8 The inherent lack of specificity for a TF reporter complicates the interpretation of TF activity array data and leads to complex computational solutions to the problem of specificity.1,6 More recently, interpreting the impact of a pathway can be enhanced through multiplexing reporter constructs.1,3,22
TFs are the downstream targets of signaling pathways, and parallel TF activity reporter arrays generally inform on the connectivity of the network; however, the TF assays have not been effectively linked with gene expression due to the complexity of full promoters. Genetic reporters have been developed in which a reporter gene is inserted alongside a gene of interest, such that expression of the gene leads to production of the reporter. This strategy thus reports on the activity of promoter. The development of facile methods for delivering genetic reporters, such as the CRISPR/Cas9 system, has opened new opportunities for multiplexing reporter assays. Luminescent or fluorescent reporters can be specifically delivered to a gene of interest through careful design of the guide RNA and these methods can be adapted to most cell types and signaling pathways.4,5,23
We investigated the design of a dynamic live cell TF reporter, and its integration with genetic reporters to analyze cell signaling to provide dynamic information on TGFβ-induced intracellular activity. SMAD3, a target of TGFβ, provided an excellent target for investigating the syntax of a synthetic reporter, as it has a well-defined PWM and is stimulated by soluble TGFβ. The length and sequence of spacer elements was varied between SMAD3 binding sites and observed a dependence of TGFβ-meditated activity on spacer composition, which was further investigated from the context of competitive binding with other, more active, factors. We then applied an existing TF array (TRACER) for analyzing TGFβ signaling and its integration with genetic reporters that indicate changes in gene expression associated with cell phenotypes. Our results suggested design principles for TF reporter constructs, and an algorithm for a systems biology analysis of cell signaling that integrates TF and genetic reporters.
RESULTS
Spacer Variations Result in Nonresponsive SMAD3 Reporters.
TGFβ canonically signals through the transcription factor SMAD3.41 We therefore initially sought to maximize the sensitivity of a SMAD3 activity reporter. SMAD3 has a well-defined PWM, with CGTCTAGACA as the most likely 10 bp binding sequence (Figure 1A).24 While this sequence is necessary to generate a reporter, the contribution of a spacer region to reporter sensitivity had not previously been established. Two reporters were generated based on the consensus SMAD3 binding sequence, one with 8 repeats of the most likely sequence (SMAD3_NS) and one with 8 repeats of the most likely binding sequence spaced with a single adenosine base pair (SMAD3_S) (Table 1). Reporter activity reached a maximum at 4 h poststimulation with TGFβ. SMAD3_NS showed a 0.54-fold decrease in activity while SMAD3_S showed a 1.16-fold increase in activity relative to an untreated control (Figure 1B). The decrease observed in the SMAD3_NS reporter was not statistically significant. These results indicated a spacer between SMAD3 binding sites was necessary to observe changes caused by increased SMAD3 activity.
Figure 1.
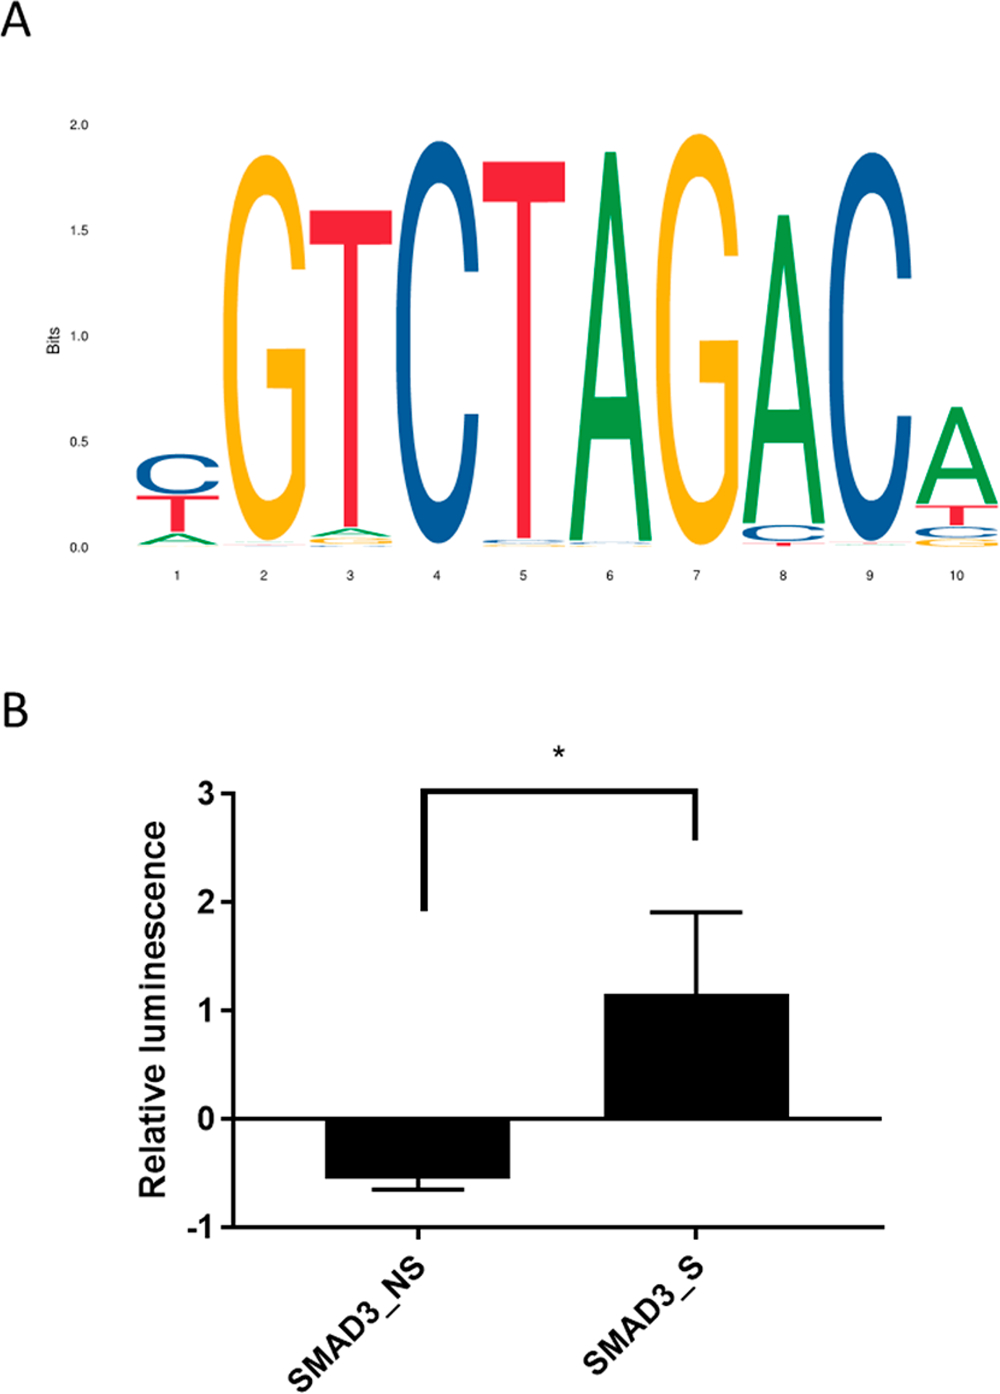
(A) Position weighted matrix for SMAD3. (B) Activity of binding site and binding site plus spacer after 4 h TGFβ stimulus. Bars indicate standard error. *: p < 0.05.
Table 1.
Reporter Sequences Containing a SMAD3 Response Element (Bold) and Spacer
| reporter | sequence |
|---|---|
| SMAD3_NS | CGTCTAGACA |
| SMAD3_S | CGTCTAGACAA |
| SMAD3_3 | ATCGCGTCTAGACA |
| SMAD3_4 | GCTCGTCTAGACA |
| SMAD3_5 | GTCGTCTAGACA |
| SMAD3_6 | AGTCTAGCTCCGTCTAGACA |
| SMAD3_7 | CGTATAGACTGCCGTCTAGACAAA |
| SMAD3_8 | TGTCGAGACGCGTCTAGACA |
| SMAD3_9 | ACGTCTAGACAAGTC |
| SMAD3_10 | CGCGTCAAGACTAGTGGCGTCTAGACA |
| SMAD3_11 | CTCGTCTAGACAAGAT |
| SMAD3_12 | TGCACGACTAGAATAGGACGTCTAGACA |
| SMAD3_13 | TGCGACGTCTAGACAAGAT |
| SMAD3_14 | TACCGCGTCTAGACA |
| SMAD3_15 | CGTCTAGACAAAA |
| SMAD3_16 | CAGTCGTCTAGACA |
| SMAD3_17 | CCTCCAGACAAGGCGTCTAGACA |
| SMAD3_18 | CGTCCAGACGCGTCTAGACA |
| SMAD3_19 | AAAACGTCTAGACAAGAAAA |
| SMAD3_20 | CCTCGAGACTCAACGTCTAGACA |
| SMAD3_21 | TGCAACGTCTAGACA |
| SMAD3_22 | TCTCTAGCCACTCGTCTAGACAAA |
| SMAD3_23 | ACTCTAGACTCAACGTCTAGACA |
| SMAD3_24 | TGCCGTCTAGACAAACGTCTAGACCTCTT |
| SMAD3_25 | CGTCTAGACGAGAGG |
We next examined the relationship between spacer composition and the activity of the SMAD3 reporter. A compilation of 23 sequences with SMAD3 binding sites and randomly generated spacers was fabricated; the base sequences for these reporters can be seen in Table 1 and methods for spacer design are found in the Methods. Maximum TF reporter activity was observed 4 h after TGFβ stimulation in A549 cells, similar to the SMAD3_S and SMAD3_NS reporters (Figure 2A). Of the new reporters, a significant increase in activity was detected in 21 of the 23 reporters following TGFβ stimulation relative to an untreated control (p < 0.05) (Figure 2B). Accordingly, two reporters were not sensitive to TGFβ-stimulated SMAD3 activation (SMAD3_8 and SMAD3_18); that is, they were not significantly different than the untreated control 4 h post stimulation. Collectively, a weak, but significant, positive correlation between activity and spacer length was observed by linear regression and F-test (p < 0.05) (Figure 2C). Spacer length was not sufficient to predict nonresponsive reporters. This observation led to the conclusion that spacer length played a marginal role in the reporter sensitivity; however, some other sequence-specific effects, such as the syntax of the spacer regions, led to nonresponsiveness.
Figure 2.
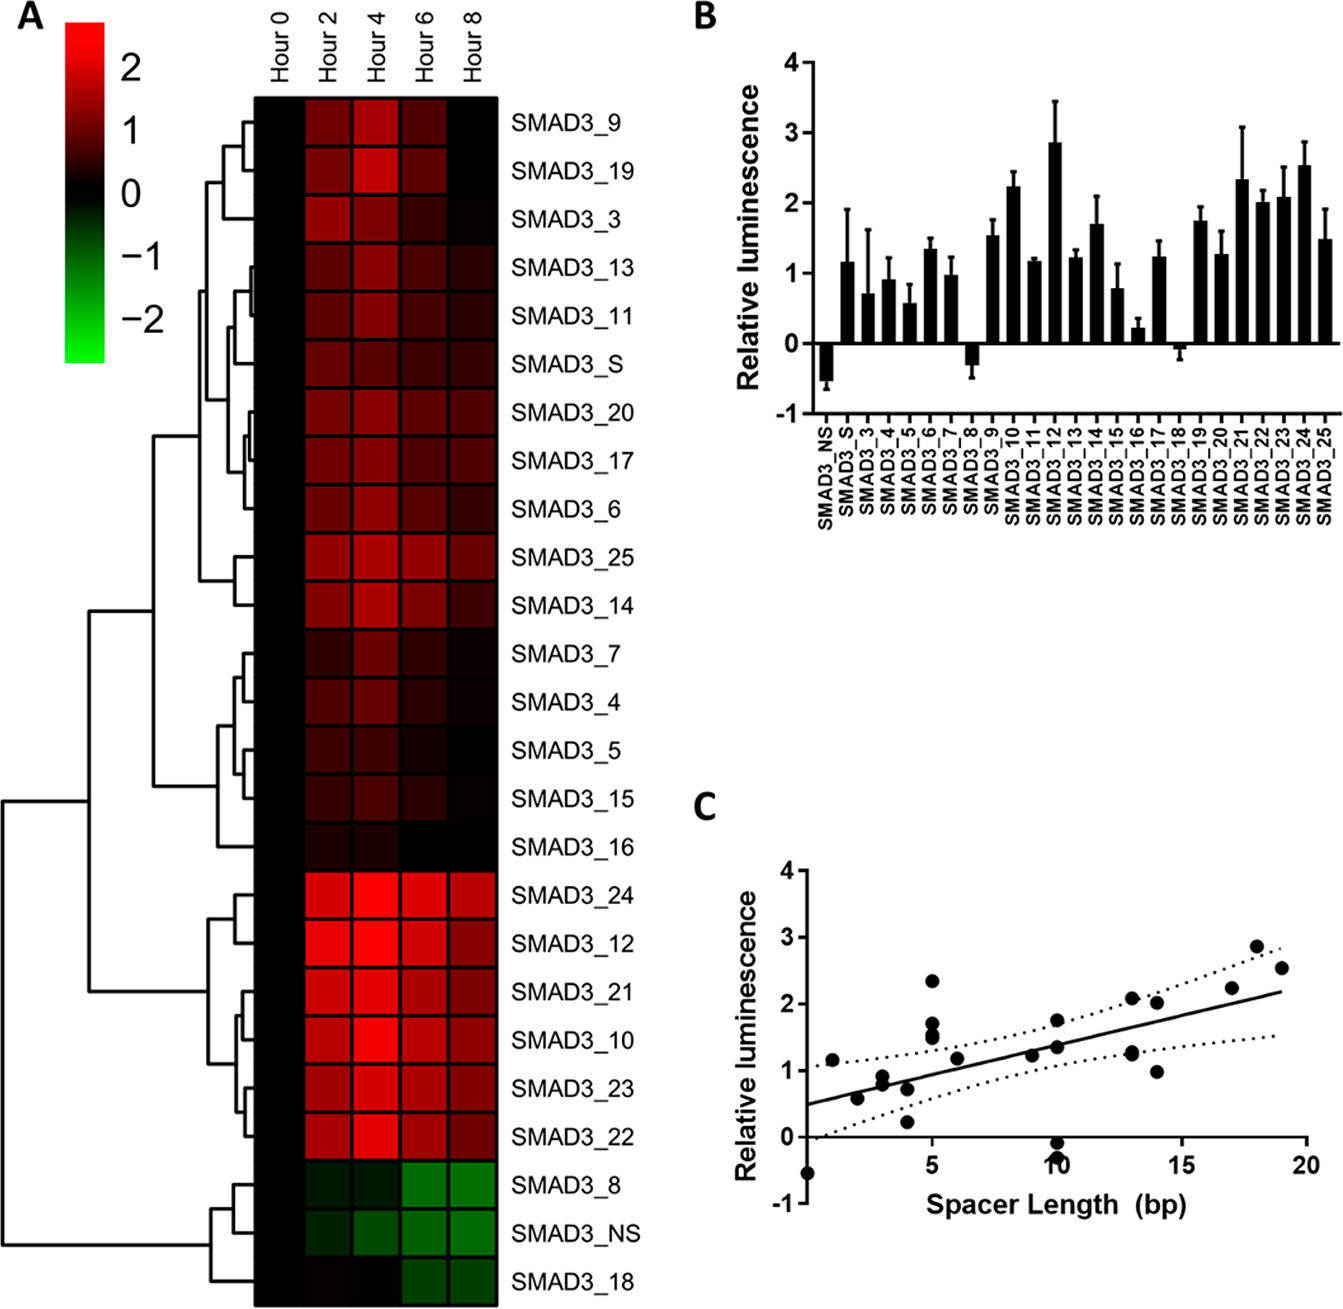
(A) Normalized change in SMAD3 reporter activity 4 h after TGFβ stimulation. (B) Time course dynamics of SMAD3 activity during stimulus. Bars indicate standard deviation of the measurements. (C) Relationship between reporter response and spacer length. Dashed lines are 95% confidence interval. Trend is significant by F test (p < 0.05)
Spacer Composition Predicts Sensitivity.
We tested the hypothesis that the sensitivity of the reporter was based on the ability of other TFs to bind to synthetic promoter sequence. Competitive binding of other TFs to our synthetic promoters was predicted using three methods: two based on the PWM (FIMO (log-odds probability) and BEEML (energy-based probability)), and one based on a learned neural network for TF binding (DeepBind).30 All three methods predicted SMAD3 binding to the 25 reporter constructs in our library relative to a random background sequence, including the three that had no response to increased SMAD3 activity. In order to computationally assess off-target TF binding, FIMO and BEEML were applied to predict binding based on the PWMs in the TRANSFAC database and DeepBind to predict binding to factors in the DeepBind library. DeepBind was the most conservative of these methods, predicting fewer off target factors for all reporters relative to FIMO and BEEML (Table 2). For all methods, a significant and positive correlation was observed between the number of predicted off-target binding TFs and the maximum activity of the reporter following TGFβ stimulation (p < 0.05) (Figure 3A–C). As with spacer length, the number of competitive binding elements was insufficient to predict nonresponsiveness, which suggested specific factors may be causing nonresponsiveness in these reporters.
Table 2.
Unique Binding Factors from BEEML, FIMO and DeepBind for Each SMAD3 Reporter
| reporter | BEEML | FIMO | DeepBind |
|---|---|---|---|
| SMAD3_NS | 74 | 107 | 4 |
| SMAD3_S | 71 | 91 | 6 |
| SMAD3_3 | 113 | 113 | 1 |
| SMAD3_4 | 58 | 74 | 4 |
| SMAD3_5 | 48 | 74 | 4 |
| SMAD3_6 | 84 | 113 | 6 |
| SMAD3_7 | 139 | 152 | 6 |
| SMAD3_8 | 94 | 113 | 7 |
| SMAD3_9 | 113 | 173 | 5 |
| SMAD3_10 | 167 | 199 | 9 |
| SMAD3_11 | 85 | 104 | 1 |
| SMAD3_12 | 173 | 151 | 10 |
| SMAD3_13 | 125 | 136 | 7 |
| SMAD3_14 | 67 | 70 | 3 |
| SMAD3_15 | 97 | 118 | 7 |
| SMAD3_16 | 62 | 97 | 2 |
| SMAD3_17 | 150 | 168 | 9 |
| SMAD3_18 | 114 | 133 | 7 |
| SMAD3_19 | 198 | 168 | 11 |
| SMAD3_20 | 115 | 153 | 7 |
| SMAD3_21 | 89 | 104 | 4 |
| SMAD3_22 | 174 | 162 | 6 |
| SMAD3_23 | 90 | 138 | 6 |
| SMAD3_24 | 181 | 203 | 6 |
| SMAD3_25 | 97 | 138 | 8 |
Figure 3.
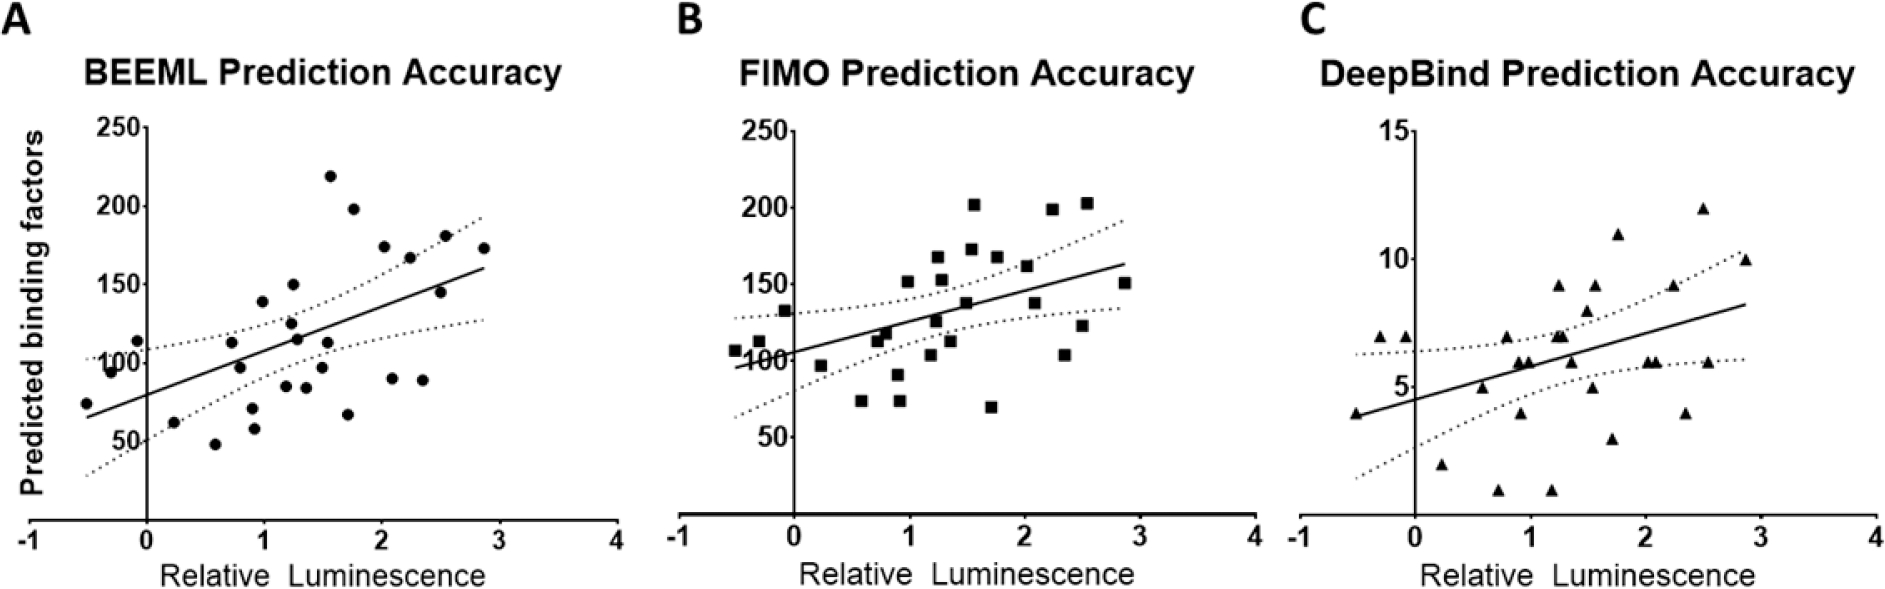
Prediction accuracy of SMAD3 reporter response based on background binding. (A–C) Predictions in A549 cells from BEEML (A), FIMO (B), DeepBind (C). Lines are linear trend, dashed lines 95% confidence interval. All trends are significant by F test (p < 0.05).
Binding of p53 Predicts Nonresponsive Reporters.
We subsequently investigated the potential for a relationship between specific off-target TFs to the sequences as a predictor of nonresponsiveness for the library of SMAD3 reporter constructs. A partial least-squares discriminant analysis (PLS-DA) was used to calculate a multivariate TF binding score signature that could classify a reporter as either responsive or nonresponsive (Figure 4). The responsive and nonresponsive factors were well-defined in the model and separated along latent variable 1 (Figure 4A). The loadings for latent variable 1 (Figure 4B) indicated a strong preference for p53 binding in nonresponsive reporters. Predicted binding of p53 was observed for all three analysis methods and was most predictive in BEEML and DeepBind. We noted that several p53 PWM were among the most predictive variables obtained from different scoring algorithms, which increased the robustness of the results. Moreover, a consensus p53 PWM was present in all the nonresponsive sequences, corroborating the results of the multivariate analysis (Figure 4C).
Figure 4.
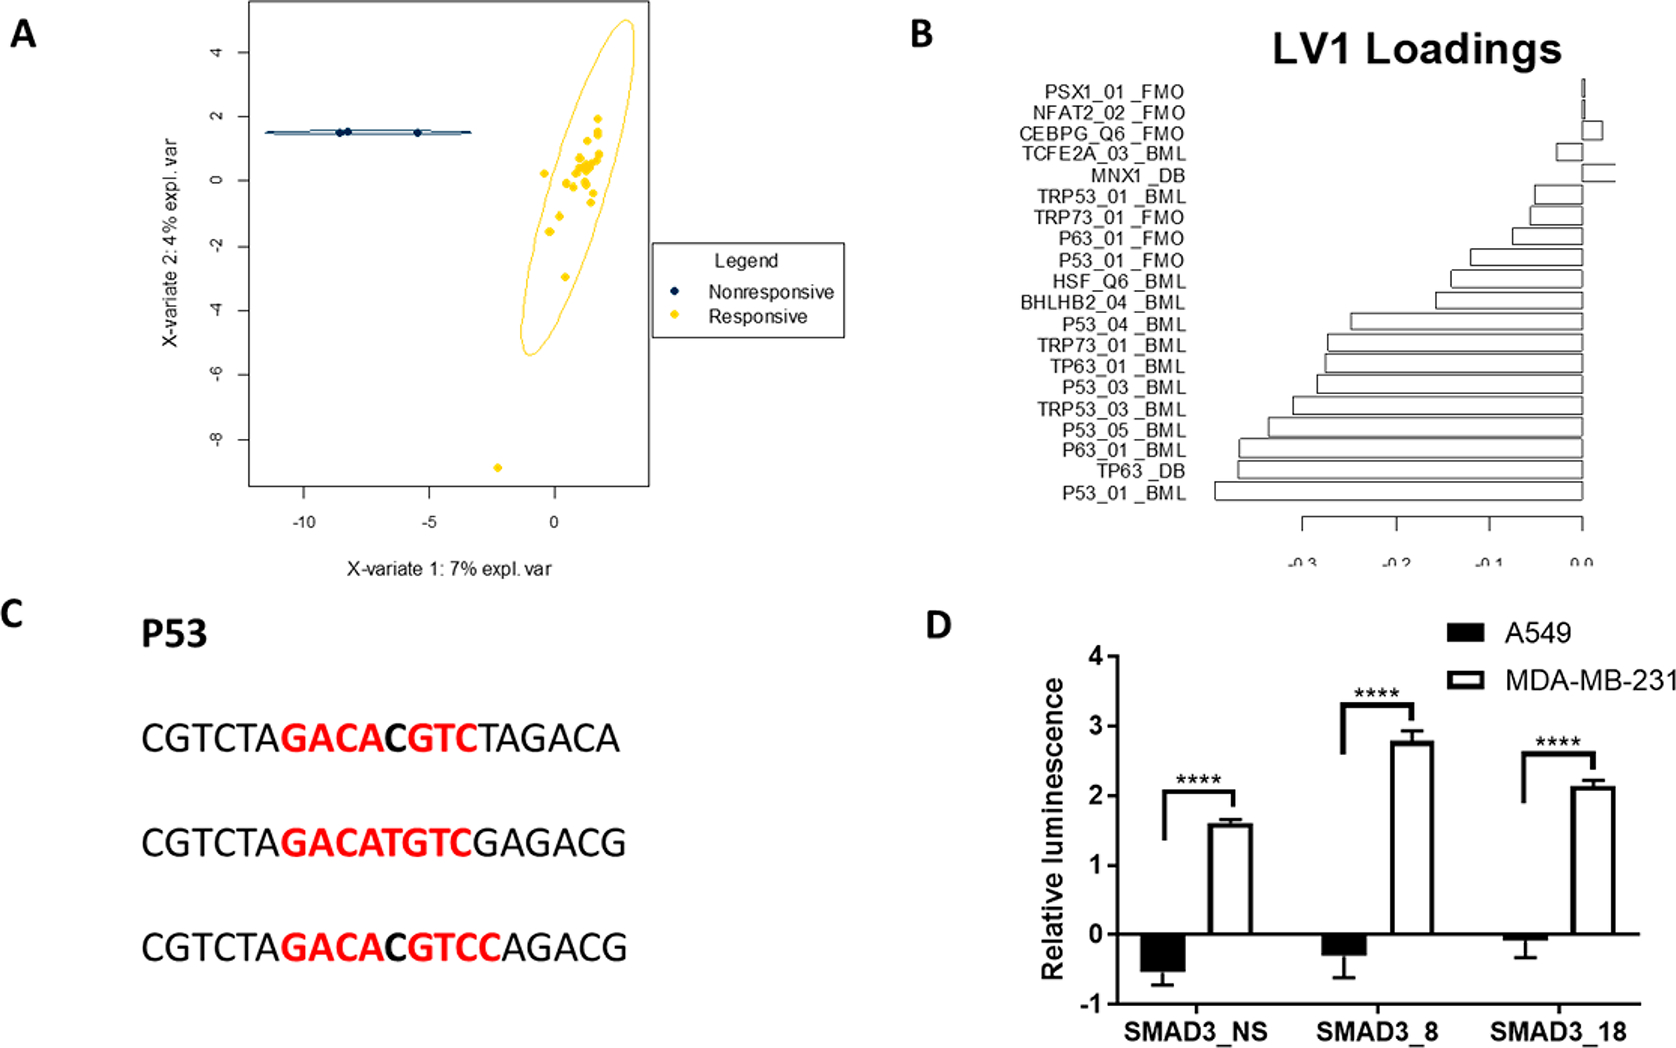
PLS-DA model separating Nonresponsive and Responsive reporters. (A) Scatter plot of reporters based on latent variables. Ellipses indicate 95% confidence interval for groups. (B) Loadings on latent variable 1, which provided the greatest separation between the two reporter types. (C) Binding sites for p53 in nonresponsive reporters. (D) Selected reporters are nonresponsive in A549 cells but respond to TGFβ stimulation in MDA-MB-231 cells. **** = p < 0.001.
We sought to verify the predictions of the PLS-DA analysis by testing the nonresponsive reporters in a p53 deficient cell line. The three scoring algorithms all predict the possibility of both SMAD3 and p53 binding to the nonresponsive reporters, leading to the hypothesis that removal of p53 by using a deficient cell line would enable the response to increased SMAD3 activity to be observed. MDA-MB-231, a triple negative breast cancer cell line, was selected as it has an inactivating mutation in p5342 and responds to TGFβ signaling with an increase in SMAD3 activity. The three reporters that were nonresponsive in A549 cells (SMAD3_NS, SMAD3_8 and SMAD3_18) all had significantly increased luminescence in the MDA-MB-231 cells 4 h after TGFβ stimulation relative to untreated controls and the equivalent A549 cells (Figure 4D). The SMAD3_NS reporter showed a 1.61 log fold change, while the SMAD3_8 and SMAD3_18 had a log fold change of 2.79 and 2.14, respectively.
Multivariate TF Activity Identifies Central Connections between Factors.
We subsequently investigated the activity of the SMAD3 reporter within the context of the activity of other TF reporters, which can represent the complexity of TGFβ signaling. We used transcriptional activity cell array (TRACER)1,2 to measure simultaneously the activity of 41 TFs using commercially available reporter constructs (Figure 5a). Of the 41 TF reporters, 37 reporters had significantly altered activity during TGFβ stimulation. Of these, SMAD3, ANRT1 and CMYC were most significantly altered, with activity increasing with SMAD3 and decreasing with ANRT1 and CMYC. Importantly, both increases (e.g., with AP1 and NFKB) and decreases (e.g., with p53 and ATF1) in activity were observed among the other factors, indicating a dynamic multivariate response among possible competing factors at the SMAD3 reporter. These differences in dynamic TF activity are easily observed through clustering analysis of the data (Figure 5a).
Figure 5.
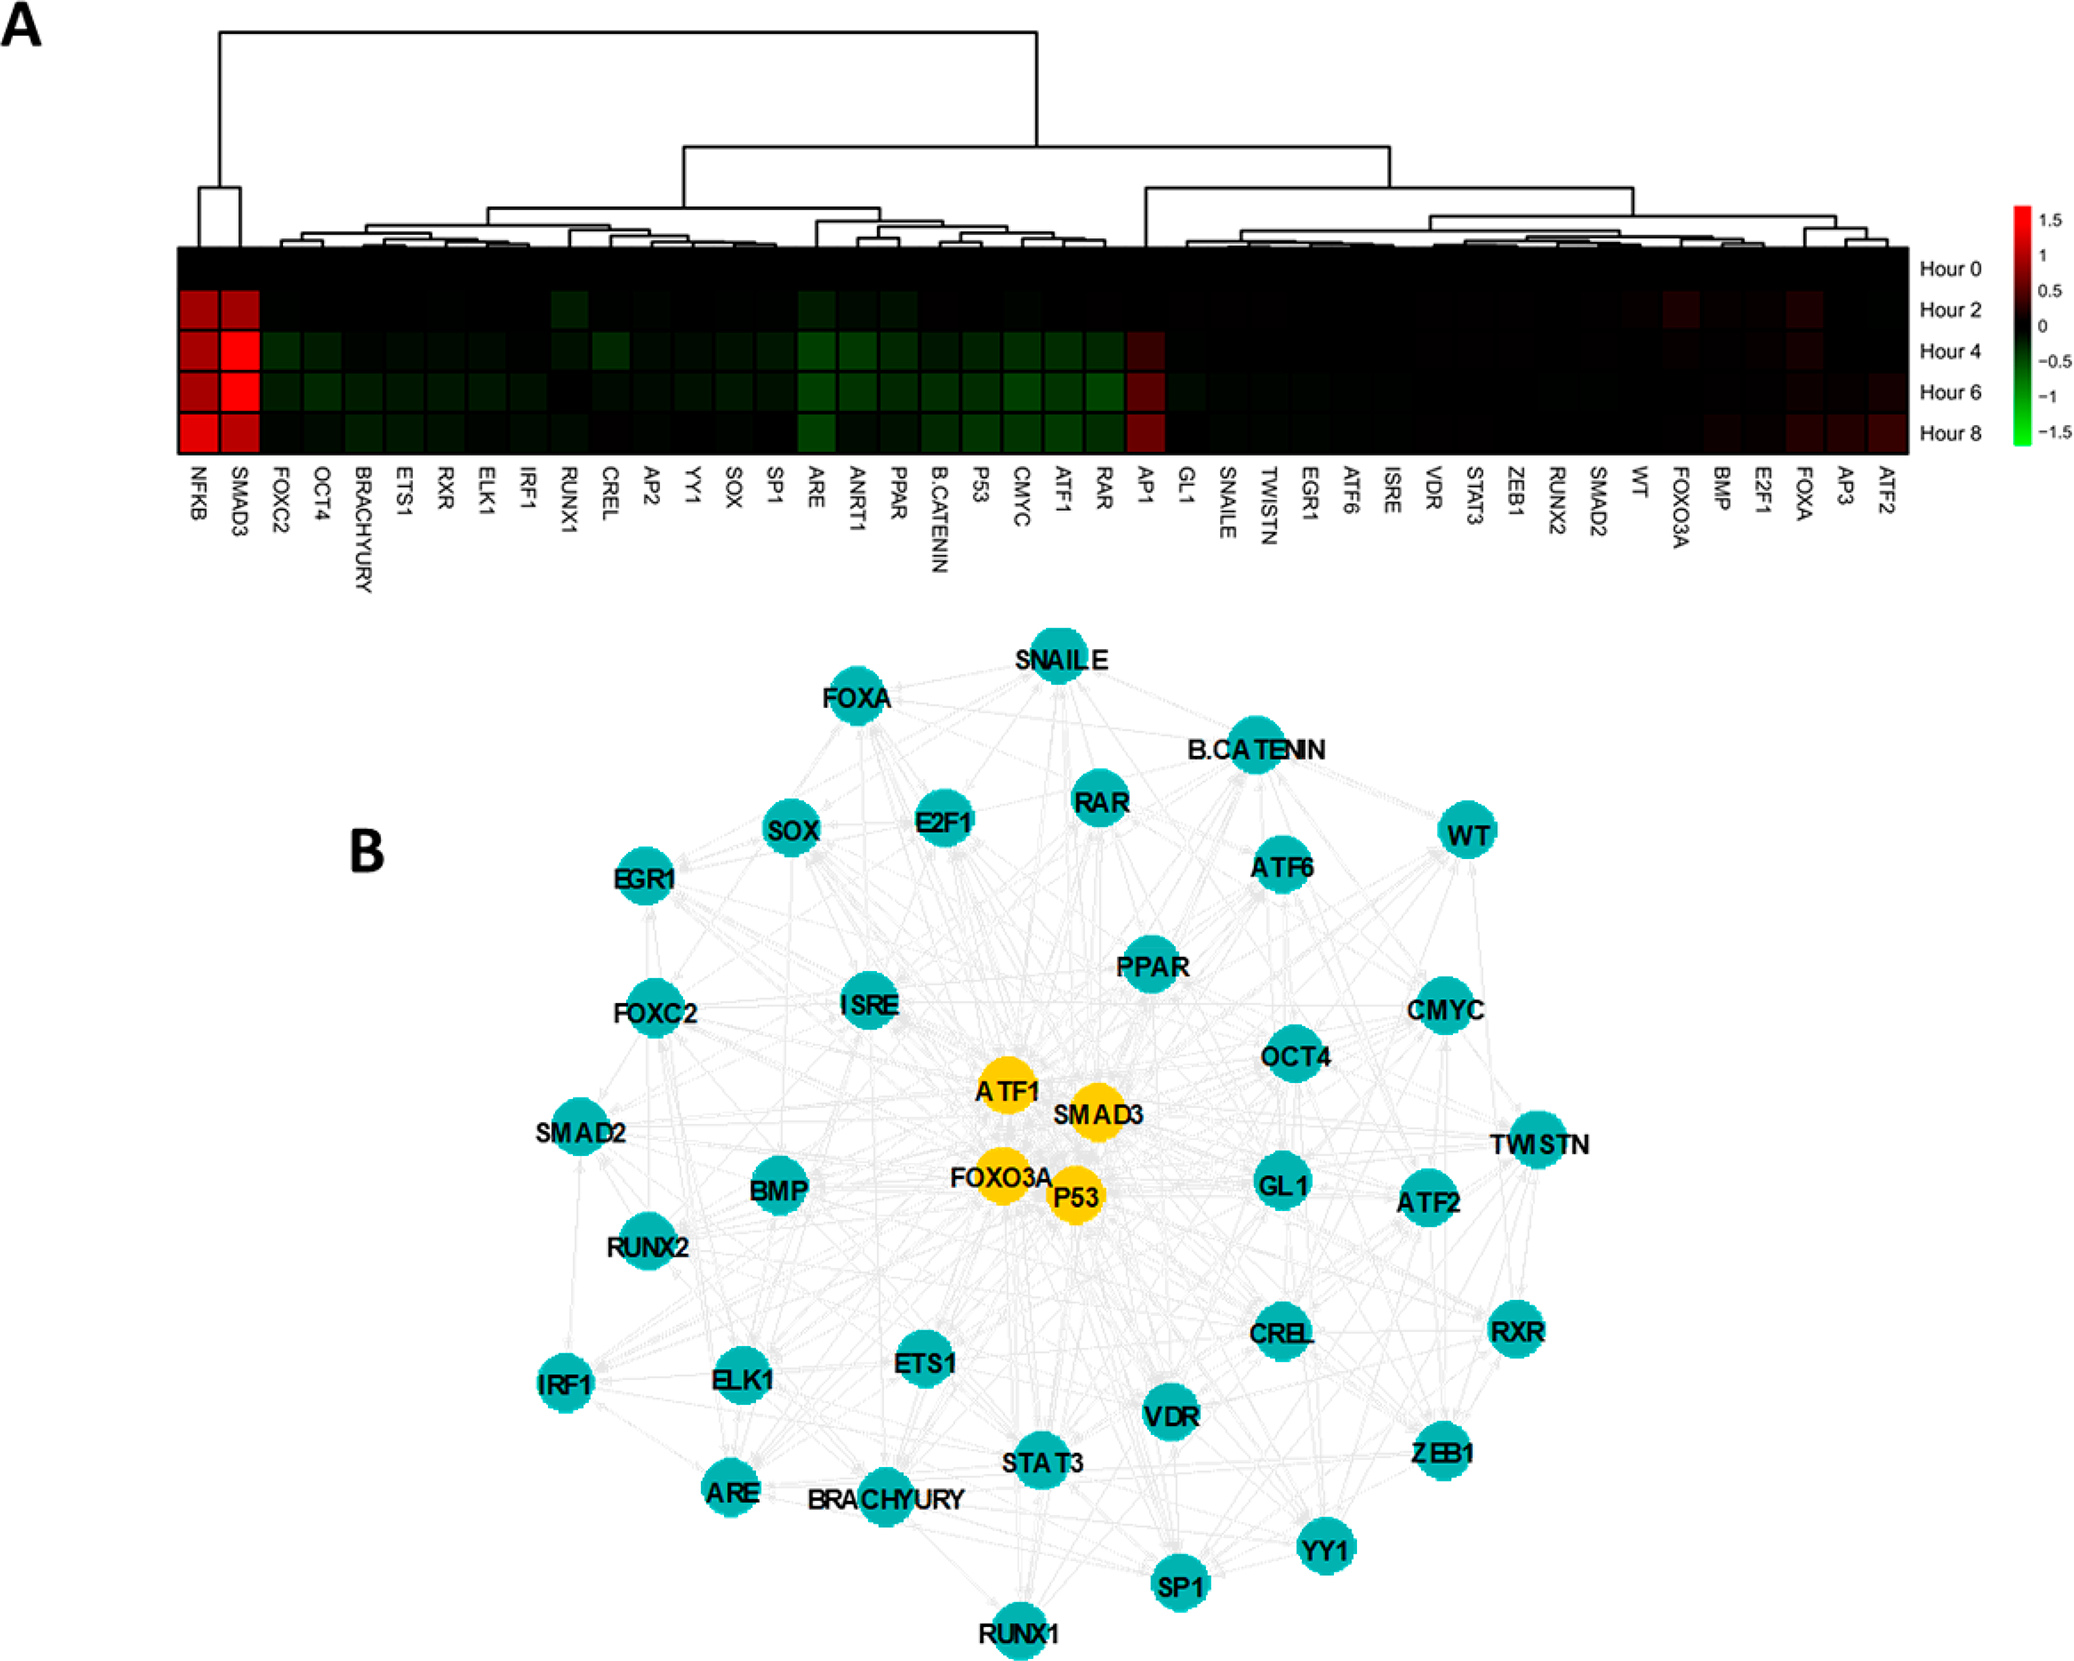
Dynamic assay for (A) TF activity and (B) inferred regulatory network during TGFβ stimulation. Yellow nodes are in the top 10% from eigenvector centrality.
The TF activity measurements were subsequently used to predict central factors and connections in response to TGFβ stimulation. A previously developed computational pipeline was employed to infer a regulatory network structure from the dynamic data1 (Figure 5b), with identification of central hubs that may be affected in tandem during TGFβ signaling. The identified TF activity hubs were SMAD3, p53, FOXO3A, and ATF1. This analysis indicated that cross reactivity between these factors (e.g., p53 binding a SMAD3 reporter) may result in either nonresponsive reporters or inaccurate measurements in other systems, and should be avoided when designing the spacers on a new reporter.
Genetic Reporters Identify Dynamic EMT Signature.
We subsequently analyzed the activity of genetic reporters to extend our previous analyses of TF activity. CRISPR/Cas9 was used to introduce genetic reporters to dynamically measure 47 potential gene targets that may be stimulated by TGFβ signaling in A549 cells (Figure 6a), which has been previously shown to induce epithelial-mesenchymal transition (EMT) in A549 cells43 Of the 47 genetic reporters, 34 reporters were significantly altered during the 8 h of TGFβ stimulation. Accordingly, clustering of the dynamic gene expression data indicated a cluster of significantly upregulated markers of EMT (e.g., SNAIL, SNAI2, TWIST, Vimentin, MMP14). Additional downregulation of relevant EMT markers (TGFβ2, CDH1 or E-cadherin) was also observed. Genes were, in general, gradually upregulated during the 8-h time course, while downregulation primarily occurred in the first 2 h. Initial downregulation was observed in several EMT-related genes (e.g., CDH2, ZEB1, ZEB2), with expression trending toward significant increases by 8 h. We applied our network inference algorithm to the dynamic gene expression data in a similar manner to the TF activity data (Figure 6b). A central set of five genes (CDH1, NOTCH1, TGFB2, TWIST and ZEB2) were identified from the network structure. This set of reporters included both upregulated (NOTCH1, TWIST, ZEB2) as well as downregulated (CDH1, TGFB2) genes, suggesting that both processes are central in regulating EMT. An inferred network topology that combines the TF regulators and induced genetic targets (Figure 6c) showed similar central nodes as to those identified in Figure 5b and Figure 6b, supporting that these analyses can be run effectively on each independent data set.
Figure 6.
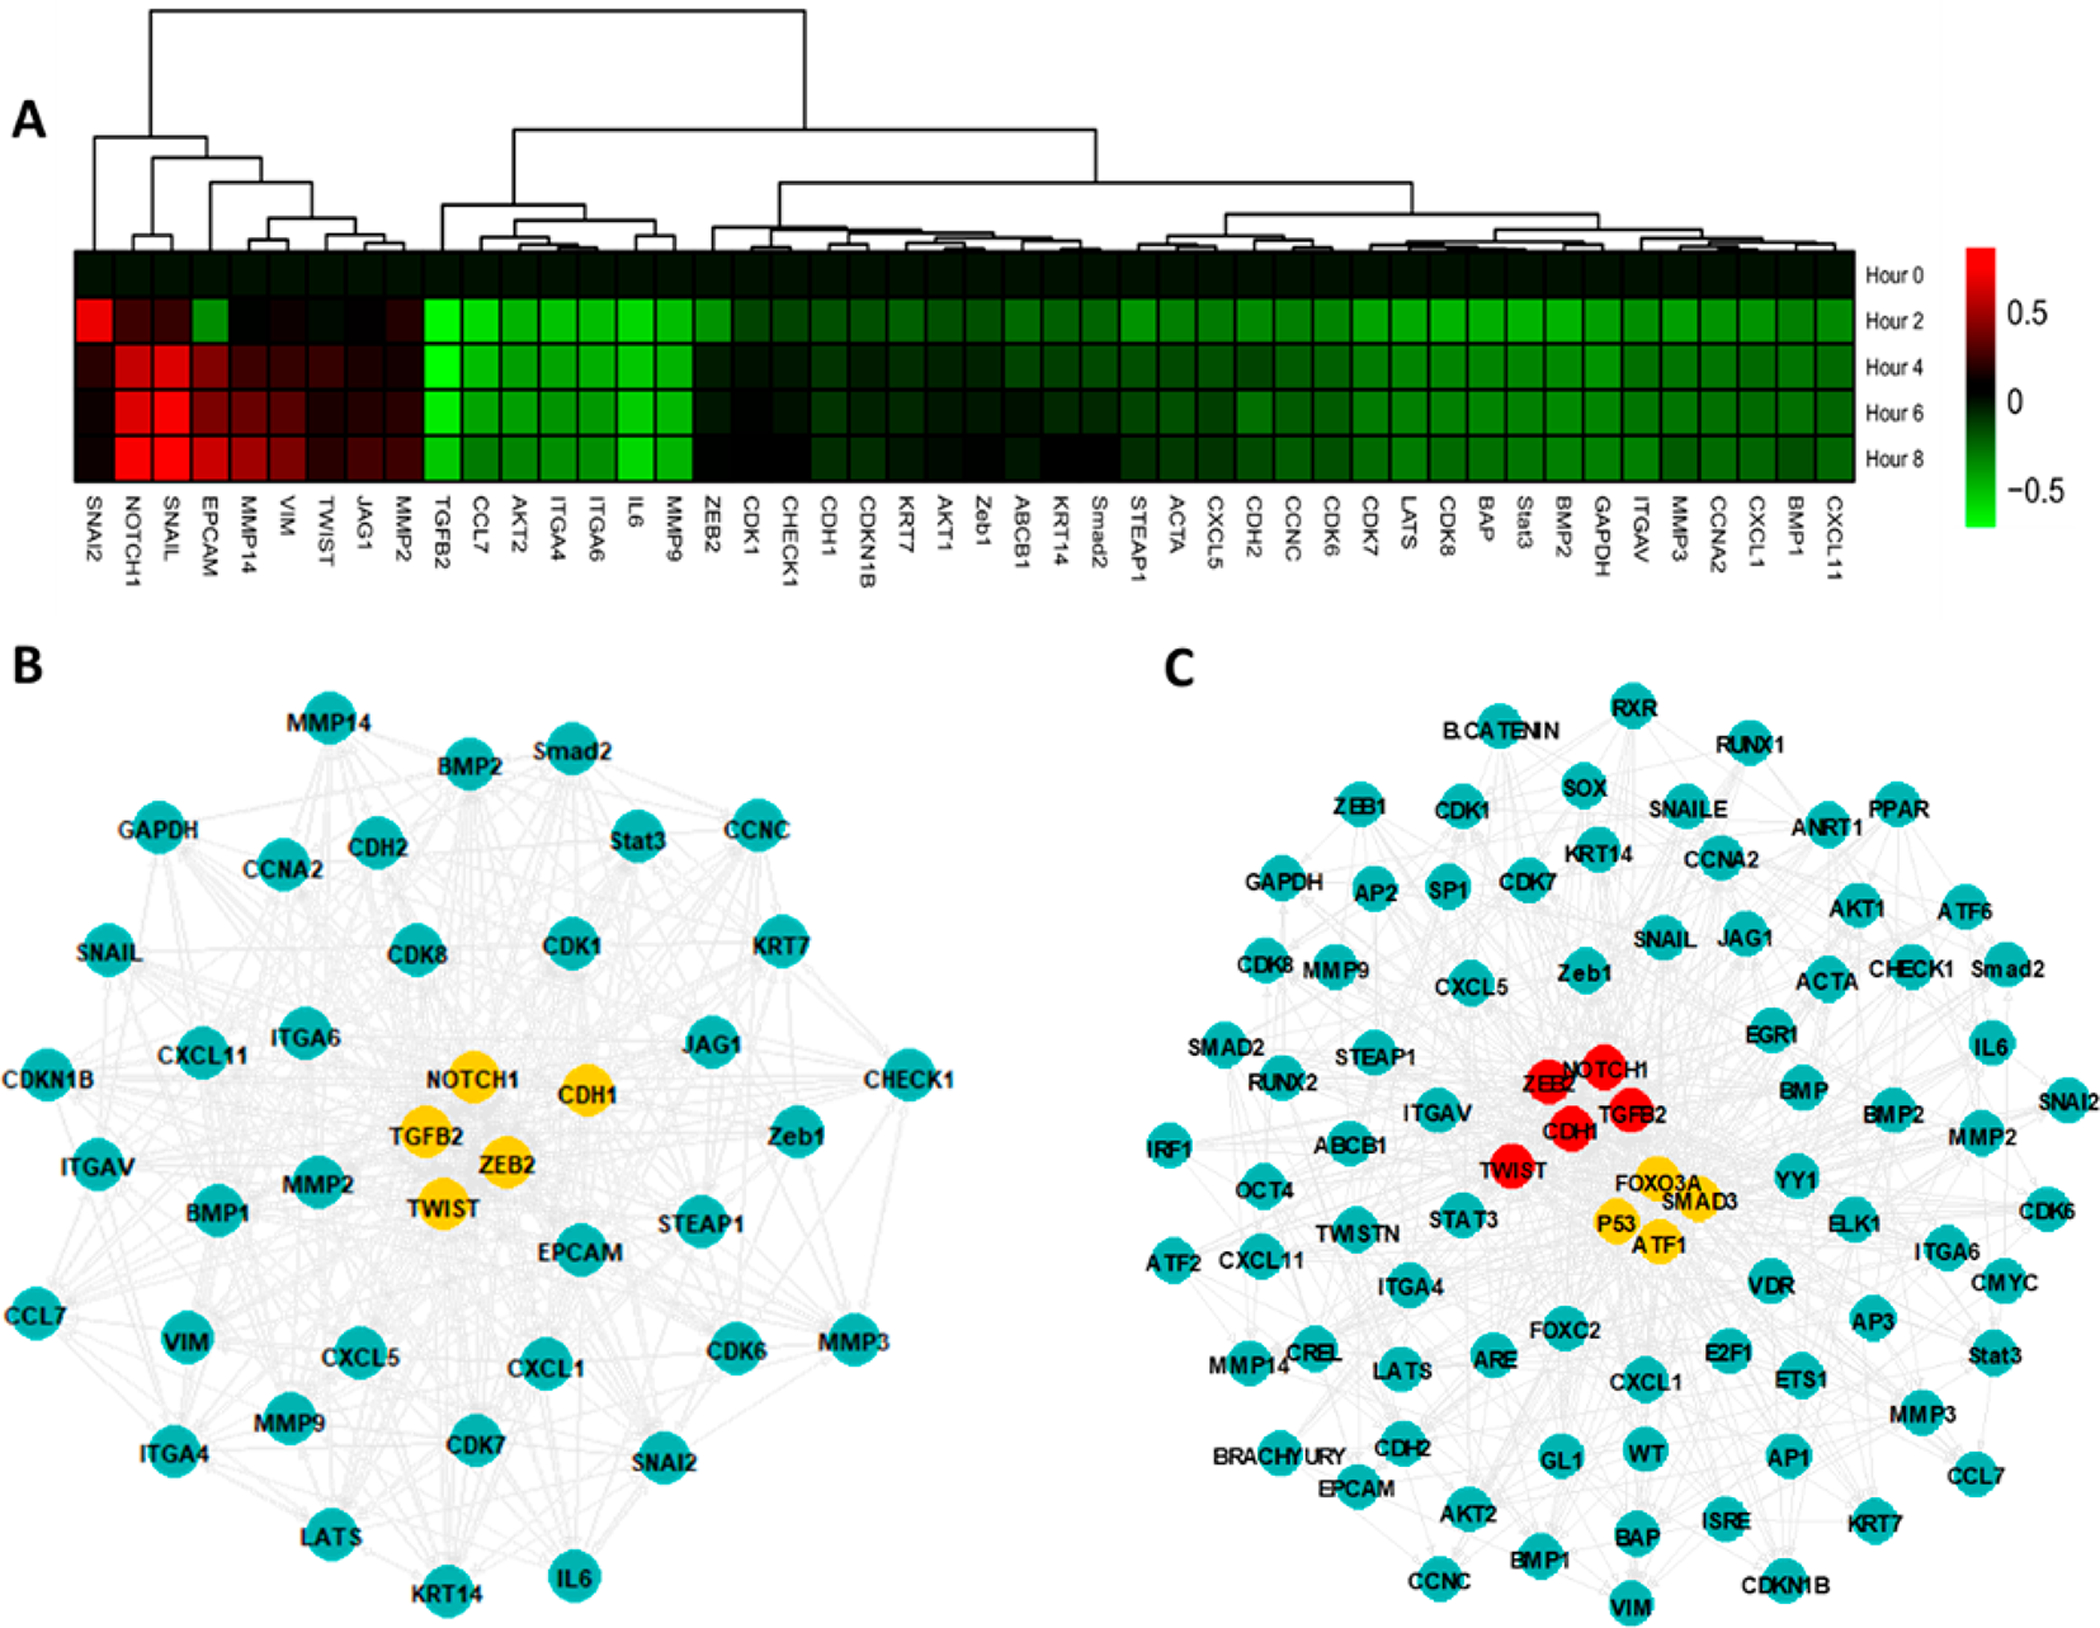
(A) Dynamic gene expression assay. (B) Inferred regulatory network during TGFβ stimulation. Yellow nodes are in the top 10% from eigenvector centrality. (C) Inferred network connections between TF activators and genetic effectors. Yellow and red nodes are in the top 10% by eigenvector centrality of TFs and genes, respectively.
DISCUSSION
TGFβ signaling through SMAD3 leads to a myriad of changes in TF activity that leads to numerous changes in gene expression within the cell. A TF reporter array was employed to capture the TF dynamics following TGFβ stimulation, while genomic reporters identified the gene expression changes that were downstream of TF activation. The combination of TF and genomic reporters broadly reproduced known targets of TGFβ signaling (e.g., increased SMAD3 activity and expression of EMT markers) while also suggesting potential cross reactivity and important factors in a multivariate analysis. While these experiments were conducted using a well-known signaling pathway, the methodology can be extended to other systems. For example, this connectivity of TFs and genetic targets has been applied to the various lineages within the nervous system.44 While these connections have been inferred from single-cell sequencing experiments, the TF and genetic reporter systems could directly visualize the developmental dynamics. The experiments in this paper provide the framework for the integration of the TF and genetic reporter systems, which complement the more established work in transcriptomics and proteomics.
The results of this study suggested that the sensitivity of a SMAD3 reporter construct is heavily dependent on the positioning of the binding sites for SMAD3 within the reporter. Simply repeating the CGTCTAGACA consensus binding sequence for SMAD3 without spacers was insufficient for accurate reporter activity, as evidenced by the lack of response by the SMAD3_NS reporter (Figure 1). Interestingly, a small change in the reporter repeat sequence (insertion of one base pair between SMAD3 binding site repeats) was sufficient to provide a responsive reporter. We used three analysis methods (FIMO, BEEML and DeepBind) to predict SMAD3 binding to our designed reporters. Despite experimentally observed differences between constructs, the TF binding algorithms used in this study predicted that SMAD3 could bind equally to all the reporters and therefore respond to an increase in SMAD3 activity. The observation that a spacer is necessary to observe an increase in reporter activity after addition of TGFβ to the media indicated that factors beyond the number of binding sites and their congruency to a consensus sequence must be considered when designing a TF reporter construct. These design factors included spacer length (Figure 2C) and number of competing TFs that could bind to the sequences (Figure 3). Other variables, such as GC content, that were not analyzed in this study may also play a role and would provide other areas to examine to optimize the reporter design. The specific sequence of the spacer region must therefore be carefully considered and computationally validated for unintended binding effects before implemented in the reporter design.
A multivariate model classifying reporters based on scores from FIMO, BEEML, and DeepBind using experimentally generated-PWM databases clearly identified sequence-specific differences that were predictive of the response to SMAD3 activity. The three algorithms yielded complementary binding predictions and inferred a select few factors that were likely inhibiting reporter response to SMAD3. Specifically, a binding site for p53 was identified as the distinguishing characteristic for nonresponsive reporters. Interestingly, computationally predicted binding from other SMAD TFs (e.g., SMAD2, SMAD4) were not highly predictive of sensitive/insensitive reporters.
Tumor protein p53 acts as a tumor suppressor in healthy cells and is often mutated in malignancy.45 A549 cells express wild-type p5342 and have a high level of baseline p53 activity. While p53 belongs to its own unique class of TFs (p53 domain factors), the PWM for p53 (Figure 4C) shares similarities with the consensus binding sequence for SMAD3. Importantly, p53 is active in its role as a tumor suppressor, and therefore would be active at a SMAD3 reporter with a similar sequence. Competitive binding between constitutively active p53 and TGFβ-activated SMAD3 likely explains the nonresponsive reporters observed in this study. Importantly, testing the nonresponsive reporters in a p53-null cell line (MDA-MB-231) resulted in these reporters responding to active SMAD3, indicating p53 activity significantly impacted the responsiveness in select reporter constructs in A549 cells. These results suggest binding sites for constitutively active TFs must be avoided when designing a reporter. such as p53, housekeeping proteins such as Sp1, and cell cycle proteins such as the E2F class of factors. Highly active cell-type specific factors should also be considered and avoided if possible. These would include pluripotency markers in stem cells (e.g., OCT4, NANOG), lineage specific factors in macrophages (e.g., PPARγ, STAT1), and lineage-specific markers (e.g., MAFA in pancreatic cells).
The parallel analysis of dynamic activity of multiple TFs provides more mechanistic information about changes in the regulome or transcriptome than is possible with a single reporter. In the case of TGFβ, SMAD3 is the canonical TF, though other factors are activated either initially or downstream and play a role in determining the subsequent gene expression and phenotype. By directly measuring the dynamics of multiple TFs, we could infer a network topology that represented the regulome dynamics during TGFβ signaling in A549 cells. The network analysis (Figure 5) provided a list of four factors (SMAD3, p53, ATF1, FOXO3A) that are central to early TGFβ signaling in A549 cells. The experiments confirmed that p53 activity was likely responsible for the nonresponsive reporters. Forkhead box (FOX) factors were also predicted to bind to our reporters (data not shown), however did not factor heavily into identifying nonresponsive reporters. The fourth factor, ATF1, has been implicated in TGFβ signaling,46,47 yet did not bind strongly to reporters in our library, and was not implicated by the multivariate analysis as contributing to the nonresponsive reporters. Collectively, the dynamic TF measurements can be represented in a network model that captures the multivariate response to TGFβ.
Advances in the CRISPR/Cas9 system have provided the tools to create live cell assays that also profile dynamics in effector gene expression. Many previous studies have focused on the connection between possible TF regulators and dynamic genetic targets using gene expression data from microarrays or RNA-seq48,49 Herein, we simultaneously measured TF activity and gene expression dynamics in real time (Figure 6). We focused our study here on short-term dynamics in EMT, which is well studied in A549 cells and thus genetic targets that are affected by TGFβ are known.43,50,51 As expected, a core group of early EMT regulatory genes were clustered together in our analysis, including transcription factors (SNAIL,52 TWIST,53 ZEB254), matrix related proteins (Vimentin,55 MMP243) and members of the Notch pathway (NOTCH1 and JAG156). The network analysis additionally identified two downregulated factors, TGFβ2 and E-cadherin, both of which are genes likely downregulated by TGFβ signaling in A549 cells.43 Together, these results indicated the genetic reporter array could be used effectively to identify targets that have been previously identified in the literature and gives a measure of confidence to any unknown factors that may be identified in future experiments.
As the TF activity and genetic reporter array techniques utilize the same functional output they can be easily combined into a single analysis pipeline, yielding a simple method to connect gene expression to transcriptional control (Figure 6c). The connected network between TF activators and genetic effectors yielded similar central nodes to the network analysis on each set of factors alone, which indicated the individual analyses were robust, yielded important mechanistic information, and that these two types of assay could be run independently in the future. Our analysis focused on early time points, and the integration of later time points may alter the network topology represented in Figure 6c. Importantly, the methods used for gene delivery in this study (lentivirus and CRISPR/Cas9) lead to stable integration of the reporter, which would allow us to interrogate later time points in a future experiment. This strategy allows the dynamic characterization of TF and gene expression activity within complex cultures over weeks or months and provide important mechanistic insight that is not available through any other available techniques, and could provide a versatile tool for biologists and engineers.
Using TGFβ signaling as a model, we identified key considerations for designing and interpreting arrays of reporter constructs. These studies demonstrated that an effective TF activity reporter must have both consensus binding sites for a particular factor and those binding sites arranged in a manner that will limit the binding of other TFs. Specific TFs, such as constitutively active factors and those that are active in a similar context, such as ATF1 for the SMAD3 reporters, should be avoided. The results of this study also suggested that longer spacers augment the sensitivity of the reporter. The parallel analysis of TF reporters can contribute to understanding the reporter design, and more importantly, can be converted to an inferred network to yield mechanistic information about the regulome. Furthermore, we supplemented the TF analysis genetic reporters for quantification of gene expression, which provides the opportunity to connect TF activity and gene expression. Collectively, these dynamic reporter approaches provide a foundation for developing complex living cell arrays, which will enable the next generation of live cell reporter technologies.
METHODS
Cells and Reagents.
A549 and MDA-MB-231 cells were sourced from the American Type Cell Culture repository. A549 cells were maintained in RPMI Medium supplemented with 10% fetal bovine serum. MDA-MB-231 cells were maintained in DMEM Medium supplemented with 10% fetal bovine serum. Media was replaced every 3 days and cells were passaged after they became 80% confluent.
Reporter Construction.
SMAD3 reporters were designed based on the V$SMAD3_02 motif from TRANSFAC.11,24 This motif was discovered through HT-SELEX data and represents a well-defined sequence upon which to build our reporter library. Oligos were designed to contain the most probable binding sequences from the V$SMAD3_02 motif (CGTCTAGACA) along with a random spacer sequence. The library included one sequence with no spacer (SMAD3_NS) and one with a single adenosine spacer (SMAD3_S). Binding sites were repeated until the entire synthetic promoter region was between 80 and 90 bp in length. SMAD3 reporters were cloned into a modified version of the pCS-CG plasmid,25 in which the CMV promoter has been replaced with a minimal thymidine kinase (TA) promoter along with NheI and AgeI restriction enzyme sites for reporter cloning. Oligos were designed with these reporter sequences, annealed and ligated between NheI and AgeI sticky ends in the modified backbone.
Genetic reporters were designed using the system described by He et al.4 This system uses four plasmids coding for Cas9, IRES-reporter, target guide RNA and reporter guide RNA. Guide RNA plasmids and reporter template plasmids were obtained from Addgene (#83807 and #83576, respectively). The GFP from the template was exchanged for Nanoluciferase (Promega) by ligating between NcoI and ClaI sites. Guide RNAs were created by cloning between the BsmbI sites in the MLM3636 plasmid (Addgene #43860). Guide RNAs targeting the 3′ UTR of target genes were designed to limit off target effects using the ATUM Biosciences gRNA design tool.
Lentivirus.
Lentivirus was produced by cotransfecting HEK-293T cells with previously described lentiviral packaging vectors (pMDL-GagPol, pRSV-Rev, pIVS-VSV-G) and lentiviral vectors using JetPrime (Polyplus).26 After 48 h, supernatants were collected and cell debris was spun down and removed. Viruses were concentrated using PEG-it (Systems Biosciences) and resuspended in phosphate buffered saline (PBS).
Reporter Arrays.
We used a transcriptional activity cell array (TRACER) to evaluate the activity of our designed SMAD3 reporters and an existing library of commercially available reporters.1,2,27 A549 cells were plated into a black 96 well plate and transduced with the library of SMAD3 reporters as well as a control containing no additional binding site (thymidine kinase promoter or TA). Cells were allowed to proliferate for 48 h in culture. Following incubation, growth media was exchanged for media containing 630 μM d-luciferin and either vehicle or 5 ng/mL TGFβ. Activity was measured immediately following media change as well as 2, 4, 6, and 8 h later. Activity measurements were acquired using an IVIS Spectrum (PerkinElmer). Activity measurements were background subtracted, normalized to the luciferase signal from the empty control reporter (TA) and log2 transformed as described previously.2 Data were taken from a minimum of three replicates and presented as the mean ± standard deviation. Statistical analysis was performed using the limma R package.28 P values were adjusted using the false-discovery rate correction.29
Genetic reporters were delivered to A549 cells through electroporation using a Neon transfection system (Thermo Fisher). Cas9, gRNA and reporter template DNA were delivered at a ratio of 1:1:1 and cells were maintained for at least 14 days before use in an experiment. Cells were plated in a black 96 well plate 2 days prior to assay. Following incubation, media was exchanged for growth media containing a 1:10,000 dilution of Nano-Glo Live Cell EX-6829 substrate (Promega). One hour after addition of substrate, a luminescence image was acquired and either vehicle or TGFβ was added to a final concentration of 5 ng/mL. Luminescence data was collected at 2, 4, 6, and 8 h following addition of TGFβ in a manner similar to the TF reporter assay. For analysis, raw luminescence data was background subtracted and normalized to luminescence of a HPRT1 reporter. Data was subsequently normalized to the control and log2 transformed. Statistical analysis was performed in a similar manner to the TF activity measurements.
Transcription Factor Binding Analysis.
The probability of TF binding to a reporter was calculated using three different methods. FIMO (Find Individual Motif Occurrences, part of the MEME suite30) uses a log odds method to compute a probability for a sequence matching a motif in a database (TRANSFAC11 in this study). BEEML (Binding Energy Estimation by Maximum Likelihood12,31) uses an energy model to calculate a binding probability based on a PWM. These two methods were converted to an R program and used to score each of the 25 SMAD3 reporters against PWMs in the TRANSFAC database. A second set of 100 random sequences of 100 base pairs (bp) each was used as a control. A third method, DeepBind, is based on a neural network that has been trained on experimental TF binding data.6 The code and database for DeepBind was downloaded from the source (http://tools.genes.toronto.edu/deepbind/) and used to score all 25 SMAD3 reporters and 100 random sequences against the DeepBind database. These three methods provided individual binding scores for each TF in the TRANSFAC (FIMO, BEEML) and DeepBind databases that were combined into a single multivariate score for each reporter. The combination of outputs for each method that was used for subsequent multivariate classification of the individual reporters. TFs were said to be predicted to bind to a sequence if the score was more than 4 standard deviations above the mean score of the 100 random sequences of 100 bp.
Classification Analysis.
Partial least squared discriminant analysis (PLS-DA) was performed to identify multivariate combinations of binding scores from FIMO, BEEML and DeepBind that would separate the different conditions (responsive vs nonresponsive reporters). PLS-DA analysis was preformed using the mixOmics package in R.32 Mean-centering and variance scaling were used to standardize all data prior to multivariate analysis. Singular value decomposition (SVD) was used to select the top 20 scores for two latent variables in these models from the 4914 individual values from the three score algorithms. Variable importance to the model was defined as both selection by SVD as well as the magnitude of loading in a particular latent variable.
Network Analysis.
Network analysis of TF activity measurements was carried out using a modified version of NTRACER, which has been described previously.1 Data was normalized, mean-centered and variance scaled prior to analysis. The data was combined through sampling a single mean value for each factor from the available experiments and connections between TF activity and gene expression inferred using several different techniques: linear methods (PLSR,33 similarity index,34 linear ordinary differential equations based on TIGRESS,35 random forest36), and nonlinear methods (ARACNE,37 CLR,38 MRNET39). A total of 1000 runs was performed to ensure robust inference of connected factors. Features were selected from the top 10% of edges from multiple inference methods. Central nodes were identified through eigenvector centrality. Networks were visualized and analyzed using the R package iGraph.40
Supplementary Material
ACKNOWLEDGMENTS
The authors would like to thank Seungjin Shin for his helpful contributions to the precursors for this study. This work was funded by NIH through grant number 9R01CA214384 (JSJ and LDS).
Footnotes
The authors declare no competing financial interest.
ASSOCIATED CONTENT
Supporting Information
The Supporting Information is available free of charge on the ACS Publications website at DOI: 10.1021/acssynbio.8b00236.
Distribution of reporter values (PDF)
REFERENCES
- (1).Bernabé BP, Shin S, Rios PD, Broadbelt LJ, Shea LD, and Seidlits SK (2016) Dynamic transcription factor activity networks in response to independently altered mechanical and adhesive microenvironmental cues. Integrative Biology 8, 844–860. [DOI] [PMC free article] [PubMed] [Google Scholar]
- (2).Decker JT, Hobson EC, Zhang Y, Shin S, Thomas AL, Jeruss JS, Arnold KB, and Shea LD (2017) Systems analysis of dynamic transcription factor activity identifies targets for treatment in olaparib resistant cancer cells. Biotechnol. Bioeng. 114, 2085. [DOI] [PMC free article] [PubMed] [Google Scholar]
- (3).Weiss MS, Bernabé BP, Bellis AD, Broadbelt LJ, Jeruss JS, and Shea LD (2010) Dynamic, large-scale profiling of transcription factor activity from live cells in 3D culture. PLoS One 5, e14026. [DOI] [PMC free article] [PubMed] [Google Scholar]
- (4).He X, Tan C, Wang F, Wang Y, Zhou R, Cui D, You W, Zhao H, Ren J, and Feng B (2016) Knock-in of large reporter genes in human cells via CRISPR/Cas9-induced homology-dependent and independent DNA repair. Nucleic Acids Res. 44, e85–e85. [DOI] [PMC free article] [PubMed] [Google Scholar]
- (5).Yang H, Wang H, Shivalila CS, Cheng AW, Shi L, and Jaenisch R (2013) One-step generation of mice carrying reporter and conditional alleles by CRISPR/Cas-mediated genome engineering. Cell 154, 1370–1379. [DOI] [PMC free article] [PubMed] [Google Scholar]
- (6).Alipanahi B, Delong A, Weirauch MT, and Frey BJ (2015) Predicting the sequence specificities of DNA-and RNA-binding proteins by deep learning. Nat. Biotechnol. 33, 831–838. [DOI] [PubMed] [Google Scholar]
- (7).Weirauch MT, Yang A, Albu M, Cote AG, Montenegro-Montero A, Drewe P, Najafabadi HS, Lambert SA, Mann I, and Cook K (2014) Determination and inference of eukaryotic transcription factor sequence specificity. Cell 158, 1431–1443. [DOI] [PMC free article] [PubMed] [Google Scholar]
- (8).Weirauch MT, Cote A, Norel R, Annala M, Zhao Y, Riley TR, Saez-Rodriguez J, Cokelaer T, Vedenko A, and Talukder S (2013) Evaluation of methods for modeling transcription factor sequence specificity. Nat. Biotechnol. 31, 126–134. [DOI] [PMC free article] [PubMed] [Google Scholar]
- (9).Sandelin A, Alkema W, Engström P, Wasserman WW, and Lenhard B (2004) JASPAR: an open-access database for eukaryotic transcription factor binding profiles. Nucleic acids research 32, D91–D94. [DOI] [PMC free article] [PubMed] [Google Scholar]
- (10).Kulakovskiy IV, Medvedeva YA, Schaefer U, Kasianov AS, Vorontsov IE, Bajic VB, and Makeev VJ (2013) HOCOMOCO: a comprehensive collection of human transcription factor binding sites models. Nucleic Acids Res. 41, D195–D202. [DOI] [PMC free article] [PubMed] [Google Scholar]
- (11).Matys V, Fricke E, Geffers R, Gößling E, Haubrock M, Hehl R, Hornischer K, Karas D, Kel AE, and Kel-Margoulis OV (2003) TRANSFAC®: transcriptional regulation, from patterns to profiles. Nucleic Acids Res. 31, 374–378. [DOI] [PMC free article] [PubMed] [Google Scholar]
- (12).Zhao Y, and Stormo GD (2011) Quantitative analysis demonstrates most transcription factors require only simple models of specificity. Nat. Biotechnol. 29, 480–483. [DOI] [PMC free article] [PubMed] [Google Scholar]
- (13).Seidel HM, Milocco LH, Lamb P, Darnell JE, Stein RB, and Rosen J (1995) Spacing of palindromic half sites as a determinant of selective STAT (signal transducers and activators of transcription) DNA binding and transcriptional activity. Proc. Natl. Acad. Sci. U. S. A. 92, 3041–3045. [DOI] [PMC free article] [PubMed] [Google Scholar]
- (14).Pearce D, Matsui W, Miner JN, and Yamamoto KR (1998) Glucocorticoid receptor transcriptional activity determined by spacing of receptor and nonreceptor DNA sites. J. Biol. Chem. 273, 30081–30085. [DOI] [PubMed] [Google Scholar]
- (15).Umesono K, Murakami KK, Thompson CC, and Evans RM (1991) Direct repeats as selective response elements for the thyroid hormone, retinoic acid, and vitamin D3 receptors. Cell 65, 1255–1266. [DOI] [PMC free article] [PubMed] [Google Scholar]
- (16).Farley EK, Olson KM, Zhang W, Rokhsar DS, and Levine MS (2016) Syntax compensates for poor binding sites to encode tissue specificity of developmental enhancers. Proc. Natl. Acad. Sci. U. S. A. 113, 6508–6513. [DOI] [PMC free article] [PubMed] [Google Scholar]
- (17).Näär AM, Boutin J-M, Lipkin SM, Victor CY, Holloway JM, Glass CK, and Rosenfeld MG (1991) The orientation and spacing of core DNA-binding motifs dictate selective transcriptional responses to three nuclear receptors. Cell 65, 1267–1279. [DOI] [PubMed] [Google Scholar]
- (18).Jolma A, Yin Y, Nitta KR, Dave K, Popov A, Taipale M, Enge M, Kivioja T, Morgunova E, and Taipale J (2015) DNA-dependent formation of transcription factor pairs alters their binding specificity. Nature 527, 384–388. [DOI] [PubMed] [Google Scholar]
- (19).van Dijk D, Sharon E, Lotan-Pompan M, Weinberger A, Segal E, and Carey LB (2017) Large-scale mapping of gene regulatory logic reveals context-dependent repression by transcriptional activators. Genome Res. 27, 87–94. [DOI] [PMC free article] [PubMed] [Google Scholar]
- (20).Patwardhan RP, Lee C, Litvin O, Young DL, Pe’Er D, and Shendure J (2009) High-resolution analysis of DNA regulatory elements by synthetic saturation mutagenesis. Nat. Biotechnol. 27, 1173–1175. [DOI] [PMC free article] [PubMed] [Google Scholar]
- (21).Badis G, Berger MF, Philippakis AA, Talukder S, Gehrke AR, Jaeger SA, Chan ET, Metzler G, Vedenko A, and Chen X (2009) Diversity and complexity in DNA recognition by transcription factors. Science 324, 1720–1723. [DOI] [PMC free article] [PubMed] [Google Scholar]
- (22).Decker JT, Hobson EC, Zhang Y, Shin S, Thomas AL, Jeruss JS, Arnold KB, and Shea LD (2017) Systems analysis of dynamic transcription factor activity identifies targets for treatment in Olaparib resistant cancer cells. Biotechnol. Bioeng. 114, 2085–2095. [DOI] [PMC free article] [PubMed] [Google Scholar]
- (23).Schmid-Burgk JL, Höning K, Ebert TS, and Hornung V (2016) CRISPaint allows modular base-specific gene tagging using a ligase-4-dependent mechanism. Nat. Commun. 7, 12338. [DOI] [PMC free article] [PubMed] [Google Scholar]
- (24).Jolma A, Yan J, Whitington T, Toivonen J, Nitta KR, Rastas P, Morgunova E, Enge M, Taipale M, and Wei G (2013) DNA-binding specificities of human transcription factors. Cell 152, 327–339. [DOI] [PubMed] [Google Scholar]
- (25).Miyoshi H, Blömer U, Takahashi M, Gage FH, and Verma IM (1998) Development of a self-inactivating lentivirus vector. J. Virol. 72, 8150–8157. [DOI] [PMC free article] [PubMed] [Google Scholar]
- (26).Dull T, Zufferey R, Kelly M, Mandel R, Nguyen M, Trono D, and Naldini L (1998) A third-generation lentivirus vector with a conditional packaging system. J. Virol. 72, 8463–8471. [DOI] [PMC free article] [PubMed] [Google Scholar]
- (27).Bellis AD, Peňalver-Bernabé B, Weiss MS, Yarrington ME, Barbolina MV, Pannier AK, Jeruss JS, Broadbelt LJ, and Shea LD (2011) Cellular arrays for large-scale analysis of transcription factor activity. Biotechnol. Bioeng. 108, 395–403. [DOI] [PMC free article] [PubMed] [Google Scholar]
- (28).Smyth GK (2005) Limma: linear models for microarray data, In Bioinformatics and Computational Biology Solutions Using R and Bioconductor, pp 397–420, Springer. [Google Scholar]
- (29).Benjamini Y, and Hochberg Y (1995) Controlling the false discovery rate: a practical and powerful approach to multiple testing. J. R. Stat. Soc., Ser. B Methodol., 289–300. [Google Scholar]
- (30).Bailey TL, Boden M, Buske FA, Frith M, Grant CE, Clementi L, Ren J, Li WW, and Noble WS (2009) MEME SUITE: tools for motif discovery and searching. Nucleic Acids Res. 37, W202–W208. [DOI] [PMC free article] [PubMed] [Google Scholar]
- (31).Zhao Y, Granas D, and Stormo GD (2009) Inferring binding energies from selected binding sites. PLoS Comput. Biol. 5, e1000590. [DOI] [PMC free article] [PubMed] [Google Scholar]
- (32).Rohart F, Gautier B, Singh A, and Le Cao K-A (2017) mixOmics: An R package for ‘omics feature selection and multiple data integration. PLoS Comput. Biol. 13, e1005752. [DOI] [PMC free article] [PubMed] [Google Scholar]
- (33).Mevik B-H, and Wehrens R (2007) The pls package: principal component and partial least squares regression in R. J. Stat. Soft. 18, 1–24. [Google Scholar]
- (34).Siletz A, Schnabel M, Kniazeva E, Schumacher AJ, Shin S, Jeruss JS, and Shea LD (2013) Dynamic transcription factor networks in epithelial-mesenchymal transition in breast cancer models. PLoS One 8, e57180. [DOI] [PMC free article] [PubMed] [Google Scholar]
- (35).Haury A-C, Mordelet F, Vera-Licona P, and Vert J-P (2012) TIGRESS: trustful inference of gene regulation using stability selection. BMC Syst. Biol. 6, 1. [DOI] [PMC free article] [PubMed] [Google Scholar]
- (36).Breiman L (2001) Random forests. Machine learning 45, 5–32. [Google Scholar]
- (37).Margolin AA, Nemenman I, Basso K, Wiggins C, Stolovitzky G, Favera RD, and Califano A (2006) ARACNE: an algorithm for the reconstruction of gene regulatory networks in a mammalian cellular context. BMC Bioinf. 7, S7. [DOI] [PMC free article] [PubMed] [Google Scholar]
- (38).Faith JJ, Hayete B, Thaden JT, Mogno I, Wierzbowski J, Cottarel G, Kasif S, Collins JJ, and Gardner TS (2007) Large-scale mapping and validation of Escherichia coli transcriptional regulation from a compendium of expression profiles. PLoS Biol. 5, e8. [DOI] [PMC free article] [PubMed] [Google Scholar]
- (39).Meyer PE, Kontos K, Lafitte F, and Bontempi G (2007) Information-theoretic inference of large transcriptional regulatory networks. EURASIP J. Bioinf. Syst. Biol. 2007, 8–8. [DOI] [PMC free article] [PubMed] [Google Scholar]
- (40).Csardi G, and Nepusz T (2006) The igraph software package for complex network research. InterJ. Complex Syst. 1695, 1–9. [Google Scholar]
- (41).Attisano L, and Wrana JL (2002) Signal transduction by the TGF-β superfamily. Science 296, 1646–1647. [DOI] [PubMed] [Google Scholar]
- (42).Bouaoun L, Sonkin D, Ardin M, Hollstein M, Byrnes G, Zavadil J, and Olivier M (2016) TP53 variations in human cancers: new lessons from the IARC TP53 database and genomics data. Hum. Mutat. 37, 865–876. [DOI] [PubMed] [Google Scholar]
- (43).Kasai H, Allen JT, Mason RM, Kamimura T, and Zhang Z (2005) TGF-β1 induces human alveolar epithelial to mesenchymal cell transition (EMT). Respir. Res. 6, 56. [DOI] [PMC free article] [PubMed] [Google Scholar]
- (44).Aibar S, González-Blas CB, Moerman T, Imrichova H, Hulselmans G, Rambow F, Marine J-C, Geurts P, Aerts J, and van den Oord J (2017) SCENIC: single-cell regulatory network inference and clustering. Nat. Methods 14, 1083. [DOI] [PMC free article] [PubMed] [Google Scholar]
- (45).Levine AJ, Momand J, and Finlay CA (1991) The p53 tumour suppressor gene. Nature 351, 453–456. [DOI] [PubMed] [Google Scholar]
- (46).Thomas DA, and Massagué J (2005) TGF-β directly targets cytotoxic T cell functions during tumor evasion of immune surveillance. Cancer Cell 8, 369–380. [DOI] [PubMed] [Google Scholar]
- (47).Guo X, and Wang X-F (2009) Signaling cross-talk between TGF-β/BMP and other pathways. Cell Res. 19, 71. [DOI] [PMC free article] [PubMed] [Google Scholar]
- (48).Spies D, and Ciaudo C (2015) Dynamics in transcriptomics: advancements in RNA-seq time course and downstream analysis. Comput. Struct. Biotechnol. J. 13, 469–477. [DOI] [PMC free article] [PubMed] [Google Scholar]
- (49).Chang H, Liu Y, Xue M, Liu H, Du S, Zhang L, and Wang P (2016) Synergistic action of master transcription factors controls epithelial-to-mesenchymal transition. Nucleic Acids Res. 44, 2514–2527. [DOI] [PMC free article] [PubMed] [Google Scholar]
- (50).Kim JH, Jang YS, Eom K-S, Hwang YI, Kang HR, Jang SH, Kim CH, Park YB, Lee MG, and Hyun IG (2007) Transtorming growth factor β1 induces epithelial-to-mesenchymal transition of A549 cells. J. Korean Med. Sci. 22, 898–904. [DOI] [PMC free article] [PubMed] [Google Scholar]
- (51).Willis BC, and Borok Z (2007) TGF-β-induced EMT: mechanisms and implications for fibrotic lung disease. American Journal of Physiology-Lung Cellular and Molecular Physiology 293, L525–L534. [DOI] [PubMed] [Google Scholar]
- (52).Cano A, Pérez-Moreno MA, Rodrigo I, Locascio A, Blanco MJ, del Barrio MG, Portillo F, and Nieto MA (2000) The transcription factor snail controls epithelial–mesenchymal transitions by repressing E-cadherin expression. Nat. Cell Biol. 2, 76. [DOI] [PubMed] [Google Scholar]
- (53).Yang J, Mani SA, Donaher JL, Ramaswamy S, Itzykson RA, Come C, Savagner P, Gitelman I, Richardson A, and Weinberg RA (2004) Twist, a master regulator of morphogenesis, plays an essential role in tumor metastasis. Cell 117, 927–939. [DOI] [PubMed] [Google Scholar]
- (54).Vandewalle C, Comijn J, De Craene B, Vermassen P, Bruyneel E, Andersen H, Tulchinsky E, Van Roy F, and Berx G (2005) SIP1/ZEB2 induces EMT by repressing genes of different epithelial cell–cell junctions. Nucleic Acids Res. 33, 6566–6578. [DOI] [PMC free article] [PubMed] [Google Scholar]
- (55).Mendez MG, Kojima S-I, and Goldman RD (2010) Vimentin induces changes in cell shape, motility, and adhesion during the epithelial to mesenchymal transition. FASEB J. 24, 1838–1851. [DOI] [PMC free article] [PubMed] [Google Scholar]
- (56).Matsuno Y, Coelho AL, Jarai G, Westwick J, and Hogaboam CM (2012) Notch signaling mediates TGF-β1-induced epithelial–mesenchymal transition through the induction of Snai1. Int. J. Biochem. Cell Biol. 44, 776–789. [DOI] [PubMed] [Google Scholar]
Associated Data
This section collects any data citations, data availability statements, or supplementary materials included in this article.