Abstract
Background:
Delirium is one of the most common geriatric syndromes in older patients, accounting for 25% of hospitalized older patients, 31 to 35% of patients in the intensive care unit, and 8% to 17% of older patients in the emergency department (ED). A number of articles have been published in the literature regarding delirium. However, it is unclear about article citations evolving in the field. This study proposed a temporal heatmap (THM) that can be applied to all bibliographical studies for a better understanding of cited articles worth reading.
Methods:
As of November 25, 2022, 11,668 abstracts published on delirium since 2013 were retrieved from the Web of Science core collection. Research achievements were measured using the CJAL score. Social network analysis was applied to examine clusters of keywords associated with core concepts of research. A THM was proposed to detect articles worth reading based on recent citations that are increasing. The 100 top-cited articles related to delirium were displayed on an impact beam plot (IBP).
Results:
The results indicate that the US (12474), Vanderbilt University (US) (634), Anesthesiology (2168), and Alessandro Morandi (Italy) (116) had the highest CJAL scores in countries, institutes, departments, and authors, respectively. Articles worthy of reading were highlighted on a THM and an IBP when an increasing trend of citations over the last 4 years was observed.
Conclusion:
The THM and IBP were proposed to highlight articles worth reading, and we recommend that more future bibliographical studies utilize the 2 visualizations and not restrict them solely to delirium-related articles in the future.
Keywords: academic achievement, CJAL score, delirium, impact beam plot, social network analysis, temporal heatmap, Web of Science
Key points.
-
•
The leading entities were visualized with CJAL scores combined in a 4-quadrant radar plot, which is novel and modern and had never been seen before in bibliographical studies and can shorten article spaces in bibliometrics.
-
•
There is no literature describing how the temporal heatmap can be applied to highlight articles worth reading to replace those solely with 100 top-cited articles without providing prescriptive analytics for readers under the DDPP model.
-
•
Another visualization of the impact beam plot with articles represented by bubbles can be shown on Google Maps and linked to PubMed for immediately reading the article of interest once the bubble is clicked on the impact beam plot, which is rarely seen in traditional bibliographical studies.
1. Introduction
Delirium is a nonspecific, preventable, and reversible cognitive disorder characterized by acute changes in mental state, inattention, and confusion of thinking.[1] It is one of the most common geriatric syndromes in older patients,[2,3] accounting for 25% of hospitalizations among older patients,[1] 31 to 35% of the patients who are admitted to intensive care units,[4] and 8 to 17% of the older patients admitted to the emergency department.[2,3] There is evidence that delirium is associated with increased mortality, longer hospital stays, higher treatment costs, distress for patients following recovery from delirium, and distress for caregivers.[4,5]
1.1. Identifying influential papers via bibliometrics
Over the past few decades, delirium research has made significant progress across the globe. Research on this topic has been reviewed from time to time, with some reviews focusing on the assessment of a variety of topics.[6] In addition to systematic reviews and meta-analyses, bibliometric analyses can also be used to better understand the large volume of data on a particular subject (or topic).[6–10]
The study of bibliometrics aids us in determining the number of publications, types of publications, citation rates, and research output from a particular country, institute, or group of researchers on a particular topic. Furthermore, it is helpful in identifying the research pattern and type of research activity. The method is considered to be appropriate for mapping the science at a time when there is a substantial amount of research on a given topic, but it is still fragmented and controversial.[6,11]
1.2. Descriptive analytics in bibliometrics are inadequate
A variety of methods can be used to analyze data. Bibliometric analysis has rarely been used to analyze the publications in the area of delirium with a comprehensive perspective (e.g., using the DDPP model[12] including descriptive, diagnostic, predictive, and prescriptive analytics). Delirium is an entity that is seen in a variety of medical and surgical specialties.[6] Thus, a comprehensive understanding of the bibliometric analysis using the DDPP model[12] is essential to conducting delirium research, based on a method that depends on the questions we are asking and the information we are seeking from our dataset.
In traditional bibliometrics, using descriptive analytics is sufficient to explain what has occurred.[13] Conversely, diagnostic analytics can assist in determining why it occurred (e.g., classification of author collaborations based on co-word analyses in CiteSpace[14,15] and VOS Viewer[16]). Further, we could use predictive and prescriptive analytics[14] in bibliometrics to answer questions regarding the future and what should be done next for readers.
Therefore, one of this study’s aims is to demonstrate the way of applying the DDPP model to delirium articles with a comprehensive perspective.
1.3. Identifying articles worth reading via prescriptive analytics
There have been numerous studies published on delirium using bibliometric analysis.[6–10,17] It is unclear, however, which articles are worthy of reading for readers based on the trend of article citation over the past 4 years. A sharp rise in 100 top-cited articles has also been observed[18] in the past 10 years (i.e., [18, 12, 11, 24, 29, 37, 57, 80, 90, and 102] by count between 2013 and 2022). In contrast to those research articles examining author contributions based on top-cited articles only,[19] no studies were found using citation trends to select articles that deserve reading.
By utilizing mathematical models and techniques to generate a temporal heatmap (THM), we attempt to provide an efficient way to select articles worth reading rather than traditional temporal bar graphs (TBGs)[20–23] without displaying the trend of article citation over recent years.
1.4. Study aims
Our research goals were to demonstrate the DDPP model with a THM for highlighting articles worth reading. Another impact beam plot (IBP)[24] supplemental to the THM was also developed to display 100 top-cited articles related to delirium (T100delirium).
2. Methods
2.1. Data source
As of September 22, 2022, 11,668 abstracts published on the topic of delirium since 2013 were retrieved from the Web of Science (WoS).[25] This study included only articles and review articles. An extensive collection of metadata was gathered, including author names, research institutes, departments, countries of origin, and article citations.
All data deposited in Supplemental Digital Content S1, http://links.lww.com/MD/I460 are publicly released on WoS without participant identification information. Ethical approval was thus waived.
2.2. Selection of articles on delirium worthy of reading
1.2.2. Part I: Descriptive analytics of the 11,668 articles.
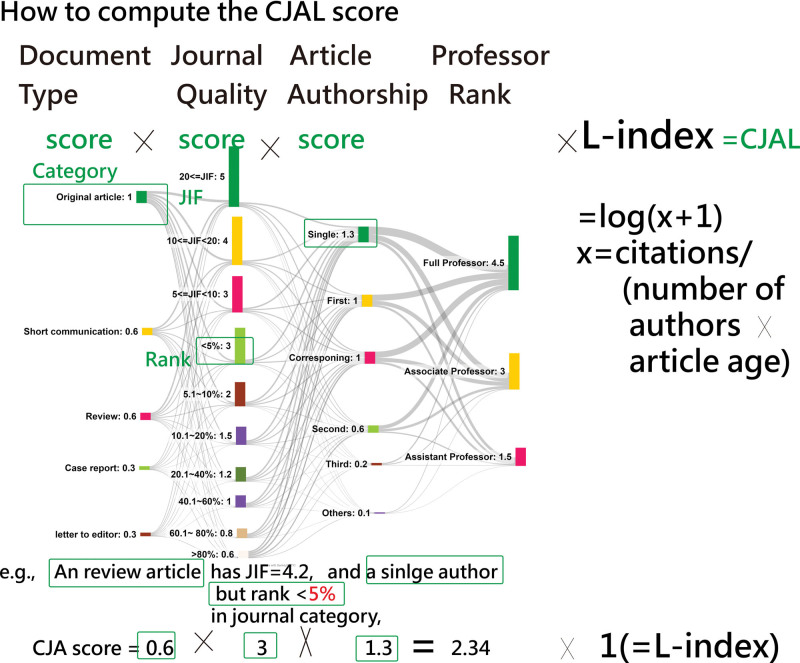
In this section, 4-quadrant radar plots[26] with the CJAL score[26] (combined with CAL score[27] and L-index[28]) were applied to evaluate the research achievements (RAs) of entities, including counties, institutes, departments, and authors. Bubbles were sized by the CJAL score. The way to compute the CJAL score is in Figure 1.[18]
Figure 1.
How to compute the CJAL score. CJAL = .
2.2.2. Part II: Diagnostic analytics using co-word analysis of keywords in T100delirium.
By using social network analysis (SNA),[29,30] co-word analysis was performed to extract the chief components in clusters as themes and leaders. As CiteSpace software[31] merely assigns the most frequently observed keywords to the cluster instead of the chief keywords derived from SNA, the issue of how to label cluster names with chief keywords in clusters becomes a challenge that will be overcome via the steps below:
Step 1: An overview of the T100delirium was made in a list.[32]
Step 2: Keywords with the highest weighted score (i.e., centrality degree in SNA[33]) in the respective cluster using SNA would be assigned as the representative of the cluster (i.e., the chief keyword as the cluster label or theme). Each article can be classified into a theme based on its keywords via Equation 1.[34,35]
| (1) |
where L is the number of keywords in article i. n is the number of keywords denoted by keyword k belonging to the theme defined in SNA. Accordingly, the theme is redirected to the maximal number of keywords (=m) involved in the cluster via equation 1.
Step 3: In the country-based author collaboration networks, the cluster names can be assigned using equation 2[34] based on the themes in the articles.
| (2) |
where L is the number of terms (e.g., country names) in an article. A contingent table with clusters in row (r) and themes in column (j) was built to record the summed counts. The term was matched with the cluster number corresponding to the theme defined in an article (e.g., means the article belongs to a theme) via equation 2. The total weighted scores were summed and selected according to the maximum likelihood method[36] in equation 2.
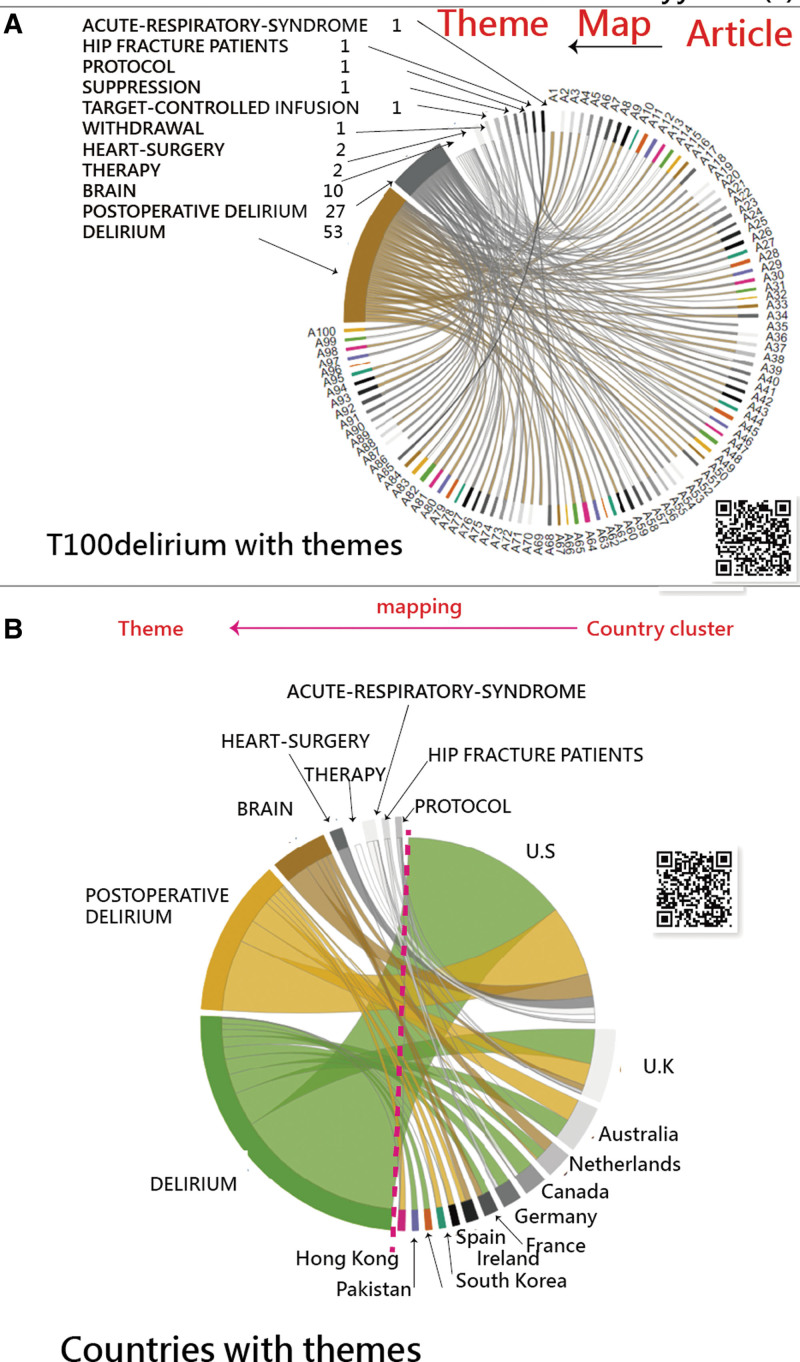
Step 4: Themes were visually assigned to T100delirium, and countries were displayed on chord diagrams.[34,37]
3.2.2. Part III: Predictive analytics in T100delirium.
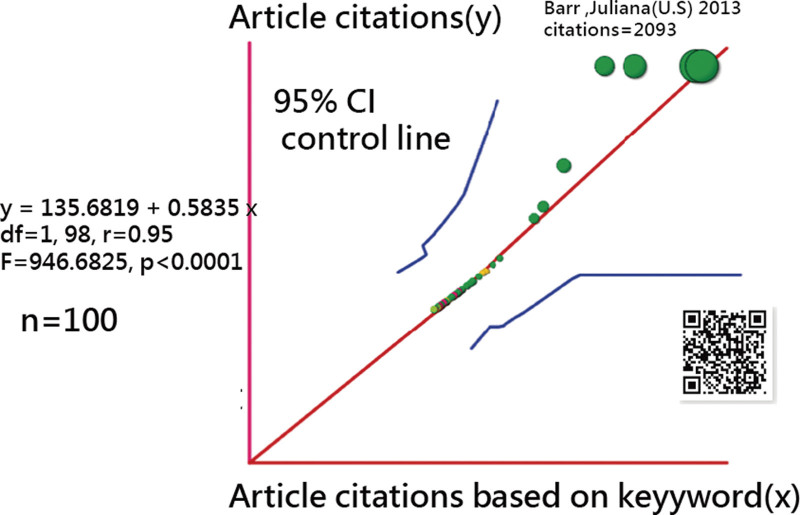
The weighted keyword for each keyword plus in WoS (i.e., the number of citations per article) in the T100delirium articles[32] was computed and used to predict the original article citations.
The weighted mean citation for each term was applied to predict article citations based on the correlation coefficient (CC) in determining the predictive power related to original article citations. The CC t value was calculated using the following formula (=CC [33] A prediction equation was produced through simple regression analysis using MedCalc statistical software, version 9.5.0.0 (MedCalc, New York, NY). A scatter plot was used to display the relationship between weighted mean citations and article citations in T100delirium.
4.2.2. Part IV: Prescriptive analytics in T100delirium.
4.1.2.2. Articles worth reading by observing the THM.
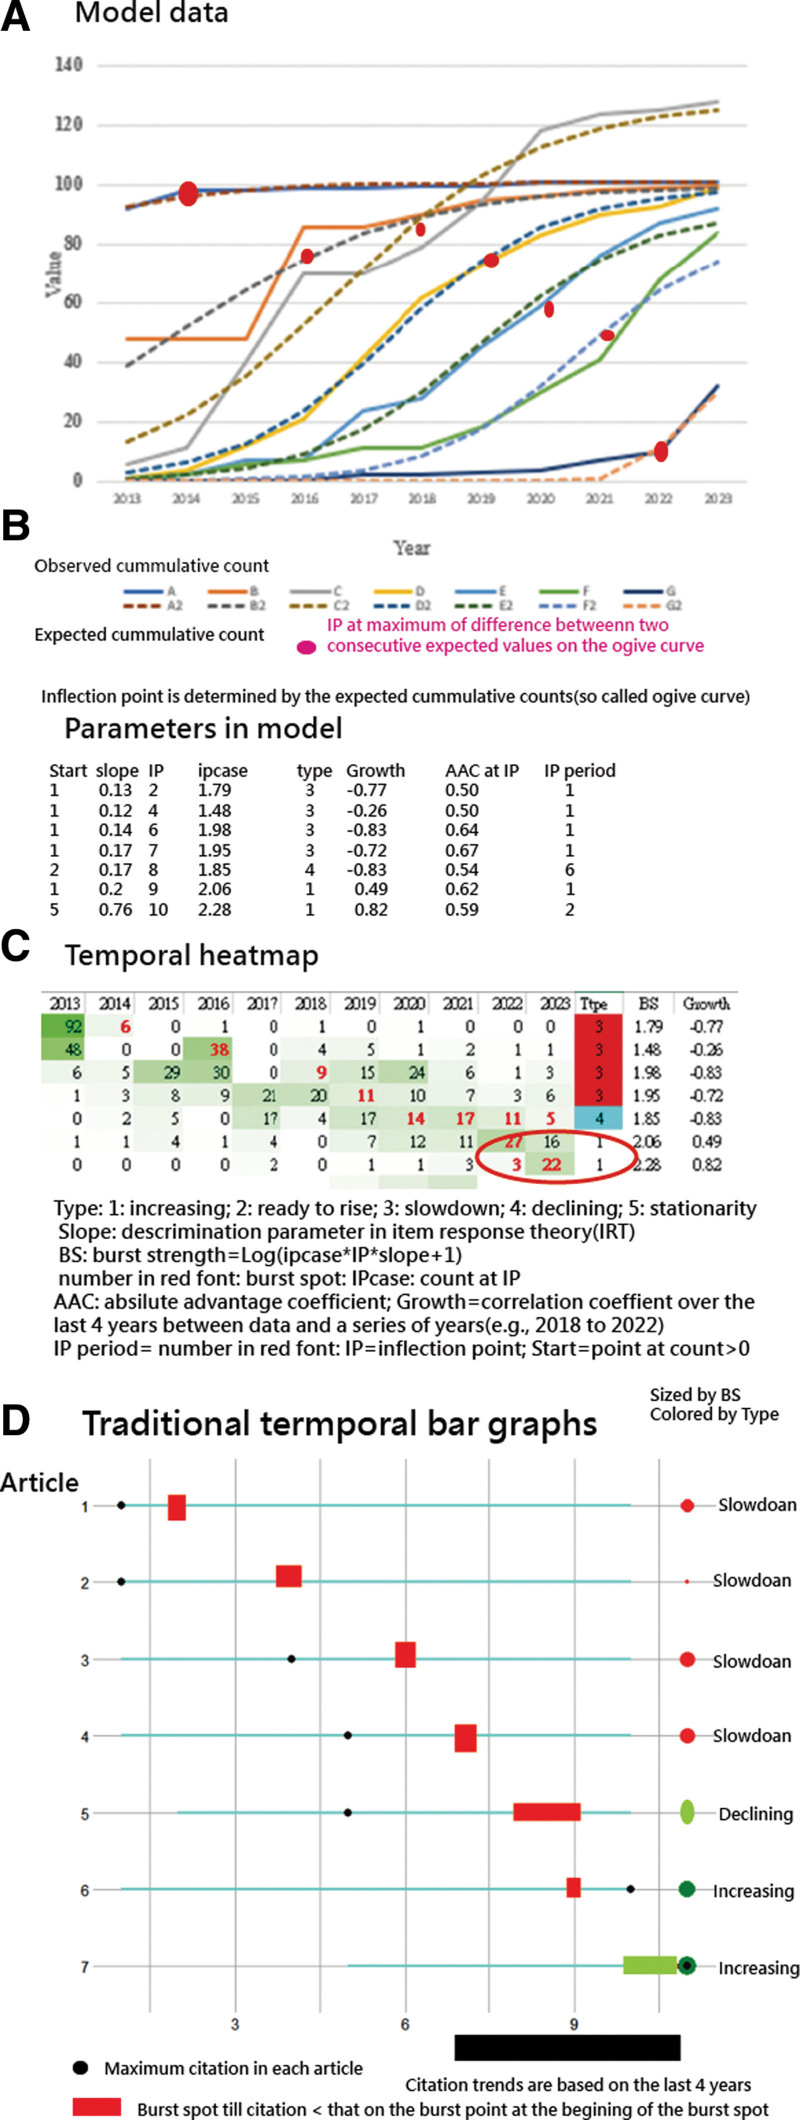
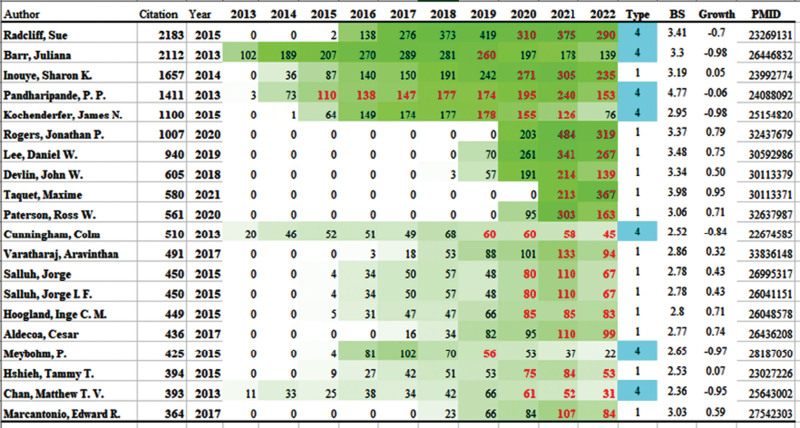
The THM[38] contains 4 dimensions, namely, attributes (e.g., articles or keywords) on the row, years on the column, and color darkened by citation or count, and the burst point starts at the beginning of red font and ends at citations (or counts) smaller than the count at the burst point.[20–23] With the THM, the most worth-reading articles with higher growing citation trends in T100delirium were highlighted by the respective burst strength.[20–23] The trend signals include 5 possible outcomes (e.g., ready to rise, increasing, slow down, declining, and stationarity). The definitions of these trends have been described in the study.[39]
4.2.2.2. Mathematical models applied to THM.
Seven cumulative observed datasets[40,41] are illustrated in Panel A of Figure 2. The inflection points (IPs) on ogive curves can be obtained through the Newton–Raphson Iteration Method[23,42,43] and the link[41] (or with the Solver add-in function in Micro Soft Excel[44–46]). We can see that the IP (or the burst spot) can be obtained along with other statistics in Panel B of Figure 2, including IPcase (namely, burst strength),[20–23] absolute advantage coefficient,[39] growth types,[39] slope parameter based on item response theory,[45,46] and growth based on CC between observed counts and a series of numbers as the string of {1,2,3,4} over the last 4 years. The THM is demonstrated in Panel C of Figure 2 when compared to the traditional TBG[20–23] without providing article citations for readers, as shown in Panel D of Figure 2.
Figure 2.
Mathematical models applied to THM for determining the IP or an ogive curve. IP = inflection point, THM = temporal heatmap.
4.3.2.2. IBP supplemental to THM for readers.
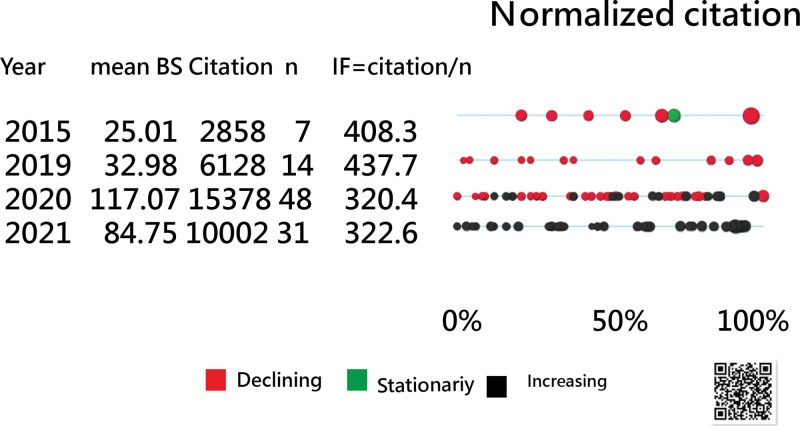
The types of citation trends on T100delirium were displayed on an IBP.[24] All those articles could be linked to PubMed once the dot representing an article in IBP was selected and clicked.
4.2.2.4. Applications of THM in bibliometrics.
Aside from article citation trends, other trends in counts or citations over time, such as keywords, journals, countries of origin, and research institutes, were also demonstrated in T100delirium using THMs.
2.3. Statistics and tools
All graphs were drawn by author-made modules in Excel (Microsoft Corp, Redmond, WA). We created pages of HTML used for Google Maps. All relevant CJAL scores for each element of the article entity on the 4-quadrant radar plot can be linked to dashboards on Google Maps (Alphabet Inc., Mountain View, CA).
3. Results
3.1. Descriptive analytics of the 11,668 articles
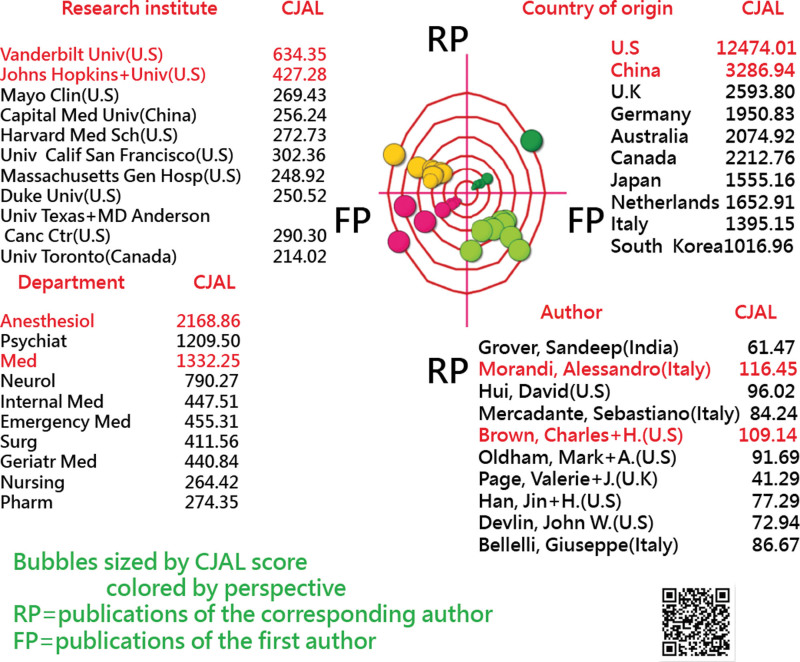
The leading elements in each article entity are the US (12474), Vanderbilt University (US) (634), Anesthesiology (2168), and Akesssabdri Morandi (Italy) (116), with the highest CJAL scores in countries, institutes, departments, and authors, respectively (Fig. 3).
Figure 3.
Four aspects of country, institute, department, and author in comparison of their publications and CJAL scores for the top 10 elements.
3.2. Diagnostic analytics for T100delirium
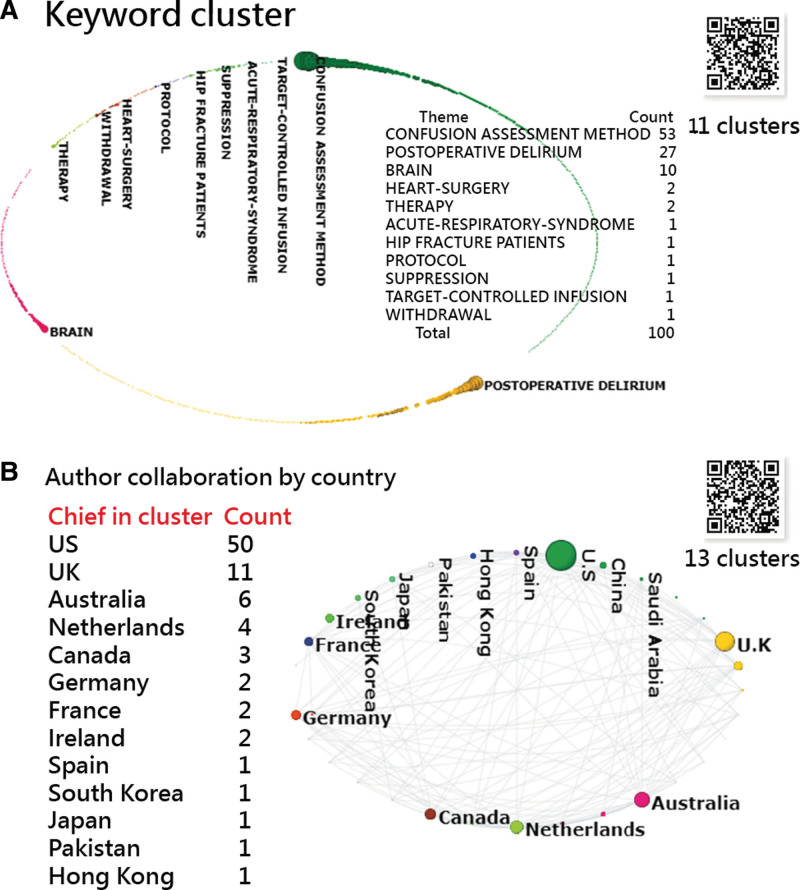
As shown in many bibliometric analyses, the co-word analysis was performed and presented as SNA-circle diagrams in Figure 4, with clusters by color and counts by size. The top and bottom panels of Figure 4 show 11 and 13 clusters, respectively, led by the Confusion Assessment Method and the US in keywords and country-based author collaborations.
Figure 4.
Cluster analyses of keywords and countries of origin in T100 articles using SNA. SNA = social network analysis.
The top panel of Figure 5 illustrates the relationship between articles and themes. Readers are encouraged to scan the QR code and see the details of the relations for each on the dashboard. Colorful curves indicate the type of themes related to the article.
Figure 5.
Article themes assigned to T100 delirium and countries.
The bottom panel of Figure 5 illustrates the relationship between the chief countries in clusters and themes. The left to the right side of the chord diagram indicates that delirium is mostly associated with those clusters in the US, the UK, Canada, Germany, France, and Hong Kong; postoperative delirium with Australia, Spain, and South Korea; and brain with Ireland.
3.3. Predictive analytics for T100delirium
Based on the keyword-weighted citations, keywords are evident in the predictive power of the number of article citations (i.e., R = 0.95, df = 98, t = 30.76, P < .001). The regression equation is defined as article citation (y = 135.68 + 0.5835 × weight (x) of keywords. The slope coefficient was statistically significant (F = 946.68; P < .001), as shown in the top panel of Figure 6.
Figure 6.
Weighted KeyWords Plus to predict article citations, as shown in the scatter chart (note. R = 0.95, df = 98, t = 30.76) based on 100 top-cited articles (n = 100).
3.4. Prescriptive analytics for T100delirium
Figure 7 illustrates the top twenty highly cited articles in T100delirium articles worth reading. There are 13 articles with significantly increasing citations over the last 4 years. It is recommended for articles worth reading. Based on the THM (Fig. 7), 3 articles[47–49] will be abstracted in the Discussion section due to receiving increasing citations since 2019.
Figure 7.
Top 20 highly cited articles in T100 delirium extracted for articles worth reading on the THM. THM = temporal heatmap.
The IBP shown in Figure 8, which includes T100delirium articles, indicates that all those articles with increasing citations over the last 4 years are shown at the bottom of Figure 8, with black bubbles. The article appears on PubMed immediately after clicking the bubble of interest.
Figure 8.
T100delirium articles on the IBP (note. years: burst years). IBP = impact beam plot, T100delirium = 100 top-cited articles related to delirium.
3.5. Applications of THM in bibliometrics
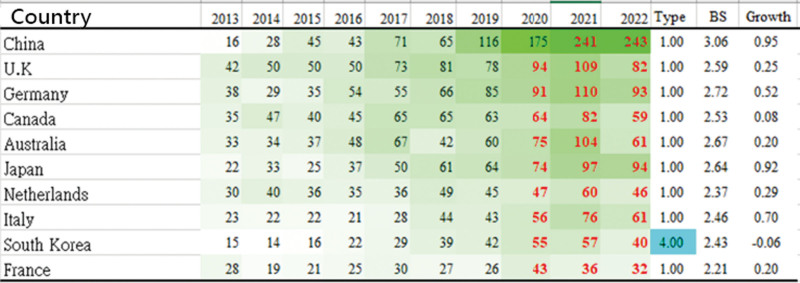
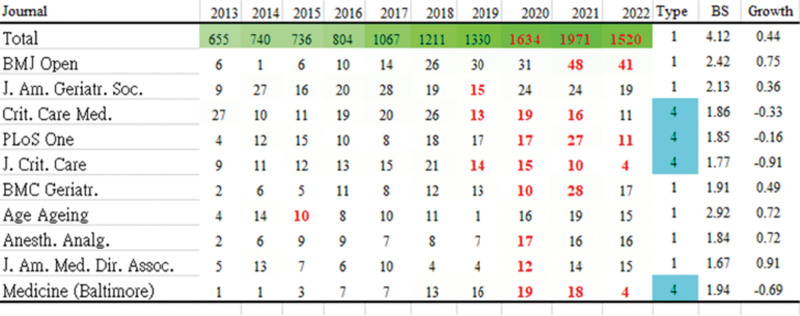
Applications of THM in bibliometrics are demonstrated, including themes derived from SNA in Figure 4, journals, countries of origin, and research institutes. We can see those with increasing trends in Figures 9–12, such as the Confusion Assessment Method, publications related to delirium, the journal of BMJ Open, China, and the Vanderbilt Univ (US).
Figure 9.
Representative keywords in article clusters on THM. THM = temporal heatmap.
Figure 12.
Research institutes in T100delirium articles on THM. T100delirium = 100 top-cited articles related to delirium, THM = temporal heatmap.
Figure 11.
Countries in T100delirium articles on THM. T100delirium = 100 top-cited articles related to delirium, THM = temporal heatmap.
Importantly, the Journal of Medicine (Baltimore) presents a declining trend in articles related to delirium over the last 4 years; see the bottom of Figure 10.
Figure 10.
Journals in T100delirium articles on THM. T100delirium = 100 top-cited articles related to delirium, THM = temporal heatmap.
3.6. Online dashboards shown on Google Maps
All the QR codes in graphs are linked to the dashboards. Readers are suggested to examine the displayed dashboards on Google Maps.
4. Discussion
4.1. Principal findings
The model of DDPP model on T100delirium since 2013 was applied to this study with a comprehensive perspective, and it was found that the THM is viable and useful in bibliometrics.
The results indicate that the US (12474), Vanderbilt University (US) (634), Anesthesiology (2168), and Akesssabdri Morandi (Italy) (116) had the highest CJAL scores in countries, institutes, departments, and authors, respectively. Articles worthy of reading were highlighted on a THM and the IBP when an increasing trend of citations over the last 4 years was observed.
There was a significant correlation between article citations and weighted keywords (F = 946.68; P < .001).
4.2. Articles worth reading using the THM to display
Three categories of bibliometric analysis are frequently mentioned in the literature: DS, significant topics or article types with research domain, and (iii) RAs in entities.[42] Although those (i.e., DS, research domain, and RA) helped us identify the main features that created an enormous distinction within a discipline (or a field/topic) and provided insight for physicians and researchers on the research topic of interest, 2 aspects are frequently ignored due to the lack of predictive and descriptive analytics. The DDPP model was demonstrated in this study, which had been mentioned in the study.[12]
A chord diagram[34,37] provides us with a clear view of the relationship between 2 or more entities (e.g., themes and clusters in Fig. 5, which is rare in bibliometric analysis).
CJAL[18,26] is a unique and practical score. In many medical schools in Taiwan, the minimal requirement for faculty appointment and promotion was claimed using the CJA score,[27] taking 3 factors into consideration (e.g., article category, journal, and authorship), as opposed to bibliometric metrics (such as h-/g-/x-/Y-/IF/hT-/hx-/L-index[28,50–57]) used in research and practice.
It seems likely that delirium research might be conducted by the departments of psychiatry, geriatric medicine, and emergency medicine. Surprisingly, anesthesiology ranked highest in the CJAL score (Fig. 1). The cause of postoperative delirium may be related to the dose of anesthesia drugs given during surgery, which is a common and important complication for older patients.[58,59] For older patients, it is necessary to carefully consider strategies to reduce the dose of anesthetic drugs while maintaining adequate anesthesia.
A growing population of elderly patients poses an increased risk of perioperative complications.[60] Delirium following surgery is a common geriatric complication.[61] The rate varies from 9 to 87%, depending on both the patient population and the degree of operative stress.[62] There is a critical need to recognize and treat delirium, as postoperative delirium is associated with poor outcomes, including functional decline, longer hospital stays, institutionalization, higher costs, and higher mortality.[63] As such, numerous delirium-related studies have been authored by anesthesiology physicians or research fellows.
To date, no studies related to articles worth reading have been discussed in the literature. The THM was demonstrated to display articles worthy of reading, which is clearer and easier for readers at a glance when compared to traditional TBGs.[20–23]
4.3. Articles worth reading on delirium
A study written by Inouye et al and published in 2014 was the most noteworthy article.[47] The article received 1657 citations. The authors stated that delirium is an acute disorder of attention and cognition in elderly people that is common, serious, costly, underrecognized, and often fatal. Nonpharmacological risk factor approaches are the most effective strategy for prevention, and there is no convincing evidence that pharmacological prevention or treatment is effective.
The second article[48] written by Rogers et al and published in 2020 was another noteworthy article with 1007 citations. In this systematic review and meta-analysis, the authors examined the psychiatric and neuropsychiatric presentations of individuals with suspected or laboratory-confirmed coronavirus infection (severe acute respiratory syndrome coronavirus, Middle East respiratory syndrome coronavirus, or severe acute respiratory syndrome coronavirus 2) and excluded studies limited to neurological complications without specified neuropsychiatric presentations. The studies included 3559 coronavirus cases from China, Hong Kong, South Korea, Canada, Saudi Arabia, France, Japan, Singapore, the UK, and the USA. During acute illness, confusion, depressed mood, anxiety, impaired memory, insomnia, and fatigue were common among patients admitted to the hospital for severe acute respiratory syndrome or Middle East respiratory syndrome. In the post-illness stage, depressed mood, insomnia, anxiety, irritability, memory impairment, fatigue, and traumatic memories were also frequently reported. In the post-illness stage, 322% of patients had posttraumatic stress disorder, 149% had depression, and 148% had anxiety disorders. A total of 446 of 580 patients returned to work.
The third article[49] written by Lee et al and published in 2019 was also worth reading, with 940 citations. Chimeric antigen receptor T-cell therapy is rapidly emerging as one of the most promising therapies for hematologic malignancies. Experts from all aspects of the field met in June 2018 to harmonize the definitions and grading systems for cytokine release syndrome and neurotoxicity associated with immune effector cell therapies. They proposed new definitions and grading that are objective, easy to apply, and ultimately more accurately categorize the severity of these toxicities.
4.4. Implications and possible changes outlined in this study
This study has several noteworthy features. First, CJAL scores are superior to those biometric metrics (such as h-/g-/x-/Y-/IF/hT-/hx-/L-index[28,50–57]) because more aspects of the quality and quantity of article features are considered.
The second feature is the use of a 4-quadrant radar plot, which provides readers with a visual representation of 4 perspectives in article entities at a glance, particularly when RAs are indicated by the CJAL score[18,26] rather than the Y-index, as in traditional studies.[55]
Third, the theme classification using SNA is objective and unique when compared to previous studies using manual methods.[64] The evidence suggests that the classification method is valid and worth recommending to future researchers, particularly with the chord diagram to display the relationship between themes and clusters. The R codes for drawing the chord diagram are provided in Supplemental Digital Content S2, http://links.lww.com/MD/I461.
Finally, the THM was applied to display articles worth reading on delirium that had not previously been found in the literature and that should be considered for future bibliographical studies.
4.5. Limitations and suggestions
Further research should examine a number of issues. The first concern is that the software used to draw the chord diagrams is not unique and irreplaceable. Several other software packages make it easy to draw them.
Second, Google Maps is used to display dashboards in this study. Due to Google Maps’ requirement for a paid project key, these installments are not free of charge. Consequently, other authors may have difficulty replicating the usage within a short period of time.
Third, this study requires considerable computation to calculate the CJAL score.[18,26] In the future, dedicated software will be required for development.
Fourth, although the radar plot combined with the CJAL score[18,26] was recommended to simplify article spaces when compared to other traditional bibliographical studies with many tables and graphs, the RAs are determined by many other factors that should be considered when drawing the radar plot in the future.
Fifth, it is recommended that more appropriate visual displays be used for a better understanding of study trends using the THM. Several other software packages make it easy to draw the THM, but the premise is that the bust spots and IPs should be determined using a mathematical algorithm, as we described in Section 2.2.4.2.
Finally, although T100delirium articles were extracted mainly from WoS, the results were different in articles retrieved from other databases (e.g., Google Scholar, Scopus, and PubMed). Future studies are required to extract T100delirium from more bibliometric databases.
5. Conclusion
Through the analysis of the network characteristics found in T100100delirium, a breakthrough was achieved, which included a total of 11,668 articles instead of only the 100 top-cited articles. Keywords Plus can be used to identify article themes and predict T100delirium citations. The THM was applied to display delirium-related articles worth reading, which could be considered for future bibliographical studies, particularly on 100 top-cited articles with a comprehensive perspective using the DDPP model.
Acknowledgments
We thank Enago (www.enago.tw) for the English language review of this manuscript.
Author contributions
Conceptualization: Sam Yu-Chieh Ho.
Methodology: Tsair-Wei Chien.
Formal analysis: Kang-Ting Tsai.
Investigation: Willy Chou.
Supplementary Material
Abbreviations:
- CC
- correlation coefficient
- IBP
- impact beam plot
- IP
- inflection point
- RA
- research achievement
- SNA
- social network analysis
- T100delirium
- 100 top-cited articles related to delirium
- TBG
- temporal bar graph
- THM
- temporal heatmap
- WoS
- Web of Science
The authors have no funding to disclose.
All data were downloaded from the PubMed database at pubmed.com.
The datasets generated during and/or analyzed during the current study are publicly available.
The authors have no conflicts of interest to disclose.
Supplemental Digital Content is available for this article.
How to cite this article: Ho SY-C, Chien T-W, Tsai K-T, Chou W. Analysis of citation trends to identify articles on delirium worth reading using DDPP model with temporal heatmaps (THM): A bibliometric analysis. Medicine 2023;102:8(e32955).
Contributor Information
Sam Yu-Chieh Ho, Email: t20317@hotmail.com.
Tsair-Wei Chien, Email: smile@mail.chimei.org.tw.
Kang-Ting Tsai, Email: irised57@yahoo.com.tw.
References
- [1].Oh ES, Fong TG, Hshieh TT, et al. Delirium in older persons: advances in diagnosis and treatment. JAMA. 2017;318:1161–74. [DOI] [PMC free article] [PubMed] [Google Scholar]
- [2].Geriatric emergency department guidelines task F: geriatric emergency department guidelines. Ann Emerg Med. 2014;63:e7–25. [DOI] [PubMed] [Google Scholar]
- [3].Ke YT, Peng AC, Shu YM, et al. Prevalence of geriatric syndromes and the need for hospice care in older patients of the emergency department: a study in an Asian medical center. Emerg Med Int. 2020;2020:7174695. [DOI] [PMC free article] [PubMed] [Google Scholar]
- [4].Maldonado JR. Acute brain failure: pathophysiology, diagnosis, management, and sequelae of delirium. Crit Care Clin. 2017;33:461–519. [DOI] [PubMed] [Google Scholar]
- [5].Finucane AM, Lugton J, Kennedy C, et al. The experiences of caregivers of patients with delirium, and their role in its management in palliative care settings: an integrative literature review. Psychooncology. 2017;26:291–300. [DOI] [PMC free article] [PubMed] [Google Scholar]
- [6].Mussi C, Palazzi C, Pasqualini R, et al. Impact factor of medical journals: problems in geriatrics. Aging Clin Exp Res. 2002;14:64–8. [DOI] [PubMed] [Google Scholar]
- [7].McCoy TH, Jr. Mapping the delirium literature through probabilistic topic modeling and network analysis: a computational scoping review. Psychosomatics. 2019;60:105–20. [DOI] [PubMed] [Google Scholar]
- [8].Khoujah D, Cimino-Fiallos N. The geriatric emergency literature 2019. Am J Emerg Med. 2020;38:1834–40. [DOI] [PubMed] [Google Scholar]
- [9].Grover S, Gupta BM. A scientometric study of publications on delirium from 2001 to 2020. Asian J Psychiatr. 2021;66:102889. [DOI] [PubMed] [Google Scholar]
- [10].Chen Q, Wang Y, Song S, et al. Global research trends in perioperative care for the elderly: a bibliometric and visualized study. J Anesth. 2022;36:210–20. [DOI] [PubMed] [Google Scholar]
- [11].Yao X, Yan J, Ginda M, et al. Mapping longitudinal scientific progress, collaboration and impact of the Alzheimer’s disease neuroimaging initiative. PLoS One. 2017;12:e0186095e0186095. [DOI] [PMC free article] [PubMed] [Google Scholar]
- [12].Hung CC, Tu MY, Chien TW, et al. The model of descriptive, diagnostic, predictive, and prescriptive analytics on 100 top-cited articles of nasopharyngeal carcinoma from 2013 to 2022: bibliometric analysis. Medicine. 2023;102:6(e32824). [DOI] [PMC free article] [PubMed] [Google Scholar]
- [13].Wolvius C. Predict the future, understand the past: the four types of data analysis. Available at: https://datajourney.akvo.org/blog/the-fourtypes-of-data-analysis [access date December 3, 2022].
- [14].Chen C. Searching for intellectual turning points: progressive knowledge domain visualization. Proc National Acad Sci United States Am (PNAS). 2004;101(suppl. 1):5303–10. [DOI] [PMC free article] [PubMed] [Google Scholar]
- [15].Chen C. CiteSpace II: detecting and visualizing emerging trends and transient patterns in scientific literature. J Am Soc Inf Sci Technol. 2006;57:359–77. [Google Scholar]
- [16].van Eck NJ, Waltman L. Software survey: vosviewer, a computer program for bibliometric mapping. Scientometrics. 2010;84:523–38. [DOI] [PMC free article] [PubMed] [Google Scholar]
- [17].Fei X, Zeng Q, Wang J, et al. Bibliometric analysis of 100 most-cited articles in delirium. Front Psychiatry. 2022;13:931632. [DOI] [PMC free article] [PubMed] [Google Scholar]
- [18].Tam HP, Hsieh WT, Chien TW, et al. A leading bibliometric author does not have a dominant contribution to research based on the CJAL score: Bibliometric analysis. Medicine (Baltim). 2023;102:e32609. [DOI] [PMC free article] [PubMed] [Google Scholar]
- [19].Pubmed. Over 400 articles with the title of 100 top-cited in PubMed. Available at: https://pubmed.ncbi.nlm.nih.gov/?term=100%5Btitle%5D%20and%20cited%5Btitle%5D&sort=date&timeline=expanded [access date January 21, 2022].
- [20].Chow JC, Chien TW, Chou W. Suggestions to the article: demonstrating the ascendancy of COVID-19 research using acronyms. Scientometrics. 2022;127:2897–9. [DOI] [PMC free article] [PubMed] [Google Scholar]
- [21].Ho SY, Chien TW, Shao Y, et al. Visualizing the features of inflection point shown on a temporal bar graph using the data of COVID-19 pandemic. Medicine (Baltim). 2022;101:e28749. [DOI] [PMC free article] [PubMed] [Google Scholar]
- [22].Shen L, Xiong B, Li W, et al. Visualizing collaboration characteristics and topic burst on international mobile health research: bibliometric analysis. JMIR Mhealth Uhealth. 2018;6:e135. [DOI] [PMC free article] [PubMed] [Google Scholar]
- [23].Hsu SY, Chien TW, Yeh YT, et al. Citation trends in ophthalmology articles and keywords in mainland China, Hong Kong, and Taiwan since 2013 using temporal bar graphs (TBGs): Bibliometric analysis. Medicine (Baltim). 2022;101:e32392e32392. [DOI] [PMC free article] [PubMed] [Google Scholar]
- [24].Author impact beam plots in Web of Science author records. Available at: https://www.youtube.com/watch?v=dcXgx5wxUp4 [access date December 3, 2022].
- [25].Birkle C, Pendlebury DA, Schnell J, et al. Web of Science as a data source for research on scientific and scholarly activity. Quant Sci Stud. 2020;1:363–76. [Google Scholar]
- [26].Shao Y, Chien TW, Jang FL. The use of radar plots with the Yk-index to identify which authors contributed the most to the journal of Medicine in 2020 and 2021: a bibliometric analysis. Medicine (Baltim). 2022;101:e31033e31033. [DOI] [PMC free article] [PubMed] [Google Scholar]
- [27].Yeh JT, Shulruf B, Lee HC, et al. Faculty appointment and promotion in Taiwan’s medical schools, a systematic analysis. BMC Med Educ. 2022;22:356. [DOI] [PMC free article] [PubMed] [Google Scholar]
- [28].Belikov AV, Belikov VV. A citation-based, author- and age-normalized, logarithmic index for evaluation of individual researchers independently of publication counts. F1000Research. 2015;4:884.. Available at: 10.12688/f1000research.7070.1 [access date November 24, 2022]. [DOI] [Google Scholar]
- [29].Yie KY, Chien TW, Yeh YT, et al. Using social network analysis to identify spatiotemporal spread patterns of COVID-19 around the world: online dashboard development. Int J Environ Res Public Health. 2021;18:2461. [DOI] [PMC free article] [PubMed] [Google Scholar]
- [30].Kan WC, Chou W, Chien TW, et al. The most-cited authors who published papers in JMIR mHealth and uHealth using the authorship-weighted scheme: bibliometric analysis. JMIR Mhealth Uhealth. 2020;8:e11567. [DOI] [PMC free article] [PubMed] [Google Scholar]
- [31].Chen C, Hu Z, Liu S, et al. Emerging trends in regenerative medicine: a scientometric analysis in Citespace. Expert Opin Biol Ther. 2012;12:593–608. [DOI] [PubMed] [Google Scholar]
- [32].Chien TW. 100 top-cited articles in this study. Available at: http://www.healthup.org.tw/html100/delirium100.htm [access date October 4, 2022].
- [33].Chen CH, Chien TW, Yu-Chieh Ho S, et al. Predicting article citations using data from 100 top-cited publications in the field of Psoriasis Vulgaris and biological agents (PVBA) since 1991: a bibliometric analysis. Medicine (Baltim). 2022;101:e29396e29396. [DOI] [PMC free article] [PubMed] [Google Scholar]
- [34].Huang YP, Pao JL, Chien TW, et al. Thematic analysis of articles on artificial intelligence with spine trauma, vertebral metastasis, and osteoporosis using chord diagrams: a systematic review and meta-analysis. Medicine. 2022;101:e32369. [DOI] [PMC free article] [PubMed] [Google Scholar]
- [35].Chou PH, Lin JCJ, Chien TW. Using text mining and forest plots to identify similarities and differences between two spine-related journals based on medical subject headings (MeSH terms) and author-specified keywords in 100 top-cited articles. Scientometrics. 2023;128:1–17. [Google Scholar]
- [36].Jan de L, Norman D. Maximum likelihood estimation in generalized Rasch models. J Educ Behav Stat. 1986;11:183–96. [Google Scholar]
- [37].Finnegan A, Sao SS, Huchko MJ. Using a chord diagram to visualize dynamics in contraceptive use: bringing data into practice. Glob Health Sci Pract. 2019;7:598–605. [DOI] [PMC free article] [PubMed] [Google Scholar]
- [38].Cho H, Nishimura K, Watanabe K, et al. Effective pseudolabeling based on heatmap for unsupervised domain adaptation in cell detection. Med Image Anal. 2022;79:102436. [DOI] [PubMed] [Google Scholar]
- [39].Yang DH, Chien TW, Yeh YT, et al. Using the absolute advantage coefficient (AAC) to measure the strength of damage hit by COVID-19 in India on a growth-share matrix. Eur J Med Res. 2021;26:61. [DOI] [PMC free article] [PubMed] [Google Scholar]
- [40].Embretson SE, Reise SP. Item response theory for psychologists (1st Edition). Mahwah, NJ: Lawrence Erlbaum. 2000:44. [Google Scholar]
- [41].Wu JW, Yan YH, Chien TW, et al. Trend and prediction of citations on the topic of neuromuscular junctions in 100 top-cited articles since 2001 using a temporal bar graph: a bibliometric analysis. Medicine (Baltim). 2022;101:e30674e30674. [DOI] [PMC free article] [PubMed] [Google Scholar]
- [42].Linacre JM. Percentages with continuous rasch models. Rasch Meas Trans. 2001;14:771–4. [Google Scholar]
- [43].Shao Y, Nadkarni S, Niu N, et al. A note on the newton–raphson iteration method in the Rasch model. Rasch Meas Trans. 2022;35:1851–6. [Google Scholar]
- [44].Chien TW. How to determine the inflection point on a given ogive curve. Available at: http://www.healthup.org.tw/studioclassroom.asp [access date November 24, 2022].
- [45].Wang LY, Chien TW, Chou W. Using the IPcase index with inflection points and the corresponding case numbers to identify the impact hit by COVID-19 in China: an observation study. Int J Environ Res Public Health. 2021;18:1994. [DOI] [PMC free article] [PubMed] [Google Scholar]
- [46].Tsai KT, Chien TW, Lin JK, et al. Comparison of prediction accuracies between mathematical models to make projections of confirmed cases during the COVID-19 pandamic by country/region. Medicine (Baltim). 2021;100:e28134e28134. [DOI] [PMC free article] [PubMed] [Google Scholar]
- [47].Inouye SK, Westendorp RG, Saczynski JS. Delirium in elderly people. Lancet. 2014;383:911–22. [DOI] [PMC free article] [PubMed] [Google Scholar]
- [48].Rogers JP, Chesney E, Oliver D, et al. Psychiatric and neuropsychiatric presentations associated with severe coronavirus infections: a systematic review and meta-analysis with comparison to the COVID-19 pandemic. Lancet Psychiatry. 2020;7:611–27. [DOI] [PMC free article] [PubMed] [Google Scholar]
- [49].Lee DW, Santomasso BD, Locke FL, et al. ASTCT consensus grading for cytokine release syndrome and neurologic toxicity associated with immune effector cells. Biol Blood Marrow Transplant. 2019;25:625–38. [DOI] [PMC free article] [PubMed] [Google Scholar]
- [50].Hirsch JE. An index to quantify an individual’s scientific research output. Proc Natl Acad Sci USA. 2005;102:16569–72. [DOI] [PMC free article] [PubMed] [Google Scholar]
- [51].Egghe L. Theory and practice of the g-index. Scientometrics. 2006;69:131–52. [Google Scholar]
- [52].Fenner T, Harris M, Levene M, et al. A novel bibliometric index with a simple geometric interpretation. PLoS One. 2018;13:e0200098. [DOI] [PMC free article] [PubMed] [Google Scholar]
- [53].Yeh YT, Chien TW, Kan WC, et al. The Use of hx-index to compare research achievements for ophthalmology authors in Mainland China, Hong Kong, and Taiwan since 2010. Medicine (Baltim). 2021;100:e24868. [DOI] [PMC free article] [PubMed] [Google Scholar]
- [54].Pan RK, Fortunato S. Author impact factor: tracking the dynamics of individual scientific impact. Sci Rep. 2014;4:4880. [DOI] [PMC free article] [PubMed] [Google Scholar]
- [55].Ho YS. Top-cited articles in chemical engineering in science citation index expanded: a bibliometric analysis. Chin J Chem Eng. 2012;20:478–88. [Google Scholar]
- [56].Anderson TR, Hankin RKS, Killworth PD. Beyond the Durfee square: enhancing the h-index to score total publication output. Scientometrics. 2008;76:577–88. [Google Scholar]
- [57].Hua PH, Wan JK, Wu JH. A perfect Hirsch-type index? Experiences using the Tapered h-Index (hT). Chin J Sci Tech Periodicals. 2010;21:33–7. [Google Scholar]
- [58].Abbott TEF, Pearse RM. Depth of anesthesia and postoperative delirium. JAMA. 2019;321:459–60. [DOI] [PubMed] [Google Scholar]
- [59].Robinson TN, Eiseman B. Postoperative delirium in elderly individuals: diagnosis and management. Clin Interv Aging. 2008;3:351–5. [DOI] [PMC free article] [PubMed] [Google Scholar]
- [60].Etzioni DA, Liu JH, Maggard MA, et al. The aging population and its impact on the surgery workforce. Ann Surg. 2003;238:170–7. [DOI] [PMC free article] [PubMed] [Google Scholar]
- [61].Inouye SK, Bogardus ST, Jr, Charpentier PA, et al. A multicomponent intervention to prevent delirium in hospitalized older patients. N Engl J Med. 1999;340:669–76. [DOI] [PubMed] [Google Scholar]
- [62].Demeure MJ, Fain MJ. The elderly surgical patient and postoperative delirium [published correction appears in J Am Coll Surg. 2007 Jan;204(1):191]. J Am Coll Surg. 2006;203:752–7. [DOI] [PubMed] [Google Scholar]
- [63].Dasgupta M, Dumbrell AC. Preoperative risk assessment for delirium after noncardiac surgery: a systematic review. J Am Geriatr Soc. 2006;54:1578–89. [DOI] [PubMed] [Google Scholar]
- [64].Liu PC, Lu Y, Lin HH, et al. Classification and citation analysis of the 100 top-cited articles on adult spinal deformity since 2011: a bibliometric analysis. J Chin Med Assoc. 2022;85:401–8. [DOI] [PubMed] [Google Scholar]
Associated Data
This section collects any data citations, data availability statements, or supplementary materials included in this article.


