

Abstract
During aging, the brain is subject to greater oxidative stress (OS), which is thought to play a critical role in cognitive impairment. Glutathione (GSH), as a major antioxidant in the brain, can be used to combat OS. However, how brain GSH levels vary with age and their associations with cognitive function is unclear. In this study, we combined point-resolved spectroscopy and edited spectroscopy sequences to investigate extended and closed forms GSH levels in the anterior cingulate cortex (ACC), posterior cingulate cortex (PCC), and occipital cortex (OC) of 276 healthy participants (extended form, 166 females, age range 20–70 years) and 15 healthy participants (closed form, 7 females, age range 26–56 years), and examined their relationships with age and cognitive function. The results revealed decreased extended form GSH levels with age in the PCC among 276 participants. Notably, the timecourse of extended form GSH level changes in the PCC and ACC differed between males and females. Additionally, positive correlations were observed between extended form GSH levels in the PCC and OC and visuospatial memory. Additionally, a decreased trend of closed form GSH levels with age was also observed in the PCC among 15 participants. Taken together, these findings enhance our understanding of the brain both closed and extended form GSH time course during normal aging and associations with sex and memory, which is an essential first step for understanding the neurochemical underpinnings of healthy aging.
Keywords: GSH, Brain aging, Cognitive impairment, Visuospatial memory
1. Introduction
Glutathione (GSH) is a tripeptide consisting of glycine, glutamate, and cysteine present in almost all cells. In addition to having roles in numerous physiological functions, GSH is an important antioxidant for antioxidant defense (Wu et al., 2004). Several studies have suggested that low levels of reactive oxygen species (ROS) contribute to maintaining normal cellular function. However, accumulation of ROS causes oxidative stress (OS), resulting in lipid peroxidation, protein oxidation, and DNA damage that ultimately impair cellular function (Dasari et al., 2017). The brain is particularly susceptible to OS, as it consumes 20 % of the body’s oxygen despite accounting for only 2 % of total body mass (Aiello and Wheeler, 1995). Despite awareness of the crucial role of GSH, how GSH levels in the brain change with age remains unclear.
The majority of rodent model studies suggest that GSH levels in the brain decrease with age (Maher, 2005). In contrast, human cadaver studies have shown no relationship between brain GSH levels and age in the frontal cortex and cerebellum (Venkateshappa et al., 2012), and GSH levels increase with age in the caudate, frontal cortex, and cerebellar cortex (Tong et al., 2016). Though, postmortem breakdown of GSH complicates interpretation of such findings (Perry et al., 1981). Nuclear magnetic resonance (NMR) analyses of GSH solutions were conducted under both anaerobic (2.80 ppm) (Delalande et al., 2010; Duddeck et al., 2013) and aerobic conditions (2.95 ppm) (Govindaraju et al., 2000; Kato et al., 1999; Kennett et al., 2005). Based on the chemical shift analysis, it was first hypothesized the existence of two forms of GSH (extended and closed (folded) conformation by the researchers (Mandal et al., 2017). These analyses revealed chemical shift signals corresponding to both the closed and extended forms of GSH’s Cys β-CH2.
Magnetic resonance spectroscopy (MRS) is a noninvasive technique that can detect metabolite levels in the brain in both closed and extended forms GSH (Mandal et al., 2023; Shukla et al., 2018). Spectral editing techniques, such as Hadamard Encoding and Reconstruction of MEGA-Edited Spectroscopy (HERMES) (Song et al., 2022), can be used to separate GSH resonance from overlapping metabolite resonances. Reproducible quantification of GSH can be achieved without the use of spectral editing techniques, such as Point RESolved Spectroscopy (PRESS) with a short echo time (Wijtenburg et al., 2019). However, only a few studies have examined the relationships between age and brain GSH levels in healthy participants using MRS and their findings have been inconsistent. For example, no relationship was found between age and GSH levels in the anterior cingulate cortex (ACC) in a pediatric sample (age 5.6–13.9 years) (Saleh et al., 2020). In studies of adults, older adults showed decreased occipital GSH levels (Emir et al., 2011) and increased medial frontal and sensorimotor GSH levels (Hupfeld et al., 2021) compared to younger adults. The regional specificity of brain GSH (Sanaei Nezhad et al., 2017) and the relatively small sample sizes of prior studies are potential reasons for these inconsistent results. Furthermore, a multicenter investigation involving a cohort of healthy individuals validated the effectiveness of MEshcher–Garwood Point RESolved Spectroscopy (MEGA-PRESS) in detecting both closed and extended form GSH (Shukla et al., 2018).
In contrast, it is well established that OS increases with age and can lead to cognitive impairment (Ionescu-Tucker and Cotman, 2021), with OS playing an important role in Alzheimer’s disease (AD) onset and progression (Markesbery, 1997; Saharan and Mandal, 2014). Some MRS studies suggest that decreased posterior cingulate cortex (PCC) and hippocampal GSH levels are correlated with cognitive decline in patients with mild cognitive impairment (Duffy et al., 2014; Oeltzschner et al., 2019) and AD (Mandal et al., 2015). Notably, brain aging and AD share common clinical and neuropathological features as well as similar etiologies and pathogenesis (Yie et al., 2002). However, relationships between brain GSH levels, which are representative of OS, and cognitive function, have not been found in healthy participants (Emir et al., 2011; Hupfeld et al., 2021). Additionally, it is known that markers of OS in the brain, such as lipoperoxidation, are higher in male brains than female brains (Ruszkiewicz et al., 2019; Sumien et al., 2021). However, the effect of biological sex on the relationship between GSH levels and cognitive function has not been previously explored.
To explore the interactive relationships among brain OS, age, sex, and cognitive function, this study used HERMES, MEGA-PRESS and PRESS to measure brain GSH levels in a large, healthy cohort and their cognitive function was assessed. The brain regions of interest were the ACC, which has a key role in supporting cognitive control (Gasquoine, 2013); the PCC, which plays a significant role in spatial cognition, memory, attention, and keeping the balance between internal and external thought (Leech and Sharp, 2014); and the occipital cortex (OC), which is involved in visuospatial processing (Rehman and Al Khalili, 2019). Our hypotheses included: (1) GSH levels in the brain decrease with normal aging; (2) brain GSH levels are associated with cognitive function; and (3) brain region and sex influence the relationship between GSH levels and age or cognitive function.
2. Materials and methods
2.1. Participants
A total of 276 healthy participants (110 males and 166 females, age range 20–70 years, mean ± standard deviation = 43.63 ± 11.94 years) were recruited for this study (Table 1). All participants were of Han Chinese ethnicity, Mandarin speakers, and right-handed. The exclusion criteria were neurological or psychiatric diseases, a history of drug and alcohol abuse, contraindications for magnetic resonance imaging (MRI), and claustrophobia. This study was approved by the Shandong First Medical University Institutional Review Board (approval no. 2019–056). All participants provided written informed consent.
Table 1.
Demographics.
| Variables | Overall (N = 276) | Female (N = 166) | Male (N = 110) |
|---|---|---|---|
| aAge (years) | 43.63 (11.94) | 45.05 (11.91) | 41.48 (11.72) |
| bEducation (n,%) | |||
| Illiteracy | 2 (0.7) | 2 (1.2) | 0 (0.0) |
| Primary | 18 (6.5) | 12 (7.2) | 6 (5.5) |
| Junior | 33 (12.0) | 20 (12.0) | 13 (11.8) |
| High | 39 (14.1) | 26 (15.7) | 13 (11.8) |
| AA | 41 (14.9) | 26 (15.7) | 15 (13.6) |
| College | 7 (2.5) | 5 (3.0) | 2 (1.8) |
| Bachelor | 84 (30.4) | 46 (27.7) | 38 (34.5) |
| Master | 52 (18.8) | 29 (17.5) | 23 (20.9) |
| aCognitive function score | |||
| MoCA | 27.62 (2.66) | 27.86 (2.17) | 27.47 (2.94) |
| AVLT | 56.04 (13.60) | 56.62 (13.74) | 55.66 (13.54) |
| SDMT | 50.22 (15.17) | 51.26 (14.41) | 49.54 (15.66) |
| RCFT | 77.24 (25.83) | 80.03 (22.55) | 75.39 (27.70) |
| Stroop | 121.06 (28.73) | 121.20 (29.03) | 120.97 (28.62) |
Mean and standard deviation (SD) are shown for continuous variables.
Frequencies and percentage are shown for categorical variables. Shapiro-Wilk test shows that age and all the cognitive function score are normally distributed.
AA, Associate of Arts; MoCA, Montreal Cognitive Assessment; AVLT, Auditory Verbal Learning Test; SDMT, Symbol Digit Modalities Test; RCFT, Rey Complex Figure Test and Recognition Trial; Stroop, Stroop Test.
2.2. Neuropsychological assessment
All participants completed a comprehensive neuropsychological assessment taking approximately 1 h. Tests were administered in the following order: The Montreal Cognitive Assessment (MoCA) (Nasreddine et al., 2005) was used to assess overall cognitive function. Auditory learning and memory were assessed using the Auditory Verbal Learning Test - Chinese version (ALVT) (Zhao et al., 2012), attention was assessed using the Symbol Digit Modalities Test (SDMT) (Van Schependom et al., 2014), working memory was assessed using the Stroop Color-Word Interference Test (Stroop) (Periáñez et al., 2021), and visuospatial memory was assessed using the Rey-Osterrieth Complex Figure Test (RCFT) (Shin et al., 2006).
2.3. MR protocol
All participants were scanned using a 3.0 Tesla MR scanner (Ingenia CX, Philips) with a 32-channel head coil. Structural data were acquired using a 3D T1-weighed sequence (repetition time/echo time (TR/TE) = 8.2/3.8 ms, field-of-view (FOV) = 256 × 240 mm2, 160 slices with a 1 mm slice thickness, and 1 mm isotropic voxels). GSH levels were estimated using the PRESS sequence (TR/TE=2000/30 ms, bandwidth = 2000 Hz, 64 averages) and HERMES sequence (TR/TE=2000/80 ms, bandwidth = 2000 Hz, ‘‘ON/OFF’’ editing pulses = 4.56/7.5 ppm, 320 averages) in three volumes of interest (VOIs). The VOI positions are shown in Fig. 1. For the ACC, a VOI with a size of 30 × 30 × 20 mm3 was aligned with the corpus callosum shape and positioned superior and posterior to the genu of the corpus callosum. For the PCC, a VOI with a size of 30 × 30 × 20 mm3 was aligned with the corpus callosum shape and positioned posterior and superior to the splenium. For the OC, a VOI measuring 30 × 30 × 30 mm3 was centered within the visual cortex and aligned with the cerebellar tentorium. All VOIs were centered over the midline of the brain and placed away from the skull and sagittal sinus.
Fig. 1.
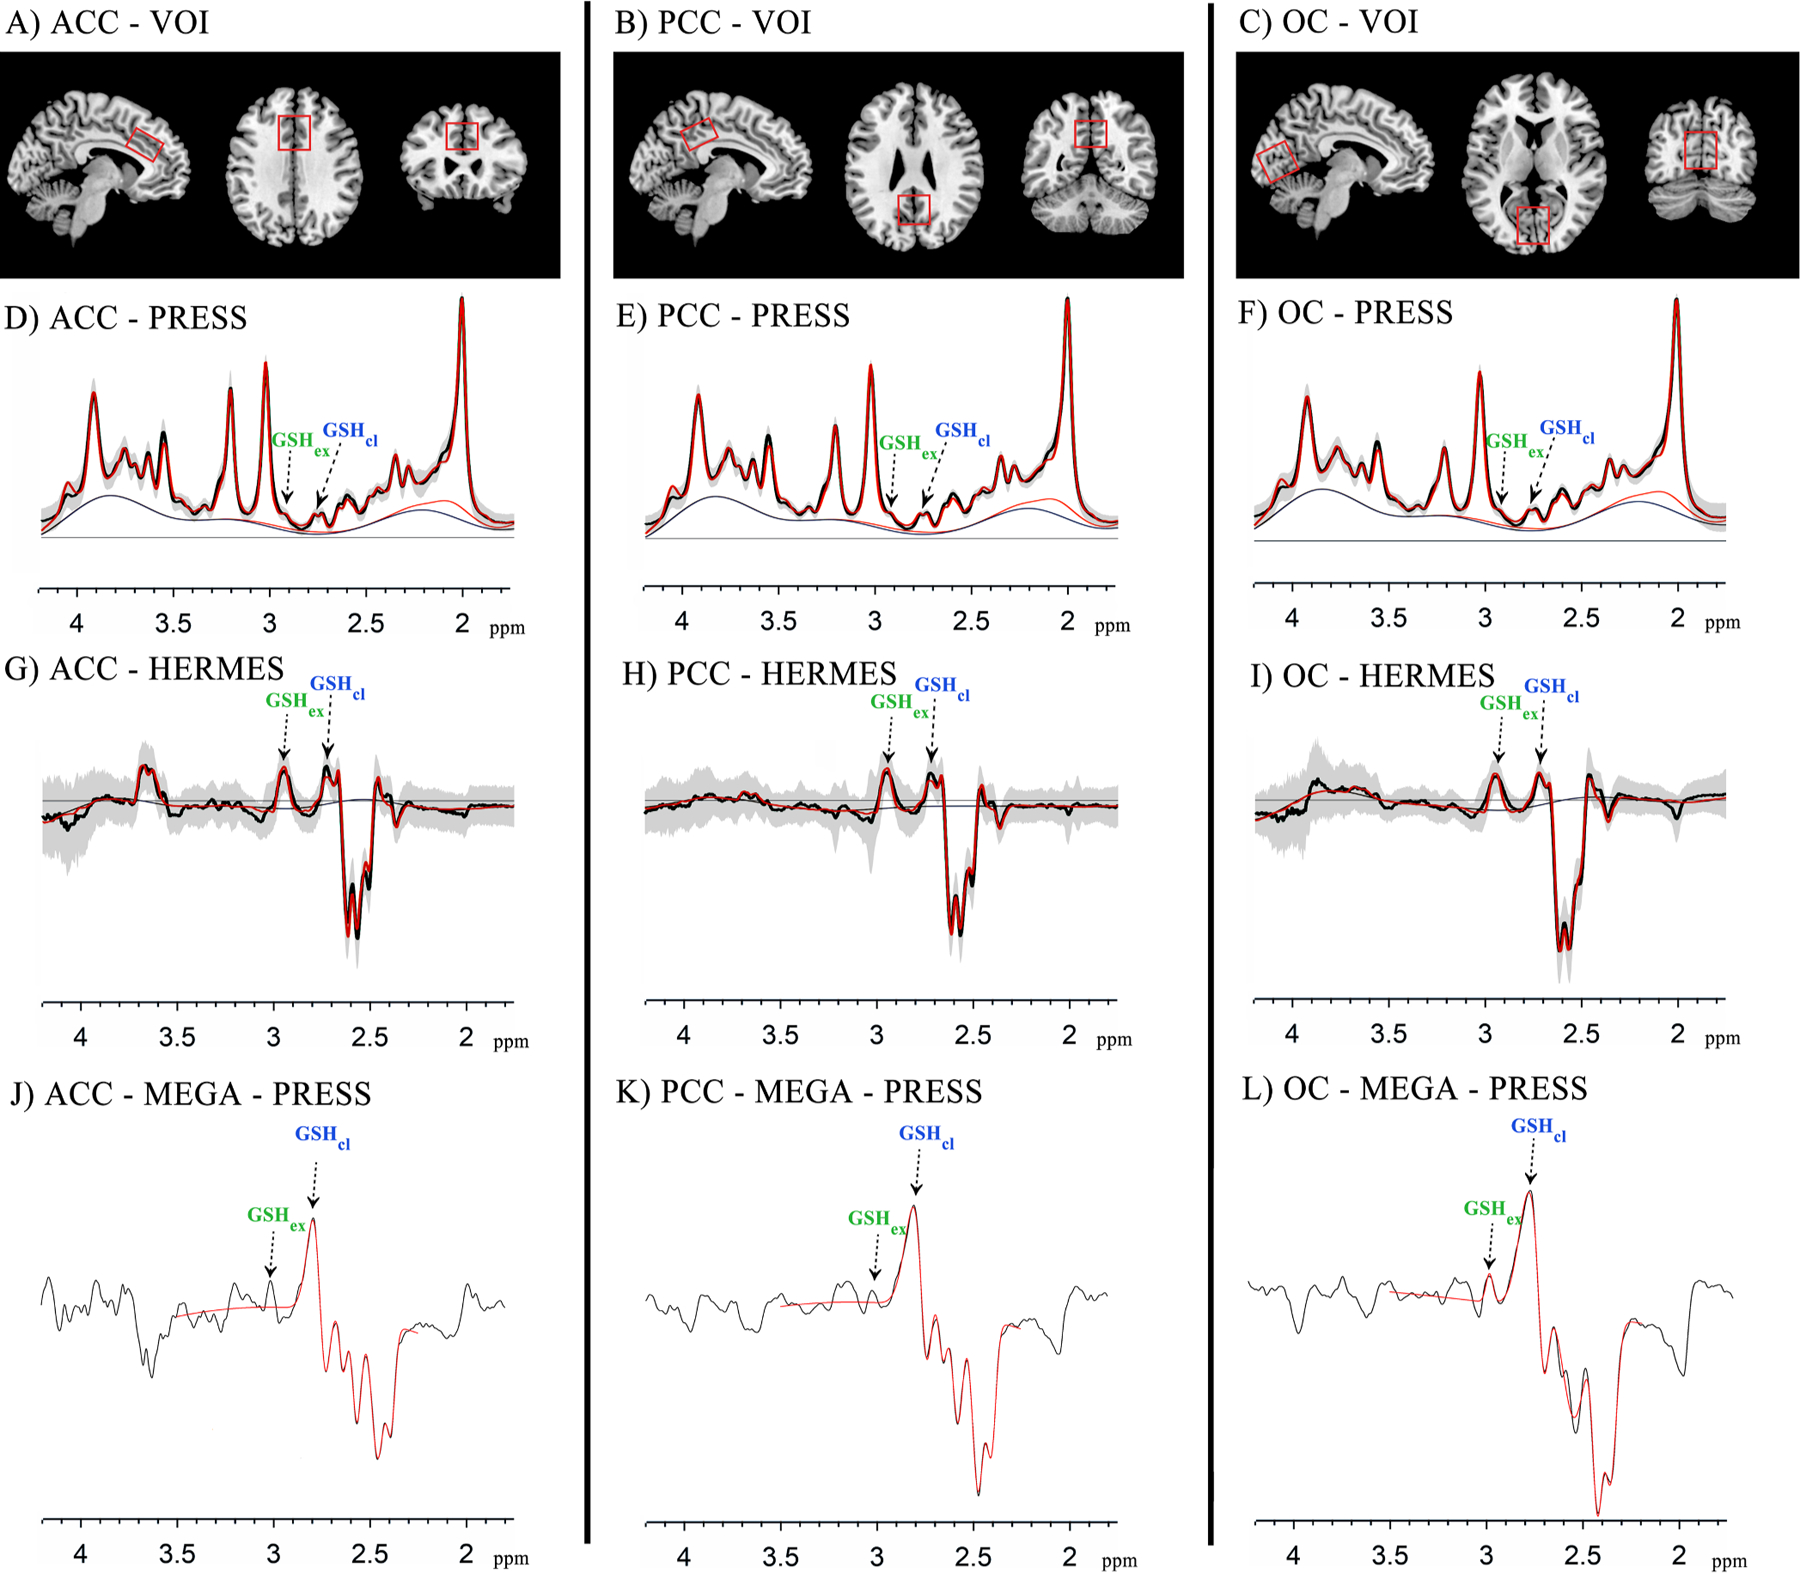
(A–C) The sagittal, axial, and coronal MR images are shown, along with the volume of interest (VOI) location, angulation, and size in the anterior cingulate cortex (ACC), posterior cingulate cortex (PCC), and occipital cortex (OC). D–L) Point RESolved Spectroscopy (PRESS), Hadamard Encoding and Reconstruction of MEGA-Edited Spectroscopy (HERMES) and MEshcher–Garwood Point RESolved Spectroscopy (MEGA-PRESS) spectra for all individuals in the ACC, PCC and OC. Raw data is shown in black with the model fit in red and mean data ± 1 standard deviation is represented by shaded areas. GSHcl (blue color), closed form glutathione; GSHex (green color), extended form glutathione.
As a J-difference editing method, the HERMES sequence can simultaneously measure GSH and gamma-aminobutyric acid (GABA) with macromolecules and homocarnosine. Briefly, the HERMES sequence comprises four sub-experiments: A) a dual-lobe editing pulse at 1.9 ppm (ONGABA) and 4.56 ppm (ONGSH); B) a single-lobe editing pulse at 1.9 ppm (ONGABA); C) a single-lobe editing pulse at 4.56 ppm (ONGSH); and D) a single-lobe editing pulse at 7.5 ppm (OFFGABA/GSH). The GSH spectra were attained using the Hadamard combination A–B + C–D.
2.4. MR data analysis
For HERMES data, Gannet 3.15 was used to analyze GSH levels with a 3 Hz line broadening (Saleh et al., 2016). For PRESS data, GSH levels were estimated using LCModel (version 6.3–1 M) (Provencher, 1993).
Subsequently, individual 3D T1-weighted images were segmented using Gannet 3.15 based on SPM 12 (Ashburner and Friston, 2005) to derive the gray matter (GM), white matter (WM), and cerebrospinal fluid (CSF) measures of the VOIs. The partial volume effects and T1 and T2 relaxation durations were accounted for when adjusting the metabolite levels. The water-scaled metabolite levels in institutional units (i.u.) were computed using the following equations (Gasparovic et al., 2006; Mullins et al., 2014):
where SGSH and SH2O represent the GSH and water signal integrals, respectively; [H2O] is the concentration of pure water (55,550 mmol/kg); fGM, fWM, and fCSF are the portions of water specifically attributed to GM, WM, and CSF, respectively (Gasparovic et al., 2006); is used to compute the relaxation attenuation factors with T1W_y and T2W_y being the T1 and T2 relaxation durations of water in compartment y (i.e., GM, WM, or CSF); and RGSH is the relaxation attenuation factors for GSH. The following relaxation times were used: GM water: T1 = 1331 ms, and T2 = 110 ms; WM water: T1 = 832 ms, and T2 = 79.2 ms; CSF: T1 = 3817 ms, and T2 = 503 ms (Lu et al., 2005; Piechnik et al., 2009; Wansapura et al., 1999); GSH: T1 = 397 ms, and T2 = 117 ms (Choi and Lee, 2013; Scheidegger et al., 2014). We excluded MRS data if the fitting errors of GSH exceeded 20 %, the Cramer-Rao lower bounds of GSH exceeded 20 %, or the calculated GSH levels exceeded three times the interquartile range outside the first or third quartile.
NMR analyses of GSH solutions under anaerobic (2.80 ppm) (Dela lande et al., 2010; Duddeck et al., 2013) and aerobic conditions (2.95 ppm) (Govindaraju et al., 2000; Kato et al., 1999; Kennett et al., 2005) have detected chemical shift signals for both the closed form and extended form GSH’s Cys β-CH2. Therefore, in order to detect the closed form GSH, we measured GSH peaks at 2.80 ppm using MEGA-PRESS in the supplementary study when selectively excited at 4.40 ppm. A total of 15 healthy participants (8 males and 7 females, age range 26–56 years, mean ± standard deviation = 39.93 ± 2.67 years) were recruited. All participants were of Han Chinese ethnicity, Mandarin speakers, and right-handed. The exclusion criteria are the same as that of the main study.
Fifteen participants were scanned using a 3.0 Tesla MR scanner (Ingenia CX, Philips) with a 32-channel head coil. Structural data were acquired using a 3D T1-weighed sequence (repetition time/echo time (TR/TE) = 8.2/3.8 ms, field-of-view (FOV) = 256 × 240 mm2, 160 slices with a 1 mm slice thickness, and 1 mm isotropic voxels). Closed form GSH levels were estimated using the MEGA-PRESS sequence (TR/TE=2000/120 ms, bandwidth = 2000 Hz, 320 averages). The positions of the VOI remain consistent with those of the main study. In order to selectively refocus the evolution of J-coupled GSH spins (Hβ of cysteine) at 2.80 ppm, the editing pulse was adjusted to 4.40 ppm for GSH spins (Hα of cysteine) and referred to as ‘ON’. Additionally, the off-resonance pulse was set at 5.00 ppm, referred to as ‘OFF’.
Gannet 3.15 was used to analyze closed form GSH levels with a 3 Hz line broadening (Saleh et al., 2016). The GSH-edited spectrum was modeled between 2.25 and 3.5 ppm using two Gaussians to model the GSH signals at 2.80 and 2.95 ppm, four Gaussians to model the coedited aspartyl signals around 2.55 ppm, and a nonlinear baseline. Subsequently, individual 3D T1-weighted images were segmented using Gannet 3.15 based on SPM 12 (Ashburner and Friston, 2005) to derive the GM, WM, and CSF measures of the VOIs. The partial volume effects and T1 and T2 relaxation durations were accounted for when adjusting the metabolite levels. The quantification equations for GSH are consistent with those used in the main study.
2.5. Statistical analysis
All statistical analyses were conducted using R software (version 4.2.2) (R Core Team R, 2013). The p-value for statistical significance was 0.05. To obtain complete data for analysis, multiple imputation was performed for excluded MRS data using the random forest method. The Shapiro-Wilk test was used to assess the normality of the variable distributions. Pearson partial correlation analysis was used to explore the relationship between age and GSH levels. To further explore potential associations, linear regression models were built. To ensure that the association effects (reflected by β coefficients) between age and GSH levels in the three brain regions measured by the two MRS sequences could be intuitively evaluated and compared, standardized age and standardized GSH levels were included in the linear regression models. Restricted cubic spline (RCS) with four knots at the 5th, 35th, 65th, and 95th percentiles were further used to identify potential nonlinearities in these associations. To remove any influence of potential confounding factors, sex, education level, full width half maximum (FWHM), and the signal-noise ratio (SNR) of total N-Acetyl-l-aspartic acid (tNAA) were included as covariates in the above analysis.
To evaluate the association between GSH levels and cognitive function scores, standardized linear regression models were built with age, education level, FWHM, and SNR of tNAA as covariates. To explore the effect of sex, the above analyses were performed separately for male and female subgroups, with age, education level, FWHM, and SNR of tNAA included as covariates.
3. Results
Table 2 presents the extended form GSH levels in the three brain regions measured by PRESS and HERMES in all participants and the male and female subgroups. Based on the criteria described in the Methods, some GSH levels measured by PRESS (ACC: 5 participants) and HERMES (ACC: 10 participants; PCC: 8 participants, and OC: 11 participants) were excluded from analysis.
Table 2.
Distribution of extended form glutathione in the whole population and in different sex groups.
| Variables | Overall (N = 276) | Female (N = 166) | Male (N = 110) |
|---|---|---|---|
| PRESS | |||
| ACC | 1.93 (0.28) | 1.93 (0.28) | 1.94 (0.28) |
| PCC | 2.02 (0.29) | 2.00 (0.28) | 2.06 (0.30) |
| OC | 1.80 (0.32) | 1.79 (0.34) | 1.80 (0.28) |
| HERMES | |||
| ACC | 0.80 (0.34) | 0.82 (0.36) | 0.77 (0.31) |
| PCC | 1.14 (0.37) | 1.13 (0.37) | 1.14 (0.39) |
| OC | 1.14 (0.58) | 1.13 (0.57) | 1.15 (0.58) |
Mean and standard deviation (SD) are shown for continuous GSH levels.
ACC, anterior cingulate cortex; PCC, posterior cingulate cortex; OC, occipital cortex; PRESS, processed Point RESolved Spectroscopy; HERMES, Hadamard Encoding and Reconstruction of MEGA-Edited Spectroscopy.
3.1. Relationship between age and GSH levels
Partial correlation analysis indicates a correlation between PRESS GSH levels and age in the PCC (r = −0.229, P < 0.001), as shown in Fig. 3. Further linear regression analyses showed that PRESS GSH levels decreased with age in the PCC (β: −0.337; 95 % confidence interval (CI): −0.506, −0.168; controlling for SNR, FWHM, sex, and education level). There was no significant association between PRESS GSH levels and age in the ACC (β: −0.078; 95 % CI: −0.251, 0.095) and the OC (β: −0.150; 95 % CI: −0.326, 0.025), as shown in Fig. 2. A non-linear relationship was not observed between age and PRESS GSH levels in ACC (P nonlinear= 0.459), PCC (P nonlinear = 0.466), or OC (P nonlinear = 0.163), as shown in Fig. 4.
Fig. 3.
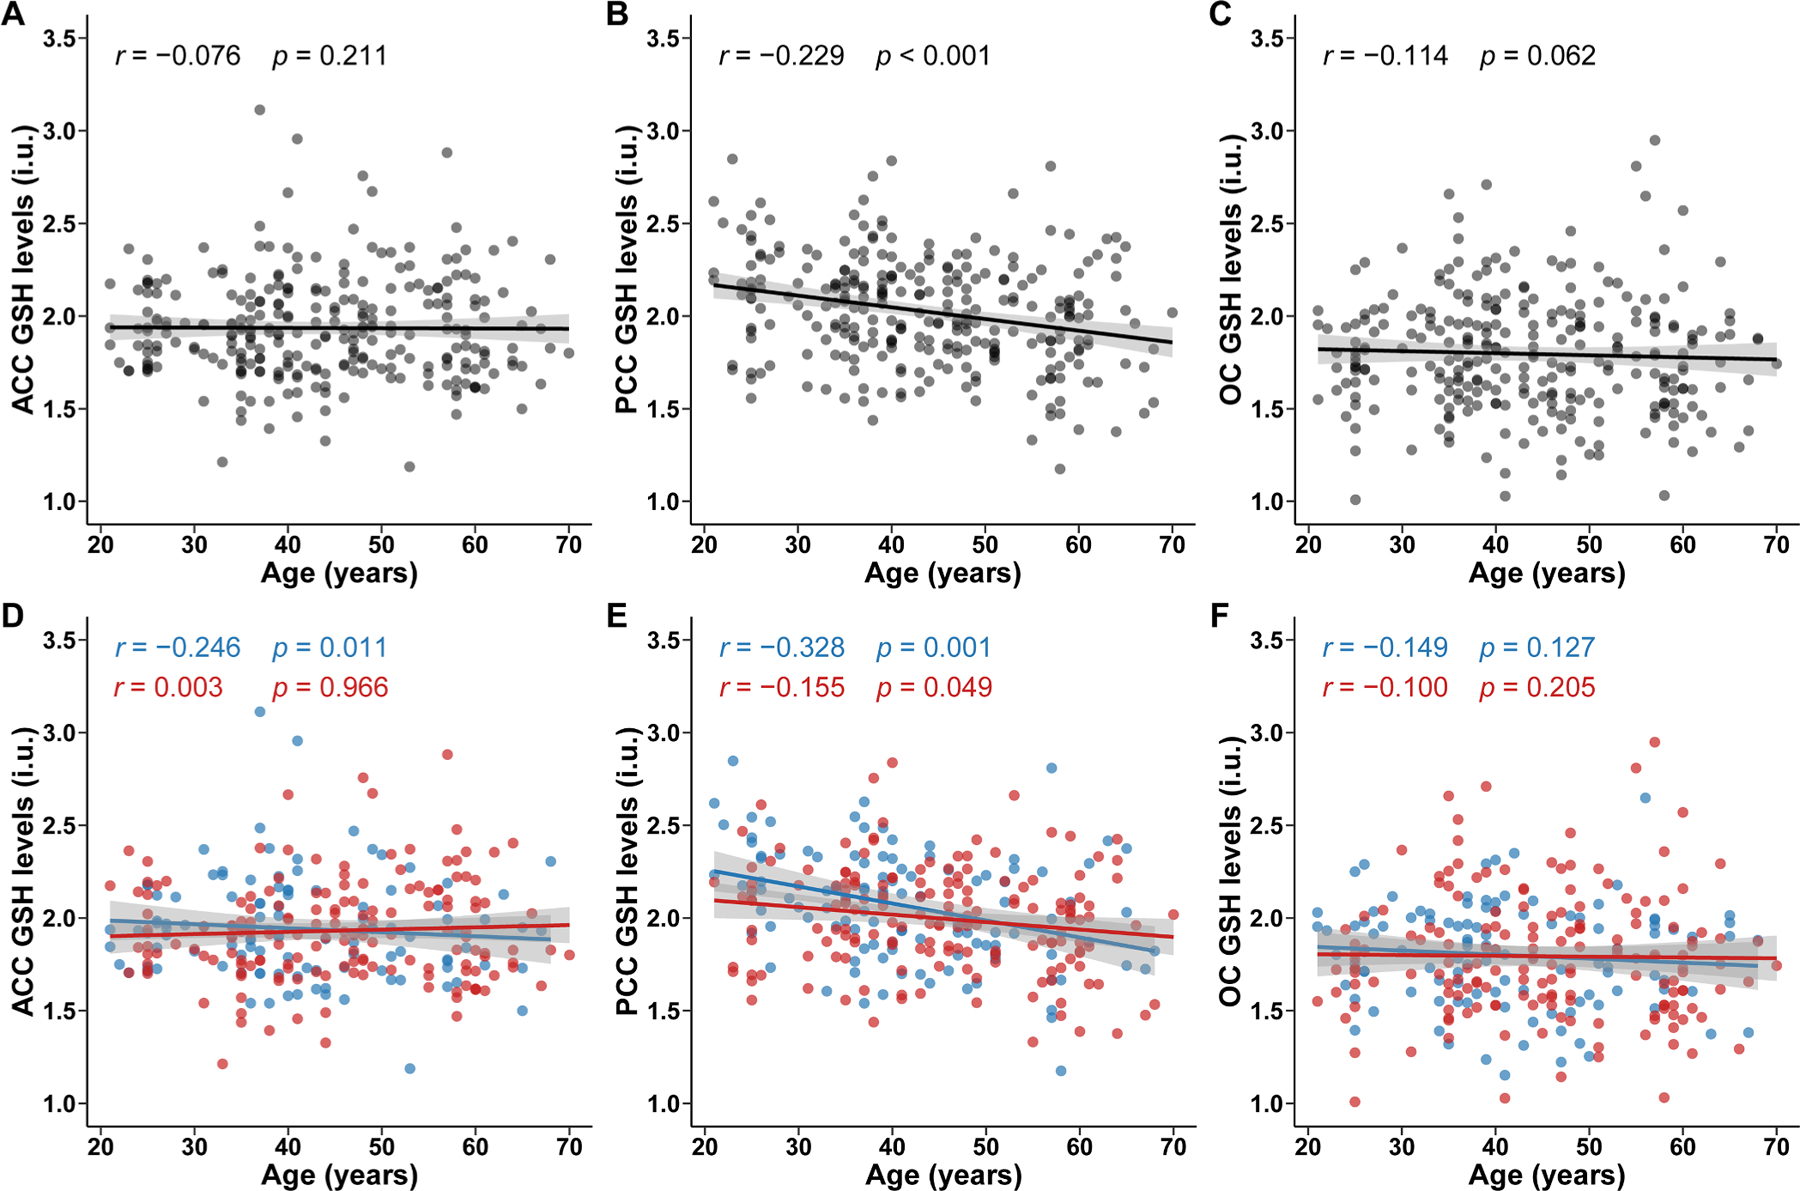
Correlation between age and GSH levels detected by PRESS
Scatter plots illustrated the distribution of age and glutathione (GSH) levels detected by PRESS and correlation between them. Pearson partial correlations analysis was adjusted by sex, education levels, FWHM and SNR in overall population in ACC (A), PCC (B) and OC (C), and adjusted by education levels, FWHM and SNR in sex subgroups (blue for male; red for female) in ACC (D), PCC (E) and OC (F). Fitted lines and 95 % confidence intervals (shaded area) are also shown. ACC, anterior cingulate cortex; PCC, posterior cingulate cortex; OC, occipital cortex; PRESS, processed Point RESolved Spectroscopy.
Fig. 2.
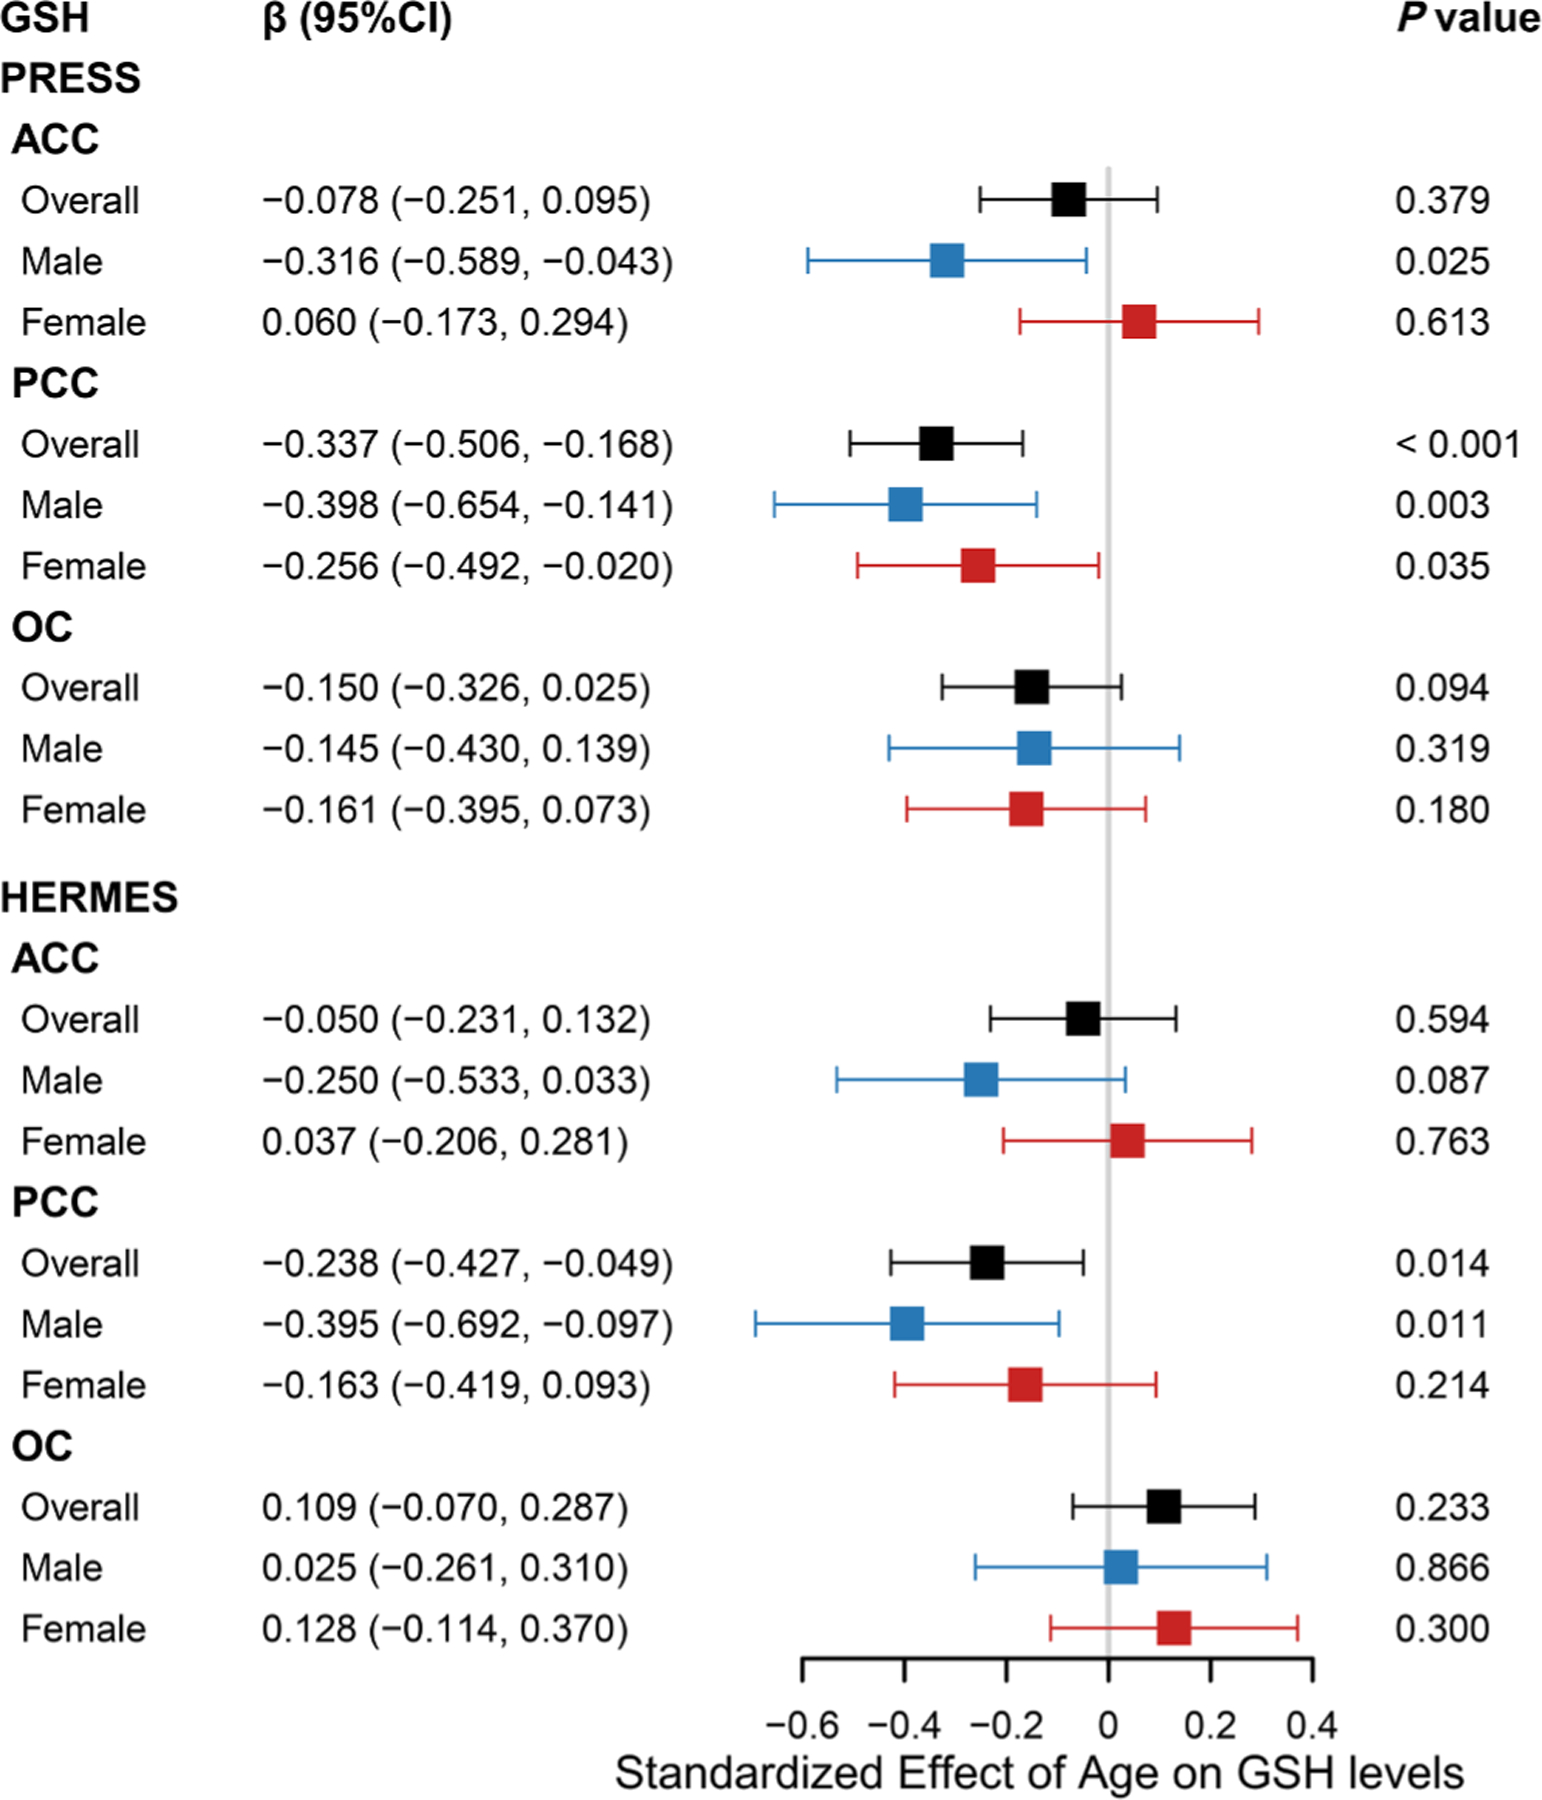
Association between age and GSH levels
Forest plot illustrated the association between age and glutathione (GSH) levels in overall participants, male and female. Standard linear regression model was adjusted by sex, education levels, full width half maximum (FWHM) and signal-noise ratio (SNR) in overall population, and adjusted by education levels, FWHM and SNR in sex subgroups. ACC, anterior cingulate cortex; PCC, posterior cingulate cortex; OC, occipital cortex; PRESS, processed Point RESolved Spectroscopy; HERMES, Hadamard Encoding and Reconstruction of MEGA-Edited Spectroscopy.
Fig. 4.
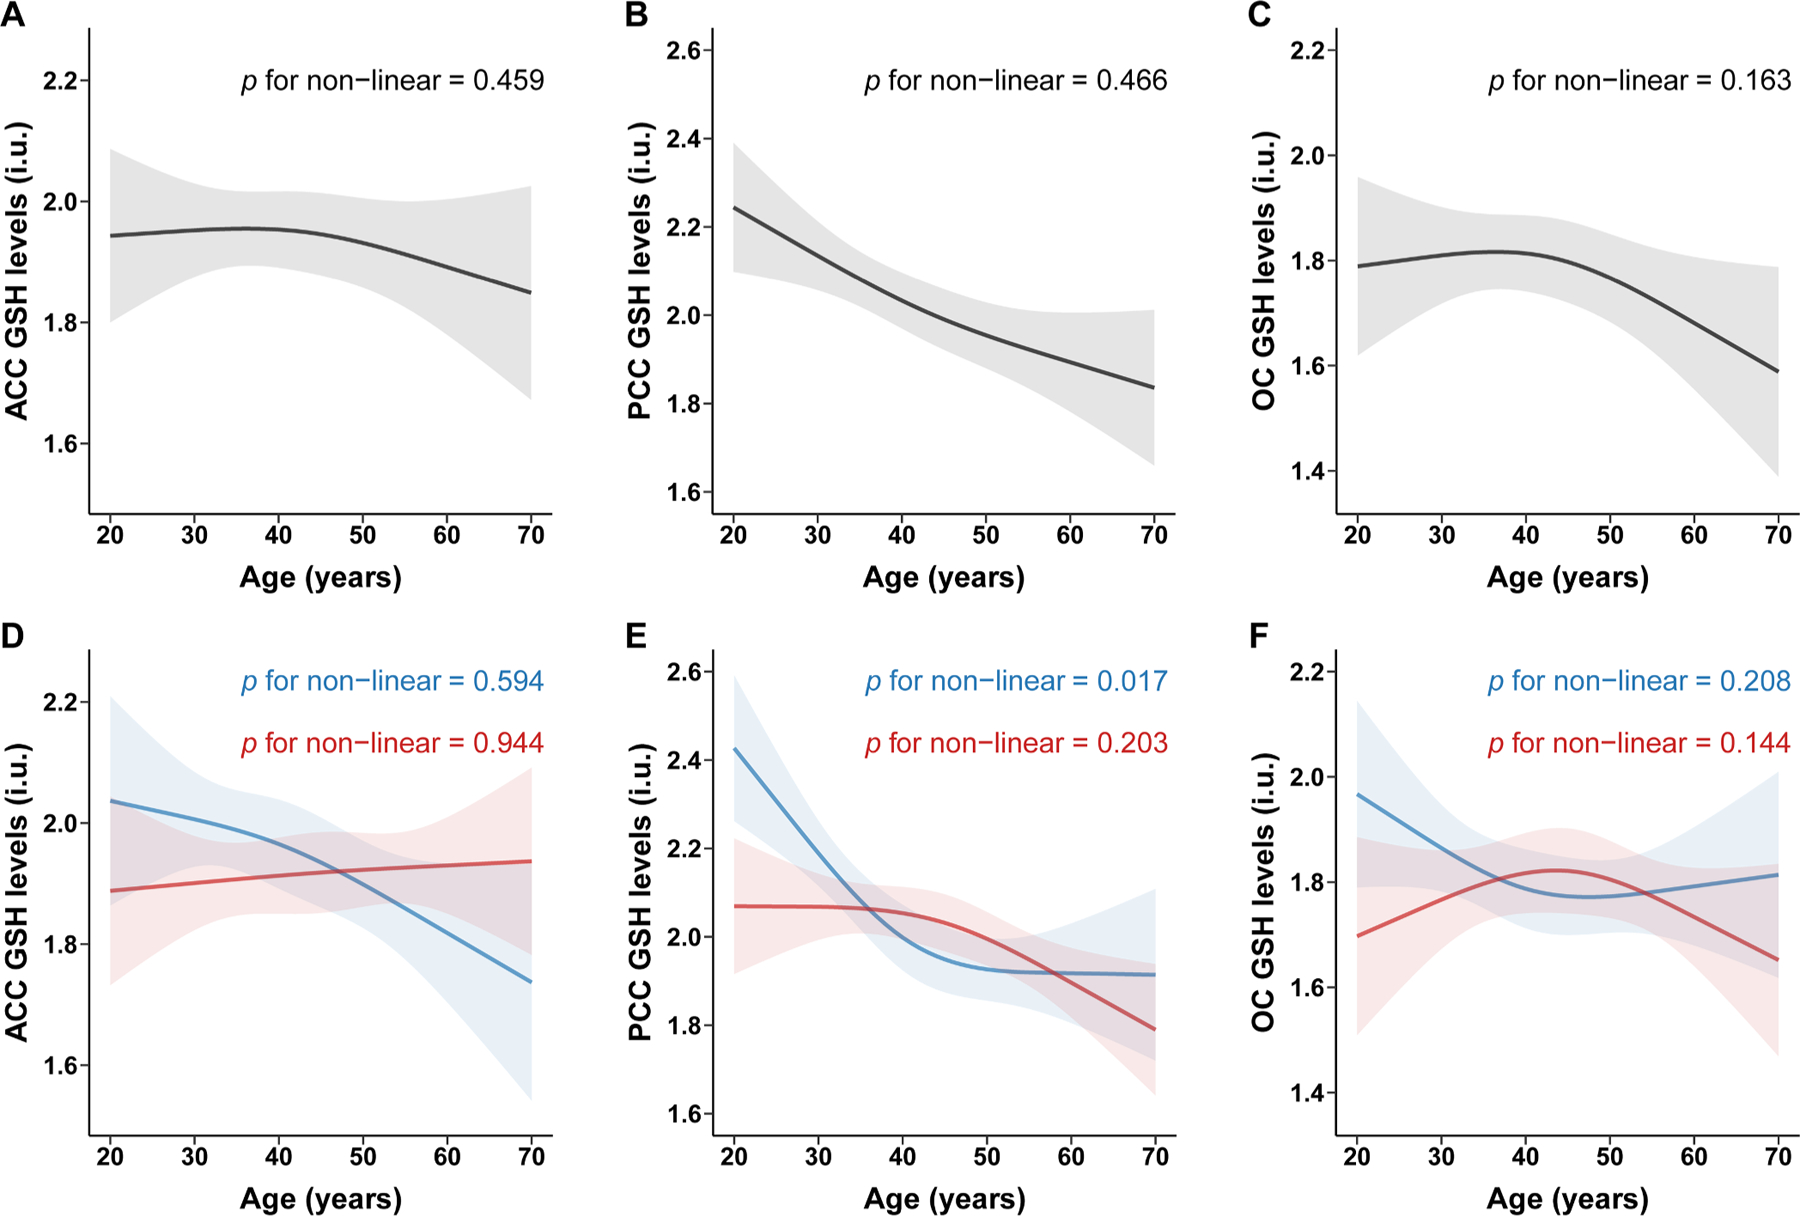
Non-linear association between age and GSH levels detected by PRESS
Restricted cubic spline was used to explore non-linear association between age and glutathione (GSH) levels detected by PRESS. Spline regression model was adjusted by sex, education levels, FWHM and SNR in overall population, and adjusted by education levels, FWHM and SNR in sex subgroups. All of the models with four knots located at the 5th, 35th, 65th, and 95th percentiles of age. Change of GSH levels (solid curve) and 95% confidence intervals (shaded region) were showed in overall population in ACC (A), PCC (B) and OC (C) and in sex subgroups (blue for male; red for female) in ACC (D), PCC (E) and OC (F). ACC, anterior cingulate cortex; PCC, posterior cingulate cortex; OC, occipital cortex; PRESS, processed Point RESolved Spectroscopy.
According to the edited technique, partial correlation analysis indicates a correlation between HERMES GSH levels and age in the PCC (r = 0.138, P = 0.022), as shown in Fig. 5. Further linear regression analyses showed that HERMES GSH levels decreased with age in the PCC (β: −0.238; 95 % CI: −0.427, −0.049). However, there was no significant association between age and HERMES GSH levels in the ACC (β: −0.050; 95 % CI: −0.231, 0.132) or OC (β: 0.109; 95 % CI: −0.070, 0.287), as shown in Fig. 2. A non-linear relationship was not observed between age and HERMES GSH levels in ACC (P nonlinear = 0.168), PCC (P nonlinear = 0.311), or OC (P nonlinear = 0.962), as shown in Fig. 6.
Fig. 5.
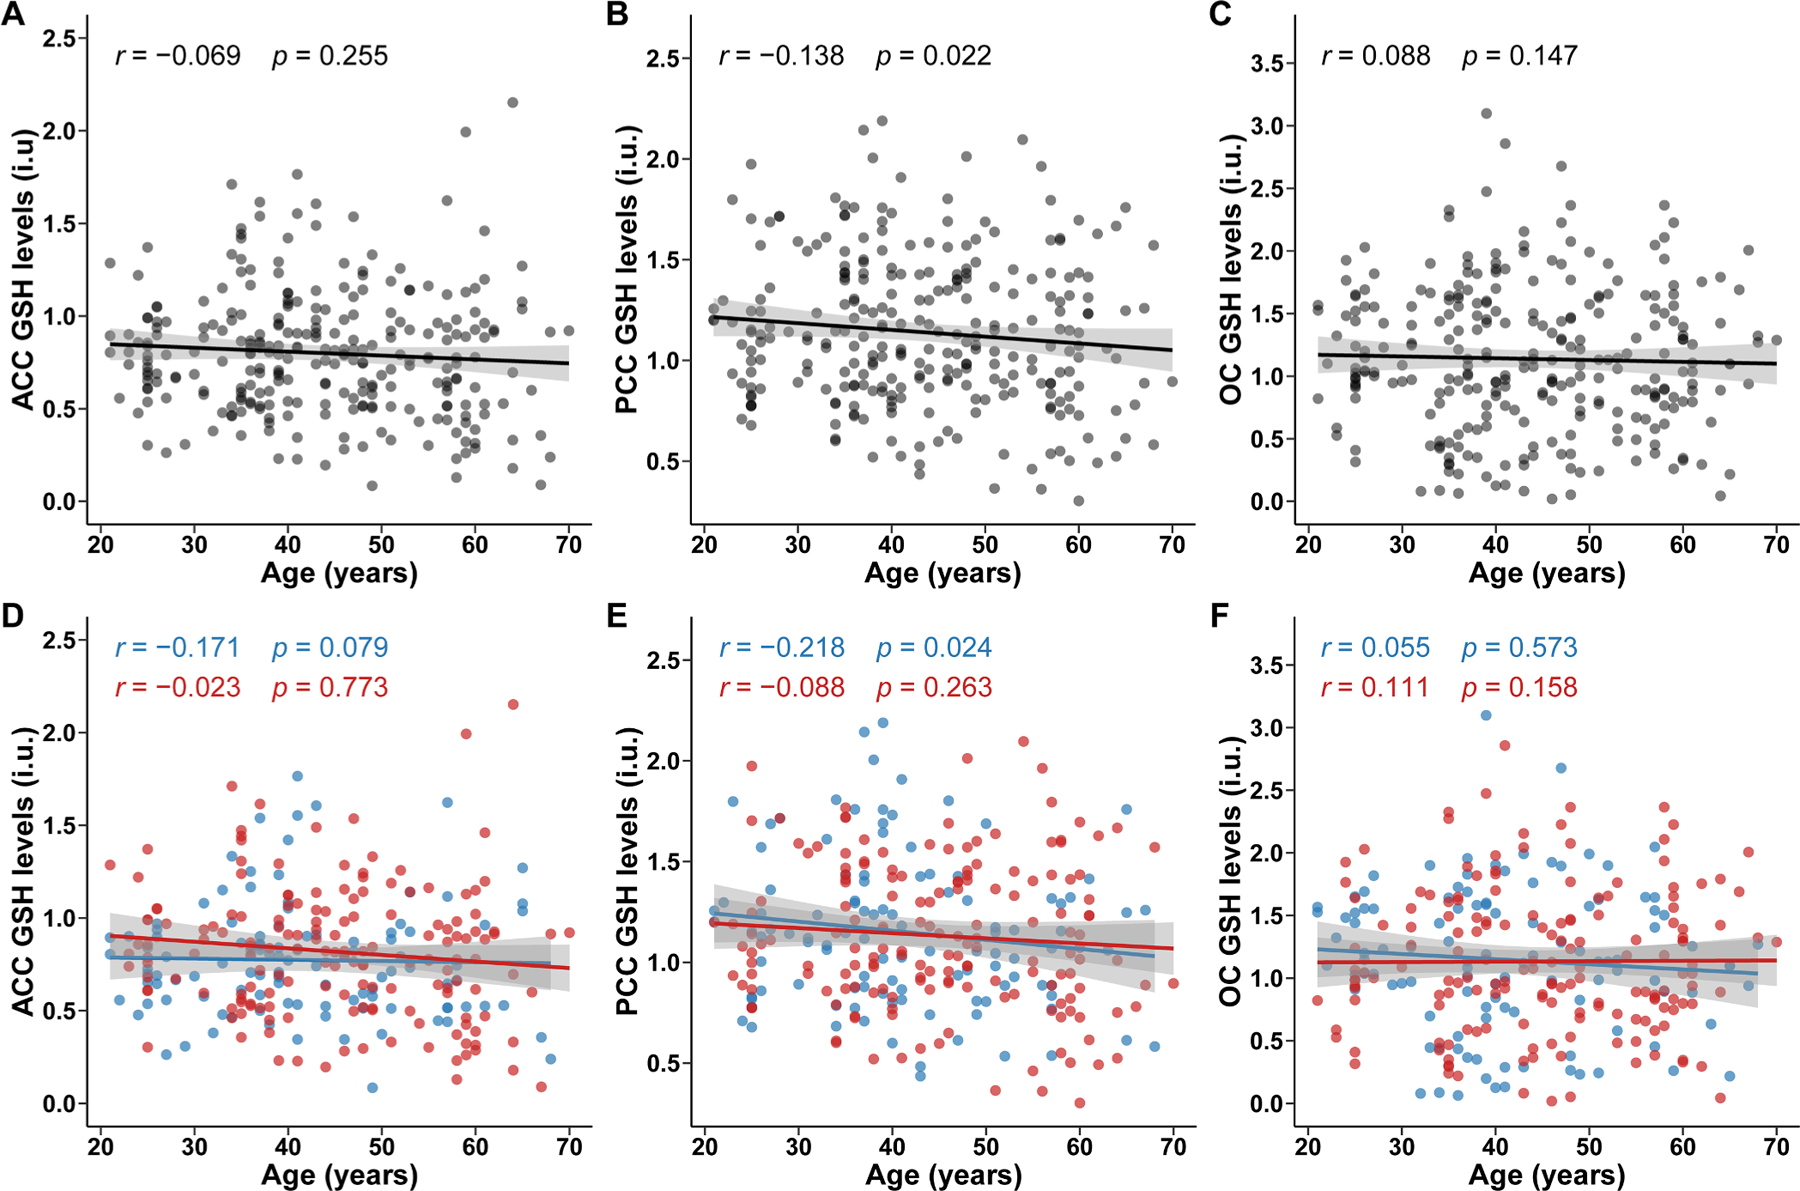
Correlation between age and GSH levels detected by HERMES
Scatter plots illustrated the distribution of age and glutathione (GSH) levels detected by HERMES and correlation between them. Pearson partial correlations analysis was adjusted by sex, education levels, FWHM and SNR in overall population in ACC (A), PCC (B) and OC (C), and adjusted by education levels, FWHM and SNR in sex subgroups (blue for male; red for female) in ACC (D), PCC (E) and OC (F). Fitted lines and 95 % confidence intervals (shaded area) are also shown. ACC, anterior cingulate cortex; PCC, posterior cingulate cortex; OC, occipital cortex; HERMES, Hadamard Encoding and Reconstruction of MEGA-Edited Spectroscopy.
Fig. 6.
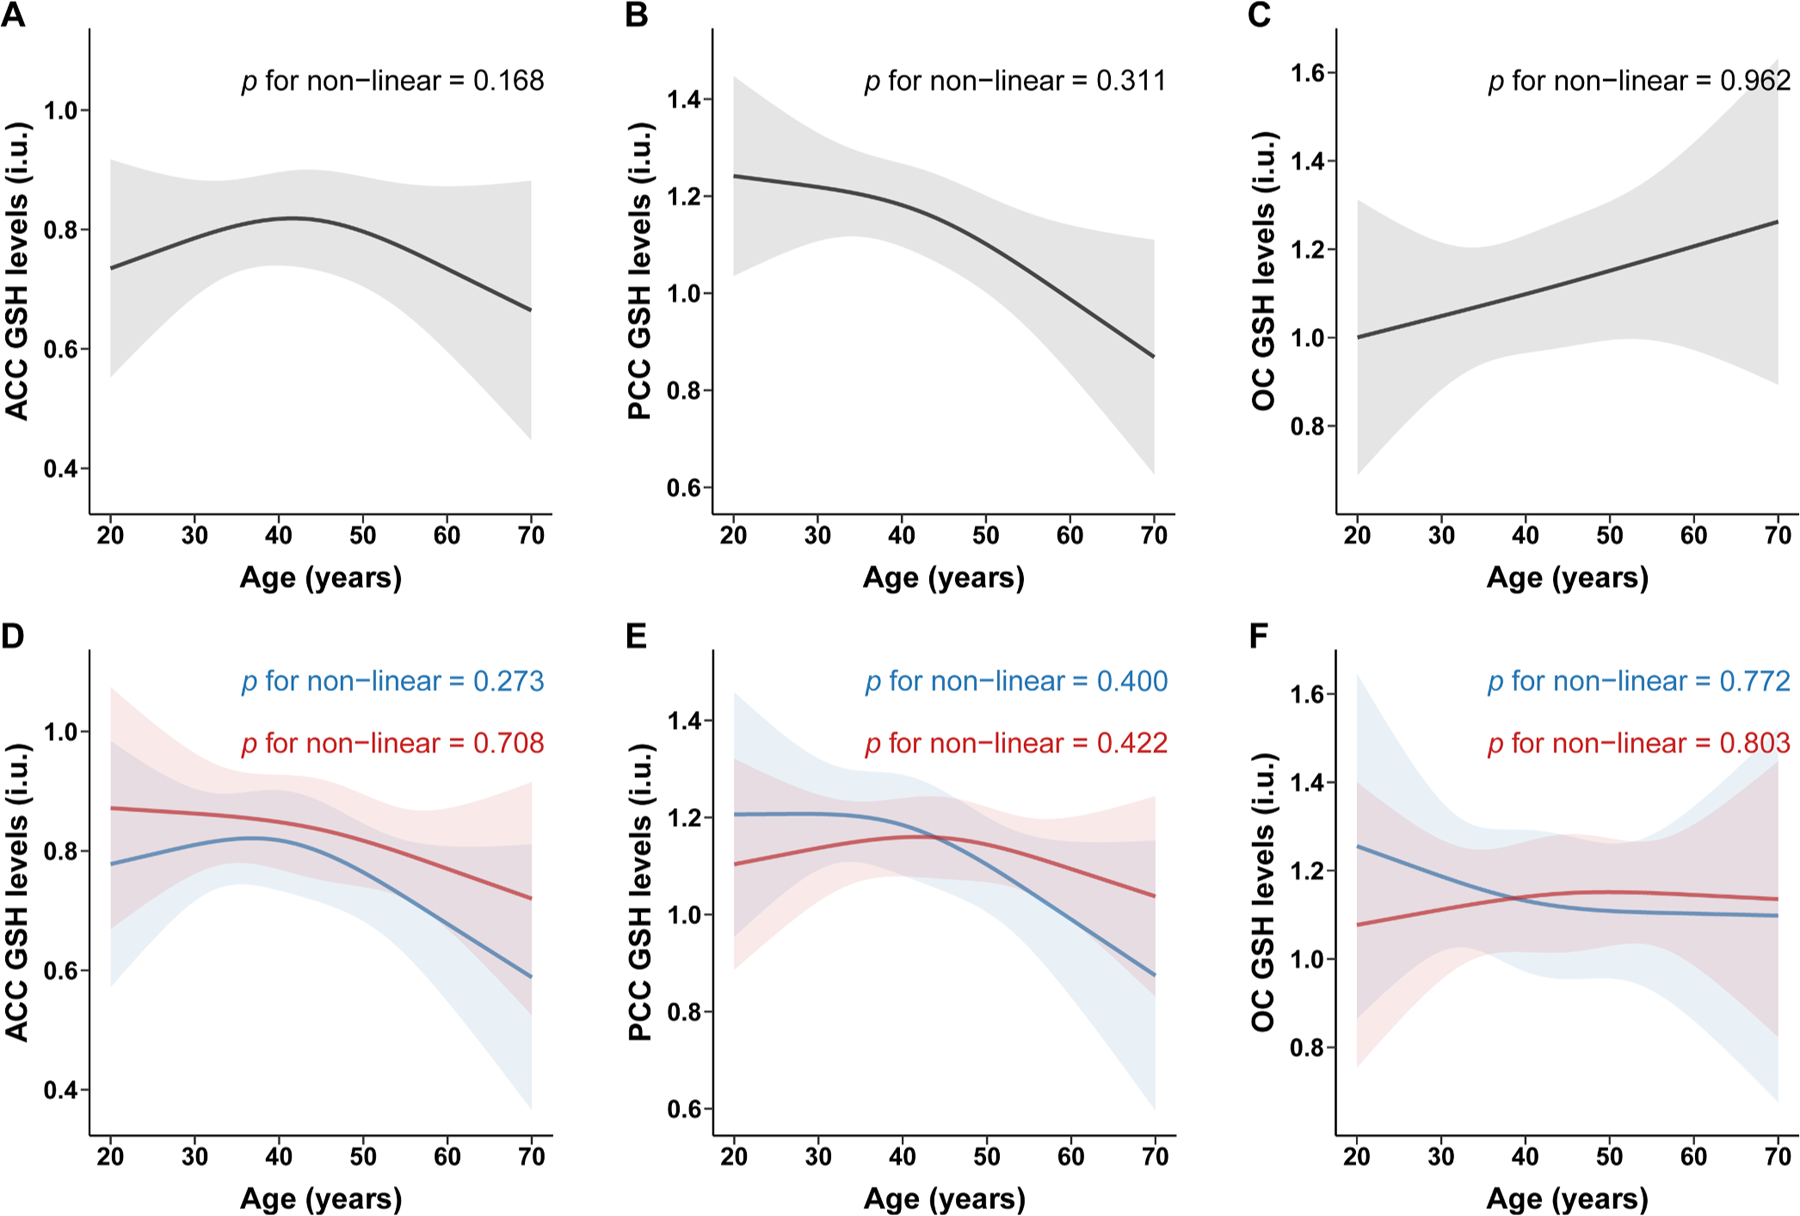
Non-linear association between age and GSH levels detected by HERMES
Restricted cubic spline was used to explore non-linear association between age and glutathione (GSH) levels detected by HERMES. Spline regression model was adjusted by sex, education levels, FWHM and SNR in overall population, and adjusted by education levels, FWHM and SNR in sex subgroups. All of the models with four knots located at the 5th, 35th, 65th, and 95th percentiles of age. Change of GSH levels (solid curve) and 95% confidence intervals (shaded region) were showed in overall population in ACC (A), PCC (B) and OC (C) and in sex subgroups (blue for male; red for female) in ACC (D), PCC (E) and OC (F). ACC, anterior cingulate cortex; PCC, posterior cingulate cortex; OC, occipital cortex; HERMES, Hadamard Encoding and Reconstruction of MEGA-Edited Spectroscopy.
3.2. Relationship between GSH levels and cognitive function
Linear regression analyses showed significant positive associations between RCFT scores and PRESS GSH levels in the PCC (β: 0.117; 95 % CI: 0.015, 0.219) and OC (β: 0.149; 95 % CI: 0.051, 0.248), controlling for SNR, FWHM, sex, and education level, but not the ACC (β: 0.102; 95 % CI: 0.000, 0.203), as shown in Fig. 7.
Fig. 7.
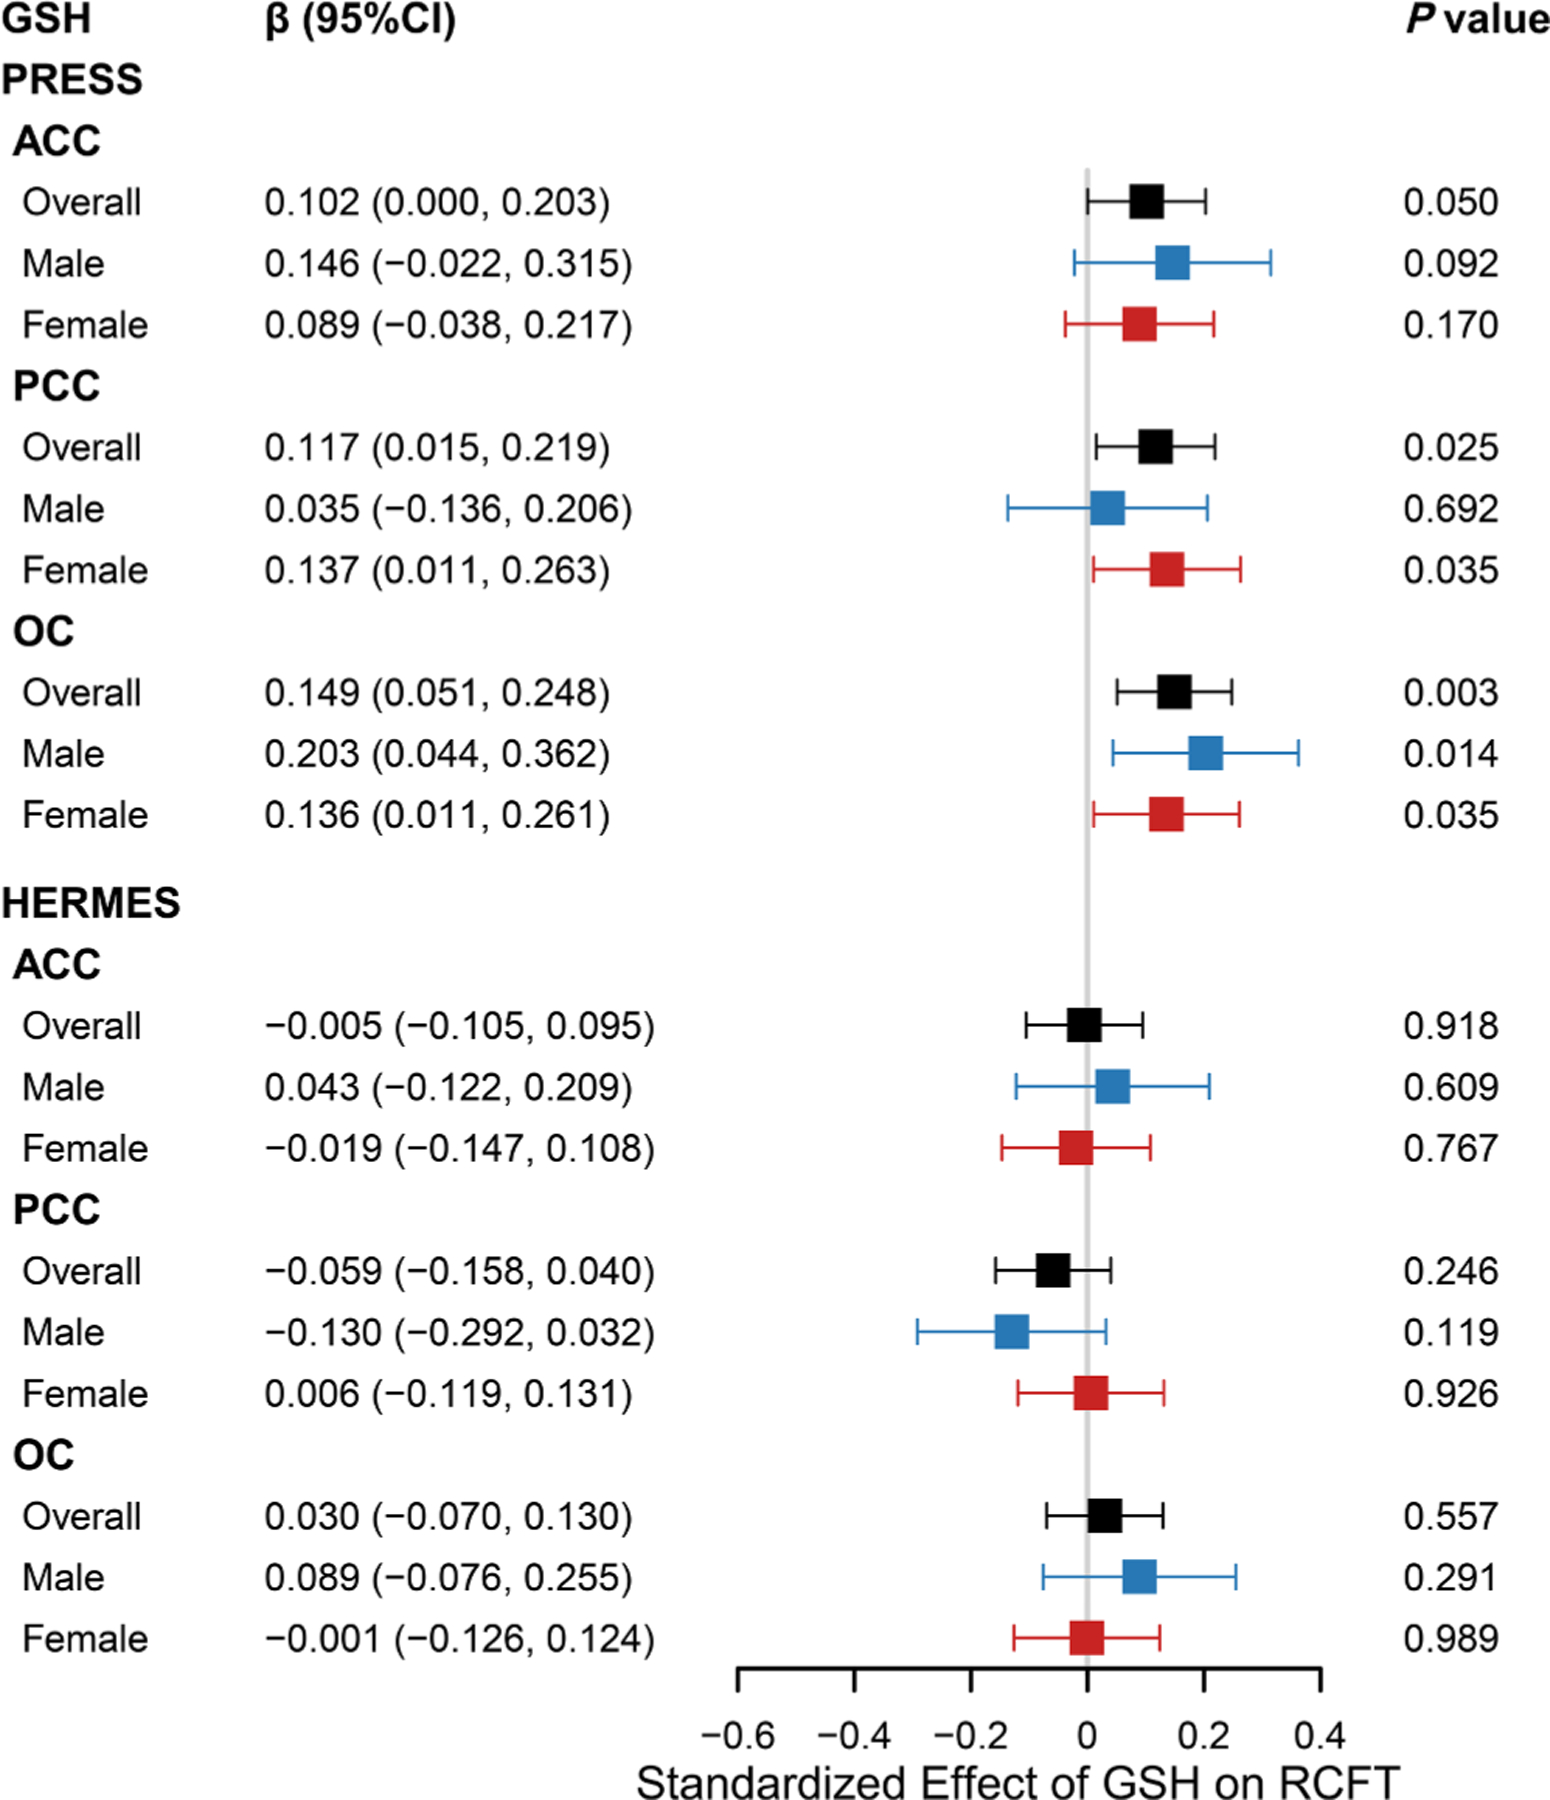
Association between GSH levels and RCFT scores
Forest plot illustrated the association between glutathione (GSH) levels and RCFT scores in overall population, male and female. Standard linear regression model was adjusted by age, sex, education levels, full width half maximum (FWHM) and signal-noise ratio (SNR) in overall population, and adjusted by age, education levels, FWHM and SNR in sex subgroups. RCFT, Rey-Osterrieth Complex Figure Test; ACC, anterior cingulate cortex; PCC, posterior cingulate cortex; OC, occipital cortex; PRESS, processed Point RESolved Spectroscopy; HERMES, Hadamard Encoding and Reconstruction of MEGA-Edited Spectroscopy.
According to the edited technique, there was no significant association between RCFT scores and HERMES GSH levels in the ACC (β: −0.005; 95 % CI: −0.105, 0.095), PCC (β: −0.059; 95 % CI: −0.158, 0.040), or OC (β: 0.030; 95 % CI: −0.070, 0.130), as shown in Fig. 7.
Furthermore, no significant associations were observed between GSH levels and MOCA, AVLT, SDMT, and Stroop scores in the total participants (see Supplementary Materials Table S1).
3.3. Effect of sex on the age-GSH level relationship
Further linear regression analyses of the male and female subgroups showed that PRESS GSH levels decreased with age in males (β: −0.398; 95 % CI: −0.654, −0.141) and females (β: −0.256; 95 % CI: −0.492, −0.020) in the PCC, as shown in Fig. 2. The correlation strength between PRESS GSH levels and age did not differ by sex (Z = −1.4815; P = 0.1385). As shown in Fig. 4., a non-linear relationship was observed between PRESS GSH levels and age in males in this brain region (P nonlinear = 0.017), but not in females (P nonlinear = 0.203).
In the ACC, PRESS GSH levels were significantly correlated with age in males (β: −0.316; 95 % CI: −0.589, −0.043), but not in females (β: 0.060; 95 % CI: −0.173, 0.294). The correlation strength between PRESS GSH levels and age differed by sex (Z = −2.0427; P = 0.0411). We did not observe a non-linear relationship between PRESS GSH levels and age in this brain region in males (P nonlinear = 0.594) or females (P nonlinear = 0.944).
In the OC, there was no significant association between PRESS GSH levels and age in males (β: −0.145; 95 % CI: −0.430, 0.139) or females (β: −0.161; 95 % CI: −0.395, 0.073). We did not observe a non-linear relationship between PRESS GSH levels and age in this brain region in males (P nonlinear = 0.208) or females (P nonlinear = 0.144).
According to edited technique, linear regression analyses showed that HERMES GSH levels decreased with age in the PCC in males (β: −0.395; 95 % CI: −0.692, −0.097), but not in females (β: −0.163; 95 % CI: −0.419, 0.093), as shown in Fig. 2. The correlation strength between HERMES GSH levels and age did not differ by sex (Z = −1.0716; P = 0.2839). We did not observe a non-linear relationship between HERMES GSH levels and age in this brain region in males (P nonlinear = 0.400) or females (P nonlinear = 0.422), as shown in Fig. 6.
No significant associations were observed between HERMES GSH levels and age in the PCC and OC in males or females and the associations were not non-linear.
3.4. Effect of sex on the cognitive function-GSH level relationship
A positive association between PRESS GSH levels in the PCC and RCFT scores was found in females (β, 0.137; 95 % CI: 0.011, 0.263), but not in males (β, 0.035; 95 % CI: −0.136, 0.206), as shown in Fig. 7. The correlation strength between PRESS GSH levels and RCFT scores did not differ by sex (Z = −1.0802; P = 0.2800). RCFT scores were positively associated with PRESS GSH levels in the OC in males (β, 0.203; 95 % CI: 0.044, 0.362) and females (β, 0.136; 95 % CI: 0.011, 0.261), and this correlation strength did not differ by sex (Z = 1.0013; P = 0.3167).
3.5. Relationship between age and closed form GSH levels
Closed form GSH levels measured (ACC: 1 participant, PCC: 1 participant, and OC: 1 participant) were excluded from analysis. A trend toward correlation between age and closed form GSH levels was seen in the PCC (r = −0.590, P = 0.072). There was no significant correlation between closed form GSH levels and age in the ACC (r = −0.295, P = 0.409) or OC (r = 0.443, P = 0.200), as seen in the Fig. S1.
4. Discussion
To our knowledge, this is the first study to combine PRESS and HERMES to investigate age-related changes in brain antioxidant levels and their implications for cognitive function. We found that GSH levels measured by PRESS and HERMES decreased with age in the PCC. Furthermore, GSH levels measured by PRESS in both the PCC and OC were positively associated with visuospatial memory. However, only males showed a decrease in PRESS GSH levels in the ACC with age, and only females showed an association of lower PRESS GSH levels in the PCC with poorer visuospatial memory.
GSH plays a crucial role in protecting against OS and is consumed during protective antioxidant processes. In the present study, GSH levels in the PCC, measured by both PRESS and HERMES, gradually decreased with age, indicating that OS in the PCC increases with age. Consistent with our results, previous animal studies have found that aging is associated with decreased GSH levels in the rat cerebral cortex (Iantomasi et al., 1993; Liu, 2002). The brain is more prone to OS due to its high metabolic rate (Ng et al., 2008). As a core node of the default mode network (Harrison et al., 2008), the PCC has the highest metabolic rate in the cerebral cortex in the resting state (Raichle et al., 2001). Therefore, as the brain ages, the PCC may become more susceptible to OS due to its high metabolism, which could result in increased GSH consumption. The close relationship between amyloid β (Aβ) and OS has been confirmed by numerous studies (Tamagno et al., 2021). Significant accumulation of fibrillar Aβ has been observed in the PCC relative to other brain regions in early-onset AD patients using positron emission tomography (PET) (Insel et al., 2020). Furthermore, a recent MRS-PET study found that GSH levels in the parietal lobe were negatively correlated with Aβ accumulation in healthy individuals (Chiang et al., 2017). Taken together, these results might reflect increased consumption of GSH in the PCC during aging.
Additionally, Glutathione peroxidase (GPX) is an essential antioxidant that plays a crucial role in reductively neutralizing hydrogen peroxide and lipid hydroperoxides by utilizing GSH (Ighodaro and Akinloye, 2018). This reaction results in the oxidation of GSH to form Glutathione disulfide (GSSG) (Lubos et al., 2011). In the human body, glutathione exists in two forms: thiol-reduced (GSH) and disulfide-oxidized (GSSG), with GSH being the predominant form (Lu, 2013). Age-related studies have revealed that the activity of GPX increases with age in specific regions of the mouse brain, including the caudate nucleus, frontal cortex, hippocampus, and brainstem (Hussain et al., 1995), as well as in the parietal lobe of rats (Ciriolo et al., 1991). This could be a protective response to counteract the amplified oxidative stress during the aging process.
Furthermore, research conducted on rats has demonstrated a significant decrease in GSH levels in the cortex, striatum, midbrain, and cerebellum, accompanied by a notable increase in GSSG levels with age, resulting in a substantial decline in the GSH/GSSG ratio (Zhu et al., 2006). Additionally, postmortem studies have identified an elevation in GSSG levels in the caudate nucleus of older individuals (Tong et al., 2016), potentially attributable to heightened oxidative stress during the aging process. Although the direct detection of GPX and GSSG in the living human brain is currently unattainable, the aforementioned research findings provide robust support for our results.
In the present study, we found no correlation between GSH levels and age in the ACC and OC, which may suggest different relationships between OS and aging in different brain regions. It should be noted that there was a trend of a negative correlation between PRESS GSH levels and age in the OC, which is partially consistent with a previous MEGA-PRESS study at 4 Tesla that found decreased GSH levels in the OC in elderly healthy adults compared with young adults (Emir et al., 2011). Consistent with our study, a 7T MRS study did not observe a significant correlation between ACC GSH levels and age in healthy individuals (Brandt et al., 2016). In contrast, a HERMES study reported that GSH levels in the frontal lobe and sensorimotor cortex of elderly adults were higher than those in young adults (Hupfeld et al., 2021). Two possible reasons for this discrepancy are the target regions of interest for spectroscopy and the sample size (37 young and 23 older adults) in the studies.
Recently, there has been significant interest in the conformational dynamics of intracellular GSH among researchers (Delalande et al., 2010; Qi et al., 2012). Studies have revealed the high sensitivity of GSH to environmental changes, primarily attributed to its cysteine (Cys) residue. Under local fluctuations in oxygen tension, the thiol groups within monomeric GSH undergo diverse conformational transitions (Ying et al., 2007). Nuclear magnetic resonance (NMR) investigations have provided experimental evidence for the shift in chemical shifts of Cys β-CH2 in GSH solutions containing iron, specifically from 2.80 ppm to 2.95 and 3.2 ppm (Qi et al., 2012). This shift suggests that there are both closed and extended conformations of GSH. Moreover, NMR analyses of GSH solutions under anaerobic (2.80 ppm) (Delalande et al., 2010; Duddeck et al., 2013) and aerobic conditions (2.95 ppm) (Govindaraju et al., 2000; Kato et al., 1999; Kennett et al., 2005) have detected chemical shift signals for both the closed form and extended form GSH’s Cys β-CH2.
A considerable amount of research has utilized MEGA-PRESS to detect closed form GSH (GSHcl) and extended form GSH (GSHex) in the brains of both healthy individuals (Mandal et al., 2023; Shukla et al., 2018) and AD patients (Mandal et al., 2022; Shukla et al., 2020). A multicenter study conducted on a healthy population confirmed the viability of MEGA-PRESS for detecting both the GSHcl and GSHex in the human brain (Shukla et al., 2018). Another study using MEGA-PRESS revealed that the distribution of the GSHcl in the brains of healthy individuals is non-uniform, with higher abundance observed in the ACC, PCC, left parietal cortex, left hippocampus, and cerebellum compared to the GSHex (Mandal et al., 2023). Additionally, one MEGA-PRESS study found reduced levels of GSHcl in the left hippocampus of AD patients compared to healthy individuals (Mandal et al., 2022). Another study identified GSHcl in the ACC and PCC as a potential biomarker for AD (Shukla et al., 2020).
In our supplementary experiment, we employed MEGA-PRESS to quantify the levels of GSHcl in the ACC, PCC and OC of 15 participants. Our results revealed no significant correlation between age and GSHcl levels in the ACC and OC, which is consistent with the findings of the main study on GSHex. Moreover, in the supplementary experiment, a discernible trend of decreasing GSHcl levels with advancing age was observed specifically within the PCC. The relatively smaller sample size employed in the supplementary analysis could potentially account for the partial incongruity between the PCC results and those reported in the main study.
In the present study, positive correlations were found between RCFT scores and GSH levels in the PCC and OC, indicating that lower GSH levels are associated with poorer visuospatial memory. The PCC plays a critical role in spatial memory function (Burles et al., 2017; 2018; Maddock et al., 2001). Recent studies also suggest that the PCC supports integration of visual spatial information (Conti and Irish, 2021). The OC is crucial for supporting visual spatial processing (Rehman and Al Khalili, 2019) and plays an important role in encoding visual spatial information (Beyh et al., 2022).
Previous studies have reported significant deficits in spatial memory in mice and rats after depletion of cortical GSH levels using intraperitoneal injection of 2-cyclohexene-1-one, which affects GSH levels by conjugating with the S-transferase pathway (Dean et al., 2009). Moreover, rescue of depleted GSH levels in the cortex by N-acetyl-l-cysteine, a GSH precursor, restored spatial memory deficits in rats (Choy et al., 2010). Our findings of a positive correlation between GSH levels and RCFT scores may indicate that decreased GSH levels in the PCC and OC induce OS, resulting in neuronal death and synaptic dysfunction (Ionescu-Tucker and Cotman, 2021) and ultimately leading to spatial cognitive decline. Interestingly, we found no correlations between GSH levels and MOCA or SDMT scores, which is consistent with previous MRS studies(Emir et al., 2011; Hupfeld et al., 2021). Thus, GSH levels in the PCC or OC could potentially serve as important predictors of visuospatial memory.
After dividing participants into two groups by sex, we found that only males showed a decrease of PRESS GSH levels in the ACC with age and a significant group difference in the relationship between GSH levels and age. This finding may reflect a weaker antioxidant defense system in the ACC in males. In line with our findings, a previous animal study reported a lower antioxidant capacity during aging in male rat brains than in female rat brains (Guevara et al., 2011). There is evidence that the male mouse brain is more susceptible to OS due to lower levels of paraoxonase-2, which is an antioxidant enzyme positively modulated by estradiol (Giordano et al., 2013). Moreover, paraoxonase-2 levels are substantially higher in female primate brains than in male primate brains (Jamwal et al., 2021). However, there was a significant decrease in GSH levels in the PCC with age in both males and females. As mentioned above, the PCC has a higher resting metabolic rate than other brain regions. Despite the greater antioxidant capacity of female brains, it may be difficult to balance OS due to the high-intensity metabolism of the PCC.
The present study found a significant nonlinear relationship between GSH levels in the PCC with age in males and differences in the GSH level timecourse between males and females. Specifically, in males, GSH levels decreased with age before 45 and remained stable after 45; in females, GSH levels remained stable before age 45 and decreased with age after 45. One potential cause of differences in the GSH level timecourse is the effects of sex hormones. As described above, estradiol positively regulates paraoxonase-2. During menopause, women experience a sharp decrease in estradiol secretion due to ovarian aging. Interestingly, the turning point in the GSH level timecourse of females (age 45) is within the period of menopause. Moreover, it has been demonstrated that the antioxidant defense system is impaired in female mice brains after ovariectomy (Gaignard et al., 2017). In the present study, only females showed a significant correlation between GSH levels in the PCC and RCFT scores, suggesting that female visuospatial memory is more susceptible to GSH levels. Numerous rodent studies have shown that estrogen has protective effects on spatial cognition (Russell et al., 2019), and estrogen is capable of reducing OS by increasing paraoxonase-2 levels (Giordano et al., 2013). Thus, there may be a complex interaction between brain GSH levels, estrogen, and spatial cognition that warrants further investigation.
Lastly, this study is subject to several limitations. First, due to the long HERMES scanning time, GSH levels were only measured in three brain regions. As a result, several important brain regions related to cognition were not included in our study, such as the hippocampus and dorsolateral prefrontal cortex. Second, our participant sample did not cover the entire human lifespan (participants were 20–70 years old). Future studies should extend the age range or utilize meta-analysis to integrate multiple studies to investigate how brain GSH levels vary over the lifespan. Third, large volume MRS VOIs were used in this study due to the low GSH levels and resonances of GSH overlapping with other metabolites. There is potential for future MRS studies using 7 Tesla scanners to provide more detailed analyses of target brain regions by using ROIs with a smaller volume. Fourth, with a substantial proportion of female subjects in this experiment, we did not account for the potential influence of the menstrual cycle on the results. However, it is also found that there is no difference in the levels of GSH in women’s blood between ovulatory and non-ovulatory periods (Lutosławska et al., 2003). Fifth, Measurement of intra-cerebral GSH using non-edited MRS is challenging because resonances of GSH overlap with other metabolite such as creatine, and the concentration of GSH is relatively low. However, only partial results of this study were detected using PRESS, and prior research has demonstrated that employing a short TE (30 ms) in PRESS can facilitate accurate and reproducible quantification of GSH (Wijtenburg et al., 2019).
5. Conclusion
Our findings demonstrate a decrease in extended form GSH levels with age in the PCC, but not other brain regions. This result suggests that the PCC is more susceptible to OS during brain aging. Moreover, we found that the timecourse of extended form GSH level changes in the PCC and ACC differed between males and females, suggesting that OS levels may be influenced by sex hormones. Importantly, positive correlations were found between RCFT scores and extended form GSH levels in the PCC and OC after controlling for age, sex, education level, and quality of the spectroscopy, suggesting that GSH levels could serve as a predictor of visuospatial memory. Overall, these findings provide valuable insights into the relationship between brain antioxidant levels and aging or cognitive function, providing a normative foundation for investigating the neurochemical underpinnings of healthy aging.
Supplementary Material
Acknowledgments
This work was supported by the National Natural Science Foundation of China (Nos. 81601479, 82222064), National Key Research and Development Program (No. 2022YFC2010100), Taishan Scholars Project (No. tsqn201812147), Shandong Provincial Natural Science Foundation of China (Nos. ZR2021MH030, ZR2021MH355), Jinan Science and Technology Development Program of China (No. 202019098), and the Academic Promotion Programme of Shandong First Medical University (No. 2019QL023). This work was also supported by NIH R01 EB016089, R01 EB023963, and P41 EB031771. The authors are grateful for the technical assistance provided by Liangjie Lin from Philips Healthcare.
Footnotes
CRediT authorship contribution statement
Xin Hu: Writing – original draft, Methodology, Formal analysis, Data curation, Conceptualization. Keyu Pan: Writing – original draft, Methodology, Formal analysis. Min Zhao: Resources, Data curation. Jiali Lv: Software, Investigation. Jing Wang: Data curation. Xiaofeng Zhang: Software, Investigation. Yuxi Liu: Data curation. Yulu Song: Software, Formal analysis. Aaron T. Gudmundson: Resources. Richard A.E. Edden: Validation, Supervision. Fuxin Ren: Visualization, Software. Tao Zhang: Supervision, Methodology, Conceptualization. Fei Gao: Writing – review & editing, Supervision, Methodology, Funding acquisition, Conceptualization.
Declaration of competing interest
None to disclose
Supplementary materials
Supplementary material associated with this article can be found, in the online version, at doi:10.1016/j.neuroimage.2024.120632.
Data availability
Data will be made available on request.
References
- Aiello LC, Wheeler P, 1995. The expensive-tissue hypothesis: the brain and the digestive system in human and primate evolution. Curr. Anthropol 36, 199–221. [Google Scholar]
- Ashburner J, Friston KJ, 2005. Unified segmentation. Neuroimage 26, 839–851. [DOI] [PubMed] [Google Scholar]
- Beyh A, Dell’Acqua F, Cancemi D, De Santiago Requejo F, Ffytche D, Catani M, 2022. The medial occipital longitudinal tract supports early stage encoding of visuospatial information. Commun. Biol 5, 318. [DOI] [PMC free article] [PubMed] [Google Scholar]
- Brandt AS, Unschuld PG, Pradhan S, Lim IAL, Churchill G, Harris AD, Hua J, Barker PB, Ross CA, Van Zijl PCM, Edden RAE, Margolis RL, 2016. Age-related changes in anterior cingulate cortex glutamate in schizophrenia: a 1H MRS Study at 7Tesla. Schizophr. Res 172, 101. [DOI] [PMC free article] [PubMed] [Google Scholar]
- Burles F, Slone E, Iaria G, 2017. Dorso-medial and ventro-lateral functional specialization of the human retrosplenial complex in spatial updating and orienting. Brain Struct. Funct. 222, 1481–1493. [DOI] [PubMed] [Google Scholar]
- Burles F, Umiltá A, McFarlane LH, Potocki K, Iaria G, 2018. Ventral—Dorsal functional contribution of the posterior cingulate cortex in human spatial orientation: a meta-analysis. Front. Hum. Neurosci 12, 190. [DOI] [PMC free article] [PubMed] [Google Scholar]
- Chiang GC, Mao X, Kang G, Chang E, Pandya S, Vallabhajosula S, Isaacson R, Ravdin LD, Shungu DC, 2017. Relationships among cortical glutathione levels, brain amyloidosis, and memory in healthy older adults investigated in vivo with 1H-MRS and Pittsburgh compound-B PET. Am. J. Neuroradiol 38, 1130–1137. [DOI] [PMC free article] [PubMed] [Google Scholar]
- Choi IY, Lee P, 2013. Doubly selective multiple quantum chemical shift imaging and T1 relaxation time measurement of glutathione (GSH) in the human brain in vivo. NMR Biomed 26, 28–34. [DOI] [PMC free article] [PubMed] [Google Scholar]
- Choy KHC, Dean O, Berk M, Bush AI, van den Buuse M, 2010. Effects of N-acetylcysteine treatment on glutathione depletion and a short-term spatial memory deficit in 2-cyclohexene-1-one-treated rats. Eur. J. Pharmacol 649, 224–228. [DOI] [PubMed] [Google Scholar]
- Ciriolo M, Fiskin K, De Martino A, Corasaniti M, Nistico G, Rotilio G, 1991. Age-releated changes in Cu, Zn superoxide dismutase, Se-dependent and-independent glutathione peroxidase and catalase activities in specific areas of rat brain. Mech. Ageing Dev 61, 287–297. [DOI] [PubMed] [Google Scholar]
- Conti F, Irish M, 2021. Harnessing visual imagery and oculomotor behaviour to understand prospection. Trends Cogn. Sci 25, 272–283 (Regul. Ed.). [DOI] [PubMed] [Google Scholar]
- Dasari S, Ganjayi M, Oruganti L, Balaji H, Meriga B, 2017. Glutathione S-transferases detoxify endogenous and exogenous toxic agents-minireview. J. Dairy Vet. Anim. Res 5, 00154. [Google Scholar]
- Dean O, Bush AI, Berk M, Copolov DL, van den Buuse M, 2009. Glutathione depletion in the brain disrupts short-term spatial memory in the Y-maze in rats and mice. Behav. Brain Res 198, 258–262. [DOI] [PubMed] [Google Scholar]
- Delalande O, Desvaux H, Godat E, Valleix A, Junot C, Labarre J, Boulard Y, 2010. Cadmium–glutathione solution structures provide new insights into heavy metal detoxification. FEBS J 277, 5086–5096. [DOI] [PubMed] [Google Scholar]
- Duddeck H, Dietrich W, Tóth G, 2013. Structure Elucidation By Modern NMR: a Workbook. Springer Science & Business Media. [Google Scholar]
- Duffy SL, Lagopoulos J, Hickie IB, Diamond K, Graeber MB, Lewis SJ, Naismith SL, 2014. Glutathione relates to neuropsychological functioning in mild cognitive impairment. Alzheimers. Dement 10, 67–75. [DOI] [PubMed] [Google Scholar]
- Emir UE, Raatz S, McPherson S, Hodges JS, Torkelson C, Tawfik P, White T, Terpstra M, 2011. Noninvasive quantification of ascorbate and glutathione concentration in the elderly human brain. NMR Biomed 24, 888–894. [DOI] [PMC free article] [PubMed] [Google Scholar]
- Gaignard P, Liere P, Thérond P, Schumacher M, Slama A, Guennoun R, 2017. Role of sex hormones on brain mitochondrial function, with special reference to aging and neurodegenerative diseases. Front. Aging Neurosci 9, 406. [DOI] [PMC free article] [PubMed] [Google Scholar]
- Gasparovic C, Song T, Devier D, Bockholt HJ, Caprihan A, Mullins PG, Posse S, Jung RE, Morrison LA, 2006. Use of tissue water as a concentration reference for proton spectroscopic imaging. Magn. Reson. Med 55, 1219–1226. [DOI] [PubMed] [Google Scholar]
- Gasquoine PG, 2013. Localization of function in anterior cingulate cortex: from psychosurgery to functional neuroimaging. Neurosci. Biobehav. Rev 37, 340–348. [DOI] [PubMed] [Google Scholar]
- Giordano G, Tait L, Furlong C, Cole T, Kavanagh T, Costa L, 2013. Gender differences in brain susceptibility to oxidative stress are mediated by levels of paraoxonase-2 expression. Free Radic. Biol. Med 58, 98–108. [DOI] [PMC free article] [PubMed] [Google Scholar]
- Govindaraju V, Young K, Maudsley AA, 2000. Proton NMR chemical shifts and coupling constants for brain metabolites. NMR Biomed 13, 129–153. [DOI] [PubMed] [Google Scholar]
- Guevara R, Gianotti M, Oliver J, Roca P, 2011. Age and sex-related changes in rat brain mitochondrial oxidative status. Exp. Gerontol 46, 923–928. [DOI] [PubMed] [Google Scholar]
- Harrison BJ, Pujol J, López-Solà M, Hernández-Ribas R, Deus J, Ortiz H, Soriano-Mas C, Yücel M, Pantelis C, Cardoner N, 2008. Consistency and functional specialization in the default mode brain network. Proc. Natl. Acad. Sci 105, 9781–9786. [DOI] [PMC free article] [PubMed] [Google Scholar]
- Hupfeld KE, Hyatt HW, Alvarez Jerez P, Mikkelsen M, Hass CJ, Edden RAE, Seidler RD, Porges EC, 2021. In vivo brain glutathione is higher in older age and correlates with mobility. Cereb. Cortex 31, 4576–4594. [DOI] [PMC free article] [PubMed] [Google Scholar]
- Jr Hussain S, Slikker W, Ali S, 1995. Age-related changes in antioxidant enzymes, superoxide dismutase, catalase, glutathione peroxidase and glutathione in different regions of mouse brain. Int. J. Dev. Neurosci 13, 811–817. [DOI] [PubMed] [Google Scholar]
- Iantomasi T, Favilli F, Marraccini P, Stio M, Treves C, Quatrone A, Capaccioli S, Vincenzini MT, 1993. Age and GSH metabolism in rat cerebral cortex, as related to oxidative and energy parameters. Mech. Ageing Dev 70, 65–82. [DOI] [PubMed] [Google Scholar]
- Ighodaro O, Akinloye O, 2018. First line defence antioxidants-superoxide dismutase (SOD), catalase (CAT) and glutathione peroxidase (GPX): their fundamental role in the entire antioxidant defence grid. Alex. J. Med 54, 287–293. [Google Scholar]
- Insel PS, Mormino EC, Aisen PS, Thompson WK, Donohue MC, 2020. Neuroanatomical spread of amyloid β and tau in Alzheimer’s disease: implications for primary prevention. Brain Commun 2 fcaa007. [DOI] [PMC free article] [PubMed] [Google Scholar]
- Ionescu-Tucker A, Cotman CW, 2021. Emerging roles of oxidative stress in brain aging and Alzheimer’s disease. Neurobiol. Aging 107, 86–95. [DOI] [PubMed] [Google Scholar]
- Jamwal S, Blackburn JK, Elsworth JD, 2021. Sex-based disparity in paraoxonase-2 expression in the brains of African green monkeys. Free Radic. Biol. Med 167, 201–204. [DOI] [PMC free article] [PubMed] [Google Scholar]
- Kato N, Nakamura M, Uchiyama T, 1999. 1H NMR studies of the reactions of copper (I) and copper (II) with D-penicillamine and glutathione. J. Inorg. Biochem 75, 117–121. [DOI] [PubMed] [Google Scholar]
- Kennett EC, Bubb WA, Bansal P, Alewood P, Kuchel PW, 2005. NMR studies of exchange between intra-and extracellular glutathione in human erythrocytes. Redox Rep 10, 83–90. [DOI] [PubMed] [Google Scholar]
- Leech R, Sharp DJ, 2014. The role of the posterior cingulate cortex in cognition and disease. Brain 137, 12–32. [DOI] [PMC free article] [PubMed] [Google Scholar]
- Liu RM, 2002. Down-regulation of γ-glutamylcysteine synthetase regulatory subunit gene expression in rat brain tissue during aging. J. Neurosci. Res 68, 344–351. [DOI] [PubMed] [Google Scholar]
- Lu H, Nagae-Poetscher LM, Golay X, Lin D, Pomper M, Van Zijl PC, 2005. Routine clinical brain MRI sequences for use at 3.0 Tesla. J. Magn. Reson. Imaging 22, 13–22. [DOI] [PubMed] [Google Scholar]
- Lu SC, 2013. Glutathione synthesis. Biochim. Biophys. Acta 1830, 3143–3153. General Subjects. [DOI] [PMC free article] [PubMed] [Google Scholar]
- Lubos E, Loscalzo J, Handy DE, 2011. Glutathione peroxidase-1 in health and disease: from molecular mechanisms to therapeutic opportunities. Antioxid. Redox. Signal 15, 1957–1997. [DOI] [PMC free article] [PubMed] [Google Scholar]
- Lutosławska G, Tkaczyk J, Panczenko-Kresowska B, Hübner-Woźniak E, Skierska E, Gajewski AK, 2003. Plasma TBARS, blood GSH concentrations, and erythrocyte antioxidant enzyme activities in regularly menstruating women with ovulatory and anovulatory menstrual cycles. Clin. Chim. Acta 331, 159–163. [DOI] [PubMed] [Google Scholar]
- Maddock RJ, Garrett AS, Buonocore MH, 2001. Remembering familiar people: the posterior cingulate cortex and autobiographical memory retrieval. Neuroscience 104, 667–676. [DOI] [PubMed] [Google Scholar]
- Maher P, 2005. The effects of stress and aging on glutathione metabolism. Ageing Res. Rev 4, 288–314. [DOI] [PubMed] [Google Scholar]
- Mandal PK, Goel A, Bush AI, Punjabi K, Joon S, Mishra R, Tripathi M, Garg A, Kumar NK, Sharma P, Shukla D, Ayton SJ, Fazlollahi A, Maroon JC, Dwivedi D, Samkaria A, Sandal K, Megha K, Shandilya S, 2022. Hippocampal glutathione depletion with enhanced iron level in patients with mild cognitive impairment and Alzheimer’s disease compared with healthy elderly participants. Brain Commun 4, fcac215. [DOI] [PMC free article] [PubMed] [Google Scholar]
- Mandal PK, Guha Roy R, Kalyani A, 2023. Distribution pattern of closed and extended forms of glutathione in the human brain: MR spectroscopic study. ACS Chem. Neurosci 14, 270–276. [DOI] [PubMed] [Google Scholar]
- Mandal PK, Saharan S, Tripathi M, Murari G, 2015. Brain glutathione levels–a novel biomarker for mild cognitive impairment and Alzheimer’s disease. Biol. Psychiatry 78, 702–710. [DOI] [PubMed] [Google Scholar]
- Mandal PK, Shukla D, Govind V, Boulard Y, Ersland L, 2017. Glutathione conformations and its implications for in vivo magnetic resonance spectroscopy. J. Alzheimer’s Dis 59, 537–541. [DOI] [PMC free article] [PubMed] [Google Scholar]
- Markesbery WR, 1997. Oxidative stress hypothesis in Alzheimer’s disease. Free Radic. Biol. Med 23, 134–147. [DOI] [PubMed] [Google Scholar]
- Mullins PG, McGonigle DJ, O’Gorman RL, Puts NA, Vidyasagar R, Evans CJ, Edden RA, 2014. Current practice in the use of MEGA-PRESS spectroscopy for the detection of GABA. Neuroimage 86, 43–52. [DOI] [PMC free article] [PubMed] [Google Scholar]
- Nasreddine ZS, Phillips NA, Bédirian V, Charbonneau S, Whitehead V, Collin I, Cummings JL, Chertkow H, 2005. The montreal cognitive assessment, MoCA: a brief screening tool for mild cognitive impairment. J. Am. Geriatr. Soc 53, 695–699. [DOI] [PubMed] [Google Scholar]
- Ng F, Berk M, Dean O, Bush A, 2008. Oxidative stress in psychiatric disorders: evidence base and therapeutic implications. Int. J. Neuropsychopharmacol 11, 851–876. [DOI] [PubMed] [Google Scholar]
- Oeltzschner G, Wijtenburg SA, Mikkelsen M, Edden RAE, Barker PB, Joo JH, Leoutsakos JS, Rowland LM, Workman CI, Smith GS, 2019. Neurometabolites and associations with cognitive deficits in mild cognitive impairment: a magnetic resonance spectroscopy study at 7 Tesla. Neurobiol. Aging 73, 211–218. [DOI] [PMC free article] [PubMed] [Google Scholar]
- Periáñez JA, Lubrini G, García-Gutiérrez A, Ríos-Lago M, 2021. Construct validity of the stroop color-word test: influence of speed of visual search, verbal fluency, working memory, cognitive flexibility, and conflict monitoring. Arch. Clin. Neuropsychol 36, 99–111. [DOI] [PubMed] [Google Scholar]
- Perry T, Hansen S, Gandham S, 1981. Postmortem changes of amino compounds in human and rat brain. J. Neurochem [DOI] [PubMed] [Google Scholar]
- Piechnik SK, Evans J, Bary L, Wise RG, Jezzard P, 2009. Functional changes in CSF volume estimated using measurement of water T2 relaxation. Magn. Reson. Med 61, 579–586. [DOI] [PubMed] [Google Scholar]
- Provencher SW, 1993. Estimation of metabolite concentrations from localized in vivo proton NMR spectra. Magn. Reson. Med 30, 672–679. [DOI] [PubMed] [Google Scholar]
- Qi W, Li J, Chain CY, Pasquevich GA, Pasquevich AF, Cowan JA, 2012. Glutathione complexed Fe–S centers. J. Am. Chem. Soc 134, 10745–10748. [DOI] [PMC free article] [PubMed] [Google Scholar]
- R Core Team R, 2013. R: a language and environment for statistical computing. R Foundation for Statistical Computing. [Google Scholar]
- Raichle ME, MacLeod AM, Snyder AZ, Powers WJ, Gusnard DA, Shulman GL, 2001. A default mode of brain function. Proc. Natl. Acad. Sci 98, 676–682. [DOI] [PMC free article] [PubMed] [Google Scholar]
- Rehman A, Al Khalili Y, 2019. Neuroanatomy, occipital lobe.StatPearls [Internet]. https://europepmc.org/article/nbk/nbk544320. [PubMed] [Google Scholar]
- Russell JK, Jones CK, Newhouse PA, 2019. The role of estrogen in brain and cognitive aging. Neurotherapeutics 16, 649–665. [DOI] [PMC free article] [PubMed] [Google Scholar]
- Ruszkiewicz JA, Miranda-Vizuete A, Tinkov AA, Skalnaya MG, Skalny AV, Tsatsakis A, Aschner M, 2019. Sex-specific differences in redox homeostasis in brain norm and disease. J. Mol. Neurosci 67, 312–342. [DOI] [PubMed] [Google Scholar]
- Saharan S, Mandal PK, 2014. The emerging role of glutathione in Alzheimer’s disease. J. Alzheimer’s Dis 40, 519–529. [DOI] [PubMed] [Google Scholar]
- Saleh MG, Oeltzschner G, Chan KL, Puts NA, Mikkelsen M, Schär M, Harris AD, Edden RA, 2016. Simultaneous edited MRS of GABA and glutathione. Neuroimage 142, 576–582. [DOI] [PMC free article] [PubMed] [Google Scholar]
- Saleh MG, Papantoni A, Mikkelsen M, Hu SCN, Oeltzschner G, Puts NA, Edden RAE, Carnell S, 2020. Effect of age on GABA and glutathione in a pediatric sample. AJNR Am. J. Neuroradiol 41, 1099–1104. [DOI] [PMC free article] [PubMed] [Google Scholar]
- Sanaei Nezhad F, Anton A, Parkes LM, Deakin B, Williams SR, 2017. Quantification of glutathione in the human brain by MR spectroscopy at 3 T esla: comparison of PRESS and MEGA-PRESS. Magn. Reson. Med 78, 1257–1266. [DOI] [PMC free article] [PubMed] [Google Scholar]
- Scheidegger M, Hock A, Fuchs A, Henning A, 2014. T2 relaxation times of 18 brain metabolites determined in 83 healthy volunteers in vivo. In: Proceedings of the Joint Annual Meeting ISMRM-ESMRMB, 2014. [Google Scholar]
- Shin MS, Park SY, Park SR, Seol SH, Kwon JS, 2006. Clinical and empirical applications of the rey-osterrieth complex figure test. Nat. Protoc 1, 892. [DOI] [PubMed] [Google Scholar]
- Shukla D, Mandal PK, Ersland L, Grüner ER, Tripathi M, Raghunathan P, Sharma A, Chaithya G, Punjabi K, Splaine C, 2018. A multi-center study on human brain glutathione conformation using magnetic resonance spectroscopy. J. Alzheimer’s Dis 66, 517–532. [DOI] [PMC free article] [PubMed] [Google Scholar]
- Shukla D, Mandal PK, Tripathi M, Vishwakarma G, Mishra R, Sandal K, 2020. Quantitation of in vivo brain glutathione conformers in cingulate cortex among age-matched control, MCI, and AD patients using MEGA-PRESS. Hum. Brain Mapp 41, 194–217. [DOI] [PMC free article] [PubMed] [Google Scholar]
- Song Y, Zollner HJ, Hui SCN, Hupfeld K, Oeltzschner G, Prisciandaro JJ, Edden R, 2022. Importance of linear combination modeling for quantification of glutathione and gamma-aminobutyric acid levels using hadamard-edited magnetic resonance spectroscopy. Front. Psychiatry 13, 872403. [DOI] [PMC free article] [PubMed] [Google Scholar]
- Sumien N, Cunningham JT, Davis DL, Engelland R, Fadeyibi O, Farmer GE, Mabry S, Mensah-Kane P, Trinh OT, Vann PH, Wilson EN, Cunningham RL, 2021. Neurodegenerative disease: roles for sex, hormones, and oxidative stress. Endocrinology 162. [DOI] [PMC free article] [PubMed] [Google Scholar]
- Tamagno E, Guglielmotto M, Vasciaveo V, Tabaton M, 2021. Oxidative stress and beta amyloid in Alzheimer’s disease. Which comes first: the chicken or the egg? Antioxidants 10, 1479. [DOI] [PMC free article] [PubMed] [Google Scholar]
- Tong J, Fitzmaurice PS, Moszczynska A, Mattina K, Ang LC, Boileau I, Furukawa Y, Sailasuta N, Kish SJ, 2016. Do glutathione levels decline in aging human brain? Free Radic. Biol. Med 93, 110–117. [DOI] [PubMed] [Google Scholar]
- Van Schependom J, D’Hooghe M B, Cleynhens K, D’Hooge M, Haelewyck MC, De Keyser J, Nagels G, 2014. The symbol digit modalities test as sentinel test for cognitive impairment in multiple sclerosis. Eur. J. Neurol. 21, e1271, 1219-1225-1212. [DOI] [PubMed] [Google Scholar]
- Venkateshappa C, Harish G, Mahadevan A, Srinivas Bharath MM, Shankar SK, 2012. Elevated oxidative stress and decreased antioxidant function in the human hippocampus and frontal cortex with increasing age: implications for neurodegeneration in Alzheimer’s disease. Neurochem. Res 37, 1601–1614. [DOI] [PubMed] [Google Scholar]
- Wansapura JP, Holland SK, Dunn RS, Ball WS, 1999. NMR relaxation times in the human brain at 3.0 tesla. J. Magn. Reson. Imaging 9, 531–538. [DOI] [PubMed] [Google Scholar]
- Wijtenburg SA, Near J, Korenic SA, Gaston FE, Chen H, Mikkelsen M, Chen S, Kochunov P, Hong LE, Rowland LM, 2019. Comparing the reproducibility of commonly used magnetic resonance spectroscopy techniques to quantify cerebral glutathione. J. Magn. Reson. Imaging 49, 176–183. [DOI] [PMC free article] [PubMed] [Google Scholar]
- Wu G, Fang YZ, Yang S, Lupton JR, Turner ND, 2004. Glutathione metabolism and its implications for health. J. Nutr 134, 489–492. [DOI] [PubMed] [Google Scholar]
- Yie LI, Liu XY, Wang XM, 2002. Brain aging and neurodegenerative diseases. Basic Med. Sci. Clin [Google Scholar]
- Ying J, Clavreul N, Sethuraman M, Adachi T, Cohen RA, 2007. Thiol oxidation in signaling and response to stress: detection and quantification of physiological and pathophysiological thiol modifications. Free Radic. Biol. Med 43, 1099–1108. [DOI] [PMC free article] [PubMed] [Google Scholar]
- Zhao Q, Lv Y, Zhou Y, Hong Z, Guo Q, 2012. Short-term delayed recall of auditory verbal learning test is equivalent to long-term delayed recall for identifying amnestic mild cognitive impairment. PLoS One 7, e51157. [DOI] [PMC free article] [PubMed] [Google Scholar]
- Zhu Y, Carvey PM, Ling Z, 2006. Age-related changes in glutathione and glutathione-related enzymes in rat brain. Brain Res 1090, 35–44. [DOI] [PMC free article] [PubMed] [Google Scholar]
Associated Data
This section collects any data citations, data availability statements, or supplementary materials included in this article.
Supplementary Materials
Data Availability Statement
Data will be made available on request.