Abstract
The use of flavins and flavoproteins in photocatalytic, sensing, and biotechnological applications has led to a growing interest in computationally modeling the excited-state electronic structure and photophysics of flavin. However, there is limited consensus regarding which computational methods are appropriate for modeling flavin’s photophysics. We compare the energies of low-lying excited states of flavin computed with time-dependent density functional theory (TD-DFT), equation-of-motion coupled cluster (EOM-EE-CCSD), scaled opposite-spin configuration interaction [SOS-CIS(D)], multiconfiguration pair-density functional theory (MC-PDFT), and several multireference perturbation theory (MR-PT2) methods. In the first part, we focus on excitation energies of the first singlet excited state (S1) of five different redox and protonation states of flavin, with the goal of finding a suitable active space for MR-PT2 calculations. In the second part, we construct two sets of one-dimensional potential energy surfaces connecting the S0 and S1 equilibrium geometries (S0–S1 path) and the S1 (π,π*) and S2 (n,π*) equilibrium geometries (S1–S2 path). The first path therefore follows a Franck–Condon active mode of flavin while the second path maps crossings points between low-lying singlet and triplet states in flavin. We discuss the similarities and differences in the TD-DFT, EOM-EE-CCSD, SOS-CIS(D), MC-PDFT and MR-PT2 energy profiles along these paths. We find that (TD-)DFT methods are suitable for applications such as simulating the spectra of flavins but are inconsistent with several other methods when used for some geometry optimizations and when describing the energetics of dark (n,π*) states. MR-PT2 methods show promise for the simulation of flavin’s low-lying excited states, but the selection of orbitals for the active space and the number of roots used for state averaging must be done carefully to avoid artifacts. Some properties, such as the intersystem crossing geometry and energy between the S1 (π,π*) and T2 (n,π*) states, may require additional benchmarking before they can be determined quantitatively.
Introduction
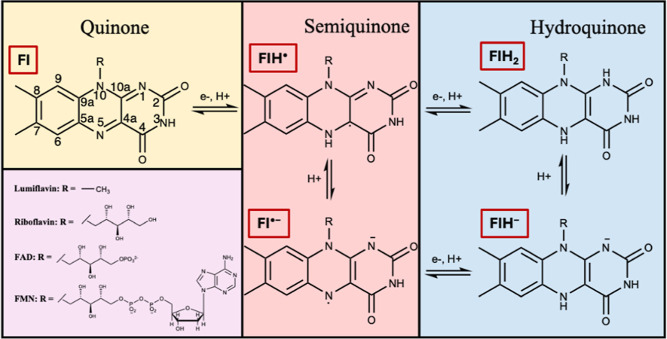
Flavins are cofactors in several classes of enzymes and in photoreceptor proteins, where they are typically bound as either flavin mononucleotide (FMN) or flavin adenine dinucleotide (FAD). Flavins are often encountered in one of three redox states: the oxidized quinone (Fl), the one-electron reduced radical semiquinone (FlH•), and the two-electron fully reduced hydroquinone (FlH2). The pKa values of these states are 10.3, 8.3, and 6.7 in aqueous solutions, respectively.1−3 Therefore, the semiquinone and hydroquinone redox states are frequently also encountered in their deprotonated anionic forms, Fl•– and FlH–, under physiological conditions (Figure 1). These redox and protonation states play an important role in either coupled or stepwise electron and/or proton transfer reactions (Figure 1). Here, we refer collectively to FMN, FAD, riboflavin, and lumiflavin (LF) as flavins, since they all share the same tricyclic 7,8-dimethyl alloxazine group.
Figure 1.
Structure of flavins in different redox and protonation states. The atom numbering is shown for the quinone (Fl) structure.
Flavin cofactors catalyze an impressive range of chemical transformations in different enzymes and are involved in several primary and secondary metabolic pathways.4−7 Flavoproteins are critical to all the main energy generation metabolisms8 including photosynthesis,9 aerobic and anaerobic respiration,10−12 and denitrification.13,14 Flavins also serve as chromophores in several photoreceptors and light-responsive enzymes including cryptochromes,15 LOV domains (phototropins),16 BLUF,17 and DNA photolyases.18,19
In its oxidized form, flavin has two absorption bands in the near-UV and visible range, one band centered around 450 nm, associated with excitation to the first singlet excited state (S1), and a second band at around 380 nm associated with excitation to a higher singlet excited state. These absorption wavelengths are relatively insensitive to the solvent or protein environment.20,21 Both of those states have π,π* excitation character. Other low-lying excited states also exist in that energy range, including triplet states and singlet states, but those states have substantially smaller oscillator strengths (extinction coefficients) and do not appear in the UV/visible spectrum. Even though such dark states do not get directly excited, they can play an important role in flavins’ photophysics, as exemplified by LOV domains that undergo intersystem crossing (ISC) followed by adduct formation.22,23
Blue light absorption excites flavin to its S1 state. Higher energy (near-UV or UV) absorption also ultimately populates the same state after a series of internal conversions and vibrational relaxations, per Kasha’s rule.24 Therefore, flavin’s S1 state often acts as the launch pad for flavin’s further photophysics. From there, flavin may undergo fluorescence,25−27 ISC to a triplet state,25,28 electron transfer,29 or photochemical reactions, forming adducts and derivatives with neighboring amino acids.23,30−32 These photophysical properties have been harnessed in applications including biosensing, bioimaging, optogenetics, singlet oxygen generation, and FRET spectroscopy.25,28,33−35
Unlike the π,π* transitions responsible for flavins’ two UV/visible absorption bands, the energies of flavin’s low-lying dark states, especially those having n,π* character, can be sensitive to interactions with a solvent or protein.21,36,37 Since those states are relevant to flavin’s photophysics, computational modeling can be a powerful tool to study their energetics in different protein environments. However, most computational studies on flavins have focused on their ground state or on bright excited states. Several studies have shown that time-dependent density functional theory (TD-DFT) is suitable for simulating flavin’s UV/visible spectra when accounting for Franck–Condon factors.21,37−39 On the other hand, TD-DFT has not been as thoroughly tested for describing excited states relevant to flavin’s photophysics, including triplet, n,π*, or redox states.
When dealing with a manifold of excited states that are close together in energy, multiconfigurational wave function methods such as complete active-space self-consistent field (CASSCF)40 are suitable. In CASSCF, a full configuration interaction is carried out for select electrons and orbitals (the active space). While CASSCF misses dynamical electron correlation for electrons outside of the active space, post-CASSCF (multireference) methods can be used to correct for this missing correlation. Second-order multireference perturbation (MR-PT2) theories such as single state (SS-)CASPT2 and multistate (MS-)CASPT2 are widely used.41,42 More recently, to address issues with artifacts in SS-CASPT2 and MS-CASPT2 arising at near-degeneracies of the underlying CASSCF reference wave function, methods like the extended multistate (XMS) CASPT243 and extended dynamically weighted (XDW) CASPT244 have been developed. The former employs a treatment of the zeroth order Hamiltonian proposed as by Granovsky45 which removes the artifacts but alters the energy of the states of interest compared to MS-CASPT2. The latter approach, XDW-CASPT2, also addresses the artifacts but largely preserves the energies of the MS-CASPT2 states.
An alternative approach for accounting for static and dynamical electron correlation is the multiconfiguration pair-density functional theory (MC-PDFT),46,47 which combines favorable characteristics of CASSCF and DFT. MC-PDFT has been used in a range of applications from transition metal chemistry to mechanistic studies on biological photoreceptors.48,49
Several methods, including semiempirical, TD-DFT, and multireference (often, MR-PT2) methods have been used already to calculate the excited-state properties of flavins.21,36−39,50−81 For multireference calculations, the issue of active space selection is a recurring theme and a decision is often made that balances computational cost and computational accuracy due to the steep increase in computing time with the size of the active space. Automated protocols to select the active space have been developed by several research groups.74,82−86 Sayfutyarova and Hammes-Schiffer applied their automated protocol that is based on Hückel theory for the selection of a suitable active space for flavin’s π-conjugated orbitals.74 However, the choice of active space is also dependent on the problems and states of interest. For example, for calculating bright π,π* transitions, it is often adequate to include only π electrons and π and π* orbitals in the active space. For the calculation of dark n,π* states, however, including nonbonding orbitals in the active space is required. Therefore, there is still a need to tailor active spaces not only to the system but also to the problem of interest.
We present a benchmark study focused on flavin’s low-lying excited states that are relevant to flavin’s early photophysics. We focus on LF (Figure 1), a minimal flavin model that contains the spectroscopically and photochemically relevant isoalloxazine tricyclic moiety. We test several TD-DFT functionals, equation-of-motion coupled cluster (EOM-EE-CCSD),87,88 scaled opposite-spin configuration interaction [SOS-CIS(D)],89 MC-PDFT, and several MR-PT2 methods. For MR-PT2, we present the effect of modifying parameters including the active spaces and state averaging. We initially focus on excitation energies to the S1 excited state of each redox state. We then move on to potential energy scans (PESs) of low-lying excited states, tracing the coordinates from the Franck–Condon point (at the ground state optimized geometry) to the S1 (π,π*) minimum and then from the S1 (π,π*) minimum to the S2 (n,π*) minimum. These scans are used to probe the reliability of different methods across key geometries and state crossing points.
Methods
Vertical Excitation Calculations
Each of the five redox states of LF shown in Figure 1 (Fl, FlH•, Fl•–, FlH–, FlH2) were optimized in the gas phase using second-order Møller–Plesset perturbation theory (MP2) with the correlation-consistent polarized valence triple-ζ (cc-pVTZ) basis set. The optimizations were performed without the use of symmetry. In the case of Fl, FlH•, and Fl•–, the isoalloxazine ring remains planar during the optimization. However, FlH– and FlH2 are bent at the central ring at their equilibrium geometry, exhibiting what has been referred to as a butterfly bend.21,90−92
Vertical excitation energies (VEEs) were computed using CASSCF, MC-PDFT, SS-CASPT2, MS-CASPT2, XMS-CASPT2, and XDW-CASPT2. Energies were also computed using TD-DFT with the B3LYP functional, which has been shown to give adiabatic excitation energies (AEEs) for the oxidized form of flavin consistent with experiments.21,38,39,61 The TD-DFT calculations were carried out using cc-pVTZ, while the ANO-L-VDZP basis set was used for the CASSCF, MC-PDFT, and MR-PT2 calculations.
To determine a suitable starting point for the active space, orbital entanglement calculations were carried out at the CASSCF density matrix renormalization group (CASSCF-DMRG) level of theory86,93 and ANO-L-VDZP basis set. Orbital entanglement figures were generated using autoCAS,94 and served as starting point for the selection of the active space orbitals for CASSCF and multireference calculations. The number of active space orbitals and electrons were gradually reduced based on their occupancy to test the effect of using a smaller active space on the excitation energies. The number of roots used in the state averaging was also benchmarked.
To mitigate the issue of intruder states in MR-PT2 calculations, an imaginary shift of 0.2 hartree was used.95 We tried using a real shift, which gave similar energies except for a few spurious spikes in the excitation energy for some geometries.96,97 We also tested the effect of applying a shifted zeroth-order Hamiltonian (IPEA shift) utilizing the default value of 0.25 atomic units.98 The IPEA shift is often used as an approximate correction for an unbalanced description of open-shell and closed shell electronic states, although it may not be needed if a sufficiently large basis set and active space is used.99
Potential Energy Scans
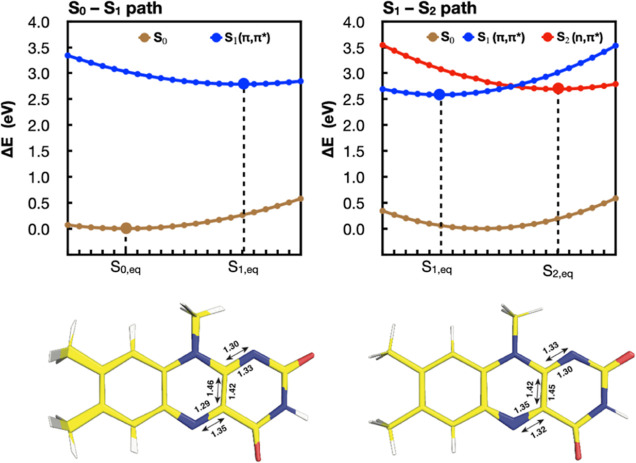
To generate one-dimensional PESs along coordinates relevant to flavin’s photophysics, we reoptimized the S0, S1, and S2 states of flavin using (TD-)B3LYP/cc-pVTZ with Cs symmetry enforced. We then generated two 1-D PESs by linear interpolation of Cartesian coordinates. The first PES (S0–S1 path, see Figure 2 left) connects the S0 optimized geometry to the S1 optimized geometry and therefore follows a Franck–Condon-active mode. The second PES (S1–S2 path, see Figure 2 right) connects the S1 optimized geometry to the S2 optimized geometry and therefore traces the path where the two states may potentially cross. We also added additional points on either side of each path through a linear extrapolation. In total, each path contains twenty-one geometries obtained through interpolation and extrapolation, as shown in Figure 2.
Figure 2.
(TD)-B3LYP S0 (brown), S1 (blue), and S2 (red) energies along two paths used for benchmarking electronic structure methods. The S1 and S2 labels are conserved throughout the PESs, despite state crossings, to reflect their energy ordering at the ground state equilibrium geometry. The larger circles indicate the minima optimized at the (TD)-B3LYP level of theory. Smaller circles are obtained by linear interpolation and extrapolation. At the bottom of each plot, a figure is shown overlaying the structures of all interpolated and extrapolated geometries. Bond thickness in this figure therefore correlates to the extent of change in coordinates. The labels above and below the structure indicate the bond lengths at the S0 and S1 (left) and S1 and S2 (right) structures, respectively.
Single-point calculations along the PESs were performed using TD-DFT with the B3LYP,100,101 camB3LYP,102 and ωB97X-D103 functionals and the cc-pVTZ basis set. EOM-EE-CCSD and SOS-CIS(D) energies were computed with the cc-pVDZ basis set. MR-PT2 calculations along the scans were also carried out using the ANO-L-VDZP basis set. A [14,12] active space was used for the PESs, comprising two nonbonding orbitals with electron density on the N1 and N5 nitrogen atoms and five π and five π* orbitals. 3-Root state averaging was used for each symmetry and spin.
MP2 and DFT calculations were run using Gaussian 16.104 Multiconfigurational calculations were performed with OpenMolcas version 22.10.105 The density matrix renormalization group (DMRG) calculations for orbital entanglement were run using the QCMaquis interface with OpenMolcas.106 The resultant orbital entanglement data were analyzed using autoCAS.94 EOM-EE-CCSD and SOS-CIS(D) calculations were run using Q-Chem 5.4.107
Results and Discussion
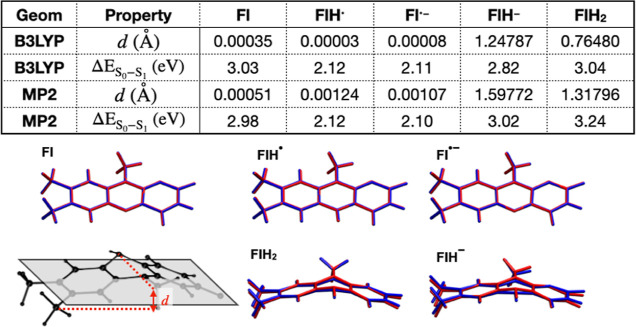
The geometries for Fl, FlH•, Fl•–, FlH–, FlH2 optimized at the MP2/cc-pVTZ level of theory are compared to the geometries optimized at the B3LYP/cc-pVTZ level of theory from ref (21). In Figure 3, we align the molecule along the x–y plane as closely as possible and find the maximum and minimum displacements of heavy atoms along the z-axis. This distance, labeled d, indicates the extent of the “butterfly” bending of the isoalloxazine rings in the MP2 and B3LYP geometries for the different redox states. The MP2 and B3LYP geometries are also shown superimposed in the same figure. Even though all molecules were optimized without symmetry constraints, Fl, FlH•, and Fl•– remain planar, with only minimal deviations from planarity. The MP2 and B3LYP geometries are similar, which is also reflected in the TD-B3LYP S1 excitation energies that differ by no more than 0.05 eV for the two geometries. However, FlH– and FlH2 show significantly more bending with MP2 compared to B3LYP. The distance d is 1.60 Å for FlH– at the MP2 level of theory compared to 1.25 Å with B3LYP, while in FlH2, d is 1.32 Å with MP2 compared to 0.76 Å with B3LYP. This causes a larger difference in the excitation energies computed with the MP2 and B3LYP geometries (a 0.22 eV difference). Therefore, accurate calculations of thermodynamic quantities or excitation energies for those two reduced states of flavin may necessitate the use of geometries optimized with MP2 or a better level of theory.
Figure 3.
Comparison of geometries and TD-B3LYP/cc-pVTZ excitation energies of flavin in five different redox states optimized with B3LYP and MP2. The schematic at the bottom left panel indicates the definition of the parameter d, which is difference in the maximum and minimum positions of heavy atoms along the z axis when the molecules are aligned as closely as possible along the x–y plane. The other five panels show the overlay of the structure for each redox state optimized at the B3LYP (blue) and MP2 (red) levels of theory.
Figure 4 presents the orbital entanglement diagram for the oxidized form of flavin, which was generated from CASSCF-DMRG wave functions with a [38,36] active space. The diagrams feature a circular arrangement of active orbitals where strong orbital “entropy,” a term used in this context to signify a high degree of correlation with other orbitals, is indicated by larger gray circles and mutual information is indicated by the line thickness between the orbitals. A set of 15 orbitals, highlighted in the red boxes in the diagram, exhibited higher single-orbital entropies and mutual information. These orbitals comprise eight bonding π orbitals (16 electrons) and seven antibonding π* orbitals, which are shown in Figure S1a of the Supporting Information document. Consequently, we employed CASSCF with a 16 electron and 15 orbital active space as the starting point for further benchmarking.
Figure 4.
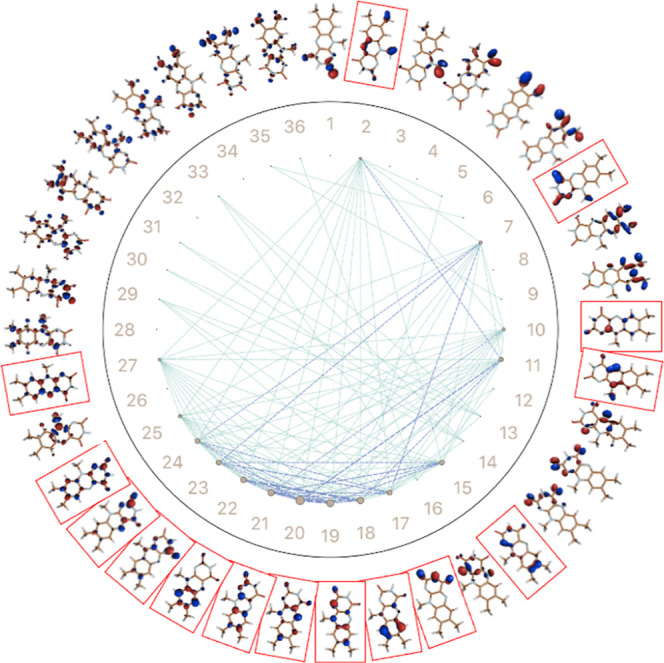
CASSCF-DMRG [38,36] orbital entanglement diagram for oxidized LF. Gray circle size represents the degree of orbital entropy while line thickness indicates mutual information between orbital pairs. Red boxes highlight orbitals with high entropy.
While the DMRG-CASSCF calculations indicate the relevance of these 15 orbitals to the molecule’s multiconfigurational electronic structure, such a large active space makes routine calculations on flavins intractable. This is especially true if one is interested in looking at other excited states such as n,π*, which would necessitate the addition of n orbitals on top of π and π*. Therefore, we examined the effect of reducing the active space on the lowest excitation energy of flavin.
In Figure 5, MR-PT2 and MC-PDFT excitation energies are plotted as a function of active space. 3-Root state averaging is used for the underlying CASSCF wave function in all cases. The effect of using additional roots is explored further in Supporting Information Figure S2, where it is shown that the MR-PT2 energies are relatively stable with the use of three or more states in the CASSCF state averaging. We started with a 16 electron and 15 orbital [16,15] active space shown in Figure S1a. Removing orbitals based on their occupancy had a relatively small impact on S0–S1 excitation energies down to a [10,10] active space. However, removing additional orbitals resulted in significant energy variations, indicating unbalanced electron correlation in smaller spaces. A minimal active space of [2,2] gives reasonable excitation energies for most MR-PT2 methods, as has been also shown by Udvarhelyi and Domratcheva.53,57 Overall, the results in Figure 5 suggest that a [10,10] active space is sufficient for accurate π,π* excitation energy calculations when using the orbitals labeled as π1, π2, π3, π4, π5, π1*, π2*, π3*, π4*, and π5* in Figure S1a. SS-CASPT2, MS-CASPT2, and XDW-CASPT2 provide largely consistent energies. XMS-CASPT2 gives energies that are consistently 0.2 eV above those methods, while MC-PDFT gives energies that are around 0.1 to 0.25 eV below these methods, depending on the active space used.
Figure 5.
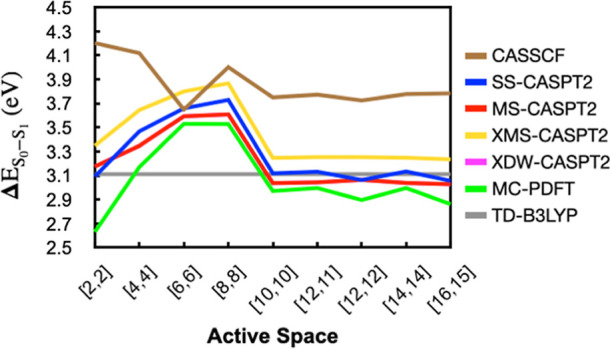
3-root MR-PT2 and 3-root state averaged CASSCF S1 excitation energies as a function of active space [number of electrons, number of orbitals] for LF in the oxidized form. A 0.25 IPEA shift is used for MR-PT2 methods. The TD-B3LYP excitation energy is shown as a gray line for reference. XDW-CASPT2 energies are identical to MS-CASPT2 energies in this figure.
In Figure 6, we show AutoCAS maps constructed from CASSCF-DMRG wave function calculations on FlH•, Fl•–, FlH2, and FlH–. The calculations for FlH• and Fl•– use a [39,36] active space, while those for FlH2 and FlH– use a [40,36] active space. We find that eight bonding and six antibonding orbitals are important for both FlH• and Fl•–. For FlH2 and FlH–, nine bonding and six antibonding orbitals with high entropy were found instead. These orbitals are highlighted in red boxes and are shown in Supporting Information Figure S1b–e along with their occupancies.
Figure 6.
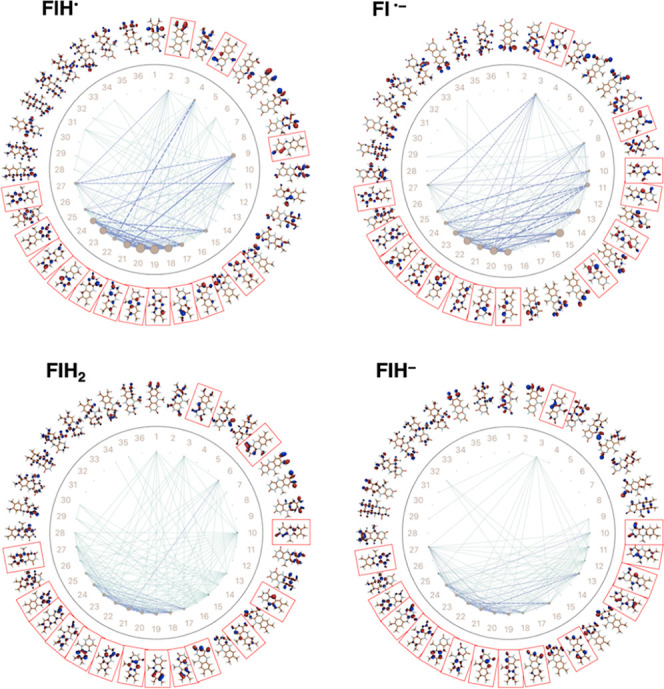
Orbital entanglement diagram for the semiquinone and hydroquinone reduced forms of LF. CASSCF-DMRG [39,36] actives spaces were used for the semiquinones and [40,36] for the hydroquinones. Gray circle size represents the degree of orbital entropy while line thickness indicates mutual information between orbital pairs. Red boxes highlight orbitals with high entropy.
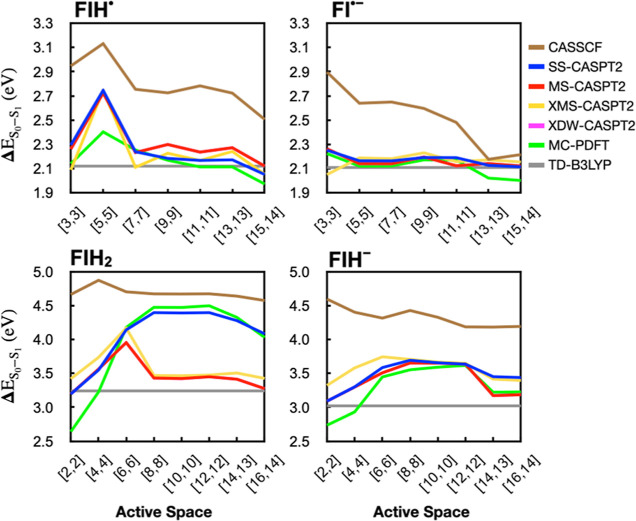
We computed the excitation energies for these four redox and protonation states as a function of decreasing active space size by sequentially removing the highest occupancy orbitals, as we did for Fl. The excitation energies obtained from these calculations, along with TD-B3LYP energies, are shown in Figure 7.
Figure 7.
3-Root MR-PT2 and 3-root state averaged CASSCF S1 excitation energies as a function of active space [number of electrons, number of orbitals] for LF in different redox states. The IPEA = 0.25 shift is used for all MR-PT2 methods. The redox state is indicated above each panel. The TD-B3LYP excitation energy is shown as a gray line for reference. XDW-CASPT2 energies are identical to MS-CASPT2 energies in these figures.
For FlH• and Fl•–, the MR-PT2 and MC-PDFT calculations with large active spaces gave results largely similar to TD-B3LYP. For FlH•, reducing the active space size had a limited effect down to a [7,7] active space. A minimal active space, [3,3], also gives similar results, but a [5,5] active space appears imbalanced. In FlH–, on the other hand, any active space [3,3] or larger gave similar energies.
In FlH2, and FlH–, which have nonplanar geometries, the convergence of the excitation energies with increasing active space size is much less smooth compared to the other states. Up to the largest active space tested, [16,14], there continue to be changes in the excitation energies. This may be attributed to the bent structure of these two redox states, which allow mixing between nonbonded or σ orbitals with π orbitals that likely results in stronger correlation between a larger set of orbitals. This can be seen to some extent in the autoCAS maps in Figure 6, where FlH2 and FlH– have more orbitals involved in the mutual information exchange, even though the degree of entanglement is smaller for each orbital.
In FlH2, there is a large difference of ca. 1.0 eV between the MC-PDFT and SS-CASPT2 results compared to those calculated with MS/XMS/XDW-CASPT2. Such differences between SS-CASPT2 and MS-CASPT2 have been previously discussed45 and are usually resolved through the XMS or XDW extension to these theories, as appears to be the case here.
PESs for Flavin’s Low-Lying Excited States
For the application of electronic structure methods toward studying the photophysics of flavin, it is important to move beyond single point energy calculations and to explore the energies of different methods along relevant coordinates. Here, we focus on PESs near flavin’s Franck–Condon region along two modes (Figure 2). One mode (S0–S1) connects the geometries of the S0 and S1 minima optimized at the (TD)-B3LYP/cc-pVTZ level of theory. The second mode (S1–S2) connects the S1 and S2 minima optimized at the TD-B3LYP/cc-pVTZ level of theory. The aim is to check the sensitivity of the relative energies, curvatures, and crossing points of the low-lying singlet and triplet excited states along these paths to the electronic structure method.
In Figure 8, we show MS-CASPT2 energies for five states (S0, S1, S2, T1, and T2) along the two paths. The [14,12] active space comprises the 5 π and 5 π* orbitals consistent with the [10,10] active space from Figure 5 plus two nonbonding orbitals localized on the N1 and N5 nitrogen atoms. S1 is the optically active π,π* state, while S2 is the optically inactive n,π* state involving the nonbonding orbitals. The triplet states, T1 and T2, have the same electronic transitions as the S1 and S2 states, respectively. The S1 state crosses with both the S2 and the T2 states along the S1–S2 path.
Figure 8.
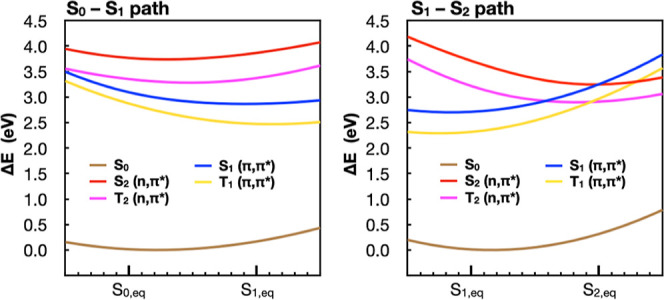
3-Root MS-CAPT2(IPEA = 0.25)[14,12]/ANO-L-VDZP S0 (brown), S1 (blue), S2 (red), T1 (yellow) and T2 (magenta) energies along the S0–S1 path (left) and the S1–S2 path (right).
We first focus on the S0 and S1 PESs along the S0–S1 path, since those two states are responsible for the spectroscopic properties of flavin’s first excitation band. We then shift our focus to the S1, S2, and T2 PESs along the S1–S2 path, since their crossings represent possible internal conversion or ISC points, respectively.
Figure 9 plots the S0 and S1 energies along the S0–S1 path with different methods. For S0, CASSCF stands out from other curves at large distortion. This is likely due to missing dynamical electron correlation, particularly σ orbitals that become involved with bond stretching. However, even among other methods that do account for dynamical electron correlation, we find that there are differences in the positions of the S0 minima along the PES. CCSD is the only other method that has the same minimum point as the B3LYP-optimized S0 state. Conversely, camB3LYP and ωB97X-D give geometries that are further away from the S1 minimum and fall along the extrapolated portion of the PES. MR-PT2, MC-PDFT, and SOS-CIS(D) methods, on the other hand give minima that are closer to the S1 equilibrium structure. Nonparallelity errors (NPEs), which are reported relative to the XDW-CASPT2 (IPEA = 0.25) energy profile, reflect those differences as well (Table 1). NPEs are calculated as the largest deviation from the reference XDW-CASPT2 curve minus the smallest deviation from the same curve. Methods that have similar minimum points to XDW-CASPT2 and have similar curvature have small S0 NPEs, while methods with different minimum energy geometries display larger S0 NPEs.
Figure 9.
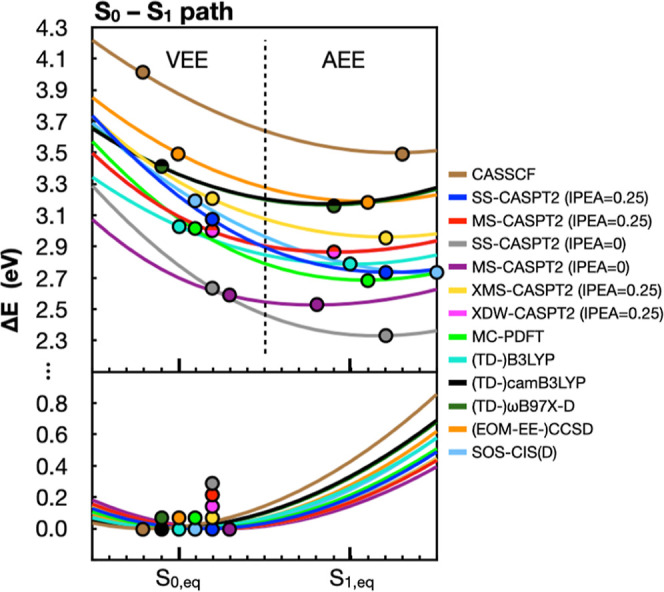
S0 (bottom) and S1 (top) energies along the S0–S1 path reported relative to the corresponding S0 minimum energy point along the path. Energies are shown for 3-root state averaged CASSCF, MR-PT2, MC-PDFT, TD-DFT, EOM-EE-CCSD, and SOS-CIS(D) methods, using colors indicated in the legend on the right. CASSCF and MR-PT2 energies employ a [14,12] active space. In the bottom panel, the circles indicate the interpolated geometry that has the lowest energy for each method. In the top panel, circles indicate the corresponding VEE (left side) and the AEE (right side) along this path. The latter is found as the point with the lowest S1 energy along the path. XDW-CASPT2 energies are identical to MS-CASPT2 energies in this figure.
Table 1. NPEs for Different Methods Calculated Relative to the Reference XDW-CASPT2 PES.
| S0 NPE (eV) | S1 NPE (eV) | |
|---|---|---|
| CASSCF | 0.54 | 0.21 |
| SS-CASPT2 (IPEA = 0.25) | 0.08 | 0.42 |
| MS-CASPT2 (IPEA = 0.25) | 0.00 | 0.00 |
| SS-CASPT2 (IPEA = 0) | 0.03 | 0.37 |
| MS-CASPT2 (IPEA = 0) | 0.07 | 0.11 |
| XMS-CASPT2 | 0.02 | 0.19 |
| MC-PDFT | 0.12 | 0.28 |
| (TD-)B3LYP | 0.23 | 0.10 |
| (TD-)camB3LYP | 0.37 | 0.18 |
| (TD-)ωB97X-D | 0.35 | 0.17 |
| EOM-EE-CCSD | 0.26 | 0.11 |
| SOS-CIS(D) | 0.20 | 0.41 |
The differences between methods become substantially more pronounced when looking at the S1 state, both in terms of the excitation energy as well as the shape (curvature) of the excited state potential energy surface along this path. VEEs, which are indicated with circles in the top left section of Figure 9, reflect the S0–S1 energy differences at the same position where a method’s S0 minimum is found. Even if we exclude CASSCF from the analysis due to its missing dynamical electron correlation, we find that VEEs vary from 2.59 eV (MS-CASPT2 with IPEA = 0) to 3.49 eV (EOM-EE-CCSD), a range of 0.90 eV. Changes in the curvature of the excited state potential energy surface are reflected by the S1 NPEs shown in Table 1. While some excited state methods have PESs that resemble the XDW-CASPT2 PES (S1 NPE within 0.11 eV), several methods stand out has having a different curvature along this path. Specifically, SS-CASPT2 (NPE = 0.37–0.42 eV), SOS-CIS(D) (NPE = 0.41 eV), MC-PDFT (NPE = 0.28 eV), and XMS-CASPT2 (NPE = 0.19 eV) all have a larger curvature compared to XDW-CASPT2. On the other hand. TD-DFT methods, which give NPEs ranging from 0.10 to 0.18, have smaller curvature.
In the top right part of Figure 9, circles are used to indicate the S1 minima for the different methods calculated along the S0–S1 path. The ΔE value at those points reflects the AEEs for the different methods. We note that those are approximate AEEs because they are not true minima but instead are the lowest energy points computed along a TD-B3LYP PES. Nonetheless, there is a marked variation in these energies, which is a result of both the differences in the VEEs as well as the differences in curvatures of the different methods. AEEs along this path range from 2.33 eV (CASPT2 with IPEA = 0) to 3.19 eV for EOM-EE-CCSD, a 0.86 eV range.
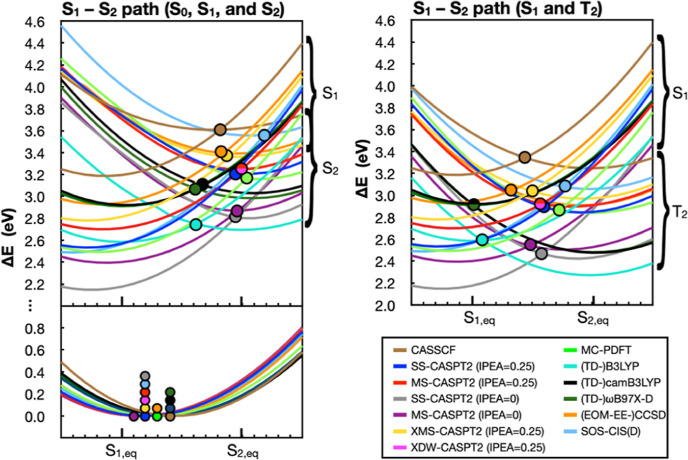
In Figure 10, we plot S0, S1, S2, and T2 energies along the S1–S2 path. The circles on the S0 PES again indicate differences in the positions of the minima for the different methods, which all lie somewhere between the S1 and S2 geometries. In the top left panel of Figure 10, we show both the S1 and S2 states. For all methods shown, the two states cross at some point along the S1–S2 path. In all cases, the S1 minimum remains lower in energy than the S2 minimum, suggesting (at least, in the gas phase) that the S2 (n,π*) state would not get populated from the S1 state. Since solvents typically stabilize (red-shift) π,π* excited states and destabilize (blue-shift) n,π* states,108 we expect the same conclusion will also apply to flavins in solution. The S1–S2 crossings for all methods, indicated using circles, are geometrically closer to the S2 minima and often lie well above the S1 minima. In Table 2 we tabulate ΔES1/S2, which are energy differences between the S1–S2 crossing points and the S1 minima, for the different methods.
Figure 10.
PESs along the S1–S2 path. In the left panel, we show the S0 (bottom left panel) as well as S1 and S2 (top left panel) potential energies reported relative to the corresponding S0 minimum energy point along this path. In the panel on the right, we show the S1 and T2 energies along the same path. Energies are shown for 3-root state averaged CASSCF, MR-PT2, MC-PDFT, TD-DFT, EOM-EE-CCSD, and SOS-CIS(D) methods, using colors indicated in the legend on the bottom right. MR-PT2 and CASSCF energies employ a [14,12] active space. In the bottom left panel, the circles indicate the interpolated geometry that has the lowest energy. In the tops panels, circles indicate crossing points between the S1 state and the S2 (left) or T2 (right) states. XDW-CASPT2 energies are identical to MS-CASPT2 energies in these figures.
Table 2. Energy Barrier to the S1–S2 Crossing Point (ΔES1/S2) and the S1/T2 Crossing Point (ΔES1/T2) Relative to the S1 Minimum Energya.
| method | ΔES1/S2 (eV) | ΔES1/T2 (eV) |
|---|---|---|
| CASSCF | 0.40 | 0.13 |
| SS-CASPT2 (IPEA = 0.25) | 0.64 | 0.36 |
| MS-CASPT2 (IPEA = 0.25) | 0.55 | 0.23 |
| SS-CASPT2 (IPEA = 0) | 0.66 | 0.33 |
| MS-CASPT2 (IPEA = 0) | 0.50 | 0.15 |
| XMS-CASPT2 (IPEA = 0.25) | 0.59 | 0.26 |
| XDW-CASPT2 (IPEA = 0.25) | 0.55 | 0.23 |
| MC-PDFT | 0.63 | 0.35 |
| TD-B3LYP | 0.15 | 0.00 |
| TD-camB3LYP | 0.19 | 0.00 |
| TD-ωB97X-D | 0.15 | 0.00 |
| EOM-EE-CCSD | 0.47 | 0.10 |
| SOS-CIS(D) | 1.09 | 0.62 |
Those barriers are estimated for different electronic structure methods along the S1–S2 path.
The S1/T2 plots (Figure 10 right) tell a different story. There, the relative energies of the S1 and T2 minima are more comparable, with some methods showing a lower S1 state minimum energy point and other methods showing a lower T2 minimum. For example, TD-DFT methods show that the T2 minimum is lower than the S1 minimum, while MR-PT2 methods show that the S1 minimum is lower than T2. The S1/T2 crossings lie somewhere in the middle between the two coordinates. As discussed by Salzmann et al. in multiple studies,36,76,77 solvent effects or a protein environment can play an important role in changing flavin’s photophysics by modulating the relative energies of the S1 and T2 states. However, here we also find that the relative energies of those states are sensitive to the choice of computational method.
Table 2 presents ΔES1/T2, the relative energies of the S1/T2 ISC point compared to the S1 minimum along the S1–S2 path, alongside the corresponding ΔES1/S2 values. We note that these crossing points were obtained from the interpolation and do not necessarily represent the minimum energy crossing points. However, the variations in these numbers for the different methods indicates either that (1) the barrier to those crossings is different for the different methods, or (2) the minimum energy crossing geometry varies from one method to another. For example, along the S1–S2 path, TD-DFT methods indicate that the S1/T2 ISC point coincides with the S1 minimum geometry (with a barrier of ∼0 eV) while SOS-CIS(D) gives a ΔES1/T2 of 0.62 eV. EOM-EE-CCSD gives a ΔES1/T2 of 0.10 eV while MR-PT2 methods give ΔES1/T2 values that vary from 0.23 to 0.36 eV.
When looking more generally at the trends in both ΔES1/S2 and ΔES1/T2, most MR-PT2 methods and MC-PDFT appear to treat the π,π* and n,π* states on a similar footing, since the crossing geometries do not change considerably from one method to the other. The IPEA shift has a large effect on the S1, S2, and T2 energies relative to the reference S0 state, but it does not have much of an impact on their energies relative to each other since all three states have similarly open-shell character. This is results in ΔES1/S2 and ΔES1/T2 barriers for the IPEA = 0 calculations that are comparable in magnitude to their IPEA = 0.25 counterparts. TD-DFT methods, on the other hand, predict lower energies for both the S2 and T2 (n,π*) states, give crossing geometries that are closer to the S1 minimum, and have considerably smaller ΔES1/S2 and ΔES1/T2 energies. EOM-EE-CCSD gives crossing geometries and ΔES1/S2 and ΔES1/T2 energies that are intermediate between those of TD-DFT and MR-PT2. SOS-CIS(D), on the other hand, appears to significantly overestimate ΔES1/S2 and ΔES1/T2 compared to the other methods. We note that EOM-EE-CCSD and SOS-CIS(D) calculations were carried out with a smaller basis set (double-ζ instead of triple-ζ), which may contribute to the difference observed.
In Figure 11, we show the energy profiles computed using MS-CASPT2 (IPEA = 0.25) with different state averaging or active space along the S0–S1 path. Using 3 or more states in the zeroth-order CASSCF wave function gives comparable S0 and S1 energy profiles along this path. However, using 2-root state averaging gives a qualitatively different S1 energy profile. Similarly, using a minimal [2,2] active space, while successful at reproducing the VEE of flavin, has distorted S0 and S1 PESs when moving away from the S0 equilibrium structure. This may result in artifacts far from the Franck–Condon region.
Figure 11.
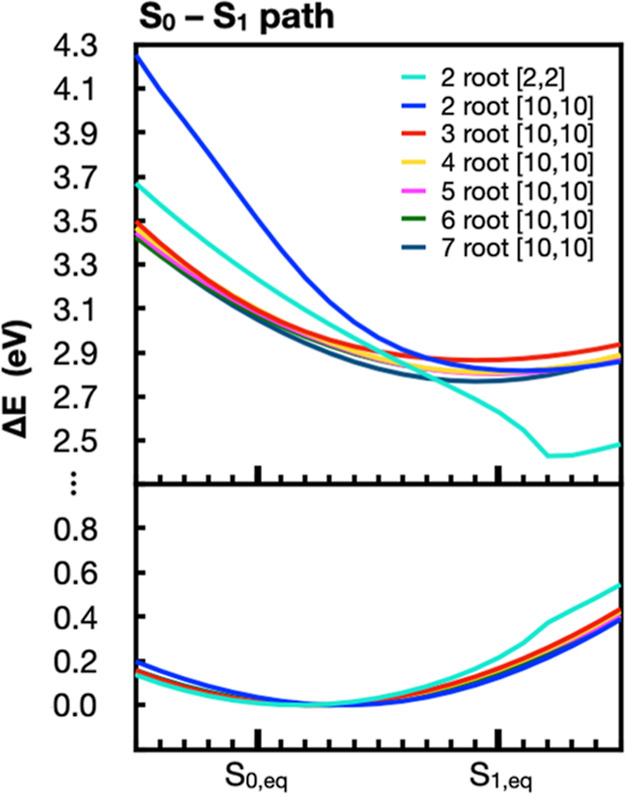
S0 (bottom panel) and S1 (top panel) energies along the S0–S1 path reported relative to the corresponding S0 minimum energy point along the path. Energies are shown for MS-CASPT2 with IPEA = 0.25 but with different number of roots used in the state averaging of the underlying CASSCF wave function. We also include one calculation where the minimal [2,2] active space is used instead of [10,10].
Conclusions
Multiple computational studies have investigated the excited-state electronic structure and photophysics of flavin. A nonexhaustive list includes refs (21, 36–39, 50–81). A more comprehensive list of computational studies can be found in a recent review article by Kar, Miller, and Mroginski.78 These studies employ a range of computational methods including semiempirical, TD-DFT, coupled cluster, and multiconfigurational approaches. Even among multiconfigurational studies, methodological details such as the number of roots used in state averaging or the size of the active space may differ. With the continued advancement in the use of flavins and flavoproteins for novel photocatalytic, sensing, and biotechnological applications,31,109−115 we expect that computational studies on these systems will continue to elucidate and guide experimental studies. In this work, we present a comparison of how different electronic structure methods describe the energetics of the low-lying excited states of flavin.
In the first part of this study, we compared S1 excitation energies calculated with MR-PT2 methods and those computed with TD-B3LYP for flavin in different redox and protonation states. We focus on the S1 state because, according to Kasha’s rule, this is the state from which a system’s photophysics and photochemistry typically occurs. An initial active space for CASSCF and MR-PT2 calculations is selected using autoCAS, but then the number of orbitals in the active space are gradually reduced to check the effect on the S0–S1 excitation energy. Here, TD-B3LYP serves as a reasonable reference since it has been well tested against experimental spectra and shown to agree well when properly accounting for Franck–Condon factors.21,38,39,61,67 For most redox states, MS-CASPT2 (with the IPEA 0.25 shift) agrees well with TD-B3LYP excitation energies if a sufficiently large basis set is used. For the oxidized and semiquinone forms of flavin, which are planar, the convergence of the excitation energy is reached quickly with a small or moderate active space size. In the case of the hydroquinone forms of flavin, which are bent, a larger active space is needed for MR-PT2 methods to converge. For SS-CASPT2 and MC-PDFT, convergence with increasing active space size is not achieved for FlH2 even when using a 16 electron and 14 orbital active space.
In the second part of this work, we compare TD-DFT, EOM-EE-CCSD, SOS-CIS(D), MC-PDFT, and MR-PT2 energy profiles along a PES connecting the S0 and S1 equilibrium geometries (i.e., tracing the Franck–Condon active mode) and along a PES connecting the S1 (π,π*) and S2 (n,π*) minima. Along the S0–S1 path, we find that (TD)-B3LYP is in reasonably good agreement with MS-CASPT2 (IPEA = 0.25) energies, which explains its success in simulating UV/visible spectra. However, the same is not true for the S1–S2 path, where TD-B3LYP has a significantly lower energy for the S2 and T2 states compared to MS-CASPT2 (IPEA = 0.25). TD-camB3LYP and TD-ωB97X-D, which are hybrid functionals that include a long-range correction that is missing in TD-B3LYP, appear to also have a reduced agreement with multireference methods.
While MS-CASPT2 with a minimal [2,2] active space and/or 2-root state averaging can give VEEs that are in good agreement with larger active spaces, it is not recommended for studying regions far from the Franck–Condon point.
For all methods tested, the S2 minimum lies above the S1 minimum, suggesting that it is unlikely to be involved in flavin’s photophysics. The T2 (n,π*) state, on the other hand, may be populated by ISC from the S1 (π,π*) state. The relative energies of these states are sensitive to the choice of computational method, and we posit that additional benchmarking is needed for a more quantitative description of ISC in flavins. Such benchmarks should ideally also test the effect of the method on the optimized geometry of the singlet and triplet (π,π*) and (n,π*) states.
Earlier work with Olivucci and co-workers resulted in a series of benchmark studies on a minimal three double-bond reduced model of the retinal protonated Schiff base chromophore of rhodopsins (PSB3).116−123 Some of this work is reviewed in ref (124). There, energies and wave functions of a wide range of methods were compared along paths relevant to PSB3’s isomerization coordinate and S1 excited-state dynamics. Here, we again emphasize the usefulness of moving beyond vertical energies or energy differences between two points in benchmark studies. Instead, by comparing methods along a reaction or photophysical pathway, important differences in how these methods treat different regions of a potential energy surface may emerge. For PSB3, methods that could accurately reproduce the VEE could not necessarily describe the twisted PSB3 intermediates, which either displayed strong charge transfer character or diradical character. On the other hand, a few methods could treat both the planar and fully twisted PSB3 intermediates well but deteriorated when describing intermediate structures connecting the planar and 90° twisted geometries. Ultimately, through extensive benchmarks, methods were found that have a suitable error cancellation to treat different regions of PSB3’s potential energy surface on a similar footing. This has enabled, for instance, the construction of model potentials suitable for running quantum dynamics for PSB3.125 Similarly, additional benchmark studies on flavin can lead to the adoption of methods that may be used routinely for studying the photophysics and photochemistry of this system in different protein environments.
Acknowledgments
We thank Stephen Ajagbe for useful feedback. This material is based upon work supported by the National Science Foundation (NSF) under grant CHE-2047667 (S.G.). M.P.K. acknowledge a fellowship from the Molecular Basis of Disease Program at Georgia State University. M.P.K. also acknowledges support from the Provost Dissertation Fellowship at Georgia State University. This work used Expanse at SDSC through allocation CHE180027 from the Advanced Cyberinfrastructure Coordination Ecosystem: Services and Support (ACCESS) program, which is supported by National Science Foundation grants 2138259, 2138286, 2138307, 2137603, and 2138296. We also acknowledge the use of Advanced Research Computing Technology and Innovation Core (ARCTIC) resources at Georgia State University’s Research Solutions, made available by the NSF Major Research Instrumentation (MRI) grant number CNS-1920024.
Data Availability Statement
The main data from this work are presented in the manuscript and in the Supporting Information. Requests for additional data, including computational models and raw data files, should be directed to S.G. (sgozem@gsu.edu).
Supporting Information Available
The Supporting Information is available free of charge at https://pubs.acs.org/doi/10.1021/acs.jpcb.4c03748.
Cartesian (xyz) coordinate files of LF optimized in different redox and protonation states at the B3LYP/cc-pVTZ and MP2/cc-pVTZ levels of theory without symmetry constraints. Cartesian coordinates for structures along the S0–S1 path and the S1–S2 path (21 structures each) (ZIP)
Figures of the molecular orbitals included in the active space of CASSCF and MR-PT2 calculations; plots of CASSCF S1 excitation energies as a function of active space and number of roots used in the state averaging for LF in the oxidized form (PDF)
Author Contributions
M.P.K.: Data curation, formal analysis, investigation, validation, visualization, writing—original draft. P.G.: Data curation, formal analysis, investigation, validation, visualization, writing—review and editing. S.G.: Conceptualization, funding acquisition, project administration, resources, supervision, validation, visualization, writing—review and editing.
The authors declare no competing financial interest.
Special Issue
Published as part of The Journal of Physical Chemistry Bvirtual special issue “Massimo Olivucci Festschrift”.
Supplementary Material
References
- Albert A. Quantitative studies of the avidity of naturally occurring substances for trace metals. 3. Pteridines, riboflavin and purines. Biochem. J. 1953, 54 (4), 646–654. 10.1042/bj0540646. [DOI] [PMC free article] [PubMed] [Google Scholar]
- Draper R. D.; Ingraham L. L. A potentiometric study of the flavin semiquinone equilibrium. Arch. Biochem. Biophys. 1968, 125 (3), 802–808. 10.1016/0003-9861(68)90517-1. [DOI] [PubMed] [Google Scholar]
- Zheng Y.; Carey P. R.; Palfey B. A. Raman spectrum of fully reduced flavin. J. Raman Spectrosc. 2004, 35 (7), 521–524. 10.1002/jrs.1218. [DOI] [Google Scholar]
- Mansoorabadi S. O.; Thibodeaux C. J.; Liu H. W. The diverse roles of flavin coenzymes-nature’s most versatile thespians. J. Org. Chem. 2007, 72 (17), 6329–6342. 10.1021/jo0703092. [DOI] [PMC free article] [PubMed] [Google Scholar]
- Romero E.; Gomez Castellanos J. R.; Gadda G.; Fraaije M. W.; Mattevi A. Same Substrate, Many Reactions: Oxygen Activation in Flavoenzymes. Chem. Rev. 2018, 118 (4), 1742–1769. 10.1021/acs.chemrev.7b00650. [DOI] [PubMed] [Google Scholar]
- Massey V. The chemical and biological versatility of riboflavin. Biochem. Soc. Trans. 2000, 28 (4), 283–296. 10.1042/bst0280283. [DOI] [PubMed] [Google Scholar]
- Walsh C. T.; Wencewicz T. A. Flavoenzymes: versatile catalysts in biosynthetic pathways. Nat. Prod. Rep. 2013, 30 (1), 175–200. 10.1039/C2NP20069D. [DOI] [PMC free article] [PubMed] [Google Scholar]
- Tomiki T.; Saitou N. Phylogenetic analysis of proteins associated in the four major energy metabolism systems: photosynthesis, aerobic respiration, denitrification, and sulfur respiration. J. Mol. Evol. 2004, 59 (2), 158–176. 10.1007/s00239-004-2610-2. [DOI] [PubMed] [Google Scholar]
- Forti G.Flavoproteins. In Photosynthesis I; Springer, 1977; pp 222–226. [Google Scholar]
- Helman Y.; Tchernov D.; Reinhold L.; Shibata M.; Ogawa T.; Schwarz R.; Ohad I.; Kaplan A. Genes encoding A-type flavoproteins are essential for photoreduction of O2 in cyanobacteria. Curr. Biol. 2003, 13 (3), 230–235. 10.1016/S0960-9822(03)00046-0. [DOI] [PubMed] [Google Scholar]
- James W. O. The terminal oxidases of plant respiration. Biol. Rev. 1953, 28 (2), 245–260. 10.1111/j.1469-185X.1953.tb01377.x. [DOI] [Google Scholar]
- Herrmann G.; Jayamani E.; Mai G.; Buckel W. Energy conservation via electron-transferring flavoprotein in anaerobic bacteria. J. Bacteriol. 2008, 190 (3), 784–791. 10.1128/JB.01422-07. [DOI] [PMC free article] [PubMed] [Google Scholar]
- van Spanning R. J.; Richardson D. J.; Ferguson S. J.. Introduction to the biochemistry and molecular biology of denitrification. In Biology of the Nitrogen Cycle; Elsevier, 2007; pp 3–20. [Google Scholar]
- Delwiche C.; Bryan B. A. Denitrification. Annu. Rev. Microbiol. 1976, 30 (1), 241–262. 10.1146/annurev.mi.30.100176.001325. [DOI] [PubMed] [Google Scholar]
- Ahmad M.; Cashmore A. R. HY4 gene of A. thaliana encodes a protein with characteristics of a blue-light photoreceptor. Nature 1993, 366 (6451), 162–166. 10.1038/366162a0. [DOI] [PubMed] [Google Scholar]
- Christie J. M.; Salomon M.; Nozue K.; Wada M.; Briggs W. R. LOV (light, oxygen, or voltage) domains of the blue-light photoreceptor phototropin (nph1): binding sites for the chromophore flavin mononucleotide. Proc. Natl. Acad. Sci. U.S.A. 1999, 96 (15), 8779–8783. 10.1073/pnas.96.15.8779. [DOI] [PMC free article] [PubMed] [Google Scholar]
- Gomelsky M.; Klug G. BLUF: a novel FAD-binding domain involved in sensory transduction in microorganisms. Trends Biochem. Sci. 2002, 27 (10), 497–500. 10.1016/S0968-0004(02)02181-3. [DOI] [PubMed] [Google Scholar]
- Sancar A. Structure and function of DNA photolyase. Biochemistry 1994, 33 (1), 2–9. 10.1021/bi00167a001. [DOI] [PubMed] [Google Scholar]
- Heelis P. F.; Hartman R. F.; Rose S. D. Photoenzymic repair of UV-damaged DNA: a chemist’s perspective. Chem. Soc. Rev. 1995, 24 (4), 289–297. 10.1039/cs9952400289. [DOI] [Google Scholar]
- Schwinn K.; Ferré N.; Huix-Rotllant M. UV-visible absorption spectrum of FAD and its reduced forms embedded in a cryptochrome protein. Phys. Chem. Chem. Phys. 2020, 22 (22), 12447–12455. 10.1039/D0CP01714K. [DOI] [PubMed] [Google Scholar]
- Kabir M. P.; Orozco-Gonzalez Y.; Gozem S. Electronic spectra of flavin in different redox and protonation states: a computational perspective on the effect of the electrostatic environment. Phys. Chem. Chem. Phys. 2019, 21 (30), 16526–16537. 10.1039/C9CP02230A. [DOI] [PubMed] [Google Scholar]
- Kottke T.; Hegemann P.; Dick B.; Heberle J. The photochemistry of the light-oxygen-and voltage-sensitive domains in the algal blue light receptor phot. Biopolymers 2006, 82 (4), 373–378. 10.1002/bip.20510. [DOI] [PubMed] [Google Scholar]
- Swartz T. E.; Corchnoy S. B.; Christie J. M.; Lewis J. W.; Szundi I.; Briggs W. R.; Bogomolni R. A. The photocycle of a flavin-binding domain of the blue light photoreceptor phototropin. J. Biol. Chem. 2001, 276 (39), 36493–36500. 10.1074/jbc.M103114200. [DOI] [PubMed] [Google Scholar]
- Kasha M. Characterization of electronic transitions in complex molecules. Discuss. Faraday Soc. 1950, 9, 14–19. 10.1039/df9500900014. [DOI] [Google Scholar]
- Chapman S.; Faulkner C.; Kaiserli E.; Garcia-Mata C.; Savenkov E. I.; Roberts A. G.; Oparka K. J.; Christie J. M. The photoreversible fluorescent protein iLOV outperforms GFP as a reporter of plant virus infection. Proc. Natl. Acad. Sci. U.S.A. 2008, 105 (50), 20038–20043. 10.1073/pnas.0807551105. [DOI] [PMC free article] [PubMed] [Google Scholar]
- Christie J. M.; Hitomi K.; Arvai A. S.; Hartfield K. A.; Mettlen M.; Pratt A. J.; Tainer J. A.; Getzoff E. D. Structural tuning of the fluorescent protein iLOV for improved photostability. J. Biol. Chem. 2012, 287 (26), 22295–22304. 10.1074/jbc.M111.318881. [DOI] [PMC free article] [PubMed] [Google Scholar]
- Mukherjee A.; Schroeder C. M. Flavin-based fluorescent proteins: emerging paradigms in biological imaging. Curr. Opin. Biotechnol. 2015, 31, 16–23. 10.1016/j.copbio.2014.07.010. [DOI] [PubMed] [Google Scholar]
- Westberg M.; Holmegaard L.; Pimenta F. M.; Etzerodt M.; Ogilby P. R. Rational design of an efficient, genetically encodable, protein-encased singlet oxygen photosensitizer. J. Am. Chem. Soc. 2015, 137 (4), 1632–1642. 10.1021/ja511940j. [DOI] [PubMed] [Google Scholar]
- Li X.; Page C. G.; Zanetti-Polzi L.; Kalra A. P.; Oblinsky D. G.; Daidone I.; Hyster T. K.; Scholes G. D. Mechanism and dynamics of photodecarboxylation catalyzed by lactate monooxygenase. J. Am. Chem. Soc. 2023, 145 (24), 13232–13240. 10.1021/jacs.3c02446. [DOI] [PubMed] [Google Scholar]
- Su D.; Smitherman C.; Gadda G. A Metastable Photoinduced Protein-Flavin Adduct in Choline Oxidase, an Enzyme Not Involved in Light-Dependent Processes. J. Phys. Chem. B 2020, 124 (19), 3936–3943. 10.1021/acs.jpcb.0c02633. [DOI] [PubMed] [Google Scholar]
- Zhuang B.; Liebl U.; Vos M. H. Flavoprotein photochemistry: fundamental processes and photocatalytic perspectives. J. Phys. Chem. B 2022, 126 (17), 3199–3207. 10.1021/acs.jpcb.2c00969. [DOI] [PubMed] [Google Scholar]
- Campbell A. C.; Prater A. R.; Bogner A. N.; Quinn T. P.; Gates K. S.; Becker D. F.; Tanner J. J. Photoinduced Covalent Irreversible Inactivation of Proline Dehydrogenase by S-Heterocycles. ACS Chem. Biol. 2021, 16 (11), 2268–2279. 10.1021/acschembio.1c00427. [DOI] [PMC free article] [PubMed] [Google Scholar]
- Potzkei J.; Kunze M.; Drepper T.; Gensch T.; Jaeger K.-E.; Büchs J. Real-time determination of intracellular oxygen in bacteria using a genetically encoded FRET-based biosensor. BMC Biol. 2012, 10 (1), 28. 10.1186/1741-7007-10-28. [DOI] [PMC free article] [PubMed] [Google Scholar]
- Shu X.; Lev-Ram V.; Deerinck T. J.; Qi Y.; Ramko E. B.; Davidson M. W.; Jin Y.; Ellisman M. H.; Tsien R. Y. A genetically encoded tag for correlated light and electron microscopy of intact cells, tissues, and organisms. PLoS Biol. 2011, 9 (4), e1001041 10.1371/journal.pbio.1001041. [DOI] [PMC free article] [PubMed] [Google Scholar]
- Ruiz-González R.; Cortajarena A. L.; Mejias S. H.; Agut M.; Nonell S.; Flors C. Singlet oxygen generation by the genetically encoded tag miniSOG. J. Am. Chem. Soc. 2013, 135 (26), 9564–9567. 10.1021/ja4020524. [DOI] [PubMed] [Google Scholar]
- Salzmann S.; Silva-Junior M. R.; Thiel W.; Marian C. M. Influence of the LOV domain on low-lying excited states of flavin: a combined quantum-mechanics/molecular-mechanics investigation. J. Phys. Chem. B 2009, 113 (47), 15610–15618. 10.1021/jp905599k. [DOI] [PubMed] [Google Scholar]
- Neiss C.; Saalfrank P.; Parac M.; Grimme S. Quantum chemical calculation of excited states of flavin-related molecules. J. Phys. Chem. A 2003, 107 (1), 140–147. 10.1021/jp021671h. [DOI] [Google Scholar]
- Klaumünzer B.; Kröner D.; Saalfrank P. (TD-) DFT calculation of vibrational and vibronic spectra of riboflavin in solution. J. Phys. Chem. B 2010, 114 (33), 10826–10834. 10.1021/jp100642c. [DOI] [PubMed] [Google Scholar]
- Davari M. D.; Kopka B.; Wingen M.; Bocola M.; Drepper T.; Jaeger K. E.; Schwaneberg U.; Krauss U. Photophysics of the LOV-Based Fluorescent Protein Variant iLOV-Q489K Determined by Simulation and Experiment. J. Phys. Chem. B 2016, 120 (13), 3344–3352. 10.1021/acs.jpcb.6b01512. [DOI] [PubMed] [Google Scholar]
- Roos B. O.; Taylor P. R.; Sigbahn P. E. A complete active space SCF method (CASSCF) using a density matrix formulated super-CI approach. Chem. Phys. 1980, 48 (2), 157–173. 10.1016/0301-0104(80)80045-0. [DOI] [Google Scholar]
- Andersson K.; Malmqvist P. A.; Roos B. O.; Sadlej A. J.; Wolinski K. Second-order perturbation theory with a CASSCF reference function. J. Phys. Chem. 1990, 94 (14), 5483–5488. 10.1021/j100377a012. [DOI] [Google Scholar]
- Finley J.; Malmqvist P.-Å.; Roos B. O.; Serrano-Andrés L. The multi-state CASPT2 method. Chem. Phys. Lett. 1998, 288 (2–4), 299–306. 10.1016/S0009-2614(98)00252-8. [DOI] [Google Scholar]
- Shiozaki T.; Győrffy W.; Celani P.; Werner H.-J. Communication: Extended multi-state complete active space second-order perturbation theory: Energy and nuclear gradients. J. Chem. Phys. 2011, 135 (8), 081106. 10.1063/1.3633329. [DOI] [PubMed] [Google Scholar]
- Battaglia S.; Lindh R. Extended dynamically weighted CASPT2: The best of two worlds. J. Chem. Theory Comput. 2020, 16 (3), 1555–1567. 10.1021/acs.jctc.9b01129. [DOI] [PMC free article] [PubMed] [Google Scholar]
- Granovsky A. A. Extended multi-configuration quasi-degenerate perturbation theory: The new approach to multi-state multi-reference perturbation theory. J. Chem. Phys. 2011, 134 (21), 214113. 10.1063/1.3596699. [DOI] [PubMed] [Google Scholar]
- Li Manni G.; Carlson R. K.; Luo S.; Ma D.; Olsen J.; Truhlar D. G.; Gagliardi L. Multiconfiguration pair-density functional theory. J. Chem. Theory Comput. 2014, 10 (9), 3669–3680. 10.1021/ct500483t. [DOI] [PubMed] [Google Scholar]
- Gagliardi L.; Truhlar D. G.; Li Manni G.; Carlson R. K.; Hoyer C. E.; Bao J. L. Multiconfiguration pair-density functional theory: A new way to treat strongly correlated systems. Acc. Chem. Res. 2017, 50 (1), 66–73. 10.1021/acs.accounts.6b00471. [DOI] [PubMed] [Google Scholar]
- Sharma P.; Bao J. J.; Truhlar D. G.; Gagliardi L. Multiconfiguration pair-density functional theory. Annu. Rev. Phys. Chem. 2021, 72, 541–564. 10.1146/annurev-physchem-090419-043839. [DOI] [PubMed] [Google Scholar]
- Zhou C.; Hermes M. R.; Wu D.; Bao J. J.; Pandharkar R.; King D. S.; Zhang D.; Scott T. R.; Lykhin A. O.; Gagliardi L.; et al. Electronic structure of strongly correlated systems: recent developments in multiconfiguration pair-density functional theory and multiconfiguration nonclassical-energy functional theory. Chem. Sci. 2022, 13 (26), 7685–7706. 10.1039/d2sc01022d. [DOI] [PMC free article] [PubMed] [Google Scholar]
- Ai Y.; Zhao C.; Xing J.; Liu Y.; Wang Z.; Jin J.; Xia S.; Cui G.; Wang X. Excited-state decay pathways of flavin molecules in five redox forms: the role of conical intersections. J. Phys. Chem. A 2018, 122 (40), 7954–7961. 10.1021/acs.jpca.8b07582. [DOI] [PubMed] [Google Scholar]
- Chang X. P.; Gao Y. J.; Fang W. H.; Cui G.; Thiel W. Quantum mechanics/molecular mechanics study on the photoreactions of dark-and light-adapted states of a blue-light YtvA LOV photoreceptor. Angew. Chem. 2017, 129 (32), 9469–9473. 10.1002/ange.201703487. [DOI] [PubMed] [Google Scholar]
- Climent T.; González-Luque R.; Merchán M.; Serrano-Andrés L. Theoretical insight into the spectroscopy and photochemistry of isoalloxazine, the flavin core ring. J. Phys. Chem. A 2006, 110 (50), 13584–13590. 10.1021/jp065772h. [DOI] [PubMed] [Google Scholar]
- Udvarhelyi A.; Domratcheva T. Photoreaction in BLUF receptors: proton-coupled electron transfer in the flavin-Gln-Tyr system. Photochem. Photobiol. 2011, 87 (3), 554–563. 10.1111/j.1751-1097.2010.00884.x. [DOI] [PubMed] [Google Scholar]
- Khrenova M.; Nemukhin A. V.; Grigorenko B. L.; Krylov A.; Domratcheva T. Quantum chemistry calculations provide support to the mechanism of the light-induced structural changes in the flavin-binding photoreceptor proteins. J. Chem. Theory Comput. 2010, 6 (8), 2293–2302. 10.1021/ct100179p. [DOI] [PubMed] [Google Scholar]
- Udvarhelyi A.; Olivucci M.; Domratcheva T. Role of the molecular environment in flavoprotein color and redox tuning: QM cluster versus QM/MM modeling. J. Chem. Theory Comput. 2015, 11 (8), 3878–3894. 10.1021/acs.jctc.5b00197. [DOI] [PubMed] [Google Scholar]
- Khrenova M. G.; Nemukhin A. V.; Domratcheva T. Theoretical characterization of the flavin-based fluorescent protein iLOV and its Q489K mutant. J. Phys. Chem. B 2015, 119 (16), 5176–5183. 10.1021/acs.jpcb.5b01299. [DOI] [PubMed] [Google Scholar]
- Domratcheva T. Neutral histidine and photoinduced electron transfer in DNA photolyases. J. Am. Chem. Soc. 2011, 133 (45), 18172–18182. 10.1021/ja203964d. [DOI] [PubMed] [Google Scholar]
- Luo Y.; Liu Y. J. Bioluminophore and flavin mononucleotide fluorescence quenching of bacterial bioluminescence—a theoretical study. Chem.—Eur. J. 2016, 22 (45), 16243–16249. 10.1002/chem.201603314. [DOI] [PubMed] [Google Scholar]
- Luo Y.; Liu Y.-J. Theoretical Insight into a Nonadiabatic Proton-Coupled Electron Transfer Mechanism of Reduced Flavin Oxygenation. J. Phys. Chem. A 2019, 123 (20), 4354–4359. 10.1021/acs.jpca.9b02084. [DOI] [PubMed] [Google Scholar]
- Zenichowski K.; Gothe M.; Saalfrank P. Exciting flavins: Absorption spectra and spin-orbit coupling in light-oxygen-voltage (LOV) domains. J. Photochem. Photobiol., A 2007, 190 (2–3), 290–300. 10.1016/j.jphotochem.2007.02.007. [DOI] [Google Scholar]
- Karasulu B.; Götze J. P.; Thiel W. Assessment of Franck-Condon methods for computing vibrationally broadened UV-Vis absorption spectra of flavin derivatives: riboflavin, roseoflavin, and 5-thioflavin. J. Chem. Theory Comput. 2014, 10 (12), 5549–5566. 10.1021/ct500830a. [DOI] [PubMed] [Google Scholar]
- Goings J. J.; Hammes-Schiffer S. Early photocycle of Slr1694 blue-light using flavin photoreceptor unraveled through adiabatic excited-state quantum mechanical/molecular mechanical dynamics. J. Am. Chem. Soc. 2019, 141 (51), 20470–20479. 10.1021/jacs.9b11196. [DOI] [PubMed] [Google Scholar]
- Mazzeo P.; Hashem S.; Lipparini F.; Cupellini L.; Mennucci B. Fast method for excited-state dynamics in complex systems and its application to the photoactivation of a blue light using flavin photoreceptor. J. Phys. Chem. Lett. 2023, 14 (5), 1222–1229. 10.1021/acs.jpclett.2c03797. [DOI] [PMC free article] [PubMed] [Google Scholar]
- Hou C.; Liu Y. J.; Ferré N.; Fang W. H. Understanding bacterial bioluminescence: a theoretical study of the entire process, from reduced flavin to light emission. Chem.—Eur. J. 2014, 20 (26), 7979–7986. 10.1002/chem.201400253. [DOI] [PubMed] [Google Scholar]
- Kowalczyk M.; Sikorska E.; Khmelinskii I. V.; Komasa J.; Insińska-Rak M.; Sikorski M. Spectroscopy and photophysics of flavin-related compounds: isoalloxazines. J. Mol. Struct.: THEOCHEM 2005, 756 (1–3), 47–54. 10.1016/j.theochem.2005.09.005. [DOI] [Google Scholar]
- Giuliani G.; Melaccio F.; Gozem S.; Cappelli A.; Olivucci M. QM/MM investigation of the spectroscopic properties of the fluorophore of bacterial luciferase. J. Chem. Theory Comput. 2021, 17 (2), 605–613. 10.1021/acs.jctc.0c01078. [DOI] [PMC free article] [PubMed] [Google Scholar]
- Su D.; Kabir M. P.; Orozco-Gonzalez Y.; Gozem S.; Gadda G. Fluorescence properties of flavin semiquinone radicals in nitronate monooxygenase. ChemBioChem 2019, 20 (13), 1646–1652. 10.1002/cbic.201900016. [DOI] [PubMed] [Google Scholar]
- Orozco-Gonzalez Y.; Kabir M. P.; Gozem S. Electrostatic spectral tuning maps for biological chromophores. J. Phys. Chem. B 2019, 123 (23), 4813–4824. 10.1021/acs.jpcb.9b00489. [DOI] [PubMed] [Google Scholar]
- Dratch B. D.; Orozco-Gonzalez Y.; Gadda G.; Gozem S. Ionic atmosphere effect on the absorption spectrum of a flavoprotein: a reminder to consider solution ions. J. Phys. Chem. Lett. 2021, 12 (34), 8384–8396. 10.1021/acs.jpclett.1c02173. [DOI] [PubMed] [Google Scholar]
- Kabir M. P.; Ouedraogo D.; Orozco-Gonzalez Y.; Gadda G.; Gozem S. Alternative strategy for spectral tuning of flavin-binding fluorescent proteins. J. Phys. Chem. B 2023, 127 (6), 1301–1311. 10.1021/acs.jpcb.2c06475. [DOI] [PMC free article] [PubMed] [Google Scholar]
- Jacoby Morris K.; Barnard D. T.; Narayanan M.; Byrne M. C.; McBride R. A.; Singh V. R.; Stanley R. J. Comparing ultrafast excited state quenching of flavin 1, N 6-ethenoadenine dinucleotide and flavin adenine dinucleotide by optical spectroscopy and DFT calculations. Photochem. Photobiol. Sci. 2022, 21 (6), 959–982. 10.1007/s43630-022-00187-2. [DOI] [PubMed] [Google Scholar]
- Van Galen C. J.; Pauszek R. F.; Koder R. L.; Stanley R. J. Flavin Charge Redistribution upon Optical Excitation Is Independent of Solvent Polarity. J. Phys. Chem. B 2023, 127 (3), 661–672. 10.1021/acs.jpcb.2c07266. [DOI] [PubMed] [Google Scholar]
- Pauszek R. F.; Kodali G.; Siddiqui M. S. U.; Stanley R. J. Overlapping electronic states with nearly parallel transition dipole moments in reduced anionic flavin can distort photobiological dynamics. J. Am. Chem. Soc. 2016, 138 (45), 14880–14889. 10.1021/jacs.6b06449. [DOI] [PMC free article] [PubMed] [Google Scholar]
- Sayfutyarova E. R.; Hammes-Schiffer S. Constructing molecular π-orbital active spaces for multireference calculations of conjugated systems. J. Chem. Theory Comput. 2019, 15 (3), 1679–1689. 10.1021/acs.jctc.8b01196. [DOI] [PMC free article] [PubMed] [Google Scholar]
- Dittrich M.; Freddolino P. L.; Schulten K. When light falls in LOV: a quantum mechanical/molecular mechanical study of photoexcitation in Phot-LOV1 of Chlamydomonas reinhardtii. J. Phys. Chem. B 2005, 109 (26), 13006–13013. 10.1021/jp050943o. [DOI] [PMC free article] [PubMed] [Google Scholar]
- Salzmann S.; Tatchen J.; Marian C. M. The photophysics of flavins: What makes the difference between gas phase and aqueous solution?. J. Photochem. Photobiol., A 2008, 198 (2–3), 221–231. 10.1016/j.jphotochem.2008.03.015. [DOI] [Google Scholar]
- Salzmann S.; Marian C. M. The photophysics of alloxazine: a quantum chemical investigation in vacuum and solution. Photochem. Photobiol. Sci. 2009, 8 (12), 1655–1666. 10.1039/b9pp00022d. [DOI] [PubMed] [Google Scholar]
- Kar R. K.; Miller A. F.; Mroginski M. A. Understanding flavin electronic structure and spectra. Wiley Interdiscip. Rev.: Comput. Mol. Sci. 2022, 12 (2), e1541 10.1002/wcms.1541. [DOI] [Google Scholar]
- Kar R. K.; Borin V. A.; Ding Y.; Matysik J.; Schapiro I. Spectroscopic Properties of Lumiflavin: A Quantum Chemical Study. Photochem. Photobiol. 2019, 95 (2), 662–674. 10.1111/php.13023. [DOI] [PubMed] [Google Scholar]
- Rieff B.; Bauer S.; Mathias G.; Tavan P. DFT/MM description of flavin IR spectra in BLUF domains. J. Phys. Chem. B 2011, 115 (38), 11239–11253. 10.1021/jp2043637. [DOI] [PubMed] [Google Scholar]
- Wu M.; Eriksson L. A. Absorption Spectra of Riboflavin— A Difficult Case for Computational Chemistry. J. Phys. Chem. A 2010, 114 (37), 10234–10242. 10.1021/jp104127r. [DOI] [PubMed] [Google Scholar]
- Sayfutyarova E. R.; Sun Q.; Chan G. K.; Knizia G. Automated Construction of Molecular Active Spaces from Atomic Valence Orbitals. J. Chem. Theory Comput. 2017, 13 (9), 4063–4078. 10.1021/acs.jctc.7b00128. [DOI] [PubMed] [Google Scholar]
- Bao J. J.; Dong S. S.; Gagliardi L.; Truhlar D. G. Automatic selection of an active space for calculating electronic excitation spectra by MS-CASPT2 or MC-PDFT. J. Chem. Theory Comput. 2018, 14 (4), 2017–2025. 10.1021/acs.jctc.8b00032. [DOI] [PubMed] [Google Scholar]
- Jeong W.; Stoneburner S. J.; King D.; Li R.; Walker A.; Lindh R.; Gagliardi L. Automation of Active Space Selection for Multireference Methods via Machine Learning on Chemical Bond Dissociation. J. Chem. Theory Comput. 2020, 16 (4), 2389–2399. 10.1021/acs.jctc.9b01297. [DOI] [PubMed] [Google Scholar]
- Kaufold B. W.; Chintala N.; Pandeya P.; Dong S. S. Automated Active Space Selection with Dipole Moments. J. Chem. Theory Comput. 2023, 19 (9), 2469–2483. 10.1021/acs.jctc.2c01128. [DOI] [PMC free article] [PubMed] [Google Scholar]
- Stein C. J.; Reiher M. Automated selection of active orbital spaces. J. Chem. Theory Comput. 2016, 12 (4), 1760–1771. 10.1021/acs.jctc.6b00156. [DOI] [PubMed] [Google Scholar]
- Stanton J. F.; Bartlett R. J. The equation of motion coupled-cluster method. A systematic biorthogonal approach to molecular excitation energies, transition probabilities, and excited state properties. J. Chem. Phys. 1993, 98 (9), 7029–7039. 10.1063/1.464746. [DOI] [Google Scholar]
- Krylov A. I. Equation-of-motion coupled-cluster methods for open-shell and electronically excited species: The hitchhiker’s guide to Fock space. Annu. Rev. Phys. Chem. 2008, 59, 433–462. 10.1146/annurev.physchem.59.032607.093602. [DOI] [PubMed] [Google Scholar]
- Rhee Y. M.; Head-Gordon M. Scaled second-order perturbation corrections to configuration interaction singles: Efficient and reliable excitation energy methods. J. Phys. Chem. A 2007, 111 (24), 5314–5326. 10.1021/jp068409j. [DOI] [PubMed] [Google Scholar]
- Kao Y.-T.; Saxena C.; He T.-F.; Guo L.; Wang L.; Sancar A.; Zhong D. Ultrafast dynamics of flavins in five redox states. J. Am. Chem. Soc. 2008, 130 (39), 13132–13139. 10.1021/ja8045469. [DOI] [PMC free article] [PubMed] [Google Scholar]
- North M. A.; Bhattacharyya S.; Truhlar D. G. Improved density functional description of the electrochemistry and structure- property descriptors of substituted flavins. J. Phys. Chem. B 2010, 114 (46), 14907–14915. 10.1021/jp108024b. [DOI] [PubMed] [Google Scholar]
- Kao Y.-T.; Tan C.; Song S.-H.; Öztürk N.; Li J.; Wang L.; Sancar A.; Zhong D. Ultrafast dynamics and anionic active states of the flavin cofactor in cryptochrome and photolyase. J. Am. Chem. Soc. 2008, 130 (24), 7695–7701. 10.1021/ja801152h. [DOI] [PMC free article] [PubMed] [Google Scholar]
- Stein C. J.; Pantazis D. A.; Krewald V. Orbital entanglement analysis of exchange-coupled systems. J. Phys. Chem. Lett. 2019, 10 (21), 6762–6770. 10.1021/acs.jpclett.9b02417. [DOI] [PubMed] [Google Scholar]
- Stein C. J.; Reiher M. autoCAS: A program for fully automated multiconfigurational calculations. J. Comput. Chem. 2019, 40 (25), 2216–2226. 10.1002/jcc.25869. [DOI] [PubMed] [Google Scholar]
- Forsberg N.; Malmqvist P.-Å. Multiconfiguration perturbation theory with imaginary level shift. Chem. Phys. Lett. 1997, 274 (1–3), 196–204. 10.1016/S0009-2614(97)00669-6. [DOI] [Google Scholar]
- Roos B. O.; Andersson K. Multiconfigurational perturbation theory with level shift—the Cr2 potential revisited. Chem. Phys. Lett. 1995, 245 (2–3), 215–223. 10.1016/0009-2614(95)01010-7. [DOI] [Google Scholar]
- Roos B. O.; Andersson K.; Fülscher M. P.; Serrano-Andrés L.; Pierloot K.; Merchán M.; Molina V. Applications of level shift corrected perturbation theory in electronic spectroscopy. J. Mol. Struct.: THEOCHEM 1996, 388, 257–276. 10.1016/s0166-1280(96)80039-x. [DOI] [Google Scholar]
- Ghigo G.; Roos B. O.; Malmqvist P.-Å. A modified definition of the zeroth-order Hamiltonian in multiconfigurational perturbation theory (CASPT2). Chem. Phys. Lett. 2004, 396 (1–3), 142–149. 10.1016/j.cplett.2004.08.032. [DOI] [Google Scholar]
- Zobel J. P.; Nogueira J. J.; Gonzalez L. The IPEA dilemma in CASPT2. Chem. Sci. 2017, 8 (2), 1482–1499. 10.1039/C6SC03759C. [DOI] [PMC free article] [PubMed] [Google Scholar]
- Becke A. D. Density-functional exchange-energy approximation with correct asymptotic behavior. Phys. Rev. A: At., Mol., Opt. Phys. 1988, 38 (6), 3098–3100. 10.1103/PhysRevA.38.3098. [DOI] [PubMed] [Google Scholar]
- Lee C.; Yang W.; Parr R. G. Development of the Colle-Salvetti correlation-energy formula into a functional of the electron density. Phys. Rev. B: Condens. Matter Mater. Phys. 1988, 37 (2), 785–789. 10.1103/PhysRevB.37.785. [DOI] [PubMed] [Google Scholar]
- Yanai T.; Tew D. P.; Handy N. C. A new hybrid exchange-correlation functional using the Coulomb-attenuating method (CAM-B3LYP). Chem. Phys. Lett. 2004, 393 (1–3), 51–57. 10.1016/j.cplett.2004.06.011. [DOI] [Google Scholar]
- Chai J.-D.; Head-Gordon M. Long-range corrected hybrid density functionals with damped atom-atom dispersion corrections. Phys. Chem. Chem. Phys. 2008, 10 (44), 6615–6620. 10.1039/b810189b. [DOI] [PubMed] [Google Scholar]
- Frisch M. e.; Trucks G.; Schlegel H.; Scuseria G.; Robb M.; Cheeseman J.; Scalmani G.; Barone V.; Petersson G.; Nakatsuji H.. Gaussian 16; Gaussian, Inc.: Wallingford, CT, 2016.
- Fdez. Galván I.; Vacher M.; Alavi A.; Angeli C.; Aquilante F.; Autschbach J.; Bao J. J.; Bokarev S. I.; Bogdanov N. A.; Carlson R. K.; et al. OpenMolcas: From source code to insight. J. Chem. Theory Comput. 2019, 15 (11), 5925–5964. 10.1021/acs.jctc.9b00532. [DOI] [PubMed] [Google Scholar]
- Keller S.; Dolfi M.; Troyer M.; Reiher M. An efficient matrix product operator representation of the quantum chemical Hamiltonian. J. Chem. Phys. 2015, 143 (24), 244118. 10.1063/1.4939000. [DOI] [PubMed] [Google Scholar]
- Shao Y.; Gan Z.; Epifanovsky E.; Gilbert A. T.; Wormit M.; Kussmann J.; Lange A. W.; Behn A.; Deng J.; Feng X.; et al. Advances in molecular quantum chemistry contained in the Q-Chem 4 program package. Mol. Phys. 2015, 113 (2), 184–215. 10.1080/00268976.2014.952696. [DOI] [Google Scholar]
- Bayliss N. S.; McRae E. G. Solvent effects in organic spectra: dipole forces and the Franck-Condon principle. J. Phys. Chem. 1954, 58 (11), 1002–1006. 10.1021/j150521a017. [DOI] [Google Scholar]
- Losi A.; Gärtner W. Old chromophores, new photoactivation paradigms, trendy applications: flavins in blue light-sensing photoreceptors. Photochem. Photobiol. 2011, 87 (3), 491–510. 10.1111/j.1751-1097.2011.00913.x. [DOI] [PubMed] [Google Scholar]
- Losi A.; Gärtner W. The evolution of flavin-binding photoreceptors: an ancient chromophore serving trendy blue-light sensors. Annu. Rev. Plant Biol. 2012, 63, 49–72. 10.1146/annurev-arplant-042811-105538. [DOI] [PubMed] [Google Scholar]
- Christie J. M.; Gawthorne J.; Young G.; Fraser N. J.; Roe A. J. LOV to BLUF: flavoprotein contributions to the optogenetic toolkit. Mol. Plant 2012, 5 (3), 533–544. 10.1093/mp/sss020. [DOI] [PubMed] [Google Scholar]
- Conrad K. S.; Manahan C. C.; Crane B. R. Photochemistry of flavoprotein light sensors. Nat. Chem. Biol. 2014, 10 (10), 801–809. 10.1038/nchembio.1633. [DOI] [PMC free article] [PubMed] [Google Scholar]
- Srivastava V.; Singh P. K.; Srivastava A.; Singh P. P. Synthetic applications of flavin photocatalysis: a review. RSC Adv. 2021, 11 (23), 14251–14259. 10.1039/D1RA00925G. [DOI] [Google Scholar]
- König B.; Kümmel S.; Svobodová E.; Cibulka R. Flavin photocatalysis. Phys. Sci. Rev. 2018, 3 (8), 20170168. 10.1515/psr-2017-0168. [DOI] [Google Scholar]
- Cibulka R. Artificial flavin systems for chemoselective and stereoselective oxidations. Eur. J. Org Chem. 2015, 2015 (5), 915–932. 10.1002/ejoc.201403275. [DOI] [Google Scholar]
- Gozem S.; Huntress M.; Schapiro I.; Lindh R.; Granovsky A. A.; Angeli C.; Olivucci M. Dynamic Electron Correlation Effects on the Ground State Potential Energy Surface of a Retinal Chromophore Model. J. Chem. Theory Comput. 2012, 8 (11), 4069–4080. 10.1021/ct3003139. [DOI] [PubMed] [Google Scholar]
- Gozem S.; Melaccio F.; Lindh R.; Krylov A. I.; Granovsky A. A.; Angeli C.; Olivucci M. Mapping the Excited State Potential Energy Surface of a Retinal Chromophore Model with Multireference and Equation-of-Motion Coupled-Cluster Methods. J. Chem. Theory Comput. 2013, 9 (10), 4495–4506. 10.1021/ct400460h. [DOI] [PubMed] [Google Scholar]
- Gozem S.; Krylov A. I.; Olivucci M. Conical Intersection and Potential Energy Surface Features of a Model Retinal Chromophore: Comparison of EOM-CC and Multireference Methods. J. Chem. Theory Comput. 2013, 9 (1), 284–292. 10.1021/ct300759z. [DOI] [PubMed] [Google Scholar]
- Gozem S.; Melaccio F.; Valentini A.; Filatov M.; Huix-Rotllant M.; Ferre N.; Frutos L. M.; Angeli C.; Krylov A. I.; Granovsky A. A.; et al. Shape of multireference, equation-of-motion coupled-cluster, and density functional theory potential energy surfaces at a conical intersection. J. Chem. Theory Comput. 2014, 10 (8), 3074–3084. 10.1021/ct500154k. [DOI] [PubMed] [Google Scholar]
- Huix-Rotllant M.; Filatov M.; Gozem S.; Schapiro I.; Olivucci M.; Ferre N. Assessment of Density Functional Theory for Describing the Correlation Effects on the Ground and Excited State Potential Energy Surfaces of a Retinal Chromophore Model. J. Chem. Theory Comput. 2013, 9 (9), 3917–3932. 10.1021/ct4003465. [DOI] [PubMed] [Google Scholar]
- Xu X.; Gozem S.; Olivucci M.; Truhlar D. G. Combined Self-Consistent-Field and Spin-Flip Tamm-Dancoff Density Functional Approach to Potential Energy Surfaces for Photochemistry. J. Phys. Chem. Lett. 2013, 4 (2), 253–258. 10.1021/jz301935x. [DOI] [PubMed] [Google Scholar]
- Zen A.; Coccia E.; Gozem S.; Olivucci M.; Guidoni L. Quantum Monte Carlo Treatment of the Charge Transfer and Diradical Electronic Character in a Retinal Chromophore Minimal Model. J. Chem. Theory Comput. 2015, 11 (3), 992–1005. 10.1021/ct501122z. [DOI] [PMC free article] [PubMed] [Google Scholar]
- Tuna D.; Lefrancois D.; Wolański Ł.; Gozem S.; Schapiro I.; Andruniów T.; Dreuw A.; Olivucci M. Assessment of approximate coupled-cluster and algebraic-diagrammatic-construction methods for ground-and excited-state reaction paths and the conical-intersection seam of a retinal-chromophore model. J. Chem. Theory Comput. 2015, 11 (12), 5758–5781. 10.1021/acs.jctc.5b00022. [DOI] [PubMed] [Google Scholar]
- Gozem S.; Luk H. L.; Schapiro I.; Olivucci M. Theory and simulation of the ultrafast double-bond isomerization of biological chromophores. Chem. Rev. 2017, 117 (22), 13502–13565. 10.1021/acs.chemrev.7b00177. [DOI] [PubMed] [Google Scholar]
- Marsili E.; Farag M. H.; Yang X.; De Vico L.; Olivucci M. Two-State, Three-Mode Parametrization of the Force Field of a Retinal Chromophore Model. J. Phys. Chem. A 2019, 123 (9), 1710–1719. 10.1021/acs.jpca.8b10010. [DOI] [PMC free article] [PubMed] [Google Scholar]
Associated Data
This section collects any data citations, data availability statements, or supplementary materials included in this article.
Supplementary Materials
Data Availability Statement
The main data from this work are presented in the manuscript and in the Supporting Information. Requests for additional data, including computational models and raw data files, should be directed to S.G. (sgozem@gsu.edu).


