

Abstract
Background:
High body mass index (BMI) is a major risk factor for cancer development, but its impact on the global burden of cancer remains unclear.
Methods:
We estimated global and regional temporal trends in the burden of cancer attributable to high BMI, and the contributions of various cancer types using the framework of the Global Burden of Disease Study.
Results:
From 2010 to 2019, there was a 35 % increase in deaths and a 34 % increase in disability-adjusted life-years from cancers attributable to high BMI. The age-standardized death rates for cancer attributable to high BMI increased over the study period (annual percentage change [APC] +0.48 %, 95 % CI 0.22 to 0.74 %). The greatest number of deaths from cancer attributable to high BMI occurred in Europe, but the fastest-growing age-standardized death rates and disability-adjusted life-years occurred in Southeast Asia. Liver cancer was the fastest-growing cause of cancer mortality (APC: 1.37 %, 95 % CI 1.25 to 1.49 %) attributable to high BMI.
Conclusion:
The global burden of cancer-related deaths attributable to high BMI has increased substantially from 2010 to 2019. The greatest increase in age-standardized death rates occurred in Southeast Asia, and liver cancer is the fastest-growing cause of cancer mortality attributable to high BMI. Urgent and sustained measures are required at a global and regional level to reverse these trends and slow the growing burden of cancer attributed to high BMI.
Keywords: Cancer, Epidemiology, Etiology, Obesity
1. Introduction
High body mass index (BMI) is an established risk factor for cancer [1–5]. Economic growth, urbanization, dietary changes, and physical inactivity have contributed to the massive rise in the prevalence of obesity in the recent decade. [6,7] Nearly one in four adults do not meet the World Health Organization (WHO) recommendations on physical activity. [8] Previous data suggest that an estimated 671 million individuals worldwide are obese, and the prevalence of obesity is projected to increase [9–11].
The prevalence of obesity varies substantially by geographical location, income, and race/ethnicity, contributing to differences in cancer disease burden attributable to high BMI [4,12]. In turn, the contribution of high BMI to cancer disease burden varies substantially by organ system [4]. However, a comprehensive global overview of the burden of cancer attributed to high BMI, by organ, region, sex, and socio-demographic index (SDI) over the last decade has not been reported [13,14]. Herein, we determine temporal trends in mortality, and disability-adjusted life-years (DALYs) due to cancers attributable to high BMI across 204 countries and territories from 2010 to 2019.
2. Methods
2.1. Data source
This study was performed using data from the GBD 2019, a systematic effort to estimate the burden caused by 369 diseases and 87 risk factors in 204 countries/territories [15]. Annual frequencies and age-standardized rates (ASRs) of cancer-related mortality and DALYs attributable to high BMI from 2010 to 2019 by sex, age, region, country, and cancer type were obtained from an online data source, the GlobalHealth Data Exchange (GHDx) query tool (http://ghdx.healthdata.org/gbd-results-tool), which is maintained by ongoing multinational collaboration and coordinated by the Institute for Health Metrics and Evaluation.
2.2. Estimation methods
The general estimation methods for the GBD 2019 and the methods for estimation of cancer disease burden have been previously described [13–15]. Briefly, data were obtained from population-based cancer registries, vital registration systems, or verbal autopsy studies. The GBD 2019 study defined cancer using ICD-10 codes C00 to C96, and ICD-9 codes 140 to 209. A Cause of Death Ensemble model (CODEm), a form of Bayesian geospatial regression analysis, was utilized to estimate mortality by age, sex, location, and year. DALYs were calculated as the sum of years of life lost and years lived with disability [15]. Multiple statistical methods were utilized to minimize data heterogeneity in the estimates, including misclassification correction, garbage code redistribution, and noise reduction algorithms. The GBD study provides a simple quality assessment from 0 to 5 (where a higher score represents higher quality data) to assess the quality of the data provided by each country/territory. Data quality ratings for the causes of death data from each country are available in Supplemental Table 1.
For the analysis of risk factors, GBD 2019 groups 82 separate risk factors into three categories (1) environmental and occupational, (2) behavioral, and (3) metabolic, and the methods of estimation for each risk factor have been detailed in the GBD 2019 risk factors summary paper [16]. Briefly, to estimate the level of exposure, GBD 2019 uses Bayesian meta-regression modeling (DisMod-MR 2.1) to account for risk factors with varied exposure by sex and age groups, or spatiotemporal Gaussian process regression for risk factors with stable exposure across age groups. The population attributable fraction for each risk factor was calculated across age, sex, location, and year, taking into account the risk function, exposure level, and the theoretical minimum risk exposure level. Following this, the burden of cancer attributable to each risk factor was calculated by multiplying the deaths and DALYs by the corresponding population-attributable fraction. We defined high BMI in adults as BMI >20–25 kg/m2, utilizing the definition adopted by the GBD 2019 study [16]. To group countries with similar development status, a Sociodemographic Index (SDI) was used, which combines total fertility rate, average educational attainment in the population over age 15, and measures of income per capita (Supplemental Table 2).
2.3. Data and statistical analysis
Estimates for the frequency of incident cases and deaths were reported with 95 % uncertainty intervals (UIs) as 2.5th and 97.5th ranked values across all 1000 draws from a posterior distribution. Age-standardized rates were derived using the direct method to the GBD 2019 population estimate [15]. The change in any category between 2010 and 2019 was calculated as follows: ((value in 2019 − value in 2010) / value in 2010). For changes in age-standardized rates over time, we calculated annual percent change (APC) and 95 % confidence interval (CI) in age-standardized rates using the Joinpoint Trend Analysis Software, version 5.0.2 (Statistical Research and Applications Branch, National Cancer Institute, Bethesda, MD). Briefly, joinpoint models were fit to trend data starting with the minimum number of joinpoints (i.e. 0 joinpoints or a linear model). Additional joinpoints were added to the model and a test of statistical significance was conducted with the addition of each new joinpoint using Monte Carlo permutation methods to determine if the change in trend was statistically significant [17]. When the annualized rate of change and the lower boundary of its 95 % CI were both positive, this was considered an increasing trend. By contrast, when the annualized rate of change and the upper boundary were negative, this was considered a decreasing trend. All statistical analyses were conducted using RStudio (Version 4.1.1).
3. Results
3.1. Global burden of cancer attributable to high BMI
Globally in 2019, there were 462,545 cancer-related deaths (95 % UI 260,648–718,052), and 11.2 million (95 % UI 6.4 million – 17.3 million) cancer-related DALYs attributable to high BMI. In 2019, the estimated cancer-related age-standardized death rate (ASDR) and age-standardized DALYs (ASDALYs) attributable to high BMI were 5.69 per 100,000 (95 % UI 3.12–8.83) and 133.93 per 100,000 (95 % UI 76.19–206.81) respectively (Tables 1–2, Fig. 1A–D). Between 2010 and 2019, there was a 35 % increase in cancer-related deaths and a 34 % increase in DALYs attributable to high BMI. Over this period, both the ASDR and ASDALYs attributable to high BMI increased, with APCs of 0.48 % (95 % CI 0.22 to 0.74 %) and 0.49 % (95 % CI 0.32 to 0.67 %) respectively (Tables 1–2).
Table 1.
Summary of cancer-related deaths and age-standardized death rates attributable to high body mass index (BMI) in 2010 and 2019.
| 2010 Deaths (95 % UI) | 2010 ASDR, per 100,000 (95 % UI) |
2019 Deaths (95 % UI) | 2019 ASDR, per 100,000 (95 % UI) |
APC (95 % CI) | p | |
|---|---|---|---|---|---|---|
| Overall | 341,225 (187,908 to 535,549) | 5.48 (3.02 to 8.59) | 462,545 (260,648 to 718,052) | 5.69 (3.21 to 8.83) | 0.48 (0.22 to 0.74) | <0.001 |
| By sex | ||||||
| Female | 170,150 (99,028 to 260,577) | 5.06 (2.95 to 7.76) | 226,272 (136,254 to 339,629) | 5.15 (3.1 to 7.73) | 0.23 (−0.01 to 0.48) | 0.065 |
| Male | 171,075 (82,617 to 288,862) | 5.92 (2.85 to 10.03) | 236,273 (119,681 to 389,332) | 6.29 (3.17 to 10.4) | 0.64 (0.44 to 0.85) | <0.001 |
| By cancer type | ||||||
| Breast | 30,898 (11,693 to 56,827) | 0.52 (0.20 to 0.94) | 45,203 (18,772 to 81,168) | 0.55 (0.23 to 0.99) | 0.73 (0.66 to 0.80) | <0.001 |
| Colon and rectum | 62,872 (33,167 to 101,076) | 1.02 (0.54 to 1.64) | 85,882 (46,847 to 136,520) | 1.07 (0.58 to 1.70) | 0.46 (0.23 to 0.70) | <0.001 |
| Esophageal | 69,600 (20,050 to 137,394) | 1.10 (0.32 to 2.17) | 89,904 (27,879 to 171,255) | 1.09 (0.34 to 2.10) | −0.03 (−0.27 to 0.21) | 0.805 |
| Gallbladder and biliary tract | 20,144 (10,183 to 33,416) | 0.33 (0.17 to 0.55) | 26,127 (13,865 to 42,566) | 0.33 (0.17 to 0.53) | −0.16 (−0.28 to −0.03) | 0.013 |
| Kidney | 23,833 (13,723 to 35,924) | 0.38 (0.22 to 0.58) | 31,705 (18,430 to 47,285) | 0.39 (0.23 to 0.59) | 0.21 (0.11 to 0.30) | 0.001 |
| Leukemia | 16,752 (7778 to 29,031) | 0.27 (0.12 to 0.46) | 21,734 (10,508 to 37,035) | 0.27 (0.13 to 0.46) | 0.12 (0.06 to 0.18) | 0.002 |
| Liver | 42,335 (16,283 to 83,225) | 0.66 (0.25 to 1.29) | 60,799 (24,239 to 114,624) | 0.74 (0.29 to 1.39) | 1.37 (1.25 to 1.49) | <0.001 |
| Multiple myeloma | 5842 (2519 to 10,436) | 0.10 (0.04 to 0.17) | 8019 (3519 to 14,152) | 0.10 (0.04 to 0.18) | 0.50 (0.45 to 0.55) | <0.001 |
| Non-Hodgkin lymphoma | 10,103 (4197 to 18,418) | 0.16 (0.07 to 0.29) | 13,797 (5807 to 24,534) | 0.17 (0.07 to 0.30) | 0.58 (0.52 to 0.65) | <0.001 |
| Ovarian | 4703 (143 to 10,814) | 0.07 (0.00 to 0.17) | 6309 (177 to 14,309) | 0.08 (0.00 to 0.17) | 0.44 (0.21 to 0.67) | <0.001 |
| Pancreatic | 22,095 (8140 to 41,827) | 0.36 (0.13 to 0.68) | 31,921 (11,964 to 59,676) | 0.40 (0.15 to 0.74) | 1.06 (0.97 to 1.15) | <0.001 |
| Thyroid | 3406 (1625 to 5796) | 0.05 (0.03 to 0.09) | 4660 (2294 to 7891) | 0.06 (0.03 to 0.10) | 0.63 (0.57 to 0.69) | <0.001 |
| Uterine | 28,641 (18,972 to 39,137) | 0.46 (0.31 to 0.63) | 36,486 (25,131 to 49,165) | 0.45 (0.31 to 0.61) | −0.29 (−0.43 to −0.15) | 0.001 |
| By geographical region | ||||||
| Africa | 12,777 (6913 to 20,249) | 3.73 (2.01 to 5.94) | 19,582 (11,197 to 30,396) | 4.27 (2.43 to 6.60) | 1.50 (1.33 to 1.67) | <0.001 |
| Eastern Mediterranean | 15,104 (8848 to 22,885) | 5.02 (2.94 to 7.62) | 23,654 (14,597 to 35,000) | 5.79 (3.52 to 8.64) | 1.61 (1.50 to 1.72) | <0.001 |
| Europe | 118,150 (71,401 to 173,927) | 8.40 (5.09 to 12.35) | 137,785 (84,140 to 200,614) | 8.45 (5.16 to 12.21) | 0.09 (−0.05 to 0.24) | 0.173 |
| Americas | 77,136 (47,516 to 110,665) | 7.73 (4.76 to 11.08) | 102,949 (63,218 to 145,843) | 7.99 (4.92 to 11.31) | 0.36 (0.30 to 0.42) | <0.001 |
| South-East Asia | 24,635 (12,356 to 41,310) | 1.94 (0.95 to 3.28) | 44,516 (24,161 to 70,075) | 2.59 (1.40 to 4.12) | 3.33 (3.23 to 3.44) | <0.001 |
| Western Pacific | 92,138 (35,068 to 175,461) | 4.48 (1.70 to 8.56) | 132,255 (57,077 to 239,576) | 4.86 (2.10 to 8.83) | 0.95 (0.73 to 1.18) | <0.001 |
| By sociodemographic index | ||||||
| High | 117,274 (68,233 to 176,776) | 7.48 (4.37 to 11.25) | 144,296 (84,668 to 214,562) | 7.53 (4.43 to 11.14) | 0.08 (−0.09 to 0.26) | 0.351 |
| High-Middle | 110,145 (62,800 to 168,738) | 6.85 (3.90 to 10.48) | 140,755 (80,565 to 216,755) | 6.89 (3.93 to 10.61) | 0.02 (−0.29 to 0.32) | 0.921 |
| Middle | 83,475 (41,313 to 142,566) | 4.54 (2.23 to 7.80) | 124,990 (65,521 to 203,064) | 5.03 (2.64 to 8.24) | 1.15 (0.99 to 1.31) | <0.001 |
| Low-Middle | 22,588 (11,037 to 38,061) | 2.25 (1.10 to 3.82) | 39,285 (21,048 to 63,302) | 2.92 (1.56 to 4.72) | 2.98 (2.76 to 3.2) | <0.001 |
| Low | 7550 (3466 to 13,541) | 2.01 (0.91 to 3.61) | 12,951 (6553 to 21,492) | 2.56 (1.28 to 4.28) | 2.72 (2.64 to 2.8) | <0.001 |
Abbreviations: ASDR – age-standardized death rates; APC – annual percentage change; CI – confidence interval; UI – uncertainty interval.
P-values <0.05 were indicated in bold.
Table 2.
Summary of cancer-related disability-adjusted life years (DALYs) and age-standardized DALYs attributable to high body mass index (BMI) in 2010 and 2019.
| 2010 DALYs (95 % UI) | 2010 ASDALY, per 100,000 (95 % UI) |
2019 DALYs (95 % UI) | 2019 ASDALY, per 100,000 (95 % UI) |
APC (95 % CI) | p | |
|---|---|---|---|---|---|---|
| Overall | 8,358,586 (4,678,182 to 13,089,341) | 127.85 (71.42 to 200.31) | 11,175,310 (6,355,934 to 17,263,735) | 133.93 (76.19 to 206.81) | 0.49 (0.32 to 0.67) | <0.001 |
| By sex | ||||||
| Female | 3,905,970 (2,285,891 to 5,972,510) | 114.95 (67.42 to 175.55) | 5,164,089 (3,126,664 to 7,686,541) | 117.76 (71.34 to 175.00) | 0.23 (0.06 to 0.41) | 0.008 |
| Male | 4,452,617 (2,172,876 to 7,510,654) | 141.08 (68.62 to 237.79) | 6,011,221 (3,091,708 to 9,904,242) | 150.73 (77.13 to 247.49) | 0.71 (0.51 to 0.90) | <0.001 |
| By cancer type | ||||||
| Breast | 628,853 (179,376 to 1,228,550) | 10.37 (3.24 to 19.80) | 958,187 (305,774 to 1,822,234) | 11.22 (3.53 to 21.43) | 0.82 (0.75 to 0.90) | <0.001 |
| Colon and rectum | 1,496,189 (803,354 to 2,396,288) | 22.97 (12.30 to 36.69) | 2,021,536 (1,121,762 to 3,184,394) | 24.41 (13.52 to 38.55) | 0.65 (0.44 to 0.85) | <0.001 |
| Esophageal | 1,752,758 (511,547 to 3,476,065) | 26.54 (7.67 to 52.61) | 2,202,314 (681,901 to 4,173,080) | 26.27 (8.12 to 49.89) | −0.14 (−0.37 to 0.10) | 0.248 |
| Gallbladder and biliary tract | 441,287 (225,307 to 724,673) | 6.84 (3.49 to 11.24) | 567,745 (305,643 to 923,010) | 6.86 (3.69 to 11.17) | 0.00 (−0.13 to 0.14) | 0.974 |
| Kidney | 575,342 (334,161 to 864,878) | 8.8 (5.08 to 13.22) | 751,888 (443,680 to 1,114,601) | 9.05 (5.33 to 13.42) | 0.36 (0.08 to 0.63) | 0.01 |
| Leukemia | 463,287 (212,409 to 806,306) | 6.9 (3.17 to 12.01) | 584,093 (287,664 to 992,775) | 7.10 (3.49 to 12.09) | 0.30 (0.19 to 0.41) | <0.001 |
| Liver | 1,142,125 (434,719 to 2,229,421) | 17.03 (6.50 to 33.12) | 1,613,279 (629,258 to 3,049,780) | 19.24 (7.56 to 36.41) | 1.47 (1.33 to 1.62) | <0.001 |
| Multiple myeloma | 132,297 (58,193 to 236,462) | 2.05 (0.90 to 3.66) | 179,766 (80,343 to 318,117) | 2.17 (0.97 to 3.84) | 0.61 (0.50 to 0.72) | <0.001 |
| Non-Hodgkin lymphoma | 264,088 (109,677 to 482,511) | 3.99 (1.66 to 7.27) | 355,582 (151,960 to 632,933) | 4.30 (1.83 to 7.66) | 0.87 (0.74 to 1.00) | <0.001 |
| Ovarian | 125,456 (3834 to 286,919) | 1.88 (0.00 to 4.30) | 167,921 (4671 to 380,293) | 2.00 (0.00 to 4.54) | 0.74 (0.56 to 0.91) | <0.001 |
| Pancreatic | 497,107 (175,842 to 960,406) | 7.67 (2.76 to 14.77) | 709,449 (255,911 to 1,325,365) | 8.54 (3.09 to 15.99) | 1.19 (1.10 to 1.29) | <0.001 |
| Thyroid | 94,828 (45,389 to 161,075) | 1.42 (0.68 to 2.42) | 127,590 (63,807 to 214,075) | 1.54 (0.77 to 2.57) | 0.83 (0.69 to 0.96) | <0.001 |
| Uterine | 744,969 (494,176 to 1,016,257) | 11.38 (7.54 to 15.50) | 935,961 (642,880 to 1,255,462) | 11.22 (7.71 to 15.03) | −0.16 (−0.29 to −0.02) | 0.028 |
| By geographical region | ||||||
| Africa | 342,291 (185,090 to 543,119) | 88.54 (48.06 to 139.91) | 522,369 (297,392 to 807,118) | 100.33 (57.34 to 155.39) | 1.41 (1.21 to 1.61) | <0.001 |
| Eastern Mediterranean | 416,550 (243,981 to 626,949) | 123.48 (72.43 to 186.78) | 649,179 (400,269 to 959,084) | 140.31 (86.66 to 207.21) | 1.44 (1.33 to 1.54) | <0.001 |
| Europe | 2,605,792 (1,586,002 to 3,801,394) | 194.39 (118.27 to 282.89) | 2,956,093 (1,827,384 to 4,253,837) | 194.24 (119.94 to 279.88) | 0.05 (−0.12 to 0.21) | 0.541 |
| Americas | 1,820,078 (1,143,008 to 2,577,753) | 182.64 (114.78 to 258.6) | 2,380,914 (1,479,107 to 3,328,866) | 188.10 (117.06 to 263.22) | 0.35 (0.28 to 0.41) | <0.001 |
| South-East Asia | 710,472 (365,453 to 1,172,542) | 50.66 (25.98 to 84.24) | 1,231,360 (679,766 to 1,929,390) | 66.81 (36.69 to 104.84) | 3.13 (2.97 to 3.29) | <0.001 |
| Western Pacific | 2,431,838 (950,619 to 4,566,339) | 112.09 (43.70 to 210.88) | 3,392,377 (1,464,324 to 6,039,868) | 123.05 (53.18 to 218.90) | 0.99 (0.76 to 1.22) | <0.001 |
| By sociodemographic index | ||||||
| High | 2,550,299 (1,511,745 to 3,807,587) | 173.85 (103.50 to 258.08) | 3,047,581 (1,811,076 to 4,473,419) | 174.68 (104.29 to 254.86) | 0.02 (−0.10 to 0.13) | 0.809 |
| High-Middle | 2,689,727 (1,542,401 to 4,137,002) | 163.27 (93.65 to 251.06) | 3,366,032 (1,937,369 to 5,148,837) | 164.54 (94.43 to 251.91) | 0.04 (−0.28 to 0.36) | 0.826 |
| Middle | 2,286,258 (1,147,413 to 3,869,675) | 113.50 (56.77 to 191.81) | 3,342,671 (1,780,447 to 5,357,551) | 126.04 (66.81 to 202.79) | 1.17 (1.03 to 1.30) | <0.001 |
| Low-Middle | 615,748 (303,419 to 1,048,106) | 55.93 (27.47 to 94.89) | 1,051,070 (565,436 to 1,672,630) | 72.76 (39.06 to 116.03) | 3.01 (2.81 to 3.21) | <0.001 |
| Low | 211,763 (96,979 to 377,497) | 50.38 (23.23 to 89.68) | 361,356 (185,054 to 594,460) | 64.16 (32.79 to 105.68) | 2.77 (2.64 to 2.90) | <0.001 |
Abbreviations: DALYs - disability-adjusted life years; ASDALY – age-standardized DALYs; APC – annual percentage change; CI – confidence interval; UI – uncertainty interval.
Fig. 1.
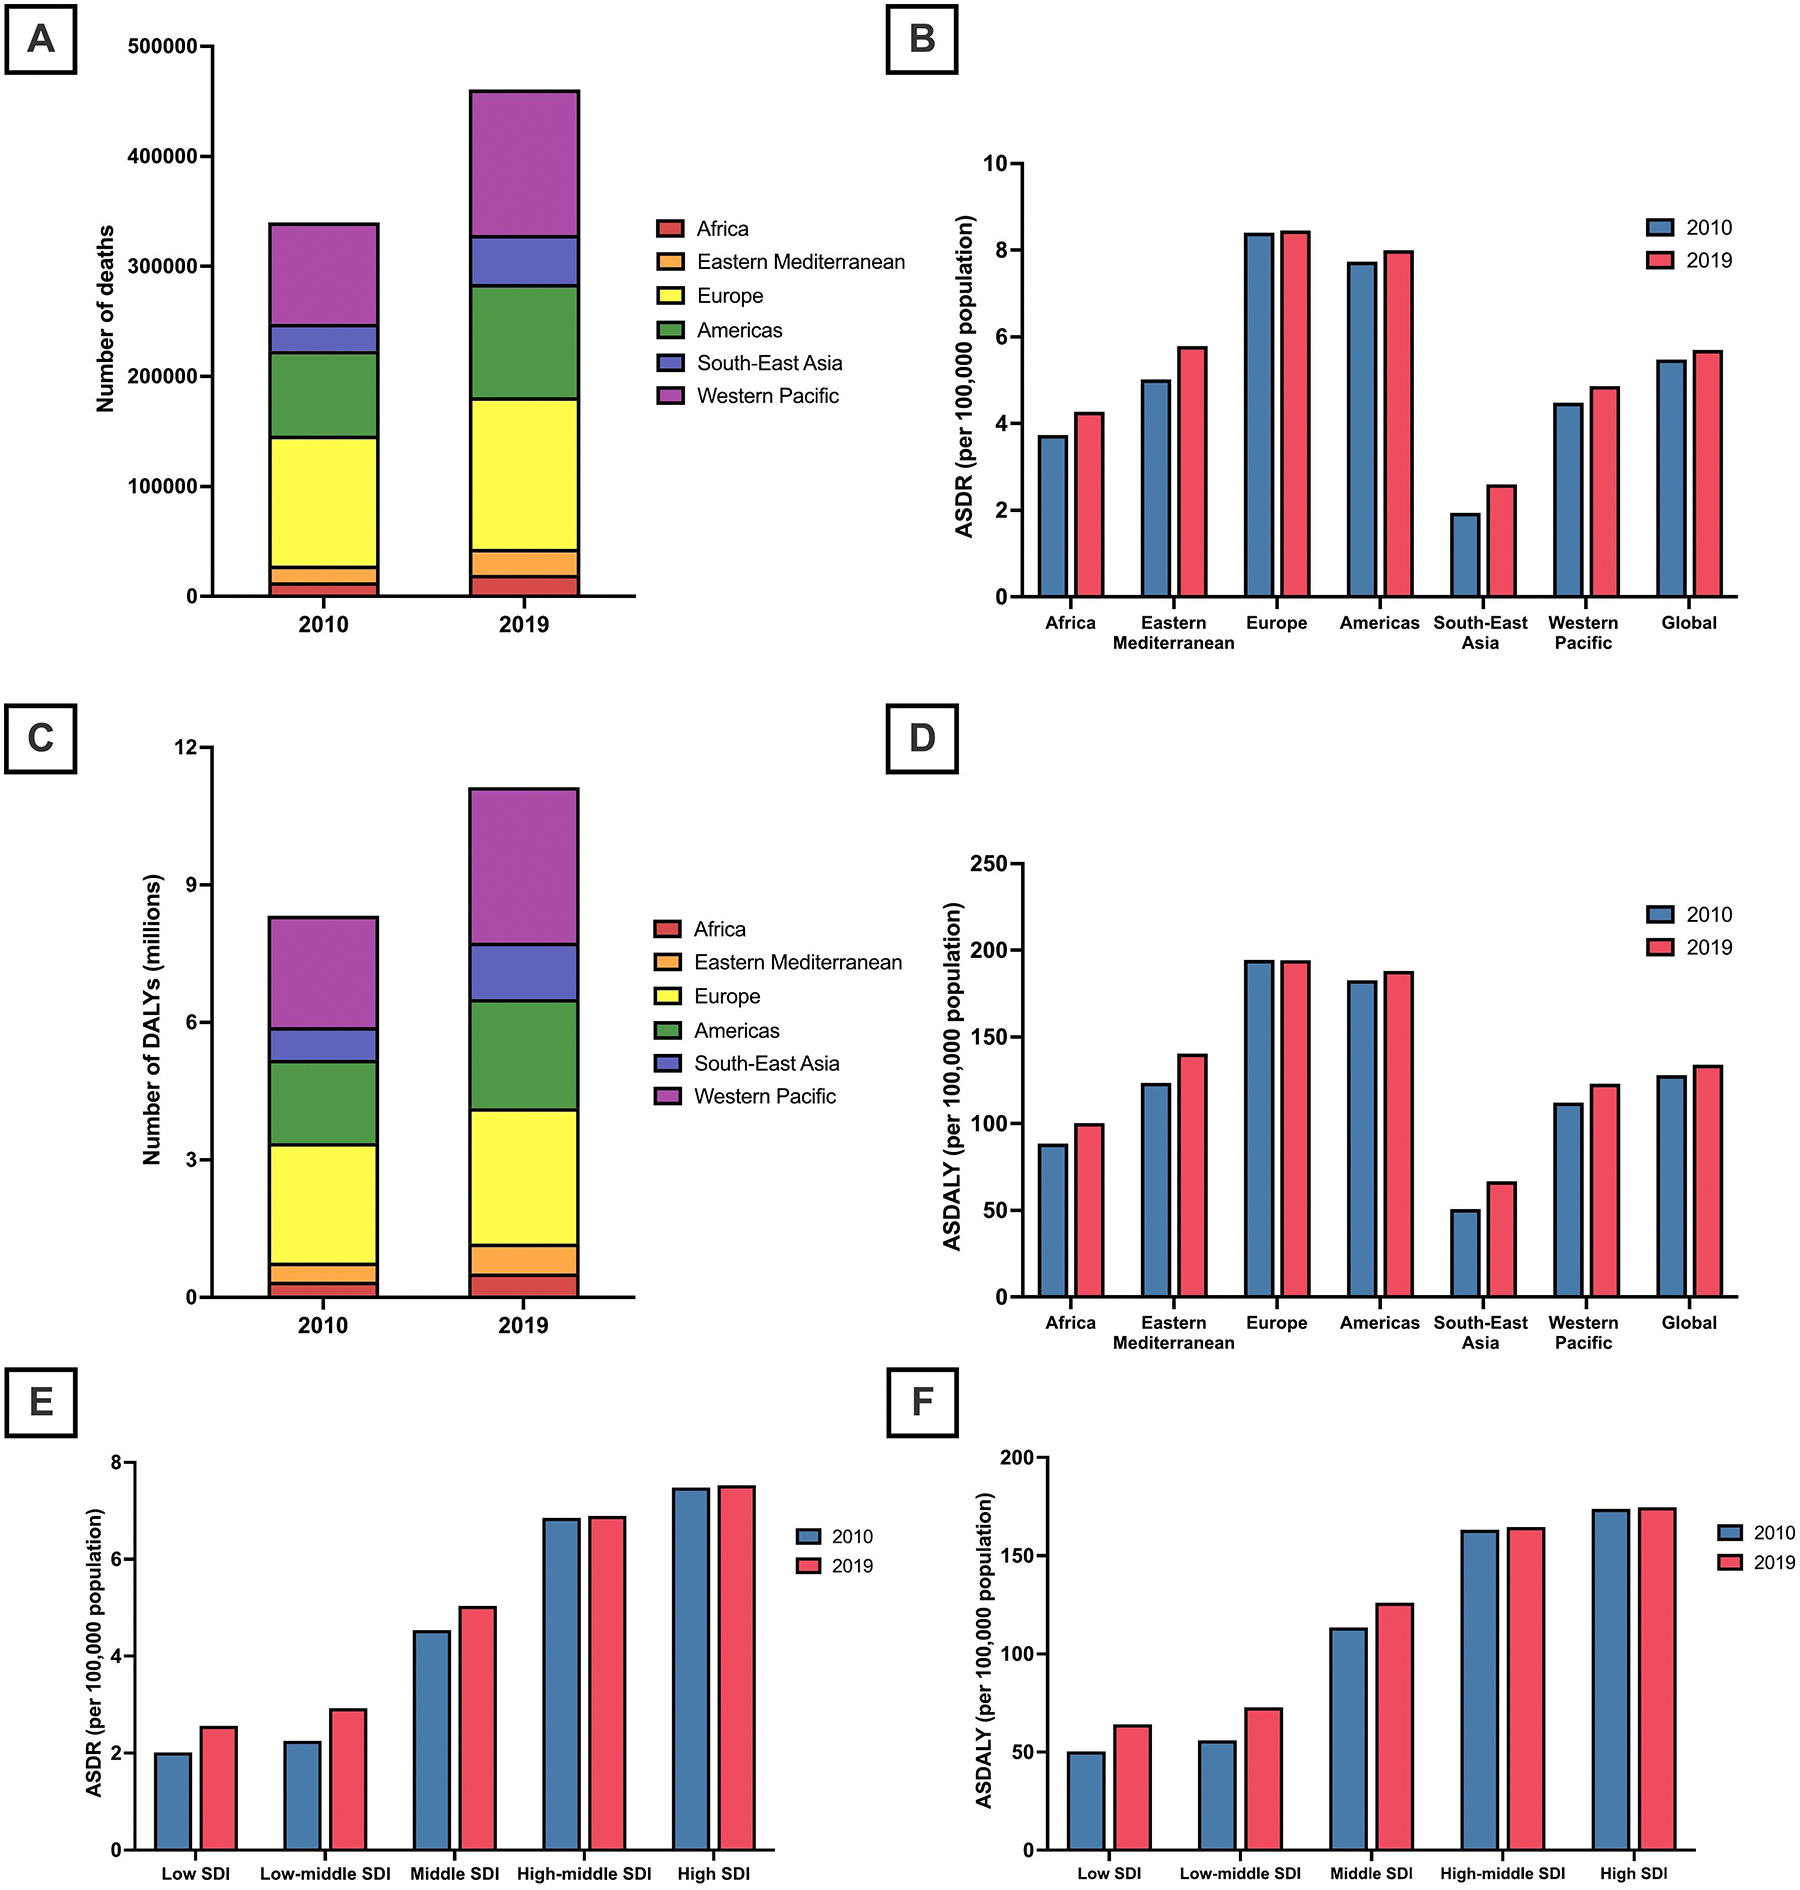
(A) Number of cancer-related deaths attributable to high body mass index in 2010 and 2019; by World Health Organization (WHO) region.
(B) Cancer-related age-standardized death rates (ASDRs) attributable to high body mass index in 2010 and 2019; by World Health Organization (WHO) region.
(C) Number of cancer-related disability-adjusted life years (DALYs) attributable to high body mass index (BMI) in 2010 and 2019; by World Health Organization (WHO) region.
(D) Cancer-related age-standardized DALYs (ASDALYs) attributable to high body mass index in 2010 and 2019; by World Health Organization (WHO) region.
(E) Cancer-related age-standardized death rates (ASDRs) attributable to high body mass index in 2010 and 2019; by socio-demographic index.
(F) Cancer-related age-standardized DALYs (ASDALYs) attributable to high BMI in 2010 and 2019; by socio-demographic index.
3.2. The burden of cancer attributable to high BMI, by sex
In 2019, there were 226,272 cancer-related deaths (95 % UI 136254–339,629), and 5.2 million (95 % UI 3.1 million – 7.7 million) cancer-related DALYs attributable to high BMI in females, compared to 236,273 deaths (95 % UI 119,681–389,332), and 6.0 million (95 % UI 3.1 million – 9.9 million) DALYs in males (Tables 1–2, Supplemental Material 3–4). Between 2010 and 2019, there was a 38 % increase in cancer-related deaths attributable to high BMI in males, compared to 33 % in females. Cancer-related DALYs attributable to high BMI increased by 35 % in males versus 32 % in females. In the same period, both ASDRs (APC: 0.64 %, 95 % CI 0.44 to 0.85 %) and ASDALYs (APC: 0.71 %, 95 % CI 0.51 to 0.90 %) increased in male patients, while ASDRs remained stable (APC: 0.23 %, 95 % CI − 0.01 to 0.48 %) and ASDALYs increased (APC: 0.23 %, 95 % CI 0.06 to 0.41 %) in female patients.
3.3. The burden of cancer attributable to high BMI, by World Health Organization region
The frequency of cancer deaths, DALYs, as well as rates (ASDR and ASDALYs) attributable to high BMI by the World Health Organization (WHO) region are summarized in Tables 1 and 2. In 2019, Europe had the highest frequency of cancer-related deaths attributable to high BMI (n = 137,785), and the Western Pacific had the highest cancer-related DALYs attributable to high BMI (3.4 million) (Fig. 1A, C). However, from 2010 to 2019, the greatest percentage increase in cancer deaths (+81 %) and DALYs (+73 %) attributable to high BMI was in Southeast Asia.
During the same period, cancer ASDRs attributable to high BMI increased in all WHO regions, except in Europe where they remained stable, with the greatest increase in Southeast Asia (APC: 3.33 %, 95 % CI 3.23 to 3.44 %) (Fig. 1B, D). Similarly, ASDALYs increased in all WHO regions between 2010 and 2019, except in Europe where they remained stable, with the greatest increase also noted in Southeast Asia (APC: 3.13 %, 95 % CI 2.97 to 3.29 %).
3.4. The burden of cancer attributable to high BMI, by country
The cancer ASDRs and ASDALYs attributable to high BMI in 2019 by country are shown in Fig. 2A and B. ASDRs ranged from 1.16 deaths per 100,000 (95 % UI 0.47–2.30) in Bangladesh to 25.93 deaths per 100,000 (95 % UI 12.43–44.91) in Mongolia. ASDALYs ranged from 30.19 per 100,000 (95 % UI 12.84–58.41) in Bangladesh to 611.78 per 100,000 (95 % UI 289.74–1059.54) in Mongolia.
Fig. 2.

(A) Cancer-related age-standardized death rates (ASDRs) attributable to high body mass index in 2019; by country/territory.
(B) Cancer-related age-standardized DALYs (ASDALYs) attributable to high body mass index in 2019; by country/territory.
3.5. The burden of cancer attributable to high BMI, by sociodemographic index
The number of cancer deaths and DALYs, as well as ASIR and ASDR attributable to high BMI by SDI, are summarized in Tables 1 and 2. In 2019, the highest frequency of cancer deaths (n = 144,296) and DALYs (3.4 million) attributable to high BMI were in high and high-middle SDI countries respectively. However, the greatest percentage increase in the number of deaths (+74 %) and DALYs (+71 %) between 2010 and 2019 occurred in low-middle SDI countries. Between 2010 and 2019, both ASDRs and ASDALYs increased in middle, low-middle, and low-SDI countries, with the greatest increase in ASDRs (APC: 2.98 %, 95 % CI 2.76 to 3.20 %) and ASDALYs (APC: 3.01 %, 95 % CI 2.81 to 3.21 %) occurring in low-middle SDI countries (Fig. 1E, F). In contrast, cancer ASDRs and ASDALYs attributable to high BMI remained stable in high and high-middle SDI countries.
3.6. The burden of cancer attributable to high BMI, by cancer type
The frequency of cancer deaths, DALYs, and rates (ASDRs and ASDALYs) attributable to high BMI stratified by cancer type are summarized in Tables 1 and 2. In 2019, the largest number of cancer deaths (n = 89,904) and DALYs (2.2 million) attributable to high BMI were due to esophageal cancer. In 2019, esophageal cancer and colorectal cancer each accounted for 19 % of the global cancer deaths attributable to high BMI, followed by liver (13 %), breast (10 %), uterine (8 %), pancreatic (7 %), kidney (7 %), gallbladder and biliary tract (6 %), leukemia (5 %), non-Hodgkin lymphoma (3 %), multiple myeloma (2 %), ovarian (1 %), and thyroid (1 %) cancer (Fig. 3A). In 2019, esophageal cancer accounted for the largest number of cancer DALYs attributable to high BMI (19 %), followed by colon and rectum (18 %), liver (14 %), breast (9 %), uterine (8 %), kidney (7 %), pancreatic (6 %), leukemia (5 %), gallbladder and biliary tract (5 %), non-Hodgkin lymphoma (3 %), multiple myeloma (2 %), ovarian (2 %), and thyroid cancer (1 %) (Fig. 3C). Globally from 2010 and 2019, breast cancer was the fastest-growing cause of cancer deaths (+46 %) and DALYs (+53 %) attributable to high BMI.
Fig. 3.

(A) Number of cancer-related deaths attributable to high body mass index in 2010 and 2019; stratified by cancer type.
(B) Cancer-related age-standardized death rates (ASDRs) attributable to high body mass index in 2010 and 2019; by cancer type.
(C) Number of cancer-related disability-adjusted life years (DALYs) attributable to high body mass index in 2010 and 2019; by cancer type.
(D) Cancer-related age-standardized DALYs (ASDALYs) attributable to high body mass index in 2010 and 2019; by cancer type.
(E) Cancer-related age-standardized death rates (ASDRs) attributable to high body mass index in 2019; by sex cancer type.
(F) Cancer-related age-standardized DALYs (ASDALYs) attributable to high body mass index in 2019; by sex and cancer type.
From 2010 to 2019, the fastest-growing cause of cancer ASDR attributed to high BMI was liver cancer (APC: 1.37 %, 95 % CI 1.25 to 1.49 %) (Fig. 3B). Cancer ASDRs attributable to high BMI decreased in gallbladder and biliary tract cancer (APC: − 0.16 %, 95 % CI − 0.28 to − 0.03 %), and uterine cancer (APC: − 0.29 %, 95 % CI − 0.43 % to − 0.15 %), remained stable in esophageal cancer, and increased in all other cancer types. Between 2010 and 2019, ASDALYs attributable to high BMI decreased in uterine cancer (APC: − 0.16 %, 95 % CI − 0.29 to − 0.02 %), remained stable in esophageal, gallbladder, and biliary tract cancer, and increased in all remaining cancer types, with the highest rate of increase noted in liver cancer (APC: 1.47 %, 95 % CI 1.33 %–1.62 %) (Fig. 3D).
4. Discussion
4.1. Main findings
An elevated BMI remains closely associated with the risk of cancer. Utilizing the GBD data, there were an estimated 463,000 cancer-related deaths and 11.2 million cancer-related DALYs attributable to high BMI in 2019. From 2010 to 2019, there was a 35 % increase in deaths and a 34 % increase in DALYs from cancers attributable to high BMI, and was accompanied by a significant rise in age-adjusted mortality (APC: 0.5 %) and DALYs (APC: 0.5 %). Despite the greatest number of cancer-related deaths attributable to high BMI occurring in countries with high and high-middle SDI, ASDRs remained stable from 2010 to 2019 in those countries. By contrast, the greatest increases in ASDRs occurred in countries with low-middle (APC: 3.0 %). and low SDI (APC: 2.7 %). These data highlight the rapidly growing burden of cancers attributable to high BMI in developing countries which is a byproduct of urbanization, the increasing mechanization of agriculture, and greater consumption of processed carbohydrates and highly processed foods [18].
Although the greatest number of cancer deaths attributable to high BMI in 2019 occurred in Europe, ASDRs in Europe remained stable from 2010 to 2019. By contrast, ASDRs of cancer deaths attributable to high BMI rose in all other World regions, with the sharpest rise occurring in Southeast Asia (APC: 3.3 %), in line with the rapidly rising prevalence of obesity in that region [19]. In 2019, the greatest number of cancer deaths attributed to high BMI were due to esophageal cancer (n = 90,000), followed by colorectal cancer (n = 86,000) and liver cancer (n = 61,000). From 2010 to 2019, liver cancer was the fastest-growing cause of age-adjusted cancer deaths attributable to high BMI, contributed by the rapid rise of nonalcoholic fatty liver disease-related liver cancer, followed by pancreatic cancer (APC 1.1 %) and breast cancer (APC 0.7 %) [20–22].
4.2. In context with current literature
A recent study determined that high BMI is the third leading risk factor for cancer deaths (DALYs) [13]. Several studies have described an increase in cancers related to high BMI, such as colorectal, breast, kidney, stomach, uterus, endometrial, and pancreas, but these were limited to cancers of specific organ types [23–32]. The current study builds upon these data and provides a comprehensive global overview of the temporal trends in the burden of cancer attributable to high BMI by cancer type, region, sex, and SDI in the recent decade, evaluating the impact of the increasing global prevalence of obesity on cancer burden [33,34].
4.3. Implications for clinical care and research
These data highlight the growing burden of cancer attributable to high BMI and serve as a call to action to increase measures to combat obesity, particularly in emerging countries. In certain countries, a sugar tax has been implemented to discourage the intake of sugar-sweetened beverages and processed products low in nutritional quality which has further gained support from the WHO [35]. While the longitudinal effects of these regulations remain to be measured, the resultant higher prices have been found to reduce demand [36]. Additionally, early intervention programs should also be implemented in early childhood to promote physical activity and a healthy diet [37]. Schools in particular should aim to provide nutritionally balanced meals with fewer processed foods to promote healthy behaviors [38]. Importantly, efforts should also be made to reduce the burden in low-middle and low SDI countries which are most affected by the growing obesity epidemic and its associated risk with cancer. In addition, genetic risk variants play an important role in the risk of cancers, and further research may be required to determine the joint association between environmental, metabolic, and genetic risk factors and the risk of cancer development. A global effort should set in motion resources and education to reduce the burden of obesity to provide equal care to all. With the prevalence of obesity projected to increase sharply in the next decade, sustained and coordinated measures to promote dietary changes, encourage exercise, and improve nutritional awareness are required at a global and regional level to reverse the global trends in obesity [11,33].
4.4. Limitations
Our study shares the limitations of the GBD 2019 study. Data was dependent on the quality of each country’s vital registry and modeling was utilized where data was lacking, potentially introducing bias into the estimates. In countries with poorer access to care and diagnostics, there may also have been substantial underreporting and underdiagnosis of cancer cases. The GBD 2019 study does not provide detailed information on the specific type of liver cancer, such as hepatocellular carcinoma or cholangiocarcinoma. While the GBD 2019 study defined high BMI in adults as BMI >20–25 kg/m2 [16,39], we acknowledge that cut-points for high BMI vary by race and ethnicity [40,41]. Sensitivity analysis using the established cut-points in different geographical regions could not be conducted due to a paucity of data in the GBD 2019 study, which could have resulted in an underestimation of the burden of cancer attributable to high BMI especially in Asian countries. Detailed subgroup analyses by specific BMI cut-points were also not possible due to the lack of granularity in the data available in GBD 2019 and further studies are required to determine the burden of cancer attributable to specific thresholds of BMI, including underweight individuals.
4.5. Conclusion
The global burden of cancer-related deaths attributable to high BMI has increased substantially from 2010 to 2019 and cancer-related deaths attributable to high BMI are on a rapid rise in Southeast Asia, low- and low-middle SDI countries. Liver cancer is the fastest-growing cause of cancer mortality attributable to high BMI and urgent measures are therefore required at a global level to reduce the growing burden of obesity and its consequences on the socio-economic burden associated with worsening health outcomes and increased cancer risk.
Supplementary Material
Acknowledgements
The figures of world maps were created by using mapchart.net.
Funding statement
No external funding was received for this study. This research did not receive any specific grant from funding agencies in the public, commercial, or not-for-profit sectors.
Declaration of competing interest
Rohit Loomba: receives funding support from NIEHS (5P42ES010337), NCATS (5UL1TR001442), NIDDK (U01DK130190, U01DK061734, R01DK106419, P30DK120515, R01DK121378, R01DK124318), and NHLBI (P01HL147835). RL serves as a consultant to Aardvark Therapeutics, Altimmune, Anylam/Regeneron, Amgen, Arrowhead Pharmaceuticals, AstraZeneca, Bristol-Myer Squibb, CohBar, Eli Lilly, Galmed, Gilead, Glympse bio, Hightide, Inipharma, Intercept, Inventiva, Ionis, Janssen Inc., Madrigal, Metacrine, Inc., NGM Biopharmaceuticals, Novartis, Novo Nordisk, Merck, Pfizer, Sagimet, Theratechnologies, 89 bio, Terns Pharmaceuticals and Viking Therapeutics. In addition, his institutions received research grants from Arrowhead Pharmaceuticals, Astrazeneca, Boehringer-Ingelheim, Bristol-Myers Squibb, Eli Lilly, Galectin Therapeutics, Galmed Pharmaceuticals, Gilead, Intercept, Hanmi, Intercept, Inventiva, Ionis, Janssen, Madrigal Pharmaceuticals, Merck, NGM Biopharmaceuticals, Novo Nordisk, Merck, Pfizer, Sonic Incytes and Terns Pharmaceuticals. Co-founder of LipoNexus Inc.
KG Yeoh: receive research grants from Singapore Ministry of Health’s National Medical Research Council (MOH-OFLCG18May-0003) and A*STAR (IAF-ICP I2101E0012). He is a member of the Scientific Advisory Board of MiRXES in an honorary capacity and receives no personal payments.
Daniel Q Huang: receives funding support from the Singapore Ministry of Health’s National Medical Research Council under its NMRC Research Training Fellowship (MOH-000595–01). In addition, he has served as an advisory board member for Gilead.
Christos S. Mantzoros: CSM reports grants through his institution from Merck, Massachusetts Life Sciences Center and Boehringer Ingellheim, has been a shareholder of and has received grants through his Institution and personal consulting fees from Coherus Inc. and AltrixBio, he reports personal consulting fees from Novo Nordisk, reports personal consulting fees and support with research reagents from Ansh Inc., collaborative research support from LabCorp Inc., reports personal consulting fees from Genfit, Lumos, Amgen, Corcept, Intercept, 89 Bio, Madrigal and Regeneron, reports educational activity meals through his institution or national conferences from Esperion, Merck, Boehringer Ingelheim and travel support and fees from TMIOA, Elsevier, and the Cardio Metabolic Health Conference. None is related to the work presented herein.
Cheng Han Ng: CHN has served as a consultant to Boxer Capital.
All other authors do not have any conflicts of interest.
Abbreviations:
- DALYs
disability-adjusted life years
- ASDR
age-standardized death rate
- SDI
socio-demographic index
Footnotes
CRediT authorship contribution statement
All authors approve the final version of the manuscript, including the authorship list and agree to be accountable for all aspects of the work in ensuring that questions related to the accuracy or integrity of any part of the work are appropriately investigated and resolved. All authors have read and approved the final version of the manuscript for submission.
Darren Jun Hao Tan: Conceptualization, Data curation, Formal Analysis, Writing, original draft, Cheng Han Ng: Conceptualization, Data curation, Formal analysis, Writing, original draft, Mark Muthiah: conceptualization, Data curation, Formal analysis, Writing, original draft, Jie Ning Yong: Data curation, Formal analysis, Writing, review and editing, Douglas Chee: Data curation, Formal analysis, Writing, review and editing, Margaret Teng: Data curation, Formal analysis, Writing, review and editing, Zhen Yu Wong: Data curation, Formal analysis, Writing, review and editing, Rebecca Wenling Zeng: Data curation, Formal analysis, Writing, review and editing, Yip Han Chin: Data curation, Formal analysis, Writing, review and editing, Jiong-Wei Wang: Data curation, Formal analysis, Writing, review and editing, Pojsakorn Danpanichkul: Data curation, Formal analysis, Writing, review and editing, Ruveena Bhavani Rajaram: Supervision, Validation, Writing, review and editing, Ramanuj DasGupta: Supervision, Validation, Writing, review and editing, Hiroyuki Suzuki: Supervision, Validation, Writing, review and editing, Hirokazu Takahashi: Supervision, Validation, Writing, review and editing, Nobuharu Tamaki: Supervision, Validation, Writing, review and editing, Yock Young Dan: Supervision, Validation, Writing, review and editing, Rashid Lui: Supervision, Validation, Writing, review and editing, Ajay Duseja: Supervision, Validation, Writing, review and editing, Mohammad Shadab Siddiqui: Supervision, Validation, Writing, review and editing, Khay Guan Yeoh: Supervision, Validation, Writing, review and editing, Arun Sanyal: Supervision, Validation, Writing, review and editing, Karn Wijarnpreecha: Supervision, Validation, Writing, review and editing, Rohit Loomba: Supervision, Validation, Writing, review and editing, Christos Socrates Mantzoros: Supervision, Validation, Writing, review and editing, Daniel Huang: Conceptualization, Supervision, Validation, Writing, review and editing.
Appendix A. Supplementary data
Supplementary data to this article can be found online at https://doi.org/10.1016/j.metabol.2023.155744.
Data availability
Data from the Global Burden of Disease (GBD) study in 2019 can be accessed using the GlobalHealth Data Exchange (GHDx) query tool (http://ghdx.healthdata.org/gbd-results-tool) which is maintained by the Institute for Health Metrics and Evaluation.
References
- [1].Calle EE, Kaaks R. Overweight, obesity and cancer: epidemiological evidence and proposed mechanisms. Nat Rev Cancer 2004;4(8):579–91. [DOI] [PubMed] [Google Scholar]
- [2].Clinton SK, Giovannucci EL, Hursting SD. The World Cancer Research Fund/American Institute for Cancer Research third expert report on diet, nutrition, physical activity, and cancer: impact and future directions. J Nutr 2020;150(4): 663–71. [DOI] [PMC free article] [PubMed] [Google Scholar]
- [3].De Pergola G, Silvestris F. Obesity as a major risk factor for cancer. J Obes 2013; 2013:291546. [DOI] [PMC free article] [PubMed] [Google Scholar]
- [4].Lauby-Secretan B, Scoccianti C, Loomis D, Grosse Y, Bianchini F, Straif K. Body fatness and cancer — viewpoint of the IARC working group. N Engl J Med 2016; 375(8):794–8. [DOI] [PMC free article] [PubMed] [Google Scholar]
- [5].Dalamaga M, Diakopoulos KN, Mantzoros CS. The role of adiponectin in cancer: a review of current evidence. Endocr Rev 2012;33(4):547–94. [DOI] [PMC free article] [PubMed] [Google Scholar]
- [6].Popkin BM, Adair LS, Ng SW. Global nutrition transition and the pandemic of obesity in developing countries. Nutr Rev 2012;70(1):3–21. [DOI] [PMC free article] [PubMed] [Google Scholar]
- [7].Trends in adult body-mass index in 200 countries from 1975 to 2014: a pooled analysis of 1698 population-based measurement studies with 19·2 million participants. Lancet 2016;387(10026):1377–96. [DOI] [PMC free article] [PubMed] [Google Scholar]
- [8].Global action plan on physical activity 2018–2030: more active people for a healthier world. Geneva: World Health Organization; 2018. [Google Scholar]
- [9].Ng M, Fleming T, Robinson M, et al. Global, regional, and national prevalence of overweight and obesity in children and adults during 1980–2013: a systematic analysis for the Global Burden of Disease Study 2013. Lancet 2014;384(9945): 766–81. [DOI] [PMC free article] [PubMed] [Google Scholar]
- [10].Worldwide trends in body-mass index, underweight, overweight, and obesity from 1975 to 2016: a pooled analysis of 2416 population-based measurement studies in 128·9 million children, adolescents, and adults. Lancet 2017;390(10113):2627–42. [DOI] [PMC free article] [PubMed] [Google Scholar]
- [11].Ward ZJ, Bleich SN, Cradock AL, et al. Projected U.S. state-level prevalence of adult obesity and severe obesity. N Engl J Med 2019;381(25):2440–50. [DOI] [PubMed] [Google Scholar]
- [12].Arnold M, Pandeya N, Byrnes G, et al. Global burden of cancer attributable to high body-mass index in 2012: a population-based study. Lancet Oncol 2015;16(1): 36–46. [DOI] [PMC free article] [PubMed] [Google Scholar]
- [13].Tran KB, Lang JJ, Compton K, et al. The global burden of cancer attributable to risk factors, 2010–19: a systematic analysis for the Global Burden of Disease Study 2019. Lancet 2022;400(10352):563–91. [DOI] [PMC free article] [PubMed] [Google Scholar]
- [14].Collaboration GBoDC. Cancer incidence, mortality, years of life lost, years lived with disability, and disability-adjusted life years for 29 cancer groups from 2010 to 2019: a systematic analysis for the global burden of disease study 2019. JAMA Oncol 2022;8(3):420–44. [DOI] [PMC free article] [PubMed] [Google Scholar]
- [15].Global burden of 369 diseases and injuries in 204 countries and territories, 1990–2019: a systematic analysis for the Global Burden of Disease Study 2019. Lancet (London, England) 2020;396(10258):1204–22. [DOI] [PMC free article] [PubMed] [Google Scholar]
- [16].Murray CJL, Aravkin AY, Zheng P, et al. Global burden of 87 risk factors in 204 countries and territories, 1990–2019: a systematic analysis for the Global Burden of Disease Study 2019. Lancet 2020;396(10258):1223–49. [DOI] [PMC free article] [PubMed] [Google Scholar]
- [17].Kim HJ, Fay MP, Feuer EJ, Midthune DN. Permutation tests for joinpoint regression with applications to cancer rates. Stat Med 2000;19(3):335–51. [DOI] [PubMed] [Google Scholar]
- [18].Bixby H, Bentham J, Zhou B, et al. Rising rural body-mass index is the main driver of the global obesity epidemic in adults. Nature 2019;569(7755):260–4. [DOI] [PMC free article] [PubMed] [Google Scholar]
- [19].Ranasinghe P, Mathangasinghe Y, Jayawardena R, Hills AP, Misra A. Prevalence and trends of metabolic syndrome among adults in the asia-pacific region: a systematic review. BMC Public Health 2017;17(1):101. [DOI] [PMC free article] [PubMed] [Google Scholar]
- [20].Huang DQ, Singal AG, Kono Y, Tan DJH, El-Serag HB, Loomba R. Changing global epidemiology of liver cancer from 2010 to 2019: NASH is the fastest growing cause of liver cancer. Cell Metab 2022;34(7):969–977.e962. [DOI] [PMC free article] [PubMed] [Google Scholar]
- [21].Huang DQ, Terrault NA, Tacke F, et al. Global epidemiology of cirrhosis — aetiology, trends and predictions. Nat Rev Gastroenterol Hepatol 2023. [DOI] [PMC free article] [PubMed] [Google Scholar]
- [22].Huang DQ, El-Serag HB, Loomba R. Global epidemiology of NAFLD-related HCC: trends, predictions, risk factors and prevention. Nat Rev Gastroenterol Hepatol 2021;18(4):223–38. [DOI] [PMC free article] [PubMed] [Google Scholar]
- [23].Liu L, Habeshian TS, Zhang J, et al. Differential trends in rising endometrial cancer incidence by age, race, and ethnicity. JNCI Cancer Spectr 2023;7(1). [DOI] [PMC free article] [PubMed] [Google Scholar]
- [24].Tavakkoli A, Pruitt SL, Hoang AQ, et al. Ethnic disparities in early-onset gastric cancer: a population-based study in Texas and California. Cancer Epidemiol Biomarkers Prev 2022;31(9):1710–9. [DOI] [PMC free article] [PubMed] [Google Scholar]
- [25].Tavakkoli A, Singal AG, Waljee AK, et al. Racial disparities and trends in pancreatic cancer incidence and mortality in the United States. Clin Gastroenterol Hepatol 2020;18(1):171–178.e110. [DOI] [PubMed] [Google Scholar]
- [26].Stoffel EM, Murphy CC. Epidemiology and mechanisms of the increasing incidence of colon and rectal cancers in young adults. Gastroenterology 2020;158(2):341–53. [DOI] [PMC free article] [PubMed] [Google Scholar]
- [27].Scott OW, Tin Tin S, Bigby SM, Elwood JM. Rapid increase in endometrial cancer incidence and ethnic differences in New Zealand. Cancer Causes Control 2019;30 (2):121–7. [DOI] [PubMed] [Google Scholar]
- [28].Palumbo C, Pecoraro A, Rosiello G, et al. Renal cell carcinoma incidence rates and trends in young adults aged 20–39 years. Cancer Epidemiol 2020;67:101762. [DOI] [PubMed] [Google Scholar]
- [29].Kvåle R, Myklebust T, Engholm G, Heinävaara S, Wist E, Møller B. Prostate and breast cancer in four Nordic countries: a comparison of incidence and mortality trends across countries and age groups 1975–2013. Int J Cancer 2017;141(11): 2228–42. [DOI] [PubMed] [Google Scholar]
- [30].di Martino E, Smith L, Bradley SH, et al. Incidence trends for twelve cancers in younger adults—a rapid review. Br J Cancer 2022;126(10):1374–86. [DOI] [PMC free article] [PubMed] [Google Scholar]
- [31].Larsson SC, Spyrou N, Mantzoros CS. Body fatness associations with cancer: evidence from recent epidemiological studies and future directions. Metabolism 2022;137:155326. [DOI] [PubMed] [Google Scholar]
- [32].Avgerinos KI, Spyrou N, Mantzoros CS, Dalamaga M. Obesity and cancer risk: emerging biological mechanisms and perspectives. Metabolism 2019;92:121–35. [DOI] [PubMed] [Google Scholar]
- [33].Malik VS, Willet WC, Hu FB. Nearly a decade on — trends, risk factors and policy implications in global obesity. Nat Rev Endocrinol 2020;16(11):615–6. [DOI] [PMC free article] [PubMed] [Google Scholar]
- [34].Abarca-Gómez L, Abdeen ZA, Hamid ZA, et al. Worldwide trends in body-mass index, underweight, overweight, and obesity from 1975 to 2016: a pooled analysis of 2416 population-based measurement studies in 128·9 million children, adolescents, and adults. Lancet 2017;390(10113):2627–42. [DOI] [PMC free article] [PubMed] [Google Scholar]
- [35].Popkin BM, Ng SW. Sugar-sweetened beverage taxes: lessons to date and the future of taxation. PLoS Med 2021;18(1):e1003412. [DOI] [PMC free article] [PubMed] [Google Scholar]
- [36].Andreyeva T, Marple K, Marinello S, Moore TE, Powell LM. Outcomes following taxation of sugar-sweetened beverages: a systematic review and meta-analysis. JAMA Netw Open 2022;5(6):e2215276. [DOI] [PMC free article] [PubMed] [Google Scholar]
- [37].Taghizadeh S, Farhangi MA. The effectiveness of pediatric obesity prevention policies: a comprehensive systematic review and dose–response meta-analysis of controlled clinical trials. J Transl Med 2020;18(1):480. [DOI] [PMC free article] [PubMed] [Google Scholar]
- [38].Miyawaki A, Lee JS, Kobayashi Y. Impact of the school lunch program on overweight and obesity among junior high school students: a nationwide study in Japan. J Public Health (Oxf) 2019;41(2):362–70. [DOI] [PMC free article] [PubMed] [Google Scholar]
- [39].Vos T, Lim SS, Abbafati C, et al. Global burden of 369 diseases and injuries in 204 countries and territories, 1990–2019: a systematic analysis for the Global Burden of Disease Study 2019. Lancet 2020;396(10258):1204–22. [DOI] [PMC free article] [PubMed] [Google Scholar]
- [40].Pan WH, Yeh WT. How to define obesity? Evidence-based multiple action points for public awareness, screening, and treatment: an extension of Asian-Pacific recommendations. Asia Pac J Clin Nutr 2008;17(3):370–4. [PubMed] [Google Scholar]
- [41].Appropriate body-mass index for Asian populations and its implications for policy and intervention strategies. Lancet 2004;363(9403):157–63. [DOI] [PubMed] [Google Scholar]
Associated Data
This section collects any data citations, data availability statements, or supplementary materials included in this article.
Supplementary Materials
Data Availability Statement
Data from the Global Burden of Disease (GBD) study in 2019 can be accessed using the GlobalHealth Data Exchange (GHDx) query tool (http://ghdx.healthdata.org/gbd-results-tool) which is maintained by the Institute for Health Metrics and Evaluation.